Application of Coastal Resilience Metrics at Panama City Beach, Florida
Publication: Journal of Waterway, Port, Coastal, and Ocean Engineering
Volume 149, Issue 5
Abstract
Coastal resilience is the ability of a system to prepare, resist, recover, and adapt to achieve functional performance under adverse events such as storms and sea-level changes. Usually, previously developed metrics are applied to quantify the resistance portion of coastal resilience, which supports the preparation and adaptation portions. Recent research produced a GIS-based tool that provides a quantitative coastal resilience metric to inform decisions related to protection from coastal storm impacts and to evaluate the success of past management actions. Other research developed a forward-looking metric that uses Beach-fx results to calculate future resilience based on nourishment alternatives. This study, for the first time, combines the Coastal Engineering Resilience Index (CERI) and Buffer Width (BW) metrics to better understand the historic, current, and future resilience of the coastal system at Panama City Beach, Florida. After the construction of the US Army Corps of Engineers Coastal Storm Risk Management (CSRM) project at Panama City Beach, the CERI resilience metric has increased up to 21.3%, while negative storm impacts in the same have been less than 8%. The frequency of nourishment efforts moving forward is justified by a 24.3% increase in the BW metric when comparing cases that are nourished frequently with cases that are not nourished frequently. Moreover, there is a 129.2% increase in the BW metric when comparing the frequently nourished cases with the cases that are nourished only on an emergency basis. While the CERI and BW metrics have both been considered previously, their combined application provides an understanding of a broader temporal view of how storm events, CSRM projects, and nourishments have played a part in the resilience of the system at Panama City Beach over the last two decades and how they may play a role in the next half century.
Introduction
According to the United Nations, 40% of the world’s population lives within 100 km of the ocean (SEDAC 2011). These coastal communities must develop strategies that balance the risks associated with natural hazards such as tropical and extratropical storms, sea-level rise, and tsunamis with the economic push to increase development for achieving commercial, residential, and recreational goals. Techniques to quantify the coast’s ability to resist damage from natural hazards are critical for inclusion into an overall understanding of the coast’s resilience. This research investigates current and alternate beach nourishment options and their relationship with resilience by utilizing the Coastal Engineering Resilience Index (CERI) and Buffer Width (BW) metrics together to track the beach’s ability to historically resist storms and compare future profile alternatives, an objective that would not be possible without the combination of the metrics.
The term resilience is often attributed to the performance of coastal engineering projects, varying from traditional hard engineering to nature-based solutions, with resilience defined as “the ability for a system to prepare for, resist, recover, and adapt to achieve functional performance under the stress of both natural hazards and human related disturbances through time” (Bridges et al. 2015). The North Atlantic Coast Comprehensive Study (NACCS) that presented this definition considered other definitions of resilience and concluded that most studies include those four key stages (prepare, resist, recover, and adapt) (USACE 2015). Resilience is considered to increase whenever the capacity of at least one of these four stages increases. Coastal storm risk management (CSRM) projects are designed to reduce coastal storm damage risk. This reduction in coastal storm damage risk can be linked to an increase in the “resist” portion of resilience due to additional preparation and therefore increases resilience on the whole. While the goal of CSRM projects is to increase the resist portion of resilience, they directly influence the prepare and adapt portions as well. Total coastal resilience requires a holistic approach that accounts for all four interdependent portions of resilience and considers more than the physical shoreline characteristics to include the social, economic, and environmental systems (Bruneau et al. 2003; Linkov et al. 2014; Logan et al. 2022).
Previous studies developed other metrics to measure portions of resilience, such as the baseline resilience indicators for communities (Cutter et al. 2010), a probabilistic-based resilience metric that relies on robustness and rapidity (Schultz et al. 2012), community self-assessment (Bridges et al. 2015), and the fragility curve model (Janssen and Miller 2022). However, none of these examples calculate a quantitative metric in the coastal environment based on the morphology and forcing factors—an engineering resilience. Rosati et al. (2015) developed multiple methods to incorporate different levels of expert and data-driven assessment and noted the need to establish a range of metrics and critical measurements needed to monitor the performance of and design infrastructure for coastal systems. This range of metrics and measurements would need to encompass the entirety of resilience, starting at the initial state of the system and its response to an adverse event.
Like most resilience metrics that quantify a portion of the total coastal resilience, the metrics applied in this study are built on a foundation of methods to calculate the ability of a system to resist an adverse event to support the design of CSRM projects. The CERI metric developed by Dong et al. (2018) (originally named the Coastal Resilience Index, CRI) and the BW metric developed by Durkin and Chambers (2019) both provide quantitative metrics that are able to monitor the performance of infrastructure and morphology for coastal systems and their ability to resist storm damage. The historical nature of the CERI tool and the forward-looking nature of the BW metric provide coastal scientists a temporal view of the morphologic resilience at a location. Pendleton et al. (2010) used an index-based assessment to quantify the likelihood of physical changes based on a number of variables, especially considering sea- and lake-level changes. The assessment found that 99% of the variability in their index was explained by just four variables: geomorphology, regional coastal slope, water-level change rate, and mean significant wave height. This analysis highlights the importance of morphologic factors that both CERI and BW metrics consider. This study ties these metrics together to display their individual strengths and benefits of the metrics working together, especially in regard to beach nourishment efforts and coastal storm damage risk reduction. Beach and dune nourishment efforts in the coastal environment are one of the primary ways that resilience can be increased at a location: by increasing the cross-shore distance and/or height of the dune between the infrastructure and the shoreline, storm impacts on the infrastructure are reduced. Before 1990, coastal protection was commonly managed with a “hard” engineering strategy (dams, reinforcements, and acceptance of beach erosion). After 1990, the mentality changed to maintain the coast by nourishing it with sand mined offshore and is applied whenever the coastline appears to be retreating beyond a predefined setback line (Slobbe et al. 2012). Additionally, beaches can be nourished by beneficially using dredged sediment from navigation projects (McFall et al. 2021). Sand beaches commonly require periodic nourishments to compensate for erosion, and nourishment is the principal technique used in the United States (Elko et al. 2021).
While previous research focuses on quantitatively defining resilience in the coastal environment, little work has been done to analyze the impact of nourishment project alternatives on resilience as it relates to storm impact reduction and morphology. The aforementioned CERI and BW metrics are affected by both beach nourishments and coastal storm impacts. They are combined in this study to provide coastal scientists with a path to consider how the resilience of coastal sites changes due to nourishment and storm impacts by determining the beach’s ability to resist coastal damage. As the leading form of coastal protection in the United States for the last four decades (Armstrong et al. 2016), beach nourishment needs to be linked to resilience, and these metrics provide a first step to do so through the linking of the morphology and anticipated storm waves and water levels.
The CERI is based on various morphologic features in the beach profile, as shown in Fig. 1. In the example site shown by Dong et al. (2018) at Delray Beach, Florida, CERI values were compared alongshore from transect to transect within the same timeframe as well as between individual transects spanning decades. The CERI metric is calculated by summing five nondimensional parameters:where a = protective elevation (PE) factor; b = volume density (VD) factor; c = protective width (PW) factor; d = surge vulnerability (CF) factor; and e = wave runup (WR) factor. The PE factor (a) indicates the average height of the dune and berm and is calculated as follows:where PE = protective elevation; and PE0 = characteristic protective elevation that is constant. The VD factor (b) indicates the volume density of the berm and dune and is calculated as follows:where PW = protective width; s = percentage of fine sediment; and PW0 = characteristic protective width that is constant. The PW factor (c) indicates the actual protective width during a storm event and is calculated as follows:where MR = maximum shoreline recession rate. The CF factor (d) indicates the vulnerability to storm surge and over wash and is calculated as follows:where DE = frontal dune crest elevation; MS = maximum storm surge; MHW = mean high water mark as specified by the user; and CF0 = characteristic crest freeboard that is constant. The WR factor (e) indicates the vulnerability to wave over wash and is calculated as follows:where WR0 = characteristic wave runup that is constant; and WR = wave runup as calculated by the Stockdon equation for wave runup (Stockdon et al. 2006).
(1)
(2)
(3)
(4)
(5)
(6)

Dong et al. (2018) compared CERI values over time (from 1973 to 2016) and showed an increase in resilience of the morphology at Delray Beach, especially relating to the system’s ability to resist coastal storm impacts. Using the time series of the CERI from historical beach conditions, the metric at Delray Beach was grouped in three categories: low (CERI < 1.5), medium (1.5 < CERI < 2), and high (CERI > 2). With these categories, potential “problem areas” may be identified and a more in-depth study conducted on the location prioritized for management action.
While the CERI is useful to analyze historical resilience trends as they relate to storm response, Durkin and Chambers (2019) use the BW to quantify the coastal resistance that can be applied to historical or future nourishment strategies. This metric is defined as the sum of the dune width, frontal dune slope, and berm width along a profile, as displayed in Fig. 1.
The BW metric emphasizes the functionality of dune and beach nourishment projects to buffer community infrastructure from storm-induced damage (Durkin and Chambers 2019). Similar to the CERI metric, it also focuses on the morphology of the location and the ability for the system to resist adverse events such as storm impacts. The parameters to calculate the BW metric are conveniently the output of the U.S. Army Corps of Engineers–certified planning model, Beach-fx. Beach-fx is used to evaluate the economic benefits and physical performance of CSRM projects (Rogers et al. 2009). The study makes comparisons between the projects by simulating multiple nourishment strategies within Beach-fx such that future alternatives can be compared.
The parameters required to calculate the CERI and the BW metrics can be seen in Fig. 1. Both metrics use the size of morphological features to quantify the beach’s ability to resist storm events and determine the impact of beach nourishment that either has taken place there historically (in the case of the CERI metric) or might take place there in the future (in the case of the BW metric) to be analyzed. Both metrics also uniquely include storm information, with the CERI using historical storm data and the BW metric using beach response to a suite of synthetic storms from a Monte Carlo life cycle simulation in Beach-fx. Therefore, the combination of these metrics at a location is a unique way to consider coastal resilience relating specifically to beach nourishment efforts and storm impacts.
The combination and comparison of these metrics provide a comprehensive picture of the relationship between both historical and future nourishment strategies to mitigate the risks from coastal disasters at a site. The combination of these metrics has not been previously studied, and this paper provides a framework for engineers to consider both past nourishments and future nourishment alternatives using morphological features to quantify the coast’s ability to resist storm damage, which can lead to improved preparation and future adaptation.
Study Site
Panama City Beach (PCB), Florida, shown in Fig. 2, is approximately 30 km long and lies between the entrance of St. Andrew Bay and Phillips Inlet. Panama City Beach was incorporated in 1977, at which time the shoreline was straight and averaged about 26 m in width (Saloman 1976), and the dune elevations ranged from 3.0 to 4.5 m above mean sea level (Wilson 1975). Two sandbars were also noted, with the first ranging from 15 to 60 m offshore and the second approximately 245 m offshore (Saloman 1976). Like many beaches worldwide, these dunes, berms, and sandbars are the main protecting features for the infrastructure that has been built over the last four decades. In addition, previous work by Roberts and Wang (2012) considered the quantification of various beach nourishment projects located in west-central Florida and noted the importance of considering longshore sediment transport in low-wave-energy environments, because longshore transport and tidal-inlet processes can influence sediment availability and the effectiveness of nourishment efforts.

Fig. 2. Map view of the study site of Panama City Beach, Florida.
(Map © Bay County, FDEP, Esri, HERE, Garmin, SafeGraph, GeoTechnologies, Inc., METI/NASA, USGS, EPA, NPS, USDA, CONANP, Esri, Garmin, FAO, NOAA, EPA.)
While Panama City Beach provides year-round tropical temperatures, it is also subject to hurricane events as a Gulf Coast beach. Since 1851, records indicate that 18 hurricanes have passed within 40 km of the beach, six of which were named, with Hurricane Eloise (1975, Category 3 Saffir-Simpson) and Hurricane Michael (2018, Category 5 Saffir-Simpson) being the highest category storms in the last 50 years (NOAA 2022a). After Hurricane Eloise in 1975 and the rapid development in the years following, nourishment projects were recommended for the beach. The nourishment design parameters were a dune width of 7.6 m, dune crest elevation of 3.6 m, berm width of 9.1 m, and berm crest elevation of 2.1 m (Saloman 1976). Over 3 × 10⁶ m3 of sediment was needed initially for this design, with suggested nourishments of almost 700,000 m3 every decade.
The original Water Resources Development Act (WRDA) of 1986 for Panama City Beach provided a nourishment design parameter for a taller and wider dune but a narrower berm: with a dune width of 9.1 m at a 4.42 m NAVD88 elevation, a berm crest width of 7.6 m at a 2 m NAVD88 elevation, and a slope of 1–18 (vertical to horizontal) (USACE 2019). The dune tops were stabilized with vegetation under the WRDA plan. A 1996 reevaluation report presented a 15.2 m wide beach berm at 2.1 m elevation for the large eastern reach of the beach and a taper down to a 9.1 m width berm on the western reach of the beach. The reevaluation report’s plan (known as the Locally Preferred Plan or LPP) was constructed in 1998 and 1999 with renourishments recommended at 5-year intervals. The volume placed as a part of the original construction was 4.9 × 10⁶ m3.
Since the original LPP construction, multiple storms and nourishment efforts have impacted the Panama City Beach. The 2004 storm season had Hurricane Ivan, making landfall in Gulf Shores, AL (approximately 195 km from Panama City Beach) as a Category 3 storm. The 2005 storm season had Hurricane Dennis that impacted the Panama City Beach area directly as a Category 3 storm. A project impact report (PIR) for Panama City Beach details emergency response nourishment of 841,000 m3 in 2005/2006 to repair storm impacts (USACE 2019). A localized nourishment for 1.6 km of shoreline was conducted in 2011. A major nourishment for a much larger length of beach was conducted in 2017, placing over 720,000 m3 of sediment (USACE 2019). The original length of the project was 28.2 km, with future nourishments planned to cover the eastern 26.6 km in 2044 and the western 1.6 km of the project in 2049.
After Hurricane Michael impacted the area in 2018, a PIR was created in 2019, which noted that the total project cost to restore the project is estimated at $26,205,000 (FY2019 Price Level), without mobilization and demobilization costs. Additionally, approximately 501,550 m3 of material was lost at the project due to Hurricane Michael, which was more than half of what had been placed the year before (USACE 2019). The PIR concluded that an emergency nourishment was economically justified (based on project cost to restore versus the original cost of the project) to receive federal funding and was completed in 2022.
Sea-level rise (SLR) also affects the study location, with the relative sea-level rate trend equaling 0.49 m of rise per century since 1989 with a 95% confidence interval of plus or minus 0.95 mm/year (NOAA 2022b). Panama City Beach has an MHW value of 0.238 m NAVD88 and a mean low water of −0.143 m NAVD88, with a mean sea level of 0.039 m NAVD88 (NOAA 2022c). These factors show that, much like other beaches along the US Gulf Coast, Panama City Beach has a relatively small tide range and is facing rising sea levels and increasing impacts from higher water levels.
Panama City Beach can serve as an example for US Gulf Coast beaches when relating beach profiles and nourishment methods to resilience in the face of sea-level rise and coastal storm impacts. However, change in resilience metrics over time at this location has not yet been studied, and a greater understanding of how to maintain such an asset has not yet been gained. While beach nourishments were originally scheduled at regular increments, actual renourishments have been irregular, and metrics relating beach nourishment (with differences in both profile and regularity) to resilience have not been analyzed.
This study aims to answer the following questions using two resilience metrics:
•
How has resilience historically changed at the Panama City Beach according to CERI metrics?
•
How do future alternative nourishment methods compare in terms of resilience at the Panama City Beach based on the BW metric?
Methods
The CERI and BW metrics use different morphological characteristics to quantify the coast’s ability to resist coastal disasters and are applied at the Panama City Beach study site. Because the methods and input data are separate, this section is broken into subsections to provide an overview of the methods used to calculate each metric.
Coastal Engineering Resilience Index
There is extensive documentation on the workflow and steps taken within the CERI toolbox (an ArcGIS Pro-based toolbox) because it not only functions as a resilience toolbox but also provides coastal engineers the ability to generate shorelines and transects, extract morphology data, plot profile data as extracted, and more (Robertson et al. 2018). Throughout this study, the CERI toolbox was under development, and this study provided another opportunity for the developers of the toolset to improve the code and develop patches. Simultaneous to this research, the developers were working on their own CERI-based research that focused on a national scale instead of a local scale such as the Panama City Beach. Regardless of the project scale, the CERI toolset can provide insights and extract critical data for future coastal engineering research.
For this study, the first step was data acquisition for the CERI toolset. The inputs require (at a minimum) a raster surface that can act as a digital elevation model (DEM) and knowledge of the area such as the MHW elevation relative to the DEM vertical datum. This allows the user to generate an MHW shoreline from the DEM and then generate shore-perpendicular transects along that shoreline. These transects are then used to grid data points (extracting elevation data from the DEM and assigning to points along each transect) at a 1-m interval. The gridded points are used as input to the morphology extraction step, and the extracted features are plotted. After verification of the results through user quality assurance and control methods, the extracted features are used for the CERI calculations for each transect. Most edits to the extracted feature points in the present study were very minor and caused a minimal (less than 0.2% difference on average, with a maximum difference of 1.5%) effect on the CERI values. These CERI calculations also use wave and wind lookup tables (provided with the toolbox) to provide a calculation based on the return interval of the user’s choice. For this work, both 10-year and 50-year intervals were calculated for comparison. The CERI is then calculated using the feature points, and values are output to a summary table that can be exported in various formats (.csv, .xlsx, etc.) for further analysis. A more in-depth walkthrough of the methodology for individual CERI steps can be found in Spurgeon (2022).
DEM coverage for Panama City Beach was downloaded from the National Oceanic and Atmospheric Administration's (NOAA) Digital Coast Data Access Viewer and included data from the US Army Corps of Engineers (USACE), Florida State Agencies, the National Aeronautics and Space Administration (NASA), United States Geological Survey (USGS), and the NOAA. To ensure consistency and repeatability of the boundary for this project, the default selection of boundary boxes when typing “Panama City Beach” into the Digital Coast web application was used. In this manner, the identical data sets could be accessed at any time by any party. DEM data were available at various instances in time: 1998, 2001, 2005 (post-Dennis), 2005 (post-Katrina), 2006, 2007, 2010, 2015, 2017, 2018, and 2020. Of these data sets, only the 2010 data set was deemed unusable because the near-shore region had considerable data gaps. These data gaps can occur depending on near-shore conditions at the time of surveying, particularly when high-wave-energy conditions increase turbidity, making it more difficult for the LiDAR systems to accurately measure bathymetry. While this problem is common in DEM data sets (Dunkin et al. 2020) and has known fixes, the 2010 data set was deemed too sparse to justify interpolation efforts. It should be noted that each of the CERI toolbox steps was completed for each DEM data set, holding all inputs constant other than the DEM itself.
Buffer Width
As noted in the “Introduction” section, Beach-fx is a planning model that evaluates economic benefits and physical performance of CSRM projects. An extensively used model within the USACE to decide if projects are economically justifiable, Beach-fx is often used to compare nourishment alternatives at a location regarding economic and damage factors. Beach-fx uses the Storm-Induced BEAch CHange (SBEACH) model or the Cross Shore (CSHORE) numerical model to model cross-shore morphological changes caused by storms (Johnson and Sanderson 2020). The present study uses SBEACH, which is a cross-shore numerical model used to calculate dune and beach erosion based on storm impacts (Larson and Kraus 1989). The empirical model is driven by engineering data such as wave height, wave period, and water level time series. Additional inputs such as the median grain size and profile shape are used to further inform the model. Dally’s breaker decay model by Dally et al. (1985) forms the basis of the SBEACH model’s approach to monochromatic waves and was eventually expanded to include a Rayleigh distribution to handle random waves, as presented in Larson and Kraus (1989). The model uses the equilibrium beach profile as presented by Bruun (1954) and modified by Dean (1977) and is shown in the form ofwhere h = water depth; A = shape parameter; and x = horizontal distance from the shoreline. SBEACH calculates the cross-shore transport rate as follows:where q = net cross-shore sediment transport rate in m3/m/s; K = empirical sediment transport rate coefficient; D = wave energy dissipations per unit water volume; Deq = equilibrium wave-energy dissipations per unit water volume; and = slope-related sediment transport rate coefficient. The wave-energy dissipation per unit volume, D, is given by the change in wave energy flux and is calculated as follows:where E = wave-energy density; and Cg = wave group velocity. The equilibrium wave energy dissipation per unit volume, Deq, is calculated in terms of the equilibrium profile shape parameter as follows:where ρ = density of water; g = gravitational acceleration; and γ = ratio of breaking wave height to the water depth. The SBEACH model outputs were used as inputs for the Beach-fx study at Panama City Beach.
(7)
(8)
(9)
(10)
Beach-fx calculates the damages and costs from storm events and simulates emergency and planned nourishment alternatives. The model uses the SBEACH or CSHORE model results to simulate many iterations of storm seasons, employing a relative storm probability table to complete a Monte Carlo simulation. The Monte Carlo method follows a Poisson distribution on the number of storms alongside the relative storm probabilities. No profile response computations are completed by Beach-fx—instead, the responses are kept in a lookup table in the storm response database, which is populated by SBEACH or CSHORE (Johnson and Sanderson 2020). The morphology timeline output of the Beach-fx model can be used as the direct input for the BW metric, and with 300 iterations per alternative, the overall trends emerge.
Beach-fx was run by the USACE mobile district and provided the model output for the present study. Beach-fx uses reaches to split up areas of interest with different morphological and land-use/economic conditions, and the district data contain four reaches. Information from a recent survey showed that Reaches 2–4 closely approximate the morphology at Panama City Beach. This was determined by leveraging a Python-based toolset that was created as part of Spurgeon (2023) named the Representative Beach Profile Generator (RBPG). This toolset imports the CERI toolbox output (extracted elevation points and CERI extracted feature points), aligns the profiles in the cross-shore, and plots them. Once plotted, the user inputs their own values to approximate the beach morphology in a trapezoidal format. This tool allowed the 2017 profile data (Fig. 3) extracted in the CERI methodology to be analyzed and compared with the district-created reaches.

Ultimately, Reach 2 was considered for further analysis because it had a historical erosion rate of 0.283 m/year that was most similar to the 0.3 m/year erosion rate calculated from a shoreline analysis of historical DEM data. There were no other pertinent details that differentiated Reach 2 from Reaches 3 and 4, because this study does not consider the economic impacts generated by Beach-fx. Therefore, Beach-fx results for Reach 2 were used in this study to evaluate the four nourishment strategies shown in Table 1. These nourishment types include “emergency” and “planned” nourishment alternatives. It should be noted that the emergency nourishment options were either the “null” alternative of no nourishment or the “emergency” nourishment, which has a blank template. A blank emergency nourishment template within Beach-fx defaults to the emergency nourishment fill density specification, which is a user-specified density of cubic meters per 0.305 m of shoreline (or cubic yards/linear foot) longshore that will be placed in the case of an emergency nourishment trigger. This fill density was set to 3.06 m3 per 0.305 m. In the planned alternatives, each nourishment extended the berm width to at least 9.1 m to bring the profile to the template width. The “3 dune” and “6 dune” alternatives nourish the dune width an additional 3.048 m (10 ft) and 6.096 m (20 ft), respectively, as seen by the change from the 9.1 berm alternative (13.81-m dune width) to the 9.1 berm 3 dune (16.81-m dune width) and the 9.1 berm 6 dune alternative (19.81-m dune width). The only configuration inputs that changed between alternatives were the nourishment types, both with planned and emergency nourishment.
| Nourishment name | Template dune width | Template berm width | Time increment | Nourishment volume threshold | Emergency nourishment |
|---|---|---|---|---|---|
| 9.1 berm | 13.72 m | 23.47 m | 3 years | 116,977 m3 | Emergency |
| 9.1 berm 3 dune | 16.76 m | 19.81 m | 5 years | 153,911 m3 | Emergency |
| 9.1 berm 6 dune | 19.81 m | 22.86 m | 5 years | 153,911 m3 | Emergency |
| Null w/emergency | None | None | N/A | N/A | Emergency |
| Null | None | None | N/A | N/A | Null |
Beach-fx was run a total of five times (Table 1). Each alternative included three sea-level change rates. The sea-level change rates were those defined by the district: the “low” case introducing no change, the “intermediate” case introducing a positive 0.117 m of sea-level change, and the “high” change case introducing a positive 0.490 m of sea-level change. All alternatives used an already calibrated set of scenario data and also the “calibration run” option to eliminate damage calculations, which decreases computational time. In addition, each time Beach-fx was run, 300 iterations of that model setup were run in order to obtain an average response. Most Beach-fx studies include economic considerations of damage to property protected by the beach, but this information is not needed for the BW metric and has no effect on the overall result of this resilience study. The cost of beach renourishment is the only economic consideration that is considered.
Once the Beach-fx alternatives were completed, the Beach-fx morphology timeline output was used to calculate the BW. This was done using the output dune height, dune width, berm width, and dune slope values. The berm height is not included in the morphology timeline because Beach-fx treats the berm only as a horizontally eroding feature and thus never changes the elevation. For the purposes of the BW calculation, a constant value of 2.01 m was used for the berm elevation. While keeping a berm elevation constant may artificially steepen the dune slope, Beach-fx adjusts for this by eroding the dune slope and redistributing it across the berm width. The BW was calculated for each time step.
Results
This section presents the final output of the CERI and BW analyses in separate subsections for each of the resilience metrics as was done in the “Methods” section.
CERI Results: A Historical Analysis
The CERI results are focused on the calculated metric for each survey. While each individual transect did have its own CERI value assigned to it for each survey data set, averaging the data across all transects allows for an overview of the study site temporally. The direct export from the CERI toolbox includes this data set averaging as well as the generation of summary tables of the averaged data. Table 2 lists the 10- and 50-year extreme water level and wave return period data sets and survey notes. It should be noted that the 2017 survey started on April 9, 2017 and ended on May 17, 2017. The nourishment that occurred in 2017 was completed on May 19, 2017, hence the “During Nourishment” designation. The survey notes are included in Table 2 for contextual purposes: the CERI tool, when used in a temporal setting, is best suited whenever there is information about storm impacts, nourishments (planned or emergency), and any other events that might influence the resilience of the area. For further visualization of the results in Table 2, Fig. 4 shows both the 10- and the 50-year return interval points, nourishment efforts, and storm events.

| Survey name | CERI, 10-year return | CERI, 50-year return | Survey notes |
|---|---|---|---|
| 1998 | 3.24 | 2.25 | Started October 29, 1998, Post Earl |
| 2001 | 3.93 | 2.68 | Started September 9, 2001, Post CSRM Construction |
| 2005 | 3.64 | 2.57 | Started July 13, 2005, Post Dennis |
| 2005 | 3.67 | 2.56 | Started October 12, 2005, Post Katrina |
| 2006 | 3.85 | 2.63 | Started April 28, 2006, Post Nourishment |
| 2007 | 3.84 | 2.67 | Started July 12, 2007 |
| 2015 | 3.93 | 2.76 | Started June 6, 2015 |
| 2017 | 3.92 | 2.77 | Started April 9, 2017, During Nourishment |
| 2018 | 3.88 | 2.77 | Started October 24, 2018, Post Michael |
| 2020 | 3.82 | 2.78 | Started September 22, 2020 |
The impact of Hurricane Earl in 1998 left Panama City beach with a relatively low CERI value, which was increased significantly after the large sediment placement was completed in 1999. Hurricane Dennis reduced the overall CERI value but did not reduce it below the original 1999 low value. The nourishment in 2006 helped raise the CERI value, and nourishments in 2011 and 2017 align with consistent CERI values. Hurricane Michael in 2018 had a small impact on the CERI value, although previous sections mention that Hurricane Michael made impact within 25 mi of the beach and was the highest category storm to impact the area in half of a century. The 2017 and 2018 surveys were taken about 1 year apart, thereby isolating the impacts of Hurricane Michael for analysis. This seemingly small change is something to be noted, considering the major impact of Hurricane Michael at the location. Houston (2023) found that PCB beaches experienced 1.9 m of surge due to Hurricane Michael and that no coastal damage occurred, except those due to wind. The nourishment prevented more than 70% of the potential damage. While storm statistical analysis is not within the scope of this work, it is a topic that should be considered for future work with the CERI toolbox. For example, the 1999 nourishment of 4.9 × 10⁶ m3 showed a 21.3% increase in CERI resilience, while Hurricane Dennis resulted in a 7.4% decrease in the same metric. After the 2006 nourishment (a 4.9% CERI increase), changes were minimal (less than 2.5%). These large-scale metrics (percent changes across the entire domain) are just one example of the quantitative metrics that are provided through the CERI. Coastal scientists are also able to focus on a more microscale, down to the individual transect CERI value. Defining the most morphologically resilient profile for an area or domain may help coastal managers decide on a design template. Percent changes in the values of individual transects or sections of the beach could provide an insight into the likelihood of change of an area.
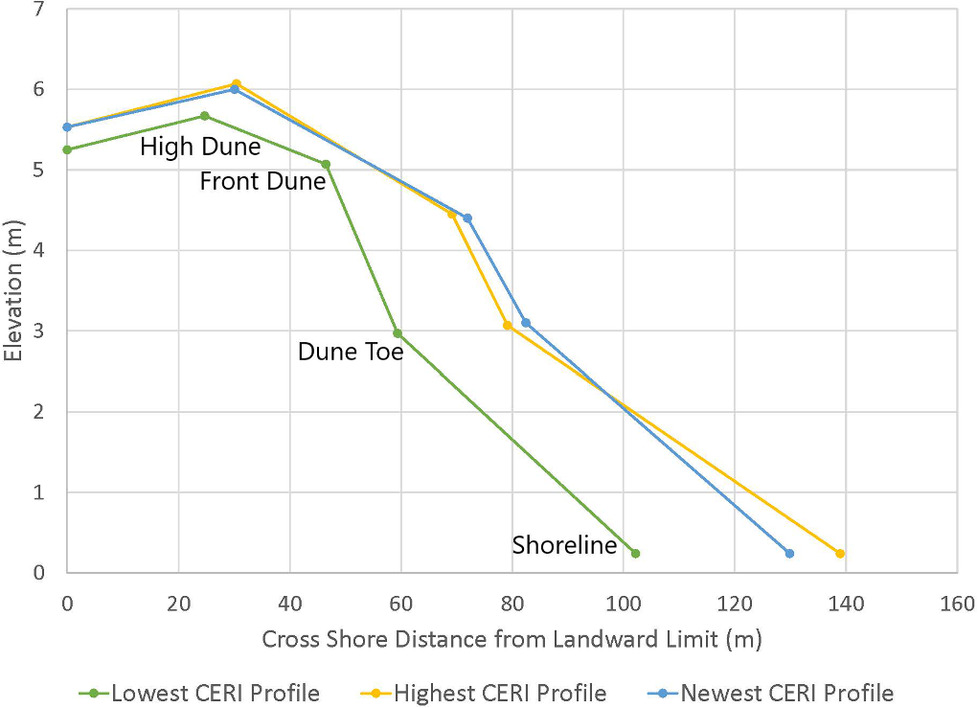
Other less direct metrics from the CERI toolbox are also available in the exported values. The extraction of key features, their elevations, and their cross-shore locations is an asset for other coastal engineering calculations. For example, the elevation differences in key features between the oldest and the lowest 10-year CERI data set (1998), the highest 10-year CERI data set (2015), and the most recent data set (2020) can be seen in Fig. 5. The extraction of these key features (berm and dune features alike) provides the basis for numerous opportunities for further analysis that can be performed using coastal engineering calculations: the CERI metric is just one of many. For this work, data analysis focused on the CERI metric and explained the final numerical values that it generated with a more in-depth look into the extracted morphology (see “Discussion” section).
BW Results: A Look into the Future
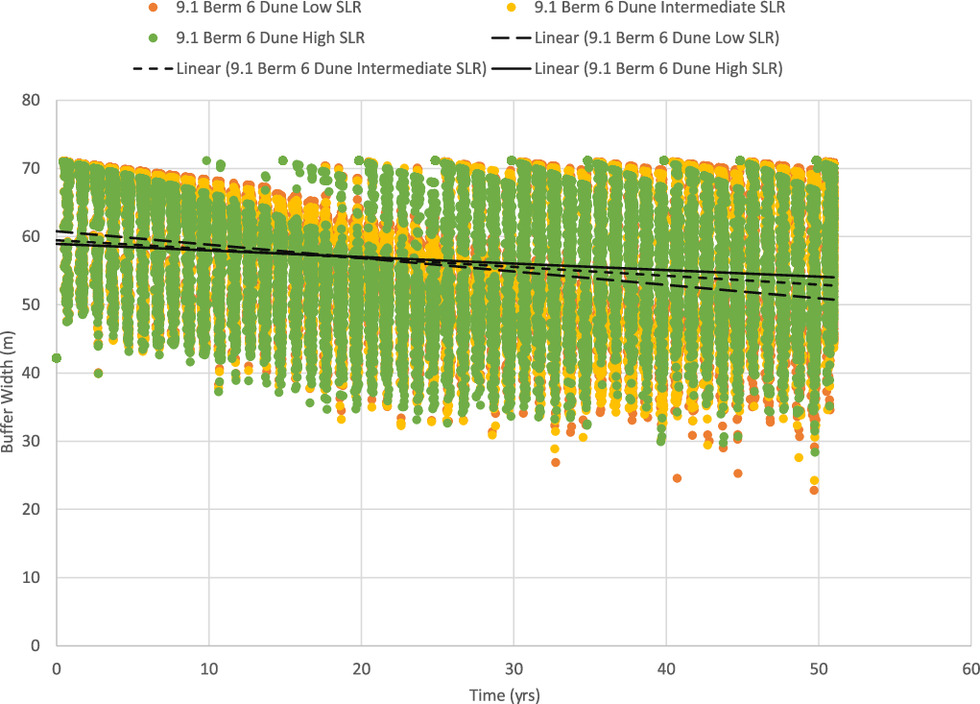
The primary exports generated by Beach-fx alternatives can be used to directly calculate the BW metric. The results, once calculated and summarized, are separated into two sets for the purpose of displaying results: Null alternatives and Planned Nourishment alternatives. The Null alternatives are those with no planned nourishment of any kind, although they can include emergency nourishment. Planned Nourishment alternatives comprise the rest of the test alternatives and always include a planned nourishment and an emergency nourishment. Fig. 6 shows a temporal evolution of the BW metric from 300 calculations of the BW from the Beach-fx iterations for the 9.1 berm 6 dune alternative. In the figure, there are 300 points in each year (each “column” of the data given is 1 year in the model), and each point refers to a single iteration. All 300 iterations are shown to highlight that, even with differences in the BW between iterations, a general trend exists and is shown with a trend line for each SLR scenario. Similar plots have been created for the other planned nourishment alternatives, and these can be seen in Spurgeon (2022).
To simplify these data into a more understandable format, Fig. 7 shows the BW trend lines for each high SLR nourishment case for the 175th iteration only. While this figure is only a single iteration out of 300 for the study, it displays the individual behavior of each nourishment alternative throughout each storm season and nourishment. It was chosen as a sample iteration at random to help clarify and simplify metric behavior. The BW metric considers a higher value to be equivalent to a higher resilience due to the morphology because there is more cross-shore distance between the water and the back of the dune, thus limiting storm impacts to the infrastructure behind the dune system. Each time a storm event happens, there is a sudden decrease in the BW value, followed by a near-immediate partial recovery, the natural recovery built into Beach-fx. Furthermore, the beach loses the BW between storm events as part of the natural erosion processes that occur at Panama City Beach. Nourishment efforts are observed as instantaneous increases in the BW, as labeled for the 9.1 berm nourished alternative in Fig. 7.
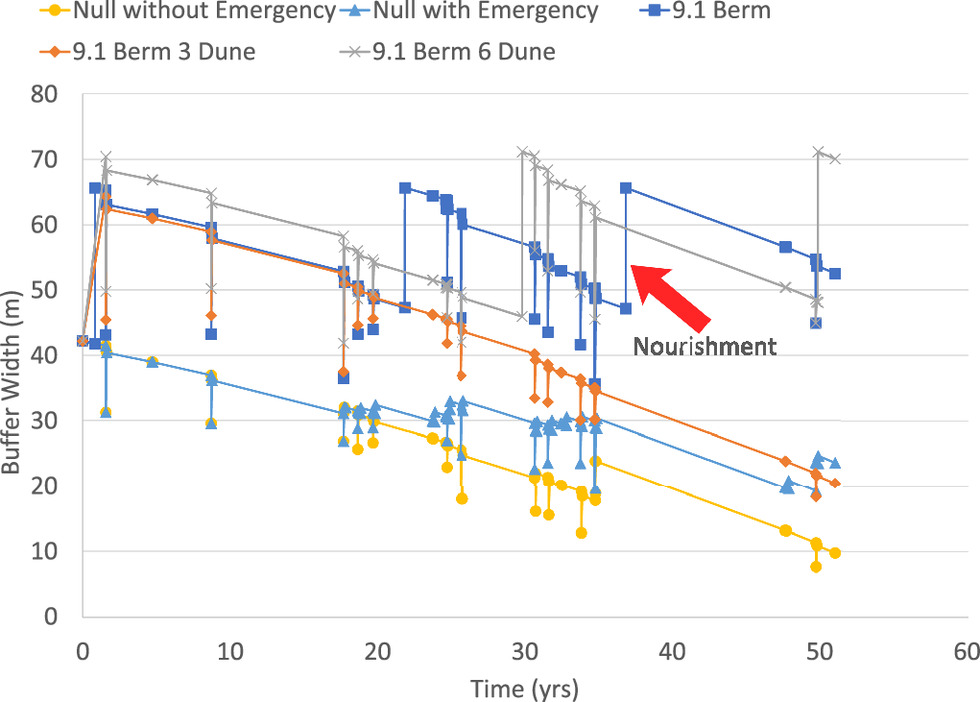
The high SLR trend lines from each alternative are shown in Fig. 8 and allow for a direct comparison between every nourishment alternative across all 300 iterations. The 9.1 berm 6 dune alternative has the most nourishment and shows the highest overall BW value across the entire span of the 51-year timeframe. Alternatively, the null alternative without emergency nourishment has a significantly lower starting value (the “current” condition of the beach) and declines considerably over the course of simulation due to a lack of nourishment to maintain the beach. The same behavior is seen in Fig. 7 with the 9.1 berm 6 dune alternative: while there are various storm and recovery events, the overall value of the most heavily nourished alternative is one of a generally high BW value across the model timeframe. Comparatively, the null alternative without emergency nourishment, as shown in Fig. 7, tracks closely with its trend line: its value starts low and simply decreases as daily impacts and storm erosion occurs at the location. At around the 35-year mark, there is some behavior that shows a sudden increase in the BW; however, the null without the emergency alternative (in yellow) should not increase in the BW because there are no nourishment events that can take place for that alternative. While the BW, as it is measured, does increase in a non-nourished alternative for certain iterations, this is not attributed to an actual increase in overall resilience. Instead, an erosion of the dune height causes an extension of the berm as the sediment moves seaward, resulting in an increase in the BW and the “false positive” behavior at the 35-year mark. This brings up an important point: the BW metric does not address the issue of elevation, rather it addresses only the cross-shore distance. This limitation must be understood for the results to be correctly interpreted. As nourishments start to take place (gray, dark blue, and orange lines in Fig. 7), this limitation is no longer seen since storm events do not reach the top of the dune and the dune elevation rarely changes. Therefore, the increases in the BW are due to nourishment events and display expected behavior. However, in a no-nourishment alternative, the lack of nourishment eventually causes the dune height to be affected and thereby causes the “false positive” effect. The small increases of the BW in the null with emergency nourishment alternative (light blue) are due to the emergency nourishment being triggered, and there is a substantial difference in the amount of BW increase between that and the nourished alternatives during their full planned nourishment. Something else of note in Fig. 7 is that the 9.1 berm 3 dune nourishment alternative never sees a positive jump; therefore, this alternative within this iteration never receives nourishment. An inspection of other iterations shows that the 9.1 berm 3 dune alternative does not always go without nourishment, but the nourishments are far more unlikely to happen. The negative trend line data for the 9.1 berm 3 dune alternative in Fig. 8 displays the overall trend that occurs whenever nourishments are unlikely to trigger.

The nourishment alternative with the most consistent nourishments and highest BW midrange (9.1 berm 6 dune, 51 m) is 129.2% and 95.8% higher, respectively, than the midranges of the null alternatives (Null w/emergency, 22 m and Null w/o emergency 26 m). The same high midrange is 24.3% higher than the midrange of the nourished case that was not frequently nourished (9.1 berm 3 dune, 41 m) and 8.5% higher than the midrange of the other frequently nourished case (9.1 berm, 47 m). There is a clear trend within these BW midrange metrics that strengthen the conclusion that frequency of nourishment is just as important as the template that is used. This BW midrange metric allows coastal managers to understand how well their nourishment alternatives are projected to influence how the location might respond to storm impacts at a given time over the temporal model domain. A low midrange suggests that there will be less cross-shore distance between the infrastructure and the shoreline on average. The ranges themselves may also be considered as valuable metrics; a case with a minimum BW value of 1.5 m is significantly weaker than a case with a minimum BW value of 29 m.
The Beach-fx alternatives also calculated the estimated costs of nourishments. Table 3 considers the high SLR scenario for planned and emergency nourishment average costs of each nourishment alternative. Note that the data reference the average costs for the entire Panama City beach (all reaches) and not only the second reach that was shown in the morphological results. This was done to understand the cost required to nourish the entire Panama City beach. The average cost per reach for each alternative is shown in Table 3. The 9.1 berm 6 dune alternative has the highest price with an average of $6.76 million per nourishment over the 51-year timeframe, and the 9.1 berm 6 dune alternative is the lowest cost alternative with an average of $4.62 million per nourishment over the same timeframe.
| Nourishment name | Avg. planned nourishment cost | Avg. emergency nourishment cost |
|---|---|---|
| Null | 0 | 0 |
| Null with EN | 0 | $4.66 million |
| 9.1 berm | $6.43 million | $2,250a |
| 9.1 berm 3 dune | $4.62 million | 0 |
| 9.1 berm 6 dune | $6.76 million | 0 |
a
This cost occurred only in Reach 1.
Discussion
The “Results” section provides many points of discussion, and for purposes of organization, this section is split into three subsections: discussion of the CERI metric results, discussion of the BW metric results, and an overall discussion of how these metrics work together. For the purposes of the CERI discussion, all cited metric values will be taken from the 10-year return period with the 50-year values given in parenthesis.
CERI Discussion: A Historical Analysis
The CERI results demonstrate how the Panama City Beach CSRM project has increased the resilience of this area since its inception in 1998–1999 in relation to reducing storm impacts. After Hurricane Earl in 1998, the CSRM project was developed to better protect the area from coastal storm impacts. One measure of success for CSRM projects may be a coastal resilience metric, especially if the resilience metric focuses primarily on how well the beach and dune system responds to coastal storm impacts.
Overall, the CERI metric tracks closely with the coastal engineering understanding of the effects of storm events and nourishments on coastal resilience. Relating back to the original four stages of resilience (prepare, resist, recover, and adapt), the CERI data speak to each, with the focus primarily on the preparation and resistance aspects of coastal resilience in relation to the morphology of the system. The preparations that occurred in 1999 (a CSRM project) increased the resilience of the area according to the CERI metric (Fig. 4). Moreover, whenever the cycle started over after a storm event (note the 2006 project), the nourishment projects reprepared the area by raising the CERI value to previous “high” values. During storm events, the increase in resistance was shown twofold: first, in 2005, the CERI score decreased but was still considered to be a higher resilience value than the original project poststorm in 1998. The initial nourishment in 1999 helped the area better resist storm impacts. Secondly, resistance is increased in that the overall decrease in resilience lessens; Fig. 4 shows that even when impacted by a major storm event such as Hurricane Michael, the CERI for the Panama City Beach area decreases by fewer points than when it was impacted by Hurricane Dennis in 2005. As stated previously, storm statistical analysis has not been completed for the CERI metric, so this observation is currently ambiguous, yet it suggests that the nourishments that took place between 2005 and 2018 were effective in their goal to increase or maintain storm resistance. Each subsequent storm event required less recovery (either via nourishment or natural recovery of the system). It should be noted that the typical increase in resilience due to recovery is seen in the resilience triangle as a reduction of time to recover to the desired level of functionality, and the CERI metric speaks specifically to the level to which recovery is needed, and not how quickly recovery efforts will succeed. Lastly, the adaptations, such as the 1.6-km construction segment that was built in 2011, contributed to storm resistance and therefore to the less need for making recovery efforts. The main focus of the CERI metric is on the resistance aspect through storm impact reduction.
Of the four stages of resilience, the CERI metric struggles to show how nourishment affects recovery. Instead, the key information is the constant CERI values after the CSRM project. As previously stated, nourishment reduces the amount that the system needs to recover (thereby being more a part of the adaptation of the system), but there is no clear evidence that the system recovers better naturally after nourishments. In the 10-year return interval CERI values, there is a slight increase in the metric in the few months between the 2005 surveys but a slight decrease in the metric after the 2018 survey. The 50-year return interval CERI value shows the inverse reaction: in 2005, there is a decrease in values, and post-2018, there is a slight increase in values, although it is probably better considered to be almost constant because the changes in the CERI values are negligible. More surveys would allow for better analysis to be completed using the CERI and how nourishments impact recovery of the beach. Due to the timing of surveys, it is difficult to draw conclusions about the recovery aspect of resilience at Panama City Beach. It is obvious that the act of nourishment is an engineered recovery of the beach, which may instead be seen as the cycle starting over and being “prepared” once again, thereby showing a constant/flat line result.
BW Discussion: A Look into the Future
The BW metric results project into the future and allow the user to understand how resilience may change given a certain set of nourishment parameters. The figures in the “BW Results: A Look into the Future” section make indications and together provide a comprehensive view of future resilience at Panama City Beach through the trend line, range of values, and nourishment costs. Fig. 8 provides an insight into the trend lines of the evaluated alternatives. Nourished alternatives have generally flat or mildly sloping trend lines, indicating fairly consistent resilience over time on the whole. However, this issue is not as simple as nourished alternatives versus non-nourished alternatives. For example, both the 9.1 berm alternative and the 9.1 berm 6 dune alternative indicate future resilience with their flat trend line data, while the trend line for 9.1 berm 3 dune alternative shows a decrease in resilience over time with a negative slope. This result is counterintuitive from a nourishment template perspective because the two alternatives with flat future resilience have both more and less volume density than the decreasing resilience alternative of 9.1 berm 3 dune. Therefore, the nourishment volume in the template is not exclusively dictating the future resilience. It should also be noted that the resilience being considered within this case goes back to the foundation of the BW metric; the more the cross-shore distance between the back of the dune and the shoreline, the more the likelihood that the failure of the system is avoided. Therefore, this view of resilience is also primarily focused on the resistance aspect due to storm impact reduction.
Looking closely at the 9.1 berm 3 dune alternative in Fig. 7, nourishment does not happen, although the profile has eroded substantially. Although the dune and berm had eroded, the 153,000 m3 volume loss threshold required to trigger nourishment was not met in many alternatives. This volume threshold is dependent on the template itself as well as the erosion that is possible at a location. For example, a profile with a relatively wide berm is more likely to lose larger amounts of volume and more easily meet nourishment requirement thresholds because there is more sediment at a lower elevation, which allows for increased erosion from wave energy. For the 9.1 berm 3 dune alternative, most of the iterations are not nourished as frequently as other alternatives, and therefore, the negative trend line in Fig. 8 is explained.
The results for the Null without Emergency Nourishment alternative are expected. Without nourishment occurring when needed, the BW resilience metric substantially decreases over that time. Once nourishment does happen (observed in other iterations), a full recovery to the original BW is possible, further identifying that the nourishment template itself likely does not have any inherent issues. Instead, the frequency at which the nourishment template is implemented is highly relevant. The 9.1 berm 3 dune alternative has a nourishment timeline of 5 years with a triggering threshold of 153,000 m3 (Table 1), and the 9.1 berm alternative has an increment of 3 years and a volume threshold of 117,000 cu yd. Changes in how often the profile is being checked and what is required for nourishment to be triggered have a substantial effect on the frequency of the occurrence of nourishments. For example, the 9.1 berm 6 dune alternative has the same timeline and threshold values as the 9.1 berm 3 dune alternative, and this shows that nourishment is happening as expected. This is due to the nourishment needing more sediment: the extra 3.05 m that the dune is being nourished means that the 9.1 berm 6 dune profile will meet the volume threshold sooner than the 9.1 berm 3 dune alternative given the same exact conditions. From a resilience standpoint, a template with poorly designed triggers will still result in a weak and vulnerable system.
From a financial standpoint, these conclusions remain the same: the 9.1 berm 3 dune alternative costs considerably less than the other two nourished alternatives because the requirements to trigger a nourishment are too strict for that profile. Based on the slope of the trend lines alone, it would be almost as cost-effective to pay for emergency nourishments ($4.66 million) for the next 50 years than it would be to nourish routinely using a stronger profile template ($4.62 million), although this is not recommended because the overall values of the BW are lower for the emergency alternative. Instead, this small cost difference makes the case that consistency in frequency of nourishments is just as important as nourishment templates. These costs are estimates; the delayed nourishment alternative that costs $4.62 million cannot necessarily be directly compared with the other alternatives since the nourishment schedule was drastically different (due to the volume thresholds being different). Therefore, the less-nourished alternative will cost less since there are fewer mobilization costs included over the same life span.
Even with the negative slope, the 9.1 berm 3 dune alternative had a higher BW range (12–70 m) compared with the null alternatives (1.5–43 and 9.1–43 m with/without emergency nourishment, respectively). The consistently frequent nourished alternatives also showed that the 9.1 berm alternative had a lower range (27–67 m) than the 9.1 berm 6 dune alternative (29–73 m). However, the cost estimates for each ($6.43 million versus $6.76 million, respectively) might sway the final decision toward the slightly less robust template since there is consistency based on the trend line data in both alternatives.
General Discussion
The greatest purpose of the CERI and BW metrics is to inform stakeholders about the coast’s resilience in terms of its ability to resist storm damage over time at a location with specific attention on nourishment and other protection features. Panama City Beach had relatively low resilience in the late 1990s after being impacted by Hurricane Earl. Once the CSRM project was introduced, the area became a more resilient system (as shown by the CERI metric) through constant management. The history of this location suggests that the investment in beach nourishment has resulted in the area better resisting storm damage and providing greater protection and recovery for Panama City. The healthy, wide dune systems increase the CERI metric as seen in Fig. 4. The general shape of the beach does not change, but the width of the dune and berm system proportionally increases.
For an already-resilient beach, general management is necessary to keep the beach to the level of resilience established. If nourishment is kept consistent in its frequency, the beach will not only be able to maintain its consistent resilience metric values but actually increase them even when facing SLR. In alternatives where frequent nourishment is abandoned altogether, a decrease in the BW, and therefore resilience, is observed in the area, unless emergency nourishment occurs. The best options are those that have frequent nourishments because they have a larger range of BW values as well as little to no overall degradation in resilience over the course of the next half century. As discussed previously, a nourishment with a strong profile but an infrequent nourishment schedule will still result in lower resilience. This is seen in conjunction with the CERI data: the CERI value stays relatively high after the initial CSRM project construction because the longest period without nourishment was from 1999 to 2006, a period of only 7 years. Consistency in nourishments has helped Panama City Beach historically just as much as the templates used in those nourishments.
The main contributions of this manuscript are applying the combination of the CERI and BW metrics, using a specific location to do so, and demonstrating the benefit that the combined metrics provide, which they would not have been able to provide separately. While the metrics are related and use similar inputs, they provide different temporal scales of the morphologic resilience at a location, and the use of both metrics provides a more complete temporal understanding to coastal scientists. These resilience metrics provide insights and also key information that was not previously accessible by the coastal community. The ability to quantify the strengthening or degradation effects of various events that the area has already experienced can further inform engineers, scientists, and stakeholders about coastal resilience at a location historically. Furthermore, those insights can be applied to future scenarios with greater confidence. In the case of nourishments specifically, alternatives can be compared for an area in a new and unique way. Instead of simply comparing nourishment alternatives based on cost, amount of sediment placed, and damage factors, an understanding of the resilience of the system can be gained using one of the two resilience metrics described herein. These metrics together can help better inform decision-making in the coastal environment and provide a greater understanding of how an area will respond to storm events overall. These metrics, especially when combined to receive the full temporal portrait of a site, “establish a range of metrics and critical measurements needed to monitor performance of and design infrastructure for coastal systems” (Rosati et al. 2015). Fox-Lent and Linkov (2018), as well as many others, have attempted to fulfill this call and have done so partially, but none have completed it in such a simple and direct approach as the CERI and BW metrics when relating to coastal storm impact reduction, sea-level change adaptation, and nourishment efforts. Furthermore, in combination, the CERI and BW metrics provide more information because they are based on different yet complementary sets of coastal engineering equations, theories, and best practices.
Conclusions
The CERI and BW metrics were used together to quantifiably show the historical resilience and future resilience in relation to five nourishment strategies at Panama City Beach, Florida. Both metrics considered the resilience specifically focusing on the “resist” portion of coastal resilience by reducing the risk of storm impacts. As previously noted, resilience is considered to increase whenever the capacity of any of the four portions (prepare, resist, recover, and adapt) increases. The CERI metric was implemented to better understand the historical and current resilience of the coastal system.
The DEM and transect-based methodology of the CERI tool provide a direct and approachable path forward for any coastal scientist needing a way to quantitatively consider resilience; as long as DEM or beach profile data exist for an area, a resilience value can be assigned through the transect-based methodology. Furthermore, as new survey data become available, the resilience values can be updated. DEM data for the Panama City Beach area were acquired, transects were created along the shoreline using the GIS toolbox, features such as the dune toe, dune crest, and landward limit were extracted for each transect, and the CERI was calculated from the extracted values. Repeating this process for each transect in time allowed a temporal analysis.
The BW metric was used to compare nourishment alternatives. The morphology timeline output from the Beach-fx model was used to calculate the BW. Nourishment alternatives were more easily compared with the BW metrics, which provided an understanding of how resilience might change under various sea-level rise conditions over the next half century.
Furthermore, the trend line of the BW metric displays a specific profile’s resistance to storm impacts when following the user-defined nourishment options; a sharp negative trend line displays that the profile, under current nourishment options, will not maintain a consistent width between the shoreline and the infrastructure, thereby decreasing resilience. Use of the trend line metric allows coastal managers to understand how their nourishment alternatives are projected to affect the location’s response to storm impacts based on the current nourishment schedule.
Both metrics can, in their own right, explain the resilience of a location based on morphology, and the results of both metrics are in agreement with each other. The CERI metric, based on values over time, shows that nourishment that was undertaken in the past at Panama City Beach has helped it to become a robust and resilient system that withstands more severe adverse events. The CERI metric displays consistent behavior over the last two decades, indicating that the system at Panama City Beach is maintaining its resilience. The BW metric shows that moving forward, if nourishment is abandoned, the beach will degrade naturally and lose that resilience. If nourishment is kept frequent and constant, the beach will be able to maintain its consistent resilience values not only in the face of storms but also when facing sea-level rise.
When used in combination, the CERI and BW metrics are able to paint a temporal portrait of Panama City Beach historically and extending into the future. The use of both metrics together highlights the value of frequency of designed nourishments at the location from a standpoint of resilience and the lessons that may be learned through the combination of these metrics at another location. Furthermore, each of the metrics is able to provide additional insights into other factors at the location. For example, the CERI metric shows that, even after experiencing the storm effects over the last 50 years, Panama City Beach remained resilient, especially in relation to the possibility of future storm impacts. The Buffer Width metric further supports well-established beach nourishment theory and applications: not only do frequent and designed nourishments continue to have a positive effect on the area, how they would respond to specific sea-level rise scenarios also shows a positive trend. The strategy of using CERI and BW resilience metrics is applied to Panama City Beach and can also be applied to beaches around the world.
Data Availability Statement
All DEM data sets are available on the NOAA data access viewer and can be found by searching for Panama City Beach, FL within the data viewer. The WIS and NOAA extreme water levels for use in the CERI toolbox can be accessed online at the ERDC WIS portal and NOAA's Tides and Currents tool, respectively. The CERI toolbox can be provided upon request by emailing Jennifer Wozencraft, one of the authors of this work. The Beach-fx data were created by the USACE Mobile District and can be provided upon request by emailing Elizabeth Godsey at [email protected].
Acknowledgments
This work was funded by the United States Army Corps of Engineers through the National Coastal Mapping Program and the University of South Alabama. The author would like to extend a special thank you to Lauren Dunkin, Quin Robertson, Zhifei Dong, Rusty Permenter, Charlene Sylvester, Dr. Nick Cohn, Sean McGill, and Elizabeth Godsey for their support throughout this project.
References
Armstrong, S. B., E. D. Lazarus, P. W. Limber, E. B. Goldstein, C. Thorpe, and R. C. Ballinger. 2016. “Indications of a positive feedback between coastal development and beach nourishment: Coastal development beach nourishment.” Earth’s Future 4 (12): 626–635. https://doi.org/10.1002/2016EF000425.
Bridges, T. S., et al. 2015. Use of natural and nature-based features (NNBF) for coastal resilience. Technical Rep. No. ERDC SR-15-1. Vicksburg, MS: USACE.
Bruneau, M., S. E. Chang, R. T. Eguchi, G. C. Lee, T. D. O’Rourke, A. M. Reinhorn, M. Shinozuka, K. Tierney, W. A. Wallace, and D. von Winterfeldt. 2003. “A framework to quantitatively assess and enhance the seismic resilience of communities.” Earthquake Spectra 19 (4): 733–752. https://doi.org/10.1193/1.1623497.
Bruun, P. 1954. Coast erosion and the development of beach profiles. This digital resource was created from scans of the print resource. Rep. Washington, DC: Beach Erosion Board.
Cutter, S. L., C. G. Burton, and C. T. Emrich. 2010. “Disaster resilience indicators for benchmarking baseline conditions.” J. Homel. Secur. Emerg. Manag. 7 (1). https://doi.org/10.2202/1547-7355.1732.
Dally, W. R., R. G. Dean, and R. A. Dalrymple. 1985. “Wave height variation across beaches of arbitrary profile.” J. Geophys. Res. 90 (C6): 11917. https://doi.org/10.1029/JC090iC06p11917.
Dean, R. G. 1977. Equilibrium beach profiles: US Atlantic and Gulf coasts. Ocean Engineering Rep. No. 12. Newark, DE: Dept. of Civil Engineering, Univ. of Delaware.
Dong, Z., N. Elko, Q. Robertson, and J. Rosati. 2018. “Quantifying beach and dune resilience using the coastal resilience index.” Int. Conf. Coastal Eng. 36: 30. https://doi.org/10.9753/icce.v36.papers.30.
Dunkin, L., E. Eisemann, M. Hartman, and J. Wozencraft. 2020. Seamless integration of lidar-derived volumes and geomorphic features into the Sediment Budget Analysis System. Vicksburg, MS: Engineer Research and Development Center.
Durkin, M., and K. Chambers. 2019. Coastal resilience metrics from Beach-fx. Technical Rep. No. ERDC CHETN-VI-49. Vicksburg, MS: USACE.
Elko, N., T. R. Briggs, L. Benedet, Q. Robertson, G. Thomson, B. M. Webb, and K. Garvey. 2021. “A century of U.S. beach nourishment.” Ocean Coastal Manage. 199: 105406. https://doi.org/10.1016/j.ocecoaman.2020.105406.
Fox-Lent, C., and I. Linkov. 2018. “Resilience matrix for comprehensive urban resilience planning.” Resilience-Oriented Urban Planning, Lecture Notes in Energy, edited by Y. Yamagata and A. Sharifi, 29–47. Cham, switzerland: Springer International Publishing.
Houston, J. R. 2023. “Measured fate of beach nourishment sand.” J. Coastal Res. 39 (3): 407–417. https://doi.org/10.2112/JCOASTRES-D-22-00079.1.
Janssen, M. S., and J. K. Miller. 2022. “The dune engineering demand parameter and applications to forecasting dune impacts.” J. Mar. Sci. Eng. 10 (2): 234. https://doi.org/10.3390/jmse10020234.
Johnson, B., and D. Sanderson. 2020. On the use of CSHORE for Beach-fx. Vicksburg, MS: Engineer Research and Development Center.
Larson, M., and N. C. Kraus. 1989. SBEACH: Numerical model for simulating storm-induced beach change. Report 1. Empirical Foundation and Model Development. Technical Rep. CERC-89-9. Vicksburg, MS: U.S. Army Engineer Waterways Experiment Station.
Linkov, I., et al. 2014. “Changing the resilience paradigm.” Nat. Clim. Change 4 (6): 407–409. https://doi.org/10.1038/nclimate2227.
Logan, T. M., T. Aven, S. D. Guikema, and R. Flage. 2022. “Risk science offers an integrated approach to resilience.” Nat. Sustainability 5 (9): 741–748. https://doi.org/10.1038/s41893-022-00893-w.
McFall, B. C., K. E. Brutsché, A. M. Priestas, and D. R. Krafft. 2021. “Evaluation techniques for the beneficial use of dredged sediment placed in the nearshore.” J. Waterw. Port Coastal Ocean Eng. 147 (5): 04021016. https://doi.org/10.1061/(ASCE)WW.1943-5460.0000648.
NOAA (National Oceanic and Atmospheric Administration). 2022a. “Historical hurricane tracks.” Accessed August 2, 2022. https://coast.noaa.gov/hurricanes/.
NOAA (National Oceanic and Atmospheric Administration). 2022b. “Sea level trends.” NOAA Tides & Currents. Accessed August 2, 2022. https://tidesandcurrents.noaa.gov/sltrends/sltrends_station.shtml?id=8729210.
NOAA (National Oceanic and Atmospheric Administration). 2022c. “Datums for 8729210, Panama City Beach FL.” NOAA Tides & Currents. Accessed August 2, 2022. https://tidesandcurrents.noaa.gov/datums.html?id=8729210.
Pendleton, E. A., E. R. Thieler, and S. J. Williams. 2010. “Importance of coastal change variables in determining vulnerability to Sea- and lake-level change.” J. Coastal Res. 261: 176–183. https://doi.org/10.2112/08-1102.1.
Roberts, T. M., and P. Wang. 2012. “Four-year performance and associated controlling factors of several beach nourishment projects along three adjacent barrier islands, west-central Florida, USA.” Coastal Eng. 70: 21–39. https://doi.org/10.1016/j.coastaleng.2012.06.003.
Robertson, Q., L. Dunkin, Z. Dong, J. Wozencraft, and K. Zhang. 2018. “Florida and US East Coast Beach change metrics derived from LiDAR data utilizing ArcGIS python based tools.” In Beach management tools—Concepts, methodologies and case studies, coastal research library, edited by C. M. Botero, O. Cervantes, and C. W. Finkl, 239–258. Cham, Switzerland: Springer.
Rogers, C. M., K. A. Jacobson, and M. Gravens. 2009. Beach-fx user’s manual: Version 1.0. Technical Rep. No. ERDC SR-09-6. Vicksburg, MS: USACE
Rosati, J. D., K. F. Touzinsky, and W. J. Lillycrop. 2015. “Quantifying coastal system resilience for the US Army Corps of Engineers.” Environ. Syst. Dec. 35 (2): 196–208. https://doi.org/10.1007/s10669-015-9548-3.
Saloman, C. H. 1976. The benthic fauna and sediments of the nearshore zone off Panama City Beach, Florida. Vicksburg, MS: U.S. Coastal Engineering Research Center.
Schultz, M. T., S. K. McKay, and L. Z. Hales. 2012. The quantification and evolution of resilience in integrated coastal systems. Technical Rep. No. ERDC TR-12-7. Vicksburg, MS: USACE.
SEDAC. 2011. Percentage of total population living in coastal areas. Columbia, SC: Socioeconomic Data and Applications Center.
Slobbe, E., H. J. Vriend, S. Aarninkhof, K. Lulofs, M. Vries, and P. Dircke. 2012. “Building with nature: In search of resilient storm surge protection strategies.” Nat. Hazard. 65 (1): 947–966. https://doi.org/10.1007/s11069-012-0342-y.
Spurgeon, S. 2022. Resilience metrics at Panama City Beach, Florida. Master’s thesis, Dept. of Civil, Coastal, and Environmental Engineering, Univ. of South Alabama.
Spurgeon, S. L. 2023. Representative beach profile generator. Technical Rep. No. CHETN-II-60. Vicksburg, MS: USACE.
Stockdon, H. F., R. A. Holman, P. A. Howd, and A. H. Sallenger. 2006. “Empirical parameterization of setup, swash, and runup.” Coastal Eng. 53 (7): 573–588. https://doi.org/10.1016/j.coastaleng.2005.12.005.
USACE. 2015. North Atlantic coast comprehensive study: Resilient adaptation to increasing risk. Technical Rep. Washington, DC: USACE.
USACE. 2019. Project information report: Rehabilitation effort for the Panama City Beaches, Florida coastal storm risk management project. Technical Rep. USACE/Mobile District. Mobile, AL: USACE.
Wilson, D. 1975. Feasibility report for beach erosion control and hurricane protection, Panama City Beaches, Florida. Miscellaneous Rep. US Army Engineer District. Mobile, AL: USACE.
Information & Authors
Information
Published In

Journal of Waterway, Port, Coastal, and Ocean Engineering
Volume 149 • Issue 5 • September 2023
Copyright
This work is made available under the terms of the Creative Commons Attribution 4.0 International license, https://creativecommons.org/licenses/by/4.0/.
History
Received: Sep 28, 2022
Accepted: Apr 19, 2023
Published online: Jul 4, 2023
Published in print: Sep 1, 2023
Discussion open until: Dec 4, 2023
ASCE Technical Topics:
- Beaches
- Bodies of water (by type)
- Business management
- Climates
- Coastal engineering
- Coastal management
- Coasts, oceans, ports, and waterways engineering
- Design (by type)
- Developing countries
- Engineering fundamentals
- Environmental engineering
- Load and resistance factor design
- Load factors
- Measurement (by type)
- Meteorology
- Metric systems
- Practice and Profession
- Precipitation
- Research and development
- Sea level
- Seas and oceans
- Shores
- Storms
- Structural design
- Water and water resources
- Water management
Authors
Metrics & Citations
Metrics
Citations
Download citation
If you have the appropriate software installed, you can download article citation data to the citation manager of your choice. Simply select your manager software from the list below and click Download.