Analysis of Urban Thermal Environment Evolution and Mechanisms Based on Multisource Data: A Case Study of Hangzhou, China
Publication: Journal of Urban Planning and Development
Volume 150, Issue 3
Abstract
Urban thermal environment (UTE) deterioration seriously affects the production, life, and health of urban residents. Therefore, identifying the spatial and temporal evolution of the urban environment and exploring the main factors that affect the UTE are increasingly urgent and important. This study uses multisource spatial data to analyze the changes in surface temperature and its spatial and temporal differentiation patterns of Hangzhou, China in 2000, 2010, and 2021. Then, factors that are intimately connected to the alterations in the UTE are identified. Based on this, the contribution and impact of the UTE are calculated. The findings indicate that from 2000 to 2021, Hangzhou’s urban heat island area has been continuously expanding, with an increase of 622.74 km2. In 2021, the maximum surface temperature difference reached 6.2°C, where the heat island area in the Xiaoshan and Yuhang Districts exhibited the largest increase. Hangzhou’s urban heat island space showed a scattering distribution in the northwest–southeast direction. High-temperature areas are concentrated in regions that are characterized by dense industrial and commercial distribution, which display local concentration and overall dispersion. Low-temperature areas are concentrated around vegetation-covered regions and bodies of water. The natural and social factors contribute to the changes in surface temperature within the study area. The contribution of social factors on surface temperature surpasses that of natural factors. The leading factors are landscape patterns, the natural environment, and construction activities. The combined effects of various factors increase the surface temperature by 0.965°C for each unit increase in the combined factors within the study area.
Introduction
In the dual in the framework between global climate change and China’s rapid urbanization, urban land use undergoes rapid transformation, the accelerated deterioration in the urban thermal environment (UTE) has been induced. The UTE is an extension of the urban heat island concept, which refers to the physical environment system that is closely related to human habitation. It is centered on surface temperatures and is associated with building volume ratio and density, water bodies, and green space distribution (Voogt and Oke 2003; Weng 2009). The deterioration in the UTE could result in many hazards. It intensifies heatwaves and impacts the inhabitants’ health and living standards in urban areas. In addition, it could increase energy consumption and atmospheric pollution in cities, which degrades the quality of the urban ecological environment (Grimm et al. 2008; White et al. 2002; Middel et al. 2014; IPCC 2014; Oleson et al. 2018; Patz et al. 2005). Therefore, an in-depth analysis of the features and variables that affect the UTE is important to reduce the impact of the urban heat island and enhance the quality of human settlements.
Early research on the UTE used observational data, which primarily described the trend of rising city temperatures rather than suburban temperatures. Currently, researchers have conducted studies on the UTE (Ogashawara and Bastos 2012; Yusuf et al. 2014). Building on the aforementioned techniques, many researchers currently focus on the UTE’s spatial characteristics and its dynamic change patterns across different spatial and temporal scales (Ren et al. 2021; Stewart 2011; Sobrino et al. 2012; Yang et al. 2021). For the spatial characteristics of the UTE, many research studies have examined the correlation among urban spatial structure, landscape patterns, and the UTE, investigating their inherent mechanisms. These investigations often rely on high-resolution satellite imagery for remote sensing (Yao et al. 2018). For the spatial and temporal dynamic change trends in the UTE, current studies primarily focus on the study of two-dimensional spatial pattern changes in the urban annual or seasonal time scales (Yusuf et al. 2014).
Existing studies have investigated the UTE, which provides diverse routes for an in-depth understanding of the UTE evolution and its driving mechanisms (Xiong and Zhang 2021; Ye et al. 2021). Any change in the appearance of geographical phenomena is an external manifestation of their internal driving forces. Therefore, the research on spatial impact factors and the driving mechanisms of the urban heat environment is key to analyzing the spatial and temporal changes in the UTE (Streutker 2002; Yang et al. 2021). Currently, research indicates that the main factors that affect the UTE could be categorized into two types: (1) social; and (2) natural forces. The former includes socioeconomic elements, such as land use type (Anniballe et al. 2014) and its landscape pattern changes (Peng et al. 2016), impervious surfaces (Grover and Singh 2015; Bokaie et al. 2016), and human activities (Hong et al. 2019). The latter includes natural geographical elements, such as vegetation coverage (Grover and Singh 2015; Liu et al. 2021) and slope elevation (Connors et al. 2013).
In the last few years, China’s urbanization rate has increased dramatically, which has resulted in a decline in the UTE and the heat island effect in China. In addition, the deterioration of the UTE has resulted in increased natural disasters and ecological anomalies in localized areas (Cai et al. 2011; Kuang et al. 2015). Therefore, the urban heat island effect has become an important factor that affects China’s ecological environment, residents’ health, and sustainable development (Peng et al. 2016). Over the last few years, Hangzhou has experienced a notable increase in its average temperature, with summer enduring high temperatures for approximately 40–50 days annually. Therefore, Hangzhou is among the cities with the highest summer temperatures in China. This scenario provides an opportunity to explore the evolution of the UTE and the factors that influence it during rapid urbanization in China. Therefore, Hangzhou is considered an example, and Landsat remote sensing image data from 2000, 2010, and 2021 (USGS 2000, 2010, 2021) are used to inverse the land surface temperature (LST). These image data are combined with the land use data to explore the evolution characteristics of Hangzhou’s UTE. The indicators and data sources are given in Table 1. Then, the correlation and spatial principal component analyses are conducted to explore further the key factors that affect the UTE and their inherent mechanisms to better understand the changing rules in the UTE and supply a theoretical foundation and decision support for the scientific compilation of urban planning and alleviate the urban heat island effect.
| Target level | Standardized layer | Indicator layer | Data sources |
|---|---|---|---|
| UTE | Time–space evolution | LST | GSCloud (n.d.) |
| Factor | DEM | Geodata (n.d.) | |
| FVC | Landsat 5 and 8 | ||
| MNDWI | Landsat 5 and 8 | ||
| NDISI | Landsat 5 and 8 | ||
| NDBBI | Landsat 5 and 8 | ||
| Albedo | Landsat 5 and 8 | ||
| CA | Fragstats 4.2 | ||
| Patch density (PD) | Fragstats 4 | ||
| LPI | Fragstats 4 | ||
| LSI | Fragstats 4 | ||
| AI | Fragstats 4 | ||
| DIVISION | Fragstats 4 | ||
| SHDI | Fragstats 4 | ||
| Baidu map thermal index (BMT) | Baidu (2021) |
Study Area and Data
Study Area
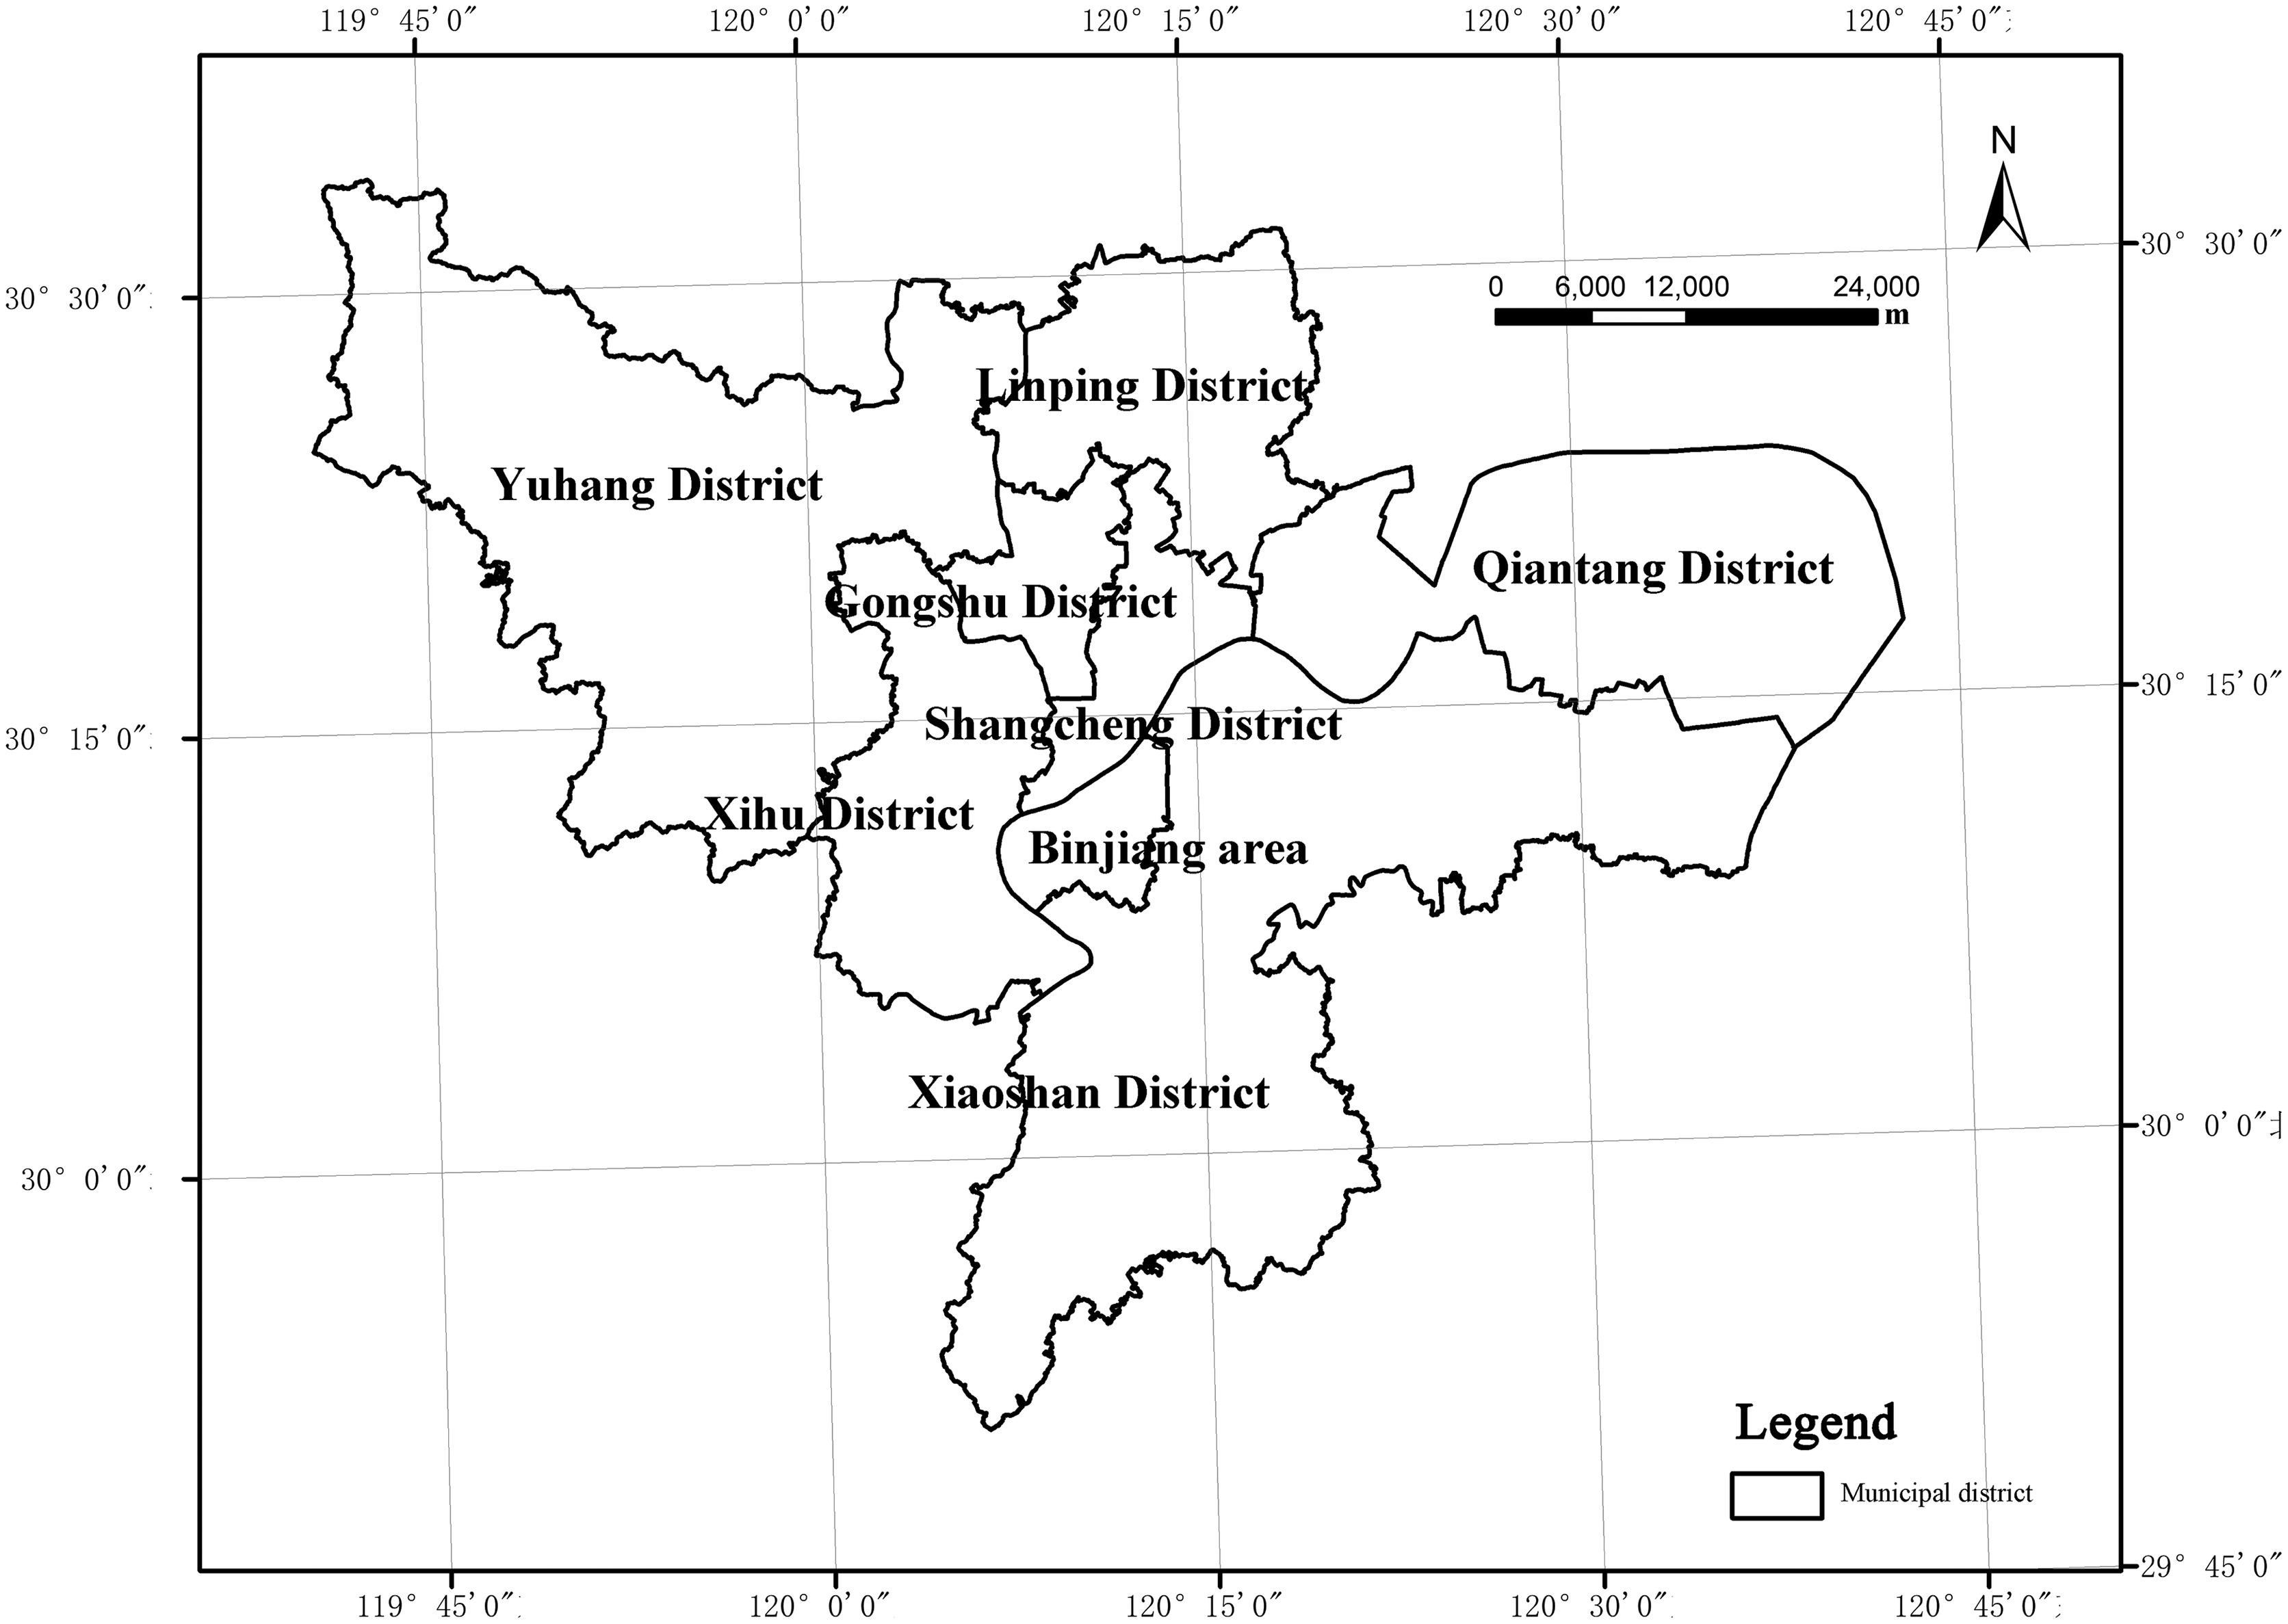
Hangzhou is on the southern wing of China’s Yangtze River Delta. Recently, the city has developed rapidly, with high-intensity land development, a dense population, and a significant urban heat island effect. The eight main districts of Hangzhou (Shangcheng, Gongshu, Xihu, Linping, Binjiang, Qiantang, Xiaoshan, and Yuhang), which have experienced the most rapid development in the last 20 years were selected as the research subjects (Fig. 1). The selection carries typical significance.
Data
The research data included the urban surface temperature, relative population density, and land use data. The urban surface temperature for this study was obtained by inverting Landsat 5 and 8 remote sensing images from the main urban area of Hangzhou for 2000, 2010, and 2021. Landsat 5 with Thematic Mapper (TM) and Landsat 8 with Operational Land Imager (OLI) and thermal infrared sensor (TIRS) can capture images in the visible, infrared spectral, and thermal infrared bands, which provide high-resolution, high-quality surface observations. In this study, the atmospheric correction method was selected. Band 6 of Landsat 5 and Band 10 of Landsat 8 were selected for the surface temperature inversion to provide a detailed analysis of the surface thermal environment characteristics. To ensure data reliability, remote sensing data that were obtained during the summer were selected on days near similar average temperatures. In addition, stable weather conditions were ensured before and after the imaging date, which avoided disturbances from special climatic factors, such as typhoons and heavy rains. The cloud cover was <10%, and the conditions for the remote sensing imaging were excellent. The ENVI 5.3 software was used to perform radiometric calibration, atmospheric correction, and preprocessing, such as cropping the study area on the remote sensing images. The images were inverted to obtain the ground surface temperatures for Hangzhou City during the three periods. Population data were obtained by crawling the 2021 Hangzhou City heat map data (Baidu 2021) with Python and vectorizing them using ArcGIS 10.8. Land use data were obtained by inverting November 2020 Landsat 8 remote sensing images of Hangzhou City, with geometric correction, radiometric calibration, and definition projection performed using ENVI 5.3 software. Referencing the Urban Land Classification and Planning Construction Land Standard (Ministry of Housing and Urban-Rural Development of the People’s Republic of China 2011), the classification workflow plugin was used for supervised classification. It was corrected via manual interpretation and field research. The types of land use in the area under investigation were classified into three major first-level categories: (1) construction land; (2) water bodies; and (3) green space [Fig. 2(a)] and 10 second-level categories: (1) land for roads and plazas; (2) wasteland; (3) river beaches; (4) water areas; (5) forests; (6) industrial and mining land; (7) residential and commercial land; (8) urban green spaces (which includes parks); (9) agricultural land (breeding); and (10) agricultural land (cultivated) [Fig. 2(b)]. Other data included a digital elevation model (DEM), with projection conversion, mosaicking, and workspace cropping performed in ArcGIS 10.8.
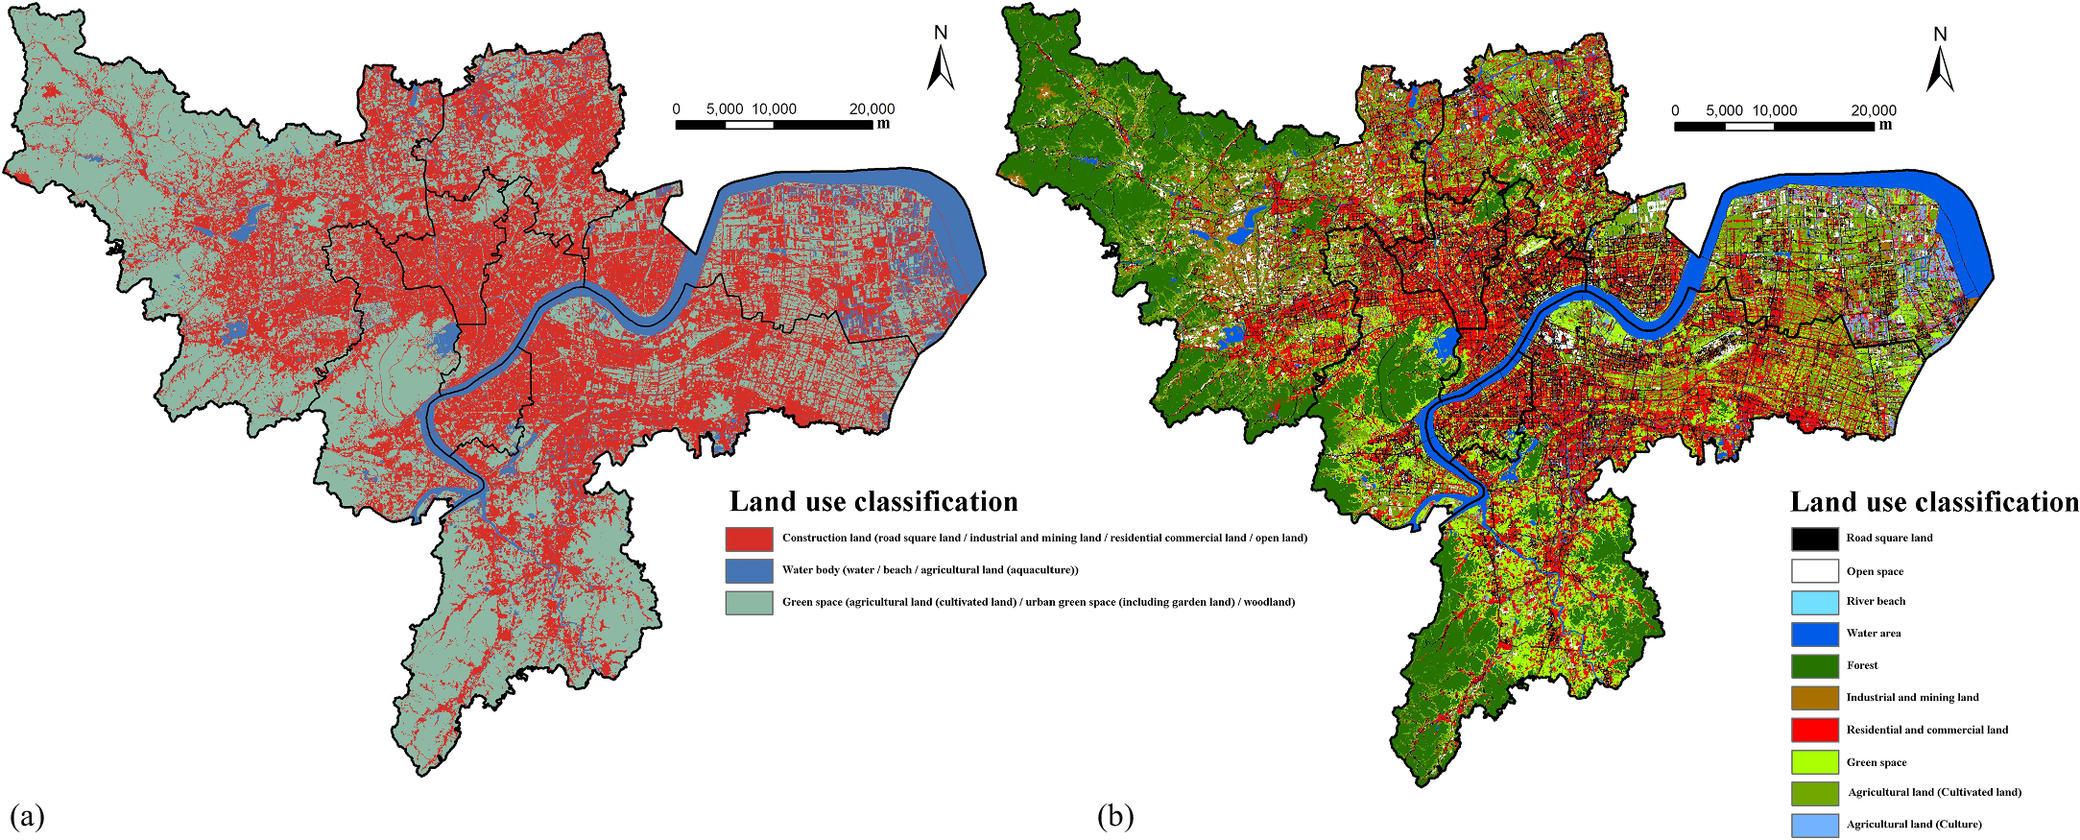
Fig. 2. Current land use in the study area: (a) three first-level classes; and (b) nine secondary classes.
(Data from USGS 2021.)
Examining the determining elements and driving mechanisms of the UTE is key to analyzing the evolution of the UTE in human settlements (Firozjaei et al. 2018). This study selected natural and social factors as influencers of the surface temperature according to previous studies in tandem with the locational characteristics of the study area, as demonstrated in Table 2. The natural factors include the topographic and ecological environment, and the social factors include land use, landscape morphology, and socioeconomic factors. The topographic factors were characterized by the DEM data, and the ecological environment factors were represented by fractional vegetation cover (FVC) and modified normalized difference water index (MNDWI). The normalized difference impervious surface index (NDISI), normalized difference bareness and built-up index (NDBBI), and surface albedo index (Albedo) represent urban construction intensity within the land use factors. The landscape morphology factors are indicated by class area (CA), patch density (PD), largest patch index (LPI), landscape shape index (LSI), aggregation index (AI), landscape division index (DIVISION), and Shannon diversity index (SHDI). The socioeconomic factors reflected the intensity of human activities and were represented by the Baidu Maps heat index.
| First-level index | Secondary index | Third-level index | Characterization index |
|---|---|---|---|
| Natural factors | Topographic and geomorphic factors | Elevation | DEM |
| Ecoenvironmental factors | Vegetation | FVC | |
| Water | MNDWI | ||
| Social factors | Land use factor | Intensity of urban construction | NDISI |
| NDBBI | |||
| Albedo | |||
| Landscape morphological factors | Landscape pattern index | CA | |
| Patch Density (PD) | |||
| LPI | |||
| LSI | |||
| AI | |||
| DIVISION | |||
| SHDI | |||
| Social and economic factors | Population density | BMT |
First, to facilitate the coordination and utilization of different data sources, the geographic coordinates of different data sources were matched and unified in ArcGIS 10.8 to ensure that the data used the same coordinate system and georeferencing framework. Second, information from different data sources was integrated into a consistent data set, and different data sources were associated by sharing the same or similar attribute fields. Third, appropriate grid cells were constructed according to the study area and the spatial resolution of the available data to combine data from multiple sources. Fourth, Pearson’s correlation analysis and spatial principal component analysis were applied to derive Pearson’s correlation coefficients and the main contributing factors of each factor and surface temperature and to explore the correlation between each factor and the urban surface temperature.
Method
First, to explore the spatial pattern of the UTE in Hangzhou, the surface temperature that was inverted from Landsat remote sensing data was considered to describe the regional UTE and the temperature class was divided according to the existing studies to visually describe the differences in the UTE in the study area (Clinton and Gong 2013; Liu et al. 2022). Second, by importing the land use, landscape morphology, and human environment factors that affected the distribution pattern of urban LST into SPSS 24.0, Pearson’s correlation analysis was performed to obtain the correlation coefficients between each index and the urban surface temperature. This approach was intended to test the correlation between urban factors and the UTE (Coseo and Larsen 2014; Du et al. 2016). Then, the spatial principal component analysis was applied to remove redundant information, overcome the problem of multifactor covariance, and facilitate the analysis of the UTE response. In the spatial principal component analysis method, an eigenvalue > 1 and a cumulative variance contribution rate of more than 80% are generally regarded as the criteria for factor selection (Vicente-Serrano et al. 2005).
Surface Temperature Inversion and Level Division
The atmospheric correction technique was applied to derive the urban surface temperatures from satellite imagery. Specifically, Landsat 5 TM’s thermal infrared Band 6 and Landsat 8 OLI’s TIRS Band were utilized for surface temperature inversion. The impact of the atmosphere on thermal radiation during radiation transport was mitigated by the application of the thermal infrared radiation transfer equation. This approach yields a relatively accurate surface temperature. The calculation equation follows:where B(TS) = blackbody thermal radiation brightness; Ts = surface temperature; Lup = atmospheric upward radiation brightness; Ldown = atmospheric downward radiation brightness; = surface emissivity; τ = atmospheric transmittance; and K1 and K2 = radiative constants.
(1)
(2)
Previous research was referenced to intuitively describe the differences in the surface temperature in the study area (Liu et al. 2014). The average surface temperature [Ta (°C)] of the study area and the corresponding standard deviation (σ) were calculated. The standard deviation method in ArcGIS 10.8 was used to divide Hangzhou’s surface temperature into six categories: (1) exceptionally high-temperature; (2) high-temperature; (3) sub-high-temperature; (4) medium-temperature; (5) sub-medium-temperature; and (6) low-temperature. The specific grading standards are given in Table 3. According to surface temperature grading standards, areas that consistently experience temperatures above average, such as sub-high, high, and exceptionally high-temperature zones, are classified as urban heat island areas.
| Grade | Categories | Equations |
|---|---|---|
| 1 | Low-temperature areas | < Ta − σ |
| 2 | Sub-medium-temperature areas | |
| 3 | Medium-temperature-areas | |
| 4 | Sub-high-temperature areas | |
| 5 | High-temperature areas | |
| 6 | Exceptionally high-temperature areas | > Ta + σ |
Note: Ta = average LST in the study area; and σ = standard deviation of LST.
Acquisition of Surface Information
Modified Normalized Difference Water Index
The MNDWI pertains to the normalized difference processing that is applied to image bands that contain water information with thresholds of 0–1. The main land use types include beaches, water areas, and agricultural land (farming)where Green = green band; and MIR1 = infrared band of the remote sensing image.
(3)
Normalized Difference Impervious Surface Index
The impervious surface refers to the area that is covered by various impervious building materials in a city, which includes roads and square land, open spaces, industrial and mining land, residential and commercial land, and other hardened surfaces. The NDISI is an important index of urban expansion (Carlson and Arthur 2000). The threshold value of 0–1 was calculated using the following equation:where TIR, NIR, and MIR1 = thermal, near-, and mid-infrared bands in Landsat 8 remote sensing images; and MNDWI = modified normalized difference water index. Eq. (4) indicates the complete NDISI process.
(4)
Fractional Vegetation Cover
The FVC refers to the percentage of the vertical projection area of vegetation (which includes leaves, stems, and branches) in the total statistical area in the range of [0%, 100%]where Red = red band in the remote sensing image.
(5)
(6)
Normalized Difference Bareness and Built-Up Index
The remote sensing image removes the water body and vegetation information directly, and the normalized difference processing is performed for information, which includes bare land and building land, normalized to a threshold of 0–1where Green, Red, NIR, SWIR1, SWIR2, and TIRS1 = third, fourth, fifth, sixth, seventh, and 10th bands in Landsat 8.
(7)
Surface Albedo Index
The Albedo is the ratio of incident solar radiation energy that the surface can reflect; it is a crucial factor that establishes the surface’s energy budget and the amount of solar radiation energy that is received by the surface, with thresholds of 0–1where ai = grayscale value of Band i in Landsat 8.
(8)
Landscape Pattern Index
The landscape pattern index summarizes the landscape pattern of all land use types and reflects the structure and spatial characteristics of different landscape patches (Zhang et al. 2013). It is used to analyze the landscape patch pattern and is calculated using Fragstats 4.2 software. This study drew lessons from existing research (Zhou et al. 2014a) and selected the landscape pattern index, which is highly related to the UTE. The specific indicators and their definitions are given in Table 4.
| Landscape pattern index | Ecological meaning |
|---|---|
| CA | Total patch area of a certain type of landscape |
| Patch density (PD) | Patch density (PD) shows the density of certain patches in the landscape, which could reflect the overall heterogeneity and fragmentation of the landscape and the fragmentation of a certain type and reflect the heterogeneity of the landscape unit area |
| LPI | Percentage of the largest patch area in the total area of the landscape type, which is a measure of dominance at the patch level and reflects the direction and strength of human activities |
| LSI | Describes the shape characteristics of landscape types: the larger the value, the more complex the landscape boundary and the more small patches |
| AI | Indicates the degree of cohesion between the same type of plaque. The smaller the AI, the lower the degree of cohesion, and vice versa |
| DIVISION | The degree of separation of individual distributions with different patch numbers in a landscape type |
| SHDI | Reflects the diversity of landscape types, the greater the SHDI value, the richer the land use and the higher the degree of fragmentation, the greater the uncertain information content |
Analytical Method
To effectively analyze the correlation between each factor and the spatial pattern of the UTE, a grid element with a side length of 1,000 m was constructed according to the area of the study area and the spatial resolution of the existing data to realize the unity of the multisource data. The mean value of the original LST grid data was assigned to the corresponding grid unit using ArcGIS10.8 software. Then, the intercepted image data were vectorized and projected by ArcGIS10.8, which considered the crawled Baidu thermal map data and the relatively high and low values of the population distribution for each grid in Hangzhou were obtained. The average values were assigned to the grid unit.
Results
Spatiotemporal Evolution Characteristics of the UTE
Spatiotemporal Characteristics
The spatiotemporal distributions of the surface temperature that were derived from remote sensing in 2000, 2010, and 2021 are shown in Fig. 3. Hangzhou’s UTE has constantly increased from 2000 to 2021. The distribution of the surface temperature levels was irregularly scattered and gradually spread from the city center to the peripheral areas. The highest temperatures occurred in densely populated areas that featured heavy industry, such as Wulin Square in the central Gongshu District, the industrial park in the central Xiaoshan District, and the Xiasha industrial region in the western Qiantang District. The lowest temperatures were primarily in river water areas and wetland parks, such as the West Lake water area in the northeastern Xihu District and the Hangzhou Banshan Forest Park Region, where Gongshu, Shangcheng, and Linping Districts meet. These relatively large water bodies and green spaces have excellent cooling features and could segment the urban thermal field, which is vital when modulating the UTE condition (Wang et al. 2016; Zhou et al. 2014b).
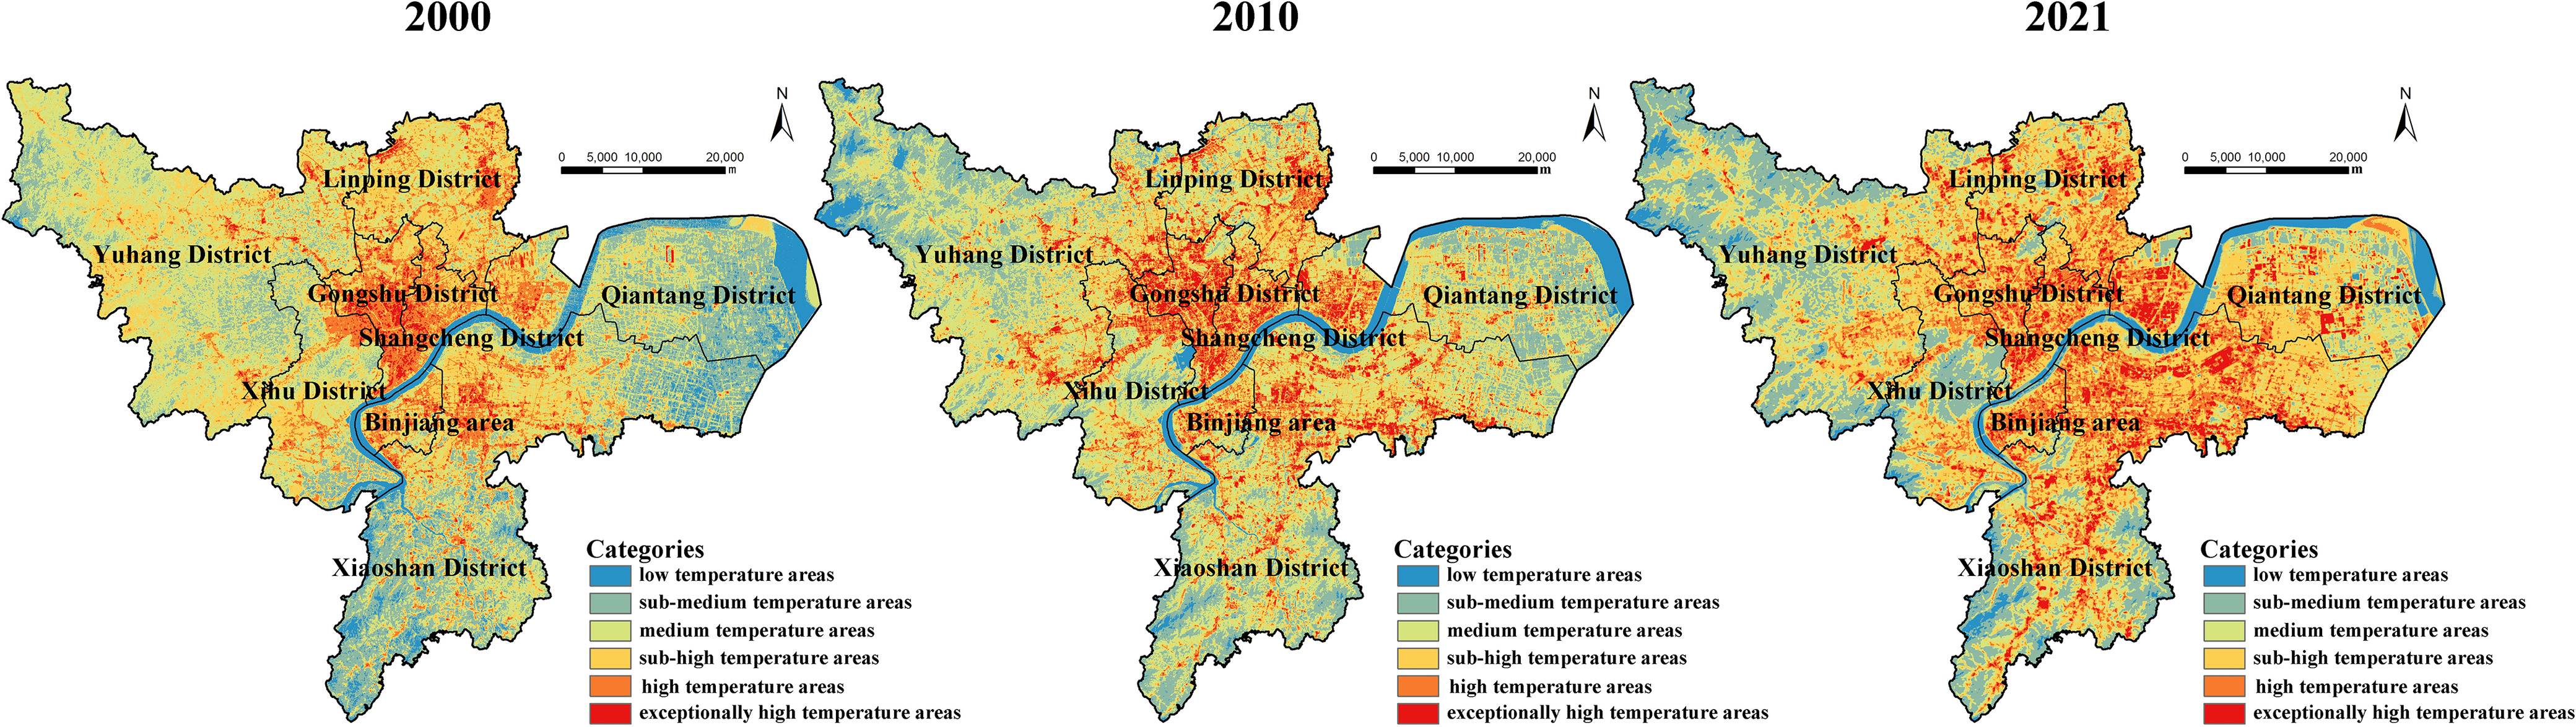
Fig. 3. Spatial distribution of surface temperature in Hangzhou in 2000, 2010, and 2021.
According to the comparison between three-period sequential results, from 2000–2021, medium, secondary high, high, and exceptionally high-temperature zones have constantly expanded along with urban built-up regions. Specifically, the increase in urban heat island zones in Xiaoshan and Yuhang Districts was the most significant and considerably higher than in other urban areas. The growth rate of the urban heat island area in the core urban districts (e.g., Shangcheng, Gongshu, Xihu, and Binjiang) was notably lower than the change rate in the peripheral urban districts. The small change varied with the year. The alteration in the spatial pattern of Hangzhou’s UTE was correlated with the changes in urban construction intensity, and the direction of its coverage extension aligned with the expanding direction of Hangzhou’s built-up area (Fig. 4).
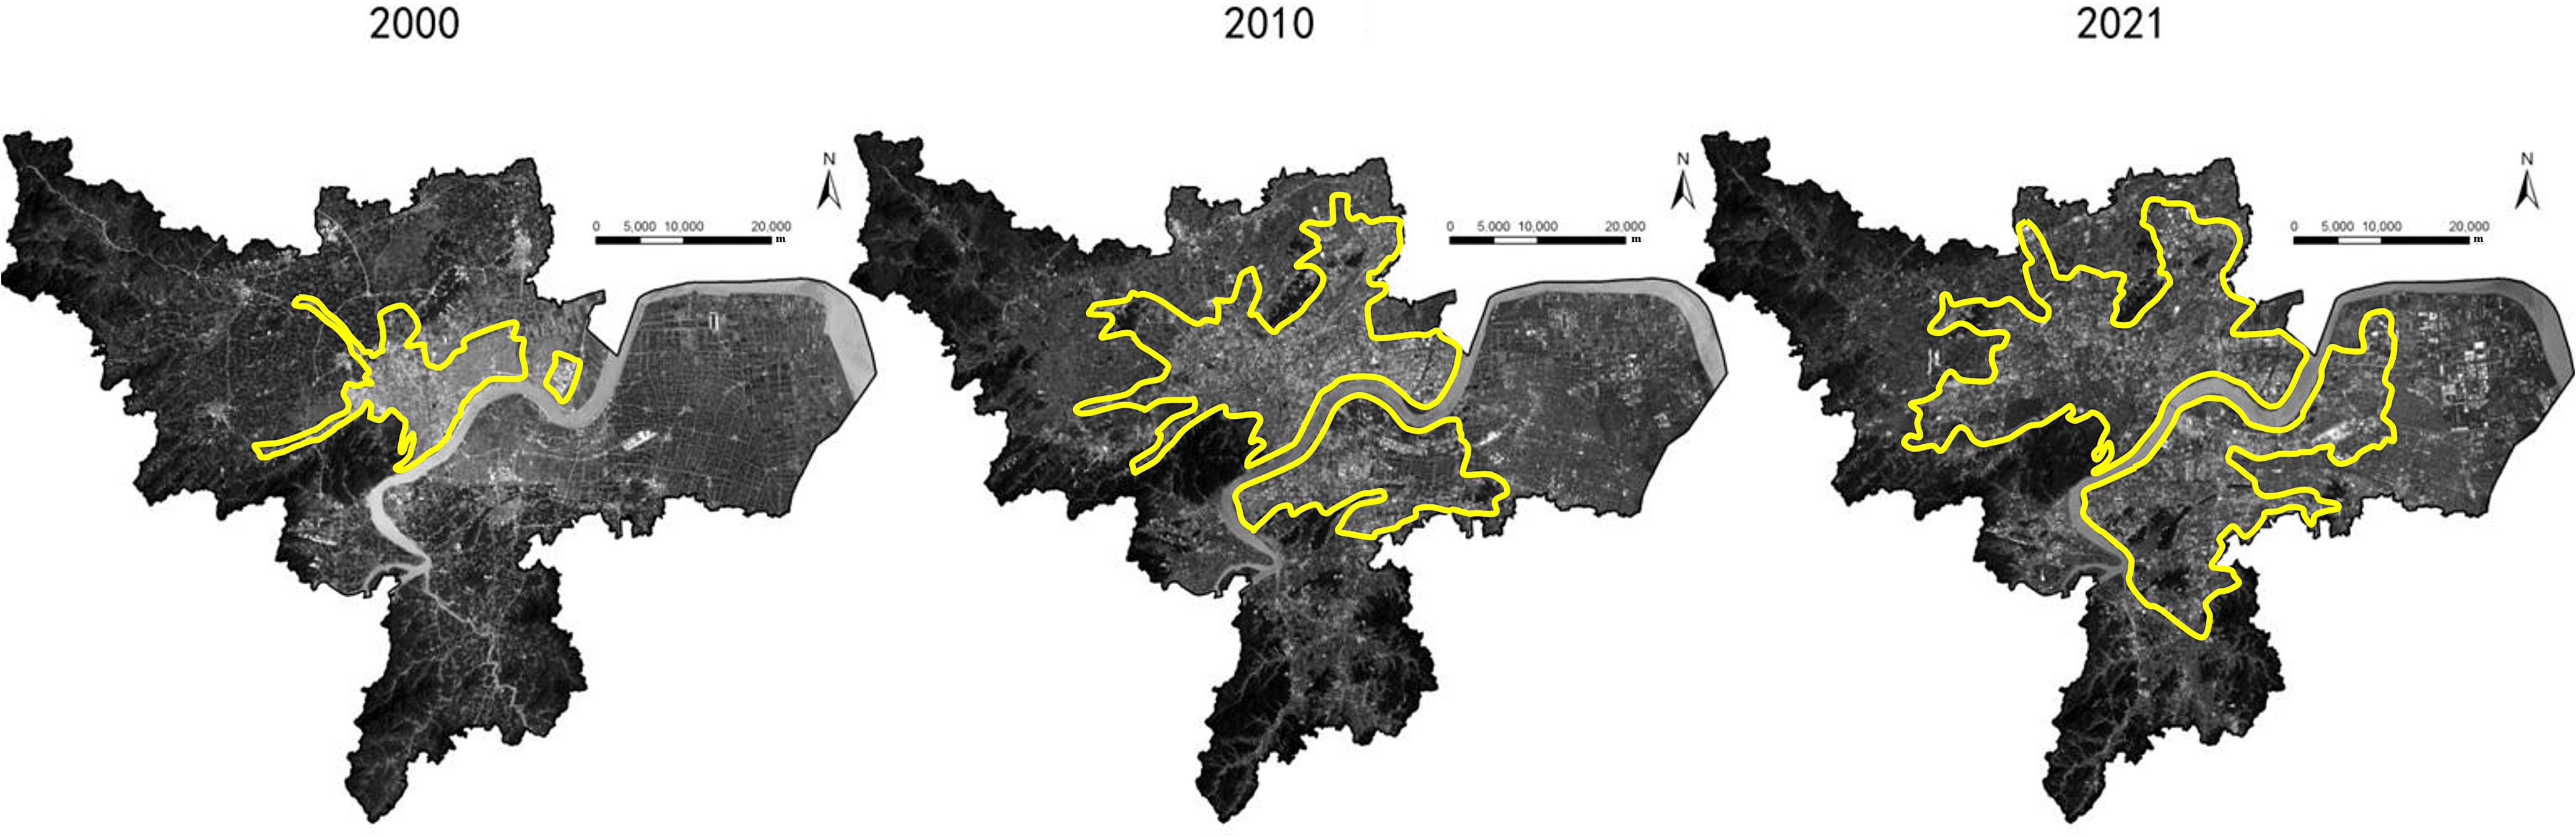
Fig. 4. Scope of urban built-up area of Hangzhou in 2000, 2010, and 2021.
For a more detailed comprehension of the spatiotemporal evolution of the Hangzhou UTE, the areas of each temperature level were tallied in 2000, 2010, and 2021. The results are given in Table 5. A comparison between the surface temperature partition area of Hangzhou in 2000, 2010, and 2021 showed that the distribution area of low-, sub-medium, and medium-temperature zones has gradually declined. The proportion dropped from 60.33% in 2000 to 43.7% in 2021, which represented a decrease of approximately 20%, and exhibited a trend that evolved from lower-temperature zones to secondary high-temperature zones. In 2000, the total area of Hangzhou’s urban heat island was 1,475.414 km2, which increased to 1,515.56 km2 in 2010 and reached 2,098.154 km2 in 2021, which represents an increase of 622.74 km2 from 2000–2021, with a growth rate of 42.2%. Among all surface temperatures, the sub-high-temperature zone was 943.93 km2 in 2000, reached 820.28 km2 in 2010, and increased to 1,179.40 km2 in 2021. From 2000–2021, the sub-high-temperature zone underwent a decrease-then-increase fluctuation; however, the overall growth trend was constant, with an increase of 235.47 km2. In 2010, the high-temperature zone in Hangzhou increased by approximately 33 km2 compared with that in 2000 and reached a growth rate of 51% in 2021 compared with that in 2000. The particularly high-temperature zone exhibited a continuous and rapidly increasing trend. It was 78.17 km2 in 2000, approximately three times larger than what was recorded for 2010. However, the growth trend persisted; by 2021, it increased by 26.36 km2 compared with 2000, albeit at a slower growth rate. During 2000–2010, with the significant increase in Hangzhou’s urban land expansion scale, the LST increased due to multifactorial artificial influences, such as population urbanization, economic agglomeration, industrial suburbanization, real estate suburbanization, development of high-tech campus areas, and the construction of intercity traffic facilities such as highways. The urban heat island zone clusters increased and continuously stretched to the urban outskirts, which caused drastic changes in the UTE pattern. During 2010–2021, due to the slowdown in the urban development rate, the surface temperature level in the central urban area did not significantly increase. The added urban heat island area decreased, but the urban heat island zone scope continued to expand, exhibiting the UTE.
| Year | Low-temperature areas | Sub-medium- temperature areas | Medium- temperature areas | Sub-high- temperature areas | High-temperature areas | Exceptionally high-temperature areas |
|---|---|---|---|---|---|---|
| 2000 | 217.44 | 802.39 | 1,224.71 | 943.93 | 453.31 | 78.17 |
| 2010 | 202.44 | 755.39 | 1,246.85 | 820.28 | 488.28 | 207.01 |
| 2021 | 169.61 | 732.86 | 726.16 | 1,179.40 | 685.38 | 233.37 |
Surface Temperature Characteristics on Grid-Scale in 2021
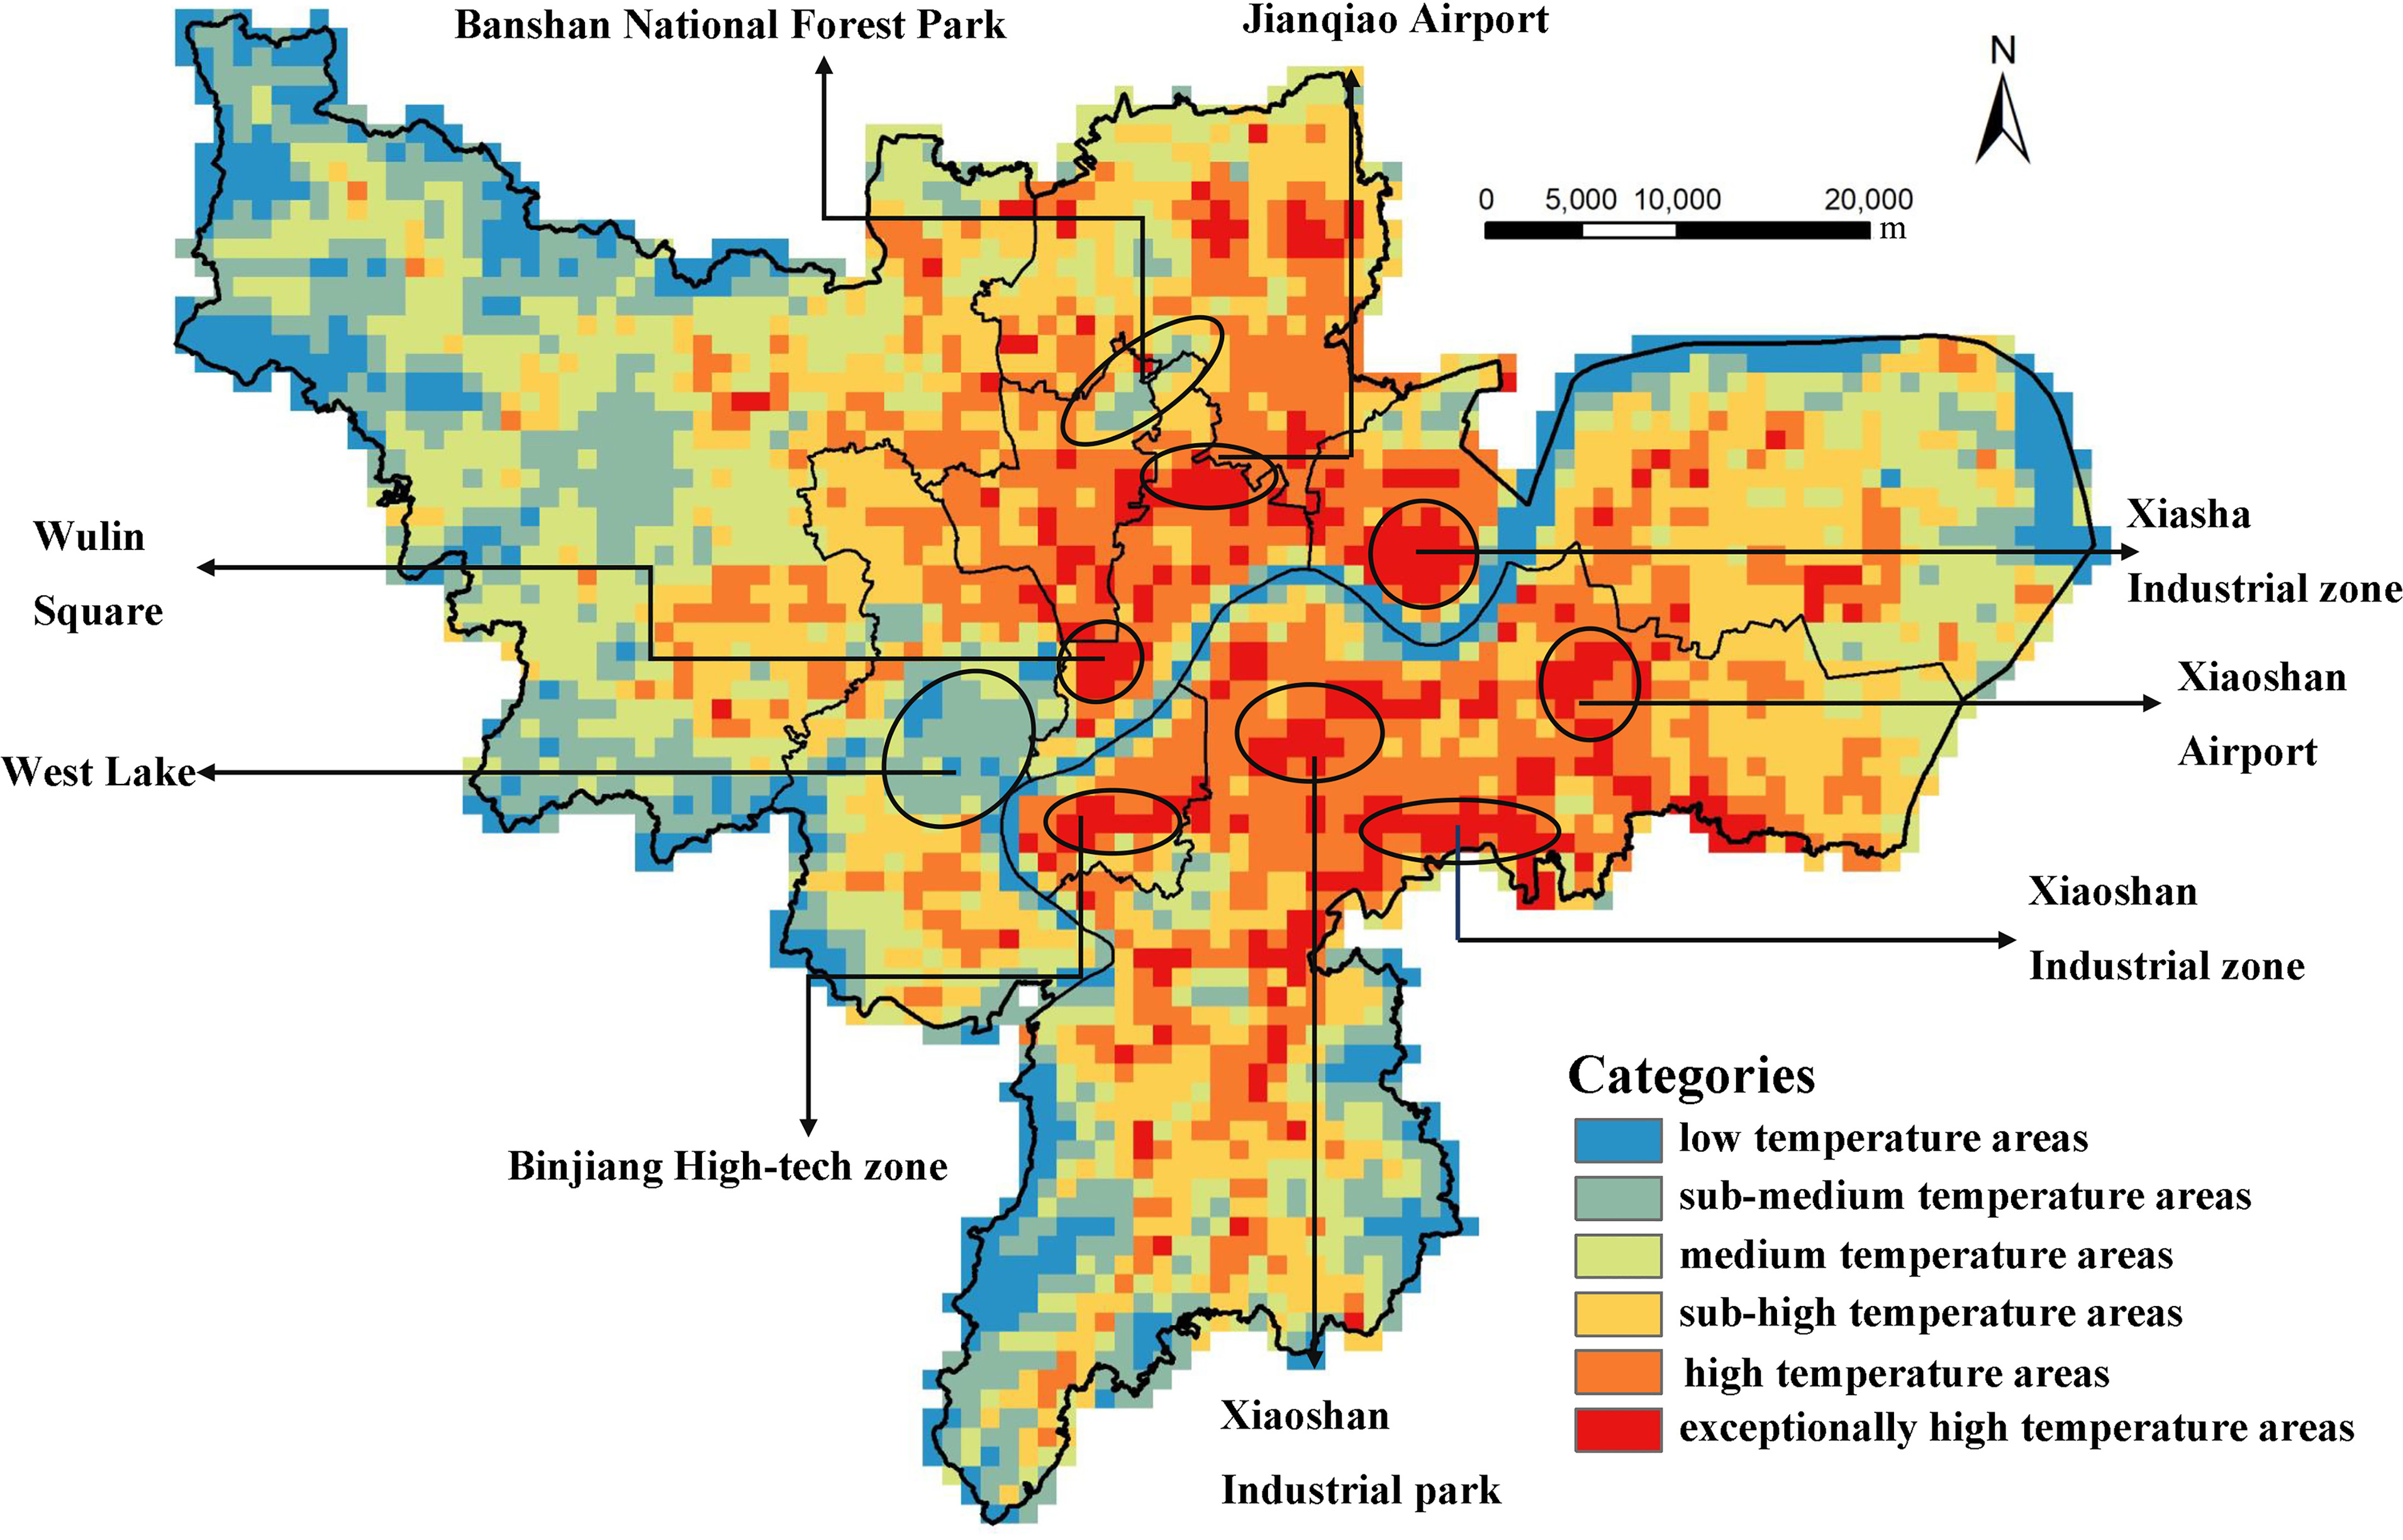
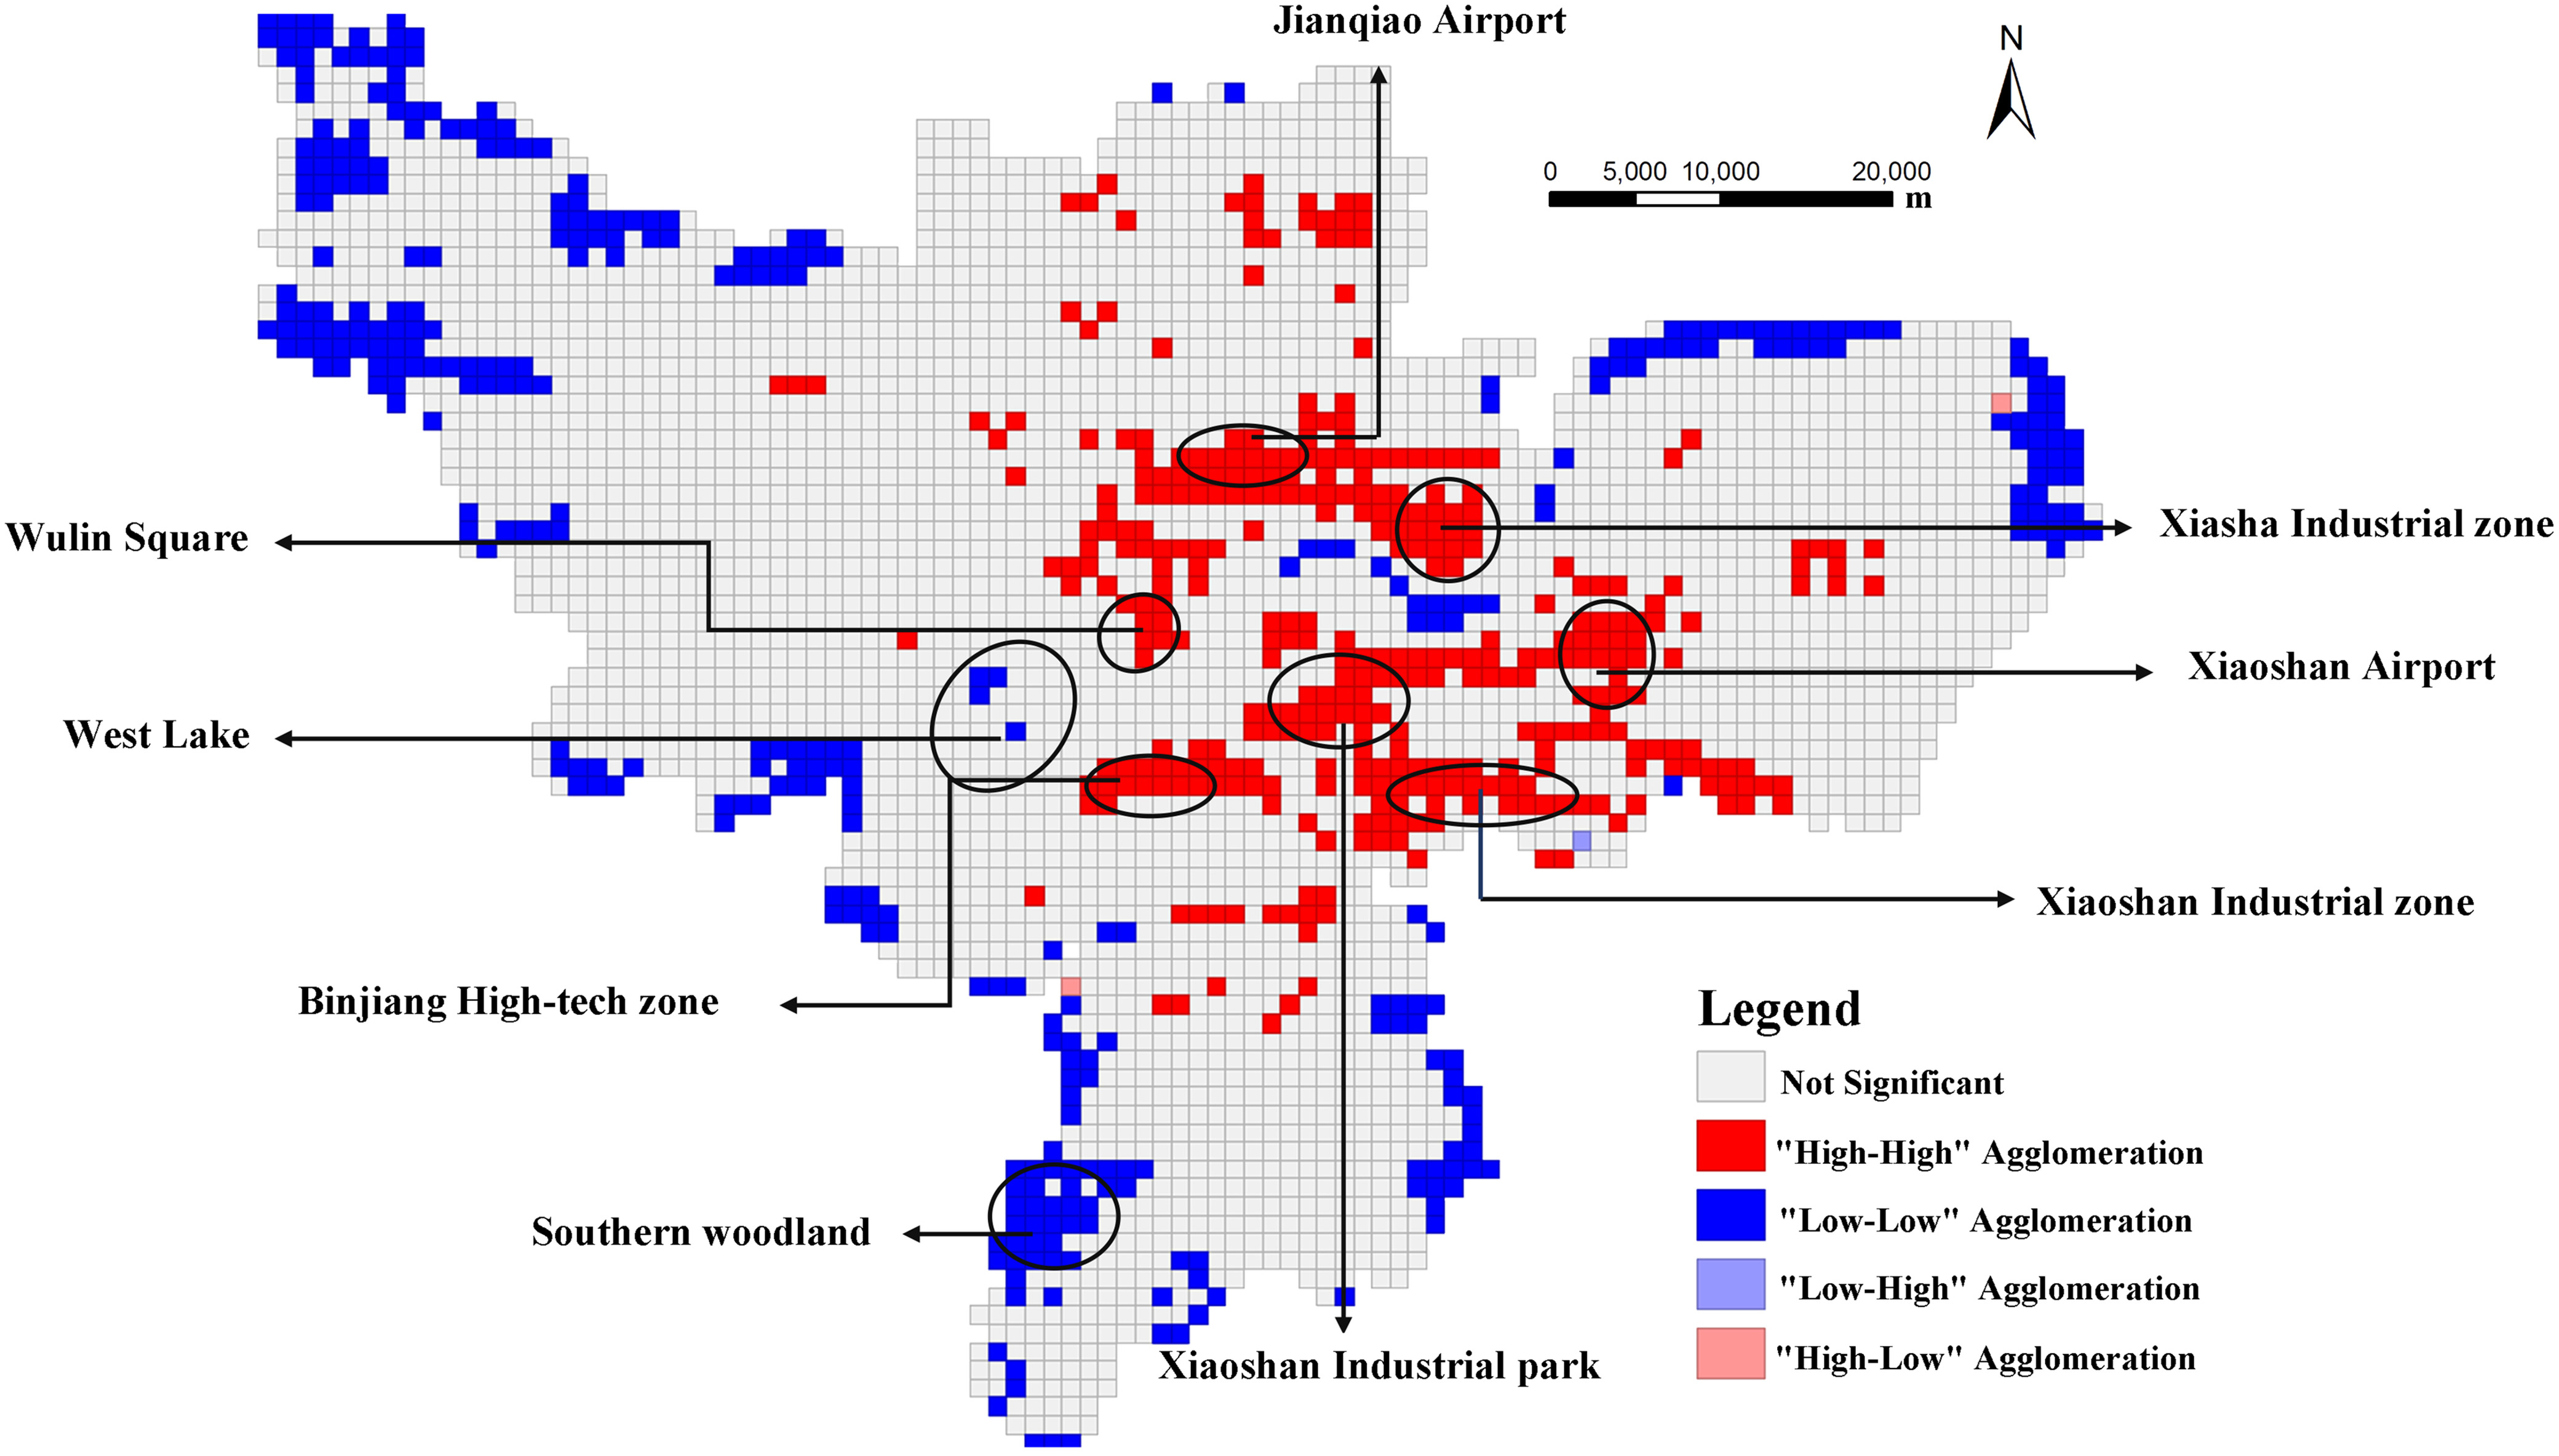
The results when the surface temperature data of 2021 were considered in the grid are shown in Fig. 5. Among all the grids, 1,883 grids surpassed the average surface temperature of 33.53°C in Hangzhou City, which accounted for 51.67% of the study area, and implied the vast prevalence of urban heat island areas, some of which were extremely severe. The grid data indicated that the global spatial autocorrelation index of the UTE, which is Moran’s I index, was 0.77 (Fig. 6), which indicated a high degree of clustering in the spatial distribution of the UTE. Further measurements of the local Moran’s I showed that 718 grid spaces significantly exhibited spatial autocorrelation. The number of grids in the high–high and low–low types were 354 and 364, respectively, which indicated a substantial degree of spatial clustering. The high-temperature zones tended to be concentrated in densely populated areas, such as Wulin Square, Jianqiao Airport, Xiasha Industrial Zone, and Xiaoshan International Airport. These are densely built-up areas and populous commercial districts, which indicates local concentration and overall dispersion. Many areas were covered with substantial vegetation, water systems, and lakes, and the suburban regions that surround the city are mainly the low-temperature zones in the urban area.
Key Factors that Influence the UTE
Correlation Study
This study took the index and surface temperature values for 2021 as the base values, input the data into SPSS 24.0 for Pearson’s correlation analysis, and obtained Pearson’s correlation coefficients between each index and surface temperature. Table 6 reveals significant negative correlations within the natural factors among FVC, MNDWI, and DEM. The NDISI, NDBBI, Albedo, and Baidu Maps heat indexes demonstrated a significant positive correlation with surface temperature. As the built-up area expanded and the impervious area increased, the surface temperature increased accordingly. This reflected the impact of urban construction intensity and human activity on the UTE. Specifically, a high-intensity built-up area with a high proportion of impervious surface areas had faster heat absorption and slower heat dissipation. In addition, it had a high proportion of anthropogenic heat emissions and was susceptible to the formation of a UTE, which resulted in heat island disasters (Ramaiah et al. 2020; Xian et al. 2022). The SHDI showed strong relevance within the landscape morphology factors; it reflects landscape heterogeneity and could characterize complex situations of landscape patch distribution. The index had a significant positive correlation with surface temperature, which implied that when the land use types in patches were more diverse and the landscape richness was more pronounced, the corresponding surface temperature was higher, and the UTE was more prominent. Areas with high SHDI values were in Hangzhou’s central city areas, which had numerous land use types and correspondingly high surface temperatures. In addition, the low-temperature zones in the outer city were mainly green spaces and water bodies. These areas have a single type of land use and correspondingly lower surface temperatures.
| Influence factor | Pearson’s correlation coefficient |
|---|---|
| CA | 0.265** |
| Patch density (PD) | 0.055** |
| LPI | −0.274** |
| LSI | 0.401** |
| DIVISION | 0.348** |
| SHDI | 0.423** |
| AI | −0.355** |
| NDISI | 0.888** |
| MNDWI | −0.287** |
| FVC | −0.510** |
| BMT | 0.109** |
| Albedo | 0.190** |
| NDBBI | 0.879** |
| DEM | −0.556** |
Note: **p < 0.01.
The PD and LSI were positively correlated with surface temperature; these two landscape pattern indexes could collectively reflect the dispersion features of urban land use. The DIVISION characterizes the process of a landscape transitioning from a single, homogeneous, and continuous whole to a complex, heterogeneous, and discontinuous patchwork due to natural or artificial disturbances (Zhou et al. 2011).
Principal Component Analysis
A spatial principal component analysis was carried out after normalizing each factor to explore the contribution of each influencing factor to the UTE better. The first four principal components had eigenvalues > 1, which indicated that the pattern of the UTE in Hangzhou was influenced by these factors that incorporated natural and social elements. Table 7 highlights that the first principal component included the LSI, DIVISION, and SHDI. It primarily illustrates the influence of landscape patterns on the UTE in the study area. The second principal component could be generalized as the impact of natural factors on the surface temperature, which included the FVC, MNDWI, and DEM. The third and fourth principal components reflected the impact of construction activity intensity on the UTE, as represented by the NDISI and the NDBBI.
| Influence factor | Composition | |||
|---|---|---|---|---|
| C1 | C2 | C3 | C4 | |
| CA | 0.128 | 0.001 | 0.385 | −0.543 |
| Patch density (PD) | 0.086 | 0.034 | −0.331 | 0.613 |
| LPI | −0.358 | −0.114 | 0.239 | 0.161 |
| LSI | 0.384 | 0.089 | −0.113 | −0.111 |
| DIVISION | 0.381 | 0.114 | −0.194 | −0.145 |
| SHDI | 0.390 | 0.052 | −0.123 | −0.121 |
| AI | −0.361 | −0.089 | 0.245 | −0.104 |
| NDISI | 0.305 | −0.100 | 0.405 | 0.287 |
| MNDWI | −0.010 | −0.572 | −0.287 | −0.137 |
| FVC | −0.178 | 0.518 | −0.185 | −0.152 |
| BMT | 0.064 | −0.057 | 0.090 | −0.044 |
| Albedo | 0.018 | 0.534 | 0.168 | 0.049 |
| NDBBI | 0.244 | 0.030 | 0.478 | 0.337 |
| DEM | −0.290 | 0.241 | −0.116 | 0.050 |
To further analyze the impact of the principal component factors on the UTE, 600 random samples were selected in ArcGIS 10.8 for numeric extraction. The average values of each principal component simulation index in the samples and the average normalized surface temperature values were analyzed in SPSS 24.0 for linear regression fitting. The results showed that the significance level was below 1%, and the variance inflation factor was under 10, which indicated no multicollinearity in the model. Therefore, the four principal components were pivotal factors that influenced the UTE of Hangzhou. Then, a standardized regression model was used to compare the interactions among various dimensionless indicators for each principal component, which reduced potential redundancy. The results showed that for every unit change in the 14 influencing factors, the surface temperature in the study area changed by 0.061, 0.144, −0.101, 0.192, 0.144, 0.186, −0.197, 0.496, −0.22, −0.231, 0.065, 0.139, 0.511, and −0.226 units. If the impact level of each factor and their collective influence were considered, the overall temperature was projected to increase by 0.965°C. This finding indicated that social factors play a more important role in contributing to the surface temperature than natural factors.
The natural and social factors contributed to the change in the surface temperature in the study area, and the contribution of the social factors to the surface temperature was larger than that of the natural factors.
Specific Area
In the last two decades, Hangzhou has undergone rapid development, particularly in the Wulin Square and Lakeside areas, which has led to an escalation in land development. This condition has led to a high population density and a complex urban pattern, marked by densely populated areas and concentrated heat sources. The cumulative effect of these urban activities has exacerbated the rise in the urban surface temperature. In addition, the Xiaoshan industrial area that surrounds the city, marked by extensive hard pavement and industrial production activities, generates a substantial UTE. The expansion of these industrial zones, along with the encroachment into original green spaces and water bodies, has led to urban landscape fragmentation. The diminished presence of greenery and water, which includes other blue–green facilities, further contributed to the persistent increase in the surface temperature in these areas.
Discussion
If the cumulative impact of natural and social factors and the land use patterns on Hangzhou’s UTE were considered, control policies from three aspects of urban land use, spatial form, and public policy, should be proposed to alleviate the effects of the urban heat island and enhance the overall urban carrying capacity. For urban land use, limiting the sprawling development that is caused by rapid urbanization, continuously adjusting and optimizing the arrangement of urban construction land, reducing the degree of land fragmentation, integrating fragmented ecological landscape resources, and organically connecting scattered bodies of water and green spaces to form a network system are necessary to alleviate the UTE (Liu and Jensen 2018). For urban spatial form, a multicenter layout pattern for the city should be adopted, and various types of urban sponge bodies should be created within the centers to form a progressive cool island system with sponge bodies at different levels (Chan et al. 2018; Nguyen et al. 2019). In addition, the focus should be on constructing urban ventilation corridors to accelerate air circulation within the cluster to lower the UTE. For urban public policy, governments at all levels should release heatwave forecasts and emergency response guidelines promptly to protect residents from the effects of urban heat islands. Emergency systems for heat avoidance should be set up, and spaces and facilities for high-temperature emergencies should be identified to minimize the adverse impacts of the UTE.
This study has not investigated the nighttime UTE due to the temporal resolution limitations of Landsat data. It lacks an understanding of the influence of various factors on the UTE at night. Therefore, subsequent studies should strengthen the integration of various remote sensing images and cooperate with existing big data to examine the UTE in multiple periods. In addition, the complexity and uncertainty of climate change require further long-term monitoring and in-depth exploration of the UTE.
Conclusion
This study employed Landsat remote sensing data to analyze the spatiotemporal differentiation pattern of surface temperatures in Hangzhou for 2000, 2010, and 2021. Along with various multisource spatial data, such as land use and population thermal data, this study utilized correlation and principal component analysis to investigate the factors that influence the changes in the urban surface temperature and their respective contributions. The findings offered a theoretical foundation and decision-making support for enhancing the quality of the living environment and advancing the development of sponge cities. First, based on the remote sensing image inversion, the spatial distribution characteristics of the UTE in Hangzhou in 2000, 2010, and 2021 were revealed. This study found a radiating trend from the center outward for the UTE in Hangzhou between 2000 and 2021, with the heat island area increasing by 622.74 km2. The spatial patterning of the UTE showed significant unevenness and agglomeration. The urban heat island area was concentrated in a built-up area and extended along the direction of urban development. Second, Pearson’s correlation analysis results revealed that the major land use structures affected the UTE. The natural factors significantly exhibited an inverse correlation with the surface temperature. The surface temperature decreased as the water body and vegetation cover increased, and the altitude rose. These findings suggest that vegetation cover, water bodies, and elevation significantly reduced the UTE, which aligned with the most current research (Mariani et al. 2016; Tran et al. 2017; Peng et al. 2018). The social factors are significantly positively correlated with temperature, which indicates that increasing urban construction and human activity intensified the UTE. Recently, the high-intensity urban construction in the four core city districts of Hangzhou has led to a high PD and complex land use patterns along the landscape borders, therefore intensifying the UTE to a certain extent. In addition, the expansion of built-up areas, such as the Yuhang, Xiaoshan, and Xiaosha Districts, has encroached on the original green areas and waters. This condition resulted in a decentralized and fragmented land use pattern in the city, with an increase in surface temperature. Third, the principal component analysis results uncovered the principal impact indicators and their contributions to Hangzhou’s UTE. The social factors are the major contributors to the change in the UTE. Specifically, social factors, such as the NDISI and NDBBI, have the most prominent positive impact, which were 0.496 and 0.511. Therefore, optimizing the utilization rate of urban land resources and inhibiting the disorderly spread of urban development is one of the most effective approaches to reducing the UTE (Algretawee et al. 2019; Peng et al. 2021). Natural factors, such as the FVC, MNDWI, and DEM, negatively affected the surface temperature with contributions of −0.22, −0.231, and −0.226. However, the contributions were significantly smaller than those of human construction activities to the surface temperature. This suggested that natural factors primarily affected surface temperature with basal restrictions on human construction activities.
Data Availability Statement
Some or all data, models, or codes that support the findings of this study are available from the corresponding author upon reasonable request.
Acknowledgments
This study was supported by the National Natural Science Foundation of China (52278083), Zhejiang Provincial Philosophy and Social Sciences Planning Project (24NDJC269YBM), and the Scientific Research Fund of Zhejiang Provincial Education Department Province (Y202248791). We would like to thank the anonymous reviewers for their constructive comments.
References
Algretawee, H., S. Rayburg, and M. Neave. 2019. “Estimating the effect of park proximity to the central of Melbourne city on Urban Heat Island (UHI) relative to Land Surface Temperature (LST).” Ecol. Eng. 138: 374–390. https://doi.org/10.1016/j.ecoleng.2019.07.034.
Anniballe, R., S. Bonafoni, and M. Pichierri. 2014. “Spatial and temporal trends of the surface and air heat island over Milan using MODIS data.” Remote Sens. Environ. 150: 163–171. https://doi.org/10.1016/j.rse.2014.05.005.
Baidu. 2021. “Baidu map thermal index.” Baidu, Inc. Accessed August 30, 2023. https://map.baidu.com.
Bokaie, M., M. K. Zarkesh, P. D. Arasteh, and A. Hosseini. 2016. “Assessment of urban heat island based on the relationship between land surface temperature and land Use/ land cover in Tehran.” Sustainable Cities Soc. 23: 94–104. https://doi.org/10.1016/j.scs.2016.03.009.
Cai, G., M. Du, and Y. Xue. 2011. “Monitoring of urban heat island effect in Beijing combining ASTER and TM data.” Int. J. Remote Sens. 32 (5): 1213–1232. https://doi.org/10.1080/01431160903469079.
Carlson, T. N., and S. T. Arthur. 2000. “The impact of land use—Land cover changes due to urbanization on surface microclimate and hydrology: A satellite perspective.” Global Planet. Change 25 (1–2): 49–65. https://doi.org/10.1016/S0921-8181(00)00021-7.
Chan, F. K. S., J. A. Griffiths, D. Higgitt, S. Xu, F. Zhu, Y.-T. Tang, Y. Xu, and C. R. Thorne. 2018. “‘Sponge City” in China—A breakthrough of planning and flood risk management in the urban context.” Land Use Policy 76: 772–778. https://doi.org/10.1016/j.landusepol.2018.03.005.
Clinton, N., and P. Gong. 2013. “MODIS detected surface urban heat islands and sinks: Global locations and controls.” Remote Sens. Environ. 134: 294–304. https://doi.org/10.1016/j.rse.2013.03.008.
Connors, J. P., C. S. Galletti, and W. T. L. Chow. 2013. “Landscape configuration and urban heat island effects: Assessing the relationship between landscape characteristics and land surface temperature in Phoenix, Arizona.” Landscape Ecol. 28: 271–283. https://doi.org/10.1007/s10980-012-9833-1.
Coseo, P., and L. Larsen. 2014. “How factors of land use/land cover, building configuration, and adjacent heat sources and sinks explain Urban Heat Islands in Chicago.” Landscape Urban Plann. 125: 117–129. https://doi.org/10.1016/j.landurbplan.2014.02.019.
Du, H., D. Wang, Y. Wang, X. Zhao, F. Qin, H. Jiang, and Y. Cai. 2016. “Influences of land cover types, meteorological conditions, anthropogenic heat and urban area on surface urban heat island in the Yangtze River Delta Urban Agglomeration.” Sci. Total Environ. 571: 461–470. https://doi.org/10.1016/j.scitotenv.2016.07.012.
Firozjaei, M. K., M. Kiavarz, S. K. Alavipanah, T. Lakes, and S. Qureshi. 2018. “Monitoring and forecasting heat island intensity through multi-temporal image analysis and cellular automata-Markov chain modelling: A case of Babol city, Iran.” Ecol. Indic. 91: 155–170. https://doi.org/10.1016/j.ecolind.2018.03.052.
Geodata. n.d. “Digital elevation model data.” National Earth System Science Data Center. Accessed August 30, 2023. https://www.geodata.cn/.
Grimm, N. B., S. H. Faeth, N. E. Golubiewski, C. L. Redman, J. Wu, X. Bai, and J. M. Briggs. 2008. “Global change and the ecology of cities.” Science 319 (5864): 756–760. https://doi.org/10.1126/science.1150195.
Grover, A., and R. Singh. 2015. “Analysis of urban heat island (UHI) in relation to normalized difference vegetation index (NDVI): A comparative study of Delhi and Mumbai.” Environments 2 (2): 125–138. https://doi.org/10.3390/environments2020125.
GSCloud. n.d. “LST data.” Computer Network Information Center, Chinese Academy of Sciences. Accessed August 30, 2023. https://www.gscloud.cn.
Hong, J.-W., J. Hong, E. E. Kwon, and D. K. Yoon. 2019. “Temporal dynamics of urban heat island correlated with the socio-economic development over the past half-century in Seoul, Korea.” Environ. Pollut. 254: 112934. https://doi.org/10.1016/j.envpol.2019.07.102.
IPCC (Intergovernmental Panel on Climate Change). 2014. Climate change 2014: Impacts, adaptation, and vulnerability. Cambridge, UK: Cambridge University Press.
Kuang, W., Y. Liu, Y. Dou, W. Chi, G. Chen, C. Gao, T. Yang, J. Liu, and R. Zhang. 2015. “What are hot and what are not in an urban landscape: Quantifying and explaining the land surface temperature pattern in Beijing, China.” Landscape Ecol. 30: 357–373. https://doi.org/10.1007/s10980-014-0128-6.
Liu, H., B. Huang, S. Gao, J. Wang, C. Yang, and R. Li. 2021. “Impacts of the evolving urban development on intra-urban surface thermal environment: Evidence from 323 Chinese cities.” Sci. Total Environ. 771: 144810. https://doi.org/10.1016/j.scitotenv.2020.144810.
Liu, L., and M. B. Jensen. 2018. “Green infrastructure for sustainable urban water management: Practices of five forerunner cities.” Cities 74: 126–133. https://doi.org/10.1016/j.cities.2017.11.013.
Liu, X., Y. Ming, Y. Liu, W. Yue, and G. Han. 2022. “Influences of landform and urban form factors on urban heat island: Comparative case study between Chengdu and Chongqing.” Sci. Total Environ. 820: 153395. https://doi.org/10.1016/j.scitotenv.2022.153395.
Liu, Y., Y. Xu, J. Ma, and W. Quan. 2014. “Quantitative assessment and planning simulation of Beijing urban heat island.” Ecol. Environ. Sci. 23 (7): 1156–1163.
Mariani, L., S. G. Parisi, G. Cola, R. Lafortezza, G. Colangelo, and G. Sanesi. 2016. “Climatological analysis of the mitigating effect of vegetation on the urban heat island of Milan, Italy.” Sci. Total Environ. 569-570: 762–773. https://doi.org/10.1016/j.scitotenv.2016.06.111.
Middel, A., K. Häb, A. J. Brazel, C. A. Martin, and S. Guhathakurta. 2014. “Impact of urban form and design on mid-afternoon microclimate in Phoenix Local Climate Zones.” Landscape Urban Plann. 122: 16–28. https://doi.org/10.1016/j.landurbplan.2013.11.004.
Ministry of Housing and Urban-Rural Development of the People’s Republic of China. 2011. Urban land use classification and planning construction land use standards. Beijing: China Architecture Publishing & Media Co., Ltd.
Nguyen, T. T., H. H. Ngo, W. Guo, X. C. Wang, N. Ren, G. Li, J. Ding, and H. Liang. 2019. “Implementation of a specific urban water management-Sponge City.” Sci. Total Environ. 652: 147–162. https://doi.org/10.1016/j.scitotenv.2018.10.168.
Ogashawara, I., and V. Bastos. 2012. “A quantitative approach for analyzing the relationship between urban heat islands and land cover.” Remote Sens. 4 (11): 3596–3618. https://doi.org/10.3390/rs4113596.
Oleson, K. W., G. B. Anderson, B. Jones, S. A. McGinnis, and B. Sanderson. 2018. “Avoided climate impacts of urban and rural heat and cold waves over the U.S. using large climate model ensembles for RCP8.5 and RCP4.5.” Clim. Change 146: 377–392. https://doi.org/10.1007/s10584-015-1504-1.
Patz, J. A., D. Campbell-Lendrum, T. Holloway, and J. A. Foley. 2005. “Impact of regional climate change on human health.” Nature 438 (7066): 310–317. https://doi.org/10.1038/nature04188.
Peng, J., Y. Dan, R. Qiao, Y. Liu, J. Dong, and J. Wu. 2021. “How to quantify the cooling effect of urban parks? Linking maximum and accumulation perspectives.” Remote Sens. Environ. 252: 112135. https://doi.org/10.1016/j.rse.2020.112135.
Peng, J., J. Ma, Q. Liu, Y. Liu, Y. Hu, Y. Li, and Y. Yue. 2018. “Spatial-temporal change of land surface temperature across 285 cities in China: An urban-rural contrast perspective.” Sci. Total Environ. 635: 487–497. https://doi.org/10.1016/j.scitotenv.2018.04.105.
Peng, J., P. Xie, Y. Liu, and J. Ma. 2016. “Urban thermal environment dynamics and associated landscape pattern factors: A case study in the Beijing metropolitan region.” Remote Sens. Environ. 173: 145–155. https://doi.org/10.1016/j.rse.2015.11.027.
Ramaiah, M., R. Avtar, and M. M. Rahman. 2020. “Land cover influences on LST in two proposed smart cities of India: Comparative analysis using spectral indices.” Land 9 (9): 292. https://doi.org/10.3390/land9090292.
Ren, T., W. Zhou, and J. Wang. 2021. “Beyond intensity of urban heat island effect: A continental scale analysis on land surface temperature in major Chinese cities.” Sci. Total Environ. 791: 148334. https://doi.org/10.1016/j.scitotenv.2021.148334.
Sobrino, J. A., R. Oltra-Carrió, G. Sòria, R. Bianchi, and M. Paganini. 2012. “Impact of spatial resolution and satellite overpass time on evaluation of the surface urban heat island effects.” Remote Sens. Environ. 117: 50–56. https://doi.org/10.1016/j.rse.2011.04.042.
Stewart, I. D. 2011. “A systematic review and scientific critique of methodology in modern urban heat island literature.” Int. J. Climatol. 31 (2): 200–217. https://doi.org/10.1002/joc.2141.
Streutker, D. R. 2002. “A remote sensing study of the urban heat island of Houston, Texas.” Int. J. Remote Sens. 23 (13): 2595–2608. https://doi.org/10.1080/01431160110115023.
Tran, D. X., F. Pla, P. Latorre-Carmona, S. W. Myint, M. Caetano, and H. V. Kieu. 2017. “Characterizing the relationship between land use land cover change and land surface temperature.” ISPRS J. Photogramm. Remote Sens. 124: 119–132. https://doi.org/10.1016/j.isprsjprs.2017.01.001.
USGS. 2000. “Landsat 5 data set.” Accessed August 30, 2023. https://landsatlook.usgs.gov/.
USGS. 2010. “Landsat 5 data set.” Accessed August 30, 2023. https://landsatlook.usgs.gov/.
USGS. 2021. “Landsat 8 data set.” Accessed August 30, 2023. https://landsatlook.usgs.gov/.
Vicente-Serrano, S. M., J. M. Cuadrat-Prats, and M. A. Saz-Sánchez. 2005. “Spatial patterns of the urban heat island in Zaragoza (Spain).” Clim. Res. 30 (1): 61–69. https://doi.org/10.3354/cr030061.
Voogt, J. A., and T. R. Oke. 2003. “Thermal remote sensing of urban climates.” Remote Sens. Environ. 86 (3): 370–384. https://doi.org/10.1016/S0034-4257(03)00079-8.
Wang, C., S. Myint, Z. Wang, and J. Song. 2016. “Spatio-temporal modeling of the urban heat island in the Phoenix metropolitan area: Land use change implications.” Remote Sens. 8 (3): 185. https://doi.org/10.3390/rs8030185.
Weng, Q. 2009. “Thermal infrared remote sensing for urban climate and environmental studies: Methods, applications, and trends.” ISPRS J. Photogramm. Remote Sens. 64 (4): 335–344. https://doi.org/10.1016/j.isprsjprs.2009.03.007.
White, M. A., R. R. Nemani, P. E. Thornton, and S. W. Running. 2002. “Satellite evidence of phenological differences between urbanized and rural areas of the eastern United States deciduous broadleaf forest.” Ecosystems 5: 260–273. https://doi.org/10.1007/s10021-001-0070-8.
Xian, G., H. Shi, Q. Zhou, R. Auch, K. Gallo, Z. Wu, and M. Kolian. 2022. “Monitoring and characterizing multi-decadal variations of urban thermal condition using time-series thermal remote sensing and dynamic land cover data.” Remote Sens. Environ. 269: 112803. https://doi.org/10.1016/j.rse.2021.112803.
Xiong, Y., and F. Zhang. 2021. “Effect of human settlements on urban thermal environment and factor analysis based on multi-source data: A case study of Changsha city.” J. Geog. Sci. 31 (6): 819–838. https://doi.org/10.1007/s11442-021-1873-5.
Yang, Z., Y. Chen, G. Guo, Z. Zheng, and Z. Wu. 2021. “Characteristics of land surface temperature clusters: Case study of the central urban area of Guangzhou.” Sustainable Cities Soc. 73: 103140. https://doi.org/10.1016/j.scs.2021.103140.
Yao, Y., X. Chen, and J. Qian. 2018. “Research progress on the thermal environment of the urban surfaces.” Acta Ecol. Sin. 38: 1134–1147.
Ye, H., Z. Li, N. Zhang, X. Leng, D. Meng, J. Zheng, and Y. Li. 2021. “Variations in the effects of landscape patterns on the urban thermal environment during rapid urbanization (1990–2020) in megacities.” Remote Sens. 13 (17): 3415. https://doi.org/10.3390/rs13173415.
Yusuf, Y. A., B. Pradhan, and M. O. Idrees. 2014. “Spatio-temporal assessment of urban heat island effects in Kuala Lumpur metropolitan city using landsat images.” J. Indian Soc. Remote Sens. 42: 829–837. https://doi.org/10.1007/s12524-013-0342-8.
Zhang, C., J. Wu, N. B. Grimm, M. McHale, and A. Buyantuyev. 2013. “A hierarchical patch mosaic ecosystem model for urban landscapes: Model development and evaluation.” Ecol. Modell. 250: 81–100. https://doi.org/10.1016/j.ecolmodel.2012.09.020.
Zhou, D., S. Zhao, S. Liu, and L. Zhang. 2014a. “Spatiotemporal trends of terrestrial vegetation activity along the urban development intensity gradient in China's 32 major cities.” Sci. Total Environ. 488-489: 136–145. https://doi.org/10.1016/j.scitotenv.2014.04.080.
Zhou, W., G. Huang, and M. L. Cadenasso. 2011. “Does spatial configuration matter? Understanding the effects of land cover pattern on land surface temperature in urban landscapes.” Landscape Urban Plann. 102 (1): 54–63. https://doi.org/10.1016/j.landurbplan.2011.03.009.
Zhou, W., Y. Qian, X. Li, W. Li, and L. Han. 2014b. “Relationships between land cover and the surface urban heat island: Seasonal variability and effects of spatial and thematic resolution of land cover data on predicting land surface temperatures.” Landscape Ecol. 29: 153–167. https://doi.org/10.1007/s10980-013-9950-5.
Information & Authors
Information
Published In

Journal of Urban Planning and Development
Volume 150 • Issue 3 • September 2024
Copyright
This work is made available under the terms of the Creative Commons Attribution 4.0 International license, https://creativecommons.org/licenses/by/4.0/.
History
Received: Aug 30, 2023
Accepted: Mar 27, 2024
Published online: Jun 4, 2024
Published in print: Sep 1, 2024
Discussion open until: Nov 4, 2024
Authors
Metrics & Citations
Metrics
Citations
Download citation
If you have the appropriate software installed, you can download article citation data to the citation manager of your choice. Simply select your manager software from the list below and click Download.