Investigating the Spatiotemporal Pattern between Street Vitality in Historic Cities and Built Environments Using Multisource Data in Chaozhou, China
Publication: Journal of Urban Planning and Development
Volume 150, Issue 3
Abstract
Historic cities serve as a crucial historical–cultural cornerstone within urban settings, and fostering its sustainable vitality has emerged as a focal point in urban research. Multisource data have advanced large-scale vitality research. Despite keen interest in the nexus between urban vitality and the built environment, the spatiotemporal intricacies influencing street vitality in smaller urban settings like ancient city are underexplored. To fill this gap, we use Chaozhou ancient cities as a case study to examine the relationship between street vitality and the built environment. Leveraging Jacobs’ urban vitality theory and the 5D system, this study develops initial tools to understand ancient city vitality, focusing on density, diversity, accessibility, and the streets’ spatial characteristics. Subsequently, employing a geographically and temporally weighted regression model, we delve into the spatiotemporal heterogeneity of vitality and the built environment. The research findings indicate that: (1) the association between street vitality and the built environment in historic cities exhibits dynamic variations over time and space. The impact of different built environment indicators on the vitality of the streets varies in intensity across different periods and areas. (2) Density and diversity play contrasting multifaceted and limited roles in enhancing the vitality of ancient cities. Accessibility's role in traffic attraction and navigability significantly sways vitality. The temporal nonstationary of street space characteristics is particularly pronounced. (3) The density of aged buildings, diversity of building ages, sky view ratio, and green view ratio generally show a negative correlation with the vitality of ancient cities across time and space.
Introduction
The world heritage conservation process has evolved, shifting from a static perspective to a paradigm of dynamic evolution (ICOMOS 1982, 1987, 1999, 2011). This evolution underscores the focus on the past, present, and future states of historical environments. Historic cities, as witness to urban development, have become increasingly significant in the urban historical context (Tweed and Sutherland 2007; Wang 2012; Król et al. 2022). Historic cities, like living entities, undergo preservation and renewal efforts with the primary goal of adapting to contemporary forms and rejuvenating their vitality (UNESCO 2013; Wang 2012). Nevertheless, historic cities encounter challenges of declining vitality and imbalances in their development. Specifically, overemphasis on the preservation of physical spaces, while neglecting the interaction of historic cities with their surrounding environment can lead to stagnation, resulting in a loss of vitality. On the other hand, unsustainable tourism development poses significant challenges to heritage preservation and management. Consequently, issues related to the decline or imbalance of vitality in historic cities have garnered widespread attention (Wang 2012; El-Basha 2021; Huang et al. 2022, 2023). Enhancing historic city vitality has a valuable role in preserving cultural heritage, boosting local economics, improving residents’ lives, and building stronger communities (Tweed and Sutherland 2007; El-Basha 2021; Zeng and Wang 2023). Therefore, studying the relationship between historic city vitality and the built environment is crucial for developing strategies to harness urban vitality from historical and cultural resources.
The concept of urban vitality, as introduced by Jane Jacobs, emphasizes the role of human activity and the interconnectedness of living spaces. Jacobs identified key factors contributing to urban vitality, such as mixed uses, small blocks, aged buildings, and concentration (Jacobs 1961). The introduction of the vitality concept shifted urban research from the city itself to its inhabitants, leading to studies on street vitality from a human-centric perspective. Some scholars have claimed the possible links between human activity intensity and the built environment. For example, Jan Gehl examined the built environment’s impact on different activities (Gehl 1987). Kevin Lynch analyzed urban vitality through urban form, function, and social aspects (Lynch 1984). Katz, Scully, and Bressi proposed that significant influencing urban vitality factors include compactness, pedestrian scale, mixed use, and optimal building density (Katz et al. 1994). Montgomery pointed out that urban vitality is associated with public space features such as green areas, water, mixed-use areas, and pedestrian accessibility (Montgomery 1998). These studies have laid the foundation for examining urban vitality from a human perspective and provided a crucial reference for understanding the relationship between vitality and the built environment.
Furthermore, Jacobs’s principles have been continually reviewed and expanded by researchers worldwide to meet diverse needs and contexts (Hirt and Zahm 2012; Wang et al. 2022; Vidal Domper et al. 2023). This vitality theory serves as a guiding framework for examining how cities can enhance quality of life for people or to evaluate contemporary urban environment (Gómez-Varo et al. 2022; Wang et al. 2022). Inspired by Jacobs, subsequent studies either directly translate her theory into specific variables such as population density, land use, transportation, accessibility, and so on (Gómez-Varo et al. 2022) or integrate new insights into urban vitality based on her work (Sung and Lee 2015; Ye et al. 2018). Existing research has validated the reliability of Jacobs’ four conditions and their significance in urban planning (Sung and Lee 2015; Ye et al. 2018; Wang et al. 2022). In exploring the more specific connections between urban vitality and people's travel behavior, Robert Cervero and Kara Kockelman introduced the 3D concept of density, diversity, and design (Cervero and Kockelman 1997). This 3D concept was later expanded to include destination accessibility and distance to transit, forming the 5D concept (Cervero et al. 2009). The focus here is on how urban planning and design influence residents’ travel patterns through the built environment, complementing the previous framework (Larranaga et al. 2016). In addition, the indicators within the 5D concept are also frequently used for assessing street quality, for examining the impact of the built environment on street activities (Niu et al. 2019; Wu et al. 2022), and for macroclassifying the built environment (Dong et al. 2023).
While there is diversity in the definition and quantitative indicators of urban vitality, as well as its influencing factors, existing research and practice universally acknowledge that a favorable urban environment can stimulate interpersonal interactions and activities. Empirical evidence has confirmed that factors such as density (e.g., population, functional density), accessibility (e.g., public transportation, street network), diversity (e.g., functional mix, land use), urban form, historical resources, urban landscape (e.g., water, green space), and amenities (e.g., commercial, recreational, and dining services) and so on are related to urban vitality (Yue et al. 2017; Sung and Lee 2015; Ye et al. 2018; Wu et al. 2018; Zhang et al. 2019; Wu and Nu 2019; Huang et al. 2020; Meng and Xing 2019; Li et al. 2022). However, regarding the specific relationship between the built environment and urban vitality, such as the positive or negative correlation and the strength of the association, the conclusions of different studies are not consistent. For instance, some studies suggest a positive correlation between functional diversity and urban vitality (Wu et al. 2018; Niu et al. 2019; Wang et al. 2022), while others contend that increasing functional diversity boosts vitality only during a specific time within a day (Si et al. 2021), or exerts limited impact (Meng and Xing 2019) or is unrelated (Sallis et al. 2016). Alternatively, research has shown the connection between aged buildings and urban vitality, with buildings exhibiting a strong correlation with pedestrian activities (Sung and Lee 2015). In contrast, other studies argue that the proportion of aged buildings does not promote street vitality (Niu et al. 2019). Disparities exist between old and new urban areas, with functional and transportation factors playing a more pronounced role in older urban areas (Zhao et al. 2023). Variability in these results reflects differences arising from diverse urban spatial types, spatiotemporal scales, sociocultural contexts, and limitations in measurement methods in urban vitality research. Considering the complexity of urban environments, factors such as economy, culture, and society exhibit unique combinations and impacts in different cities or regions within a city, making it challenging to quantify them with a uniform set of indicators completely. Therefore, in urban vitality studies, given differences among various research works, it is impractical to attempt to establish a fixed or broad indicator system. Furthermore, it is crucial to delve deeper into how the relationship between the built environment and urban vitality, as observed in existing studies, manifests itself in the unique context of ancient cities. This exploration is essential to understand the dynamics specific to these historic urban spaces. A thorough analysis of the role of the built environment in ancient city vitality can contribute more nuanced and innovative insights to the field of urban planning and vitality research, especially in the revitalization, renewal, and protection of ancient cities.
The relevant studies on urban vitality aim to decompose vitality into measurable components, using human activity intensity or the built environment as objective indicators. They attempt to quantify urban vitality through human activity intensity, using the built environment as an objective indicator. The related indicator data mainly come from small-scale data and multisource data. Small-scale data, collected via field surveys, on-site observations, questionnaires, or interviews, record detailed activity information such as gender, age, and activity specifics (Azmi and Karim 2012; Fan et al. 2021), but their acquisition is time-consuming and labor-intensive. Furthermore, the limited number of samples makes it challenging to cover activity conditions across different areas simultaneously. However, a qualitative analysis based on small-scale data is indispensable for capturing the depth and details of activities. It provides an interpretative understanding of the motivations, perceptions, or preferences behind behaviors. Another source of data is multisource data, which rely on open data from big data platforms such as heat maps, social media data, and mobile phone data. (Zhang et al. 2019; Huang et al. 2023; Meng and Xing 2019; Yue et al. 2017). These sources offer a broader coverage and larger sample sizes, providing a more comprehensive view of real-time activities, behavioral characteristics, and spatiotemporal patterns (Niu and Silva 2020). They are crucial for conducting quantitative analyses. The combination of qualitative and quantitative research in urban vitality studies is indispensable, providing a more comprehensive perspective for understanding urban vitality.
Many scholars have conducted extensive research on the sources and influencing factors of urban vitality. However, a deeper understanding of this complex issue still requires additional case studies in typical areas, particularly an in-depth exploration of the built environment's role in urban vitality. Previous research has mostly focused on whether the built environment influences vitality and the nature of this influence, whether positive or negative. Although some studies have considered the spatiotemporal heterogeneity of the built environment's impact on street vitality at an urban scale, data support for mesoscale case studies remains relatively lacking. In reality, spatial elements exhibit a proximity effect, resulting in spatial heterogeneity, which changes over time (Huang et al. 2010). This means the same environmental features may yield diverse responses in different spatial or contextual settings (Zhao et al. 2023). Therefore, spatiotemporal heterogeneity is vital for exploring the relationship between vitality and the built environment. It helps identify the most effective factors for stimulating vitality in different spatial and temporal contexts. This is particularly vital for special urban spaces like ancient cities with limited budgets for conservation and renewal. More case studies are needed to confirm whether the observed link between the built environment and urban vitality holds in such contexts. Effective vitality shaping demands that policymakers or designers deeply understand these influencing factors.
Analyzing the spatiotemporal heterogeneity between the built environment and vitality requires analytical models. Global regression models, such as ordinary least squares (OLS) and spatial lag models, have been widely employed to elucidate the mechanisms influencing urban vitality (Ta et al. 2020; Huang et al. 2023; Niu et al. 2019); however, they provide only an average level of spatial relationships and fall short in describing the spatial nonstationary phenomenon. Recognizing these limitations, some studies have introduced geographic weighted regression (GWR) models (Fan et al. 2021; Chen et al. 2023) to address spatial heterogeneity. However, these models still neglect temporal factors. To bridge this gap, geographically and temporally weighted regression (GTWR) models have emerged, which extend the GWR framework to incorporate both temporal and spatial factors (Huang et al. 2010), providing a more detailed and accurate regression process and prediction trends. Although scholars have applied the GTWR model to studies on the relationship between the built environment and urban vitality (Zhao et al. 2023), these studies typically have a larger scale, focusing mainly on the entire central urban area of cities, and pay less attention to special urban spaces such as ancient cities. Furthermore, the street panorama images used in existing studies mostly cover vehicular roads, with less coverage of pedestrian streets. Therefore, there is insufficient attention to observing the street environment from a pedestrian perspective.
This study uses Chaozhou ancient city in Guangdong Province, China, as a case study and employs a GTWR model to investigate the relationship between street vitality in historic cities and the built environment from temporal and spatial perspectives. The research focuses on the following questions: (1) What are the spatiotemporal characteristics of the built environment’s influence on street vitality in the historic city? (2) What are the heterogeneous characteristics of the impact of different built environments on street vitality? and (3) Which environmental factors play a more prominent role in enhancing the vitality of the historic city?
The remaining sections of this paper are as follows. The section “Data and Methods” presents research data and methods, encompassing the study area, data sources, indicator system, and model construction. The spatiotemporal heterogeneity of indicators influencing vitality within the historic city is explored in the section “Results.” The section “Discussion” examines the underlying causes of the spatiotemporal heterogeneity. The section “Conclusions” provides a summary of the research outcomes.
Data and Methods
Study Area
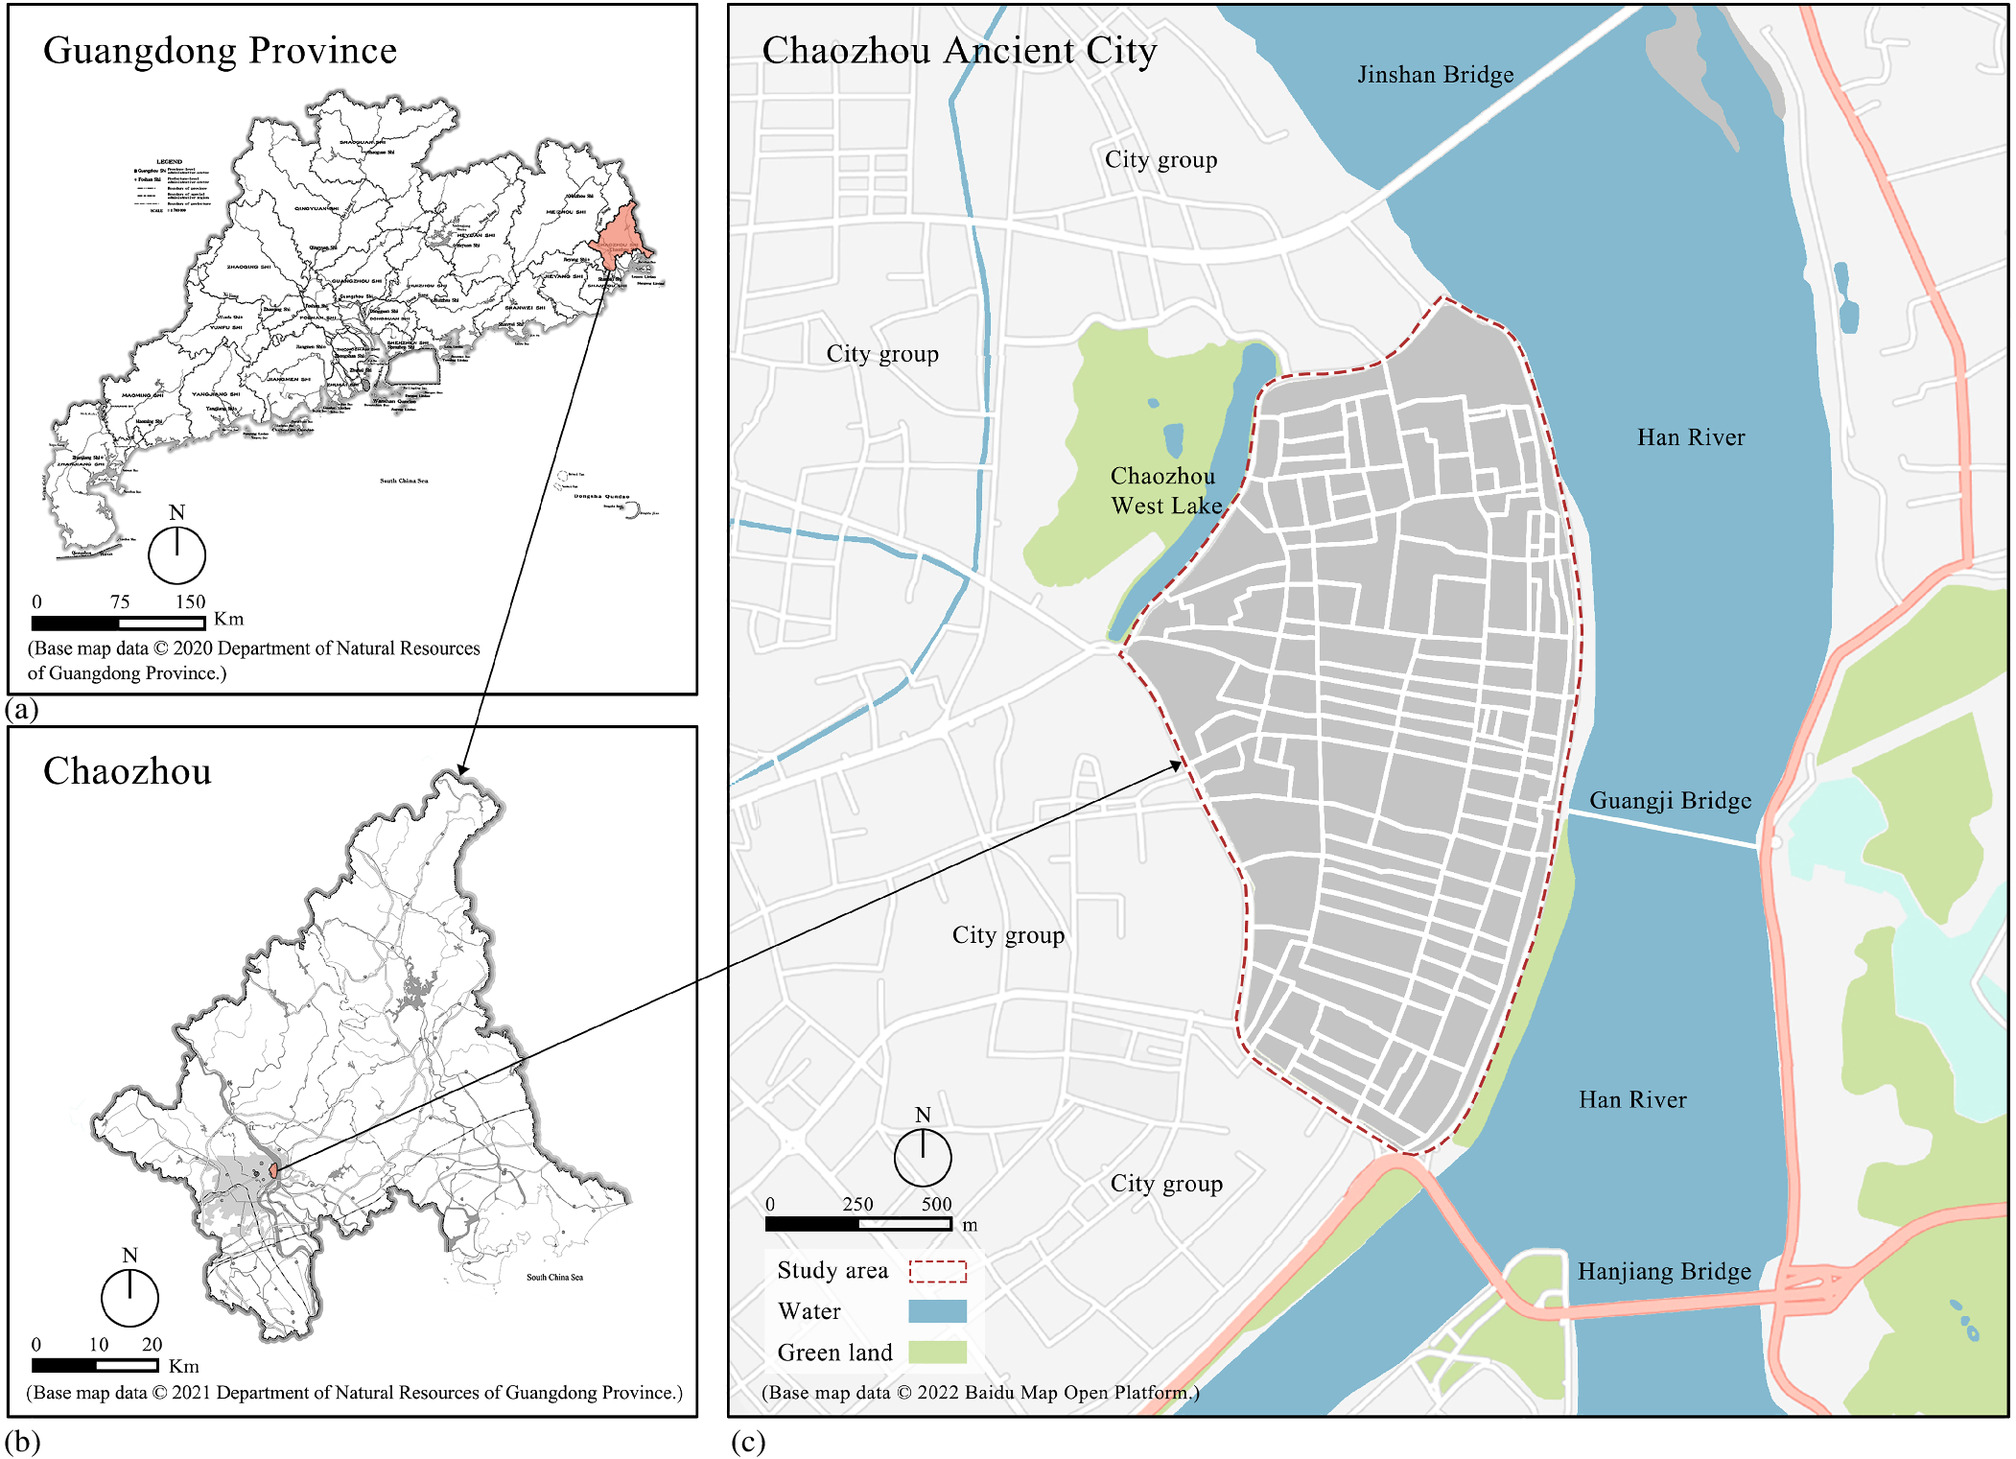
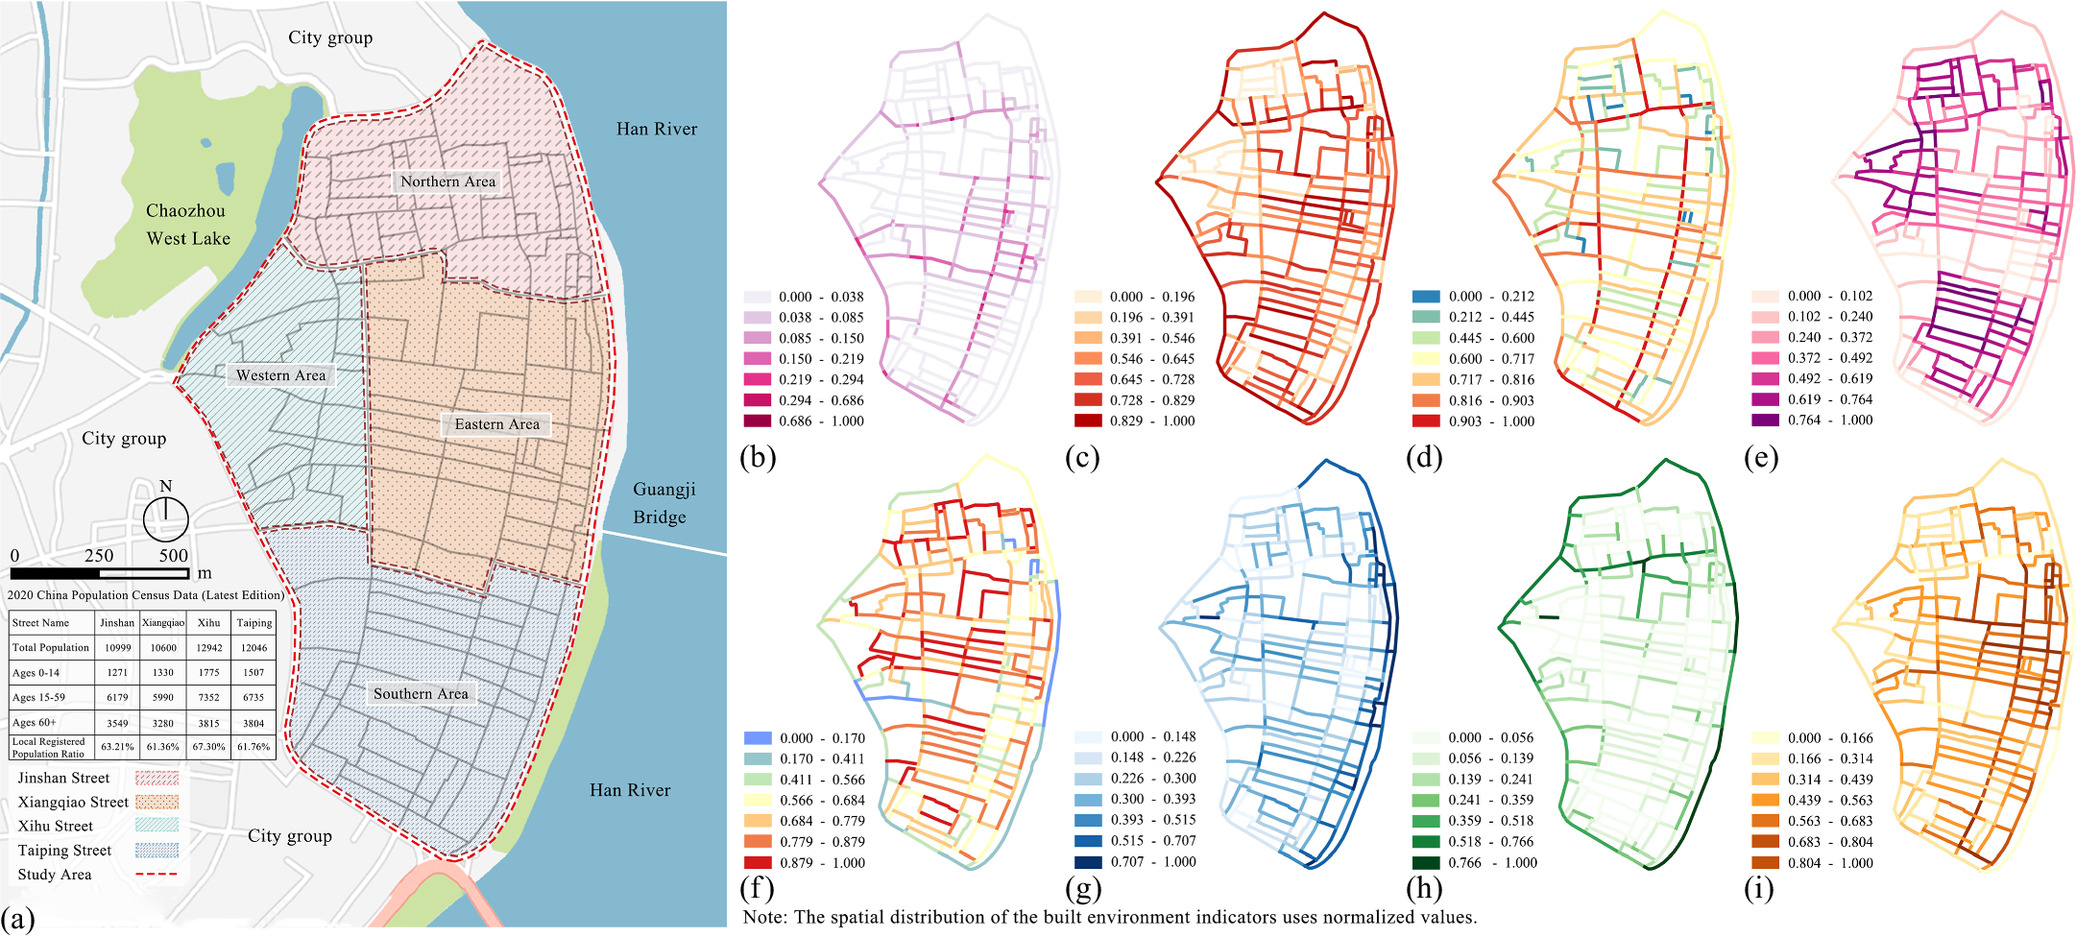
Chaozhou, located in the easternmost part of Guangdong Province, boasts a history of approximately 1,600 years. It is recognized as a state-list famous historical and cultural city, a significant role as the starting point of the ancient Maritime Silk Road, and also a living historic city. Chaozhou ancient city covers approximately 2.33 km2, and as of 2020, it had a residential population of 46,587. Today, Chaozhou ancient city preserves the spatial layout from the prosperous Ming and Qing dynasties. In this historic city, roads leading to the city gates or running north-south are called streets, while those spanning between two streets are known as lanes. In this study, the term street specifically refers to the street-lane spaces within the historic city of Chaozhou. They feature diverse street types, including arcade streets, residential streets, and newly constructed streets, making it a typical case for the study of the relationship between the built environment at the historic level and the street vitality (Fig. 1).
Dependent Variables of Historic Cities’ Vibrancy
The Baidu Heat Map is sourced from Baidu mobile apps, which track user location and aggregate population data. As of December 2021, the Baidu Map processed over 130 billion daily location requests, covering over 11 million kilometers of roads. The Baidu Heat Map updates every 15 min., using color blocks to show real-time population distribution and concentration in spatial areas.
The study area was entirely covered by the Baidu Heat Map. We obtained this data for 1 week (December 21–27, 2023) using the application programming interface (API) of Baidu Maps, aiming to minimize interference from incidental events and provide stable and accurate average heat data. Data collection took place on clear weather days, capturing data at hourly intervals from 7:00 to 23:00, resulting in 17 data points per day and 119 Baidu Heat Map images. The origin data consist of images extracted from the API and contain no personal information.
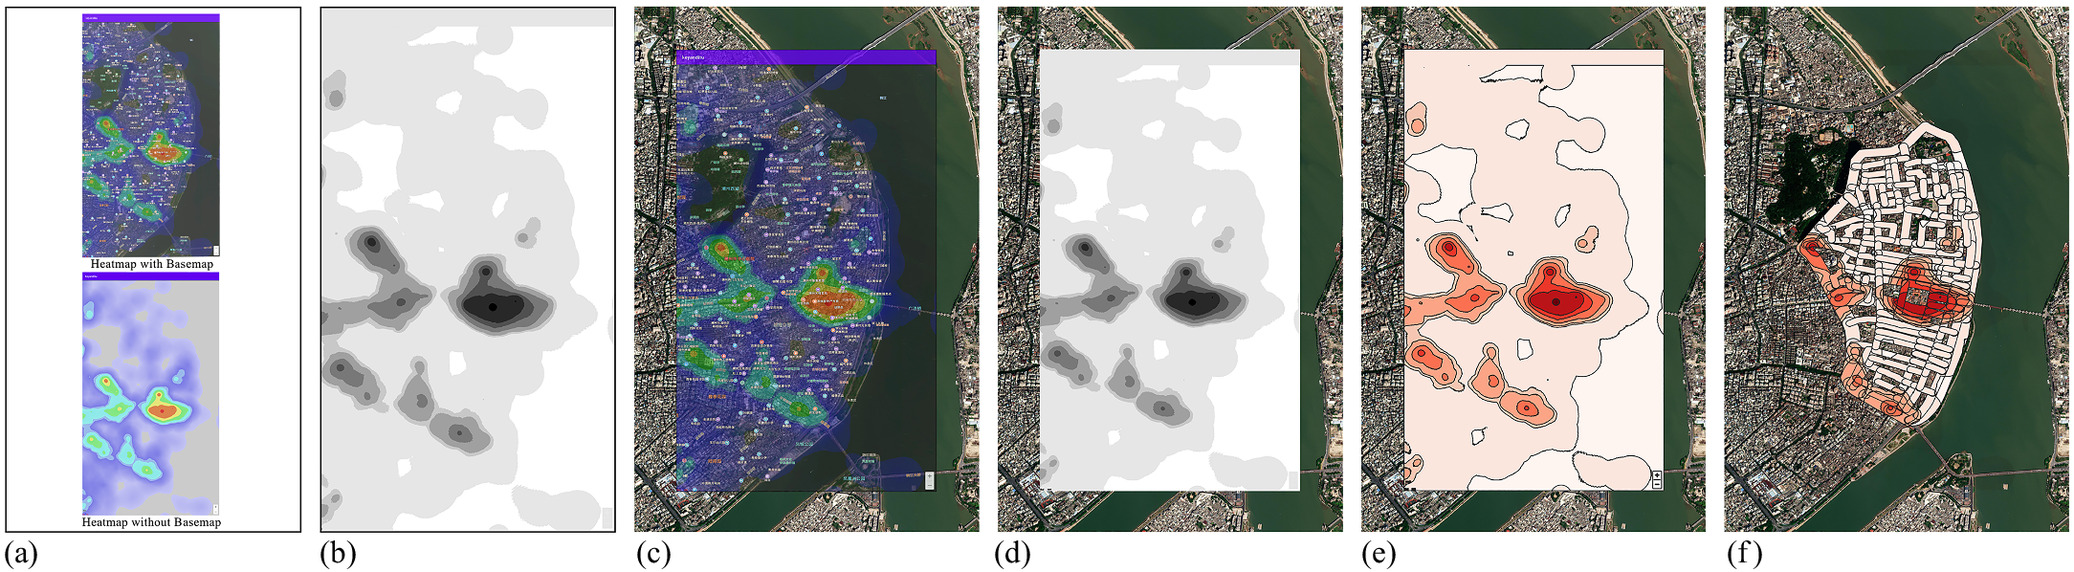
To quantify the heat map data, we first converted the 119 images into gray scale. Then, using a heat map image with a satellite base map as a reference, we performed raster image registration in QGIS. Next, we imported the grayscale heat map images into QGIS using a replacement tool and vectorized the raster data, assigning heat levels from 0 to 7 based on grayscale values. Finally, we conducted a vector overlay–intersect analysis with the spatial units on the heat map, quantifying areas of each heat level within the buffer zone (Fig. 2), and combined with formula (1) in Table 1, the average heat value was computed.
| ID | Index | Formula | Explanation |
|---|---|---|---|
| 1 | Average heat value | Average heat value represents the average heat value of the study unit. Hi is the intensity level i of the study unit's vitality at a specific time point. Si is the area of the vitality intensity level i, and n is the number of vitality intensity levels in the study unit. | |
| 2 | Density | Density was measured via functional density, referring to the density of POI facilities of spatial units. POI_num denotes the number of POI facilities within the buffer range on both sides of the streets, and road_length denotes the length of a single spatial unit. | |
| 3 | Diversity | Diversity was measured according to functional diversity, referring to the variety of functional categories of POI within a spatial unit, and as indicated by the degree of POI mixture. Pr denotes the proportion of the rth POI within a spatial unit, while n denotes the total number of POI within this range. | |
| 4 | Distance to bus stops | Dist_BusStop = min (distance to nearest bus stop) | Distance to bus stops indicates accessibility to nearby bus stops from a spatial unit. |
| 5 | Density of aged buildings | Density of aged buildings refers to buildings in the historic city constructed before 1949. Den_building denotes aged building density within a spatial unit, old building_area denotes the area of the aged buildings, and street_area denotes the total area within a spatial unit. | |
| 6 | Diversity of building ages | Diversity of building ages is calculated based on the proportion of buildings from different eras within the length of a spatial unit. We categorized buildings into four groups: pre-Qing dynasty buildings, Republican-era buildings, 1949–1980 buildings, and post-1980 buildings. Pr denotes the proportion of buildings from an era within a spatial unit, with n representing the total number of era categories within this range. | |
| 7 | Street hierarchy | Str_Hier = W | Str_Hier represents street hierarchy, and W is the road grade of the street, with widths classified into five levels: Level 5 for 22–32 m, Level 4 for 15–16 m, Level 3 for 9–11 m, Level 2 for 6 m, and Level 1 for 2–5 m. |
| 8 | Street length | St_Length = L | Street length is the length of the street, and L denotes the central axis length of the street within the spatial unit. |
| 9 | D/H | D/H is the ratio of average street width to average building height in the spatial unit. D is the average width of the street, and H is the average height of the building within the buffer zone on both sides of the street. | |
| 10 | Sky view ratio | Sky view ratio denotes the proportion of the sky in the visual field within the spatial unit as perceived by the human eyes. R_sky denotes the sum of sky proportions in the street view images, and N_image denotes the number of street view images acquired within the spatial unit. | |
| 11 | Green view ratio | Green view ratio denotes the proportion of the green vegetation in the visual field within the spatial unit as perceived by the human eyes. R_green denotes the sum of vegetation proportions in street view images. | |
| 12 | Walkability | Walkability denotes the proportion of sidewalks in the visual field within the spatial unit as perceived by the human eyes. R_sidewalk denotes the sum of the proportions of sidewalks in street view images. |
Independent Variables of the Built Environment Indicators
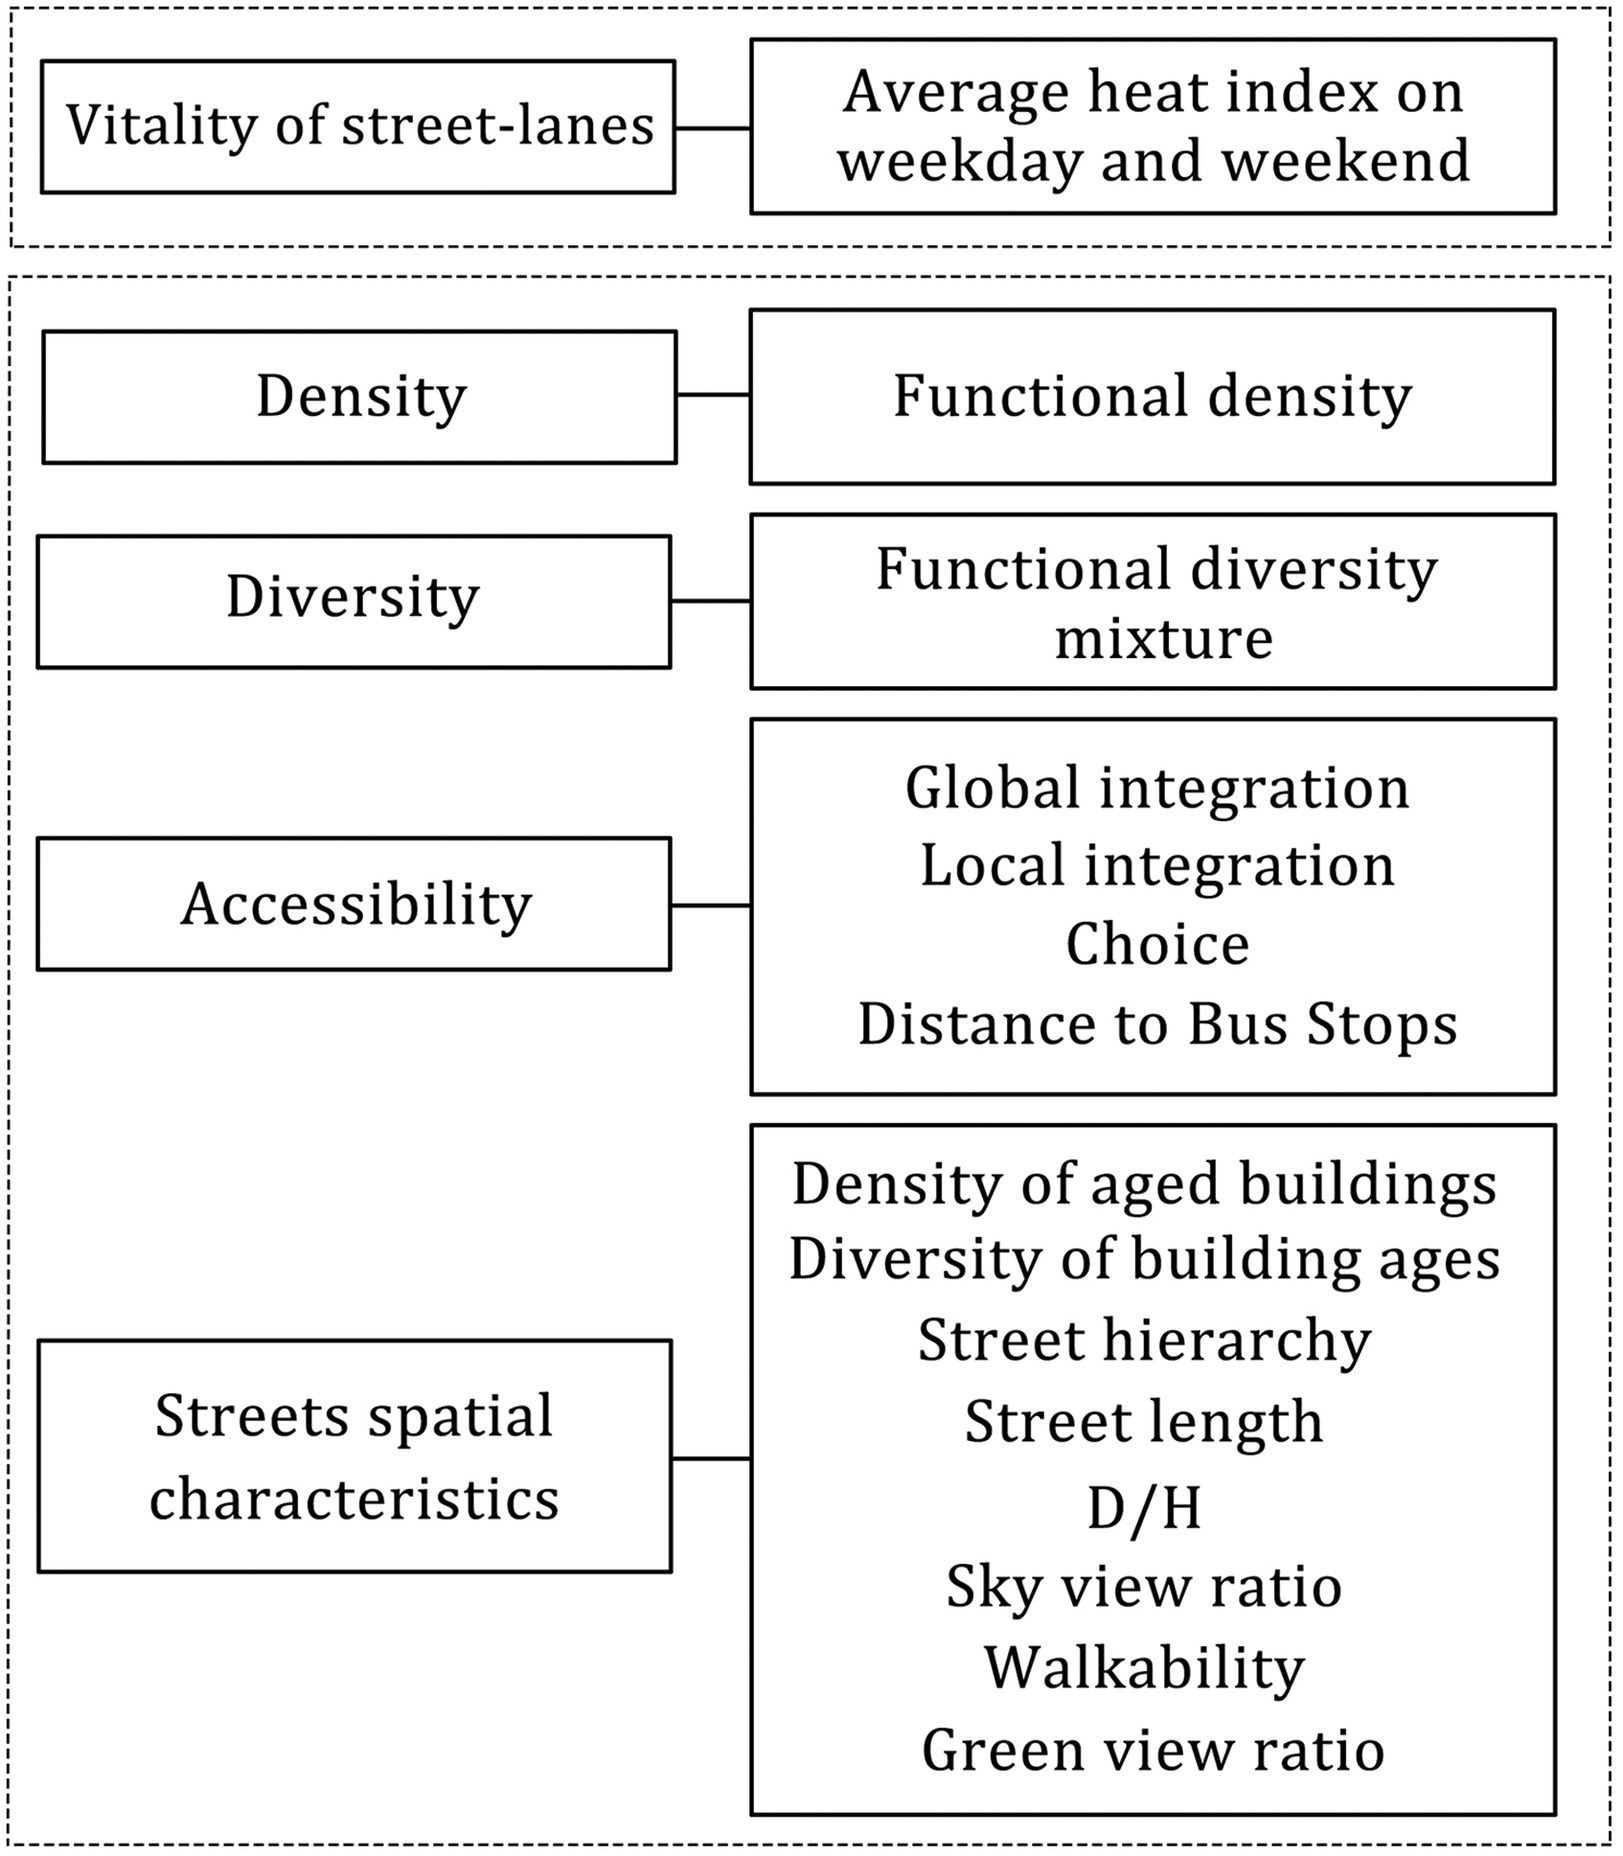
To further explore the role of the built environment in historic city vitality, we attempted to quantify its characteristics. Our framework integrates aspects of historic city attributes, street features, and future feasibility, drawing from Jacobs’ four conditions and Cervero’s 5D concept. This indicator set is an initial tool for exploring and understanding the factors impacting ancient city vitality, thereby facilitating a richer and more nuanced understanding, rather than serving as a comprehensive and definitive solution (Fig. 3). The methods of calculating variables set within these four dimensions are detailed in Table 1.
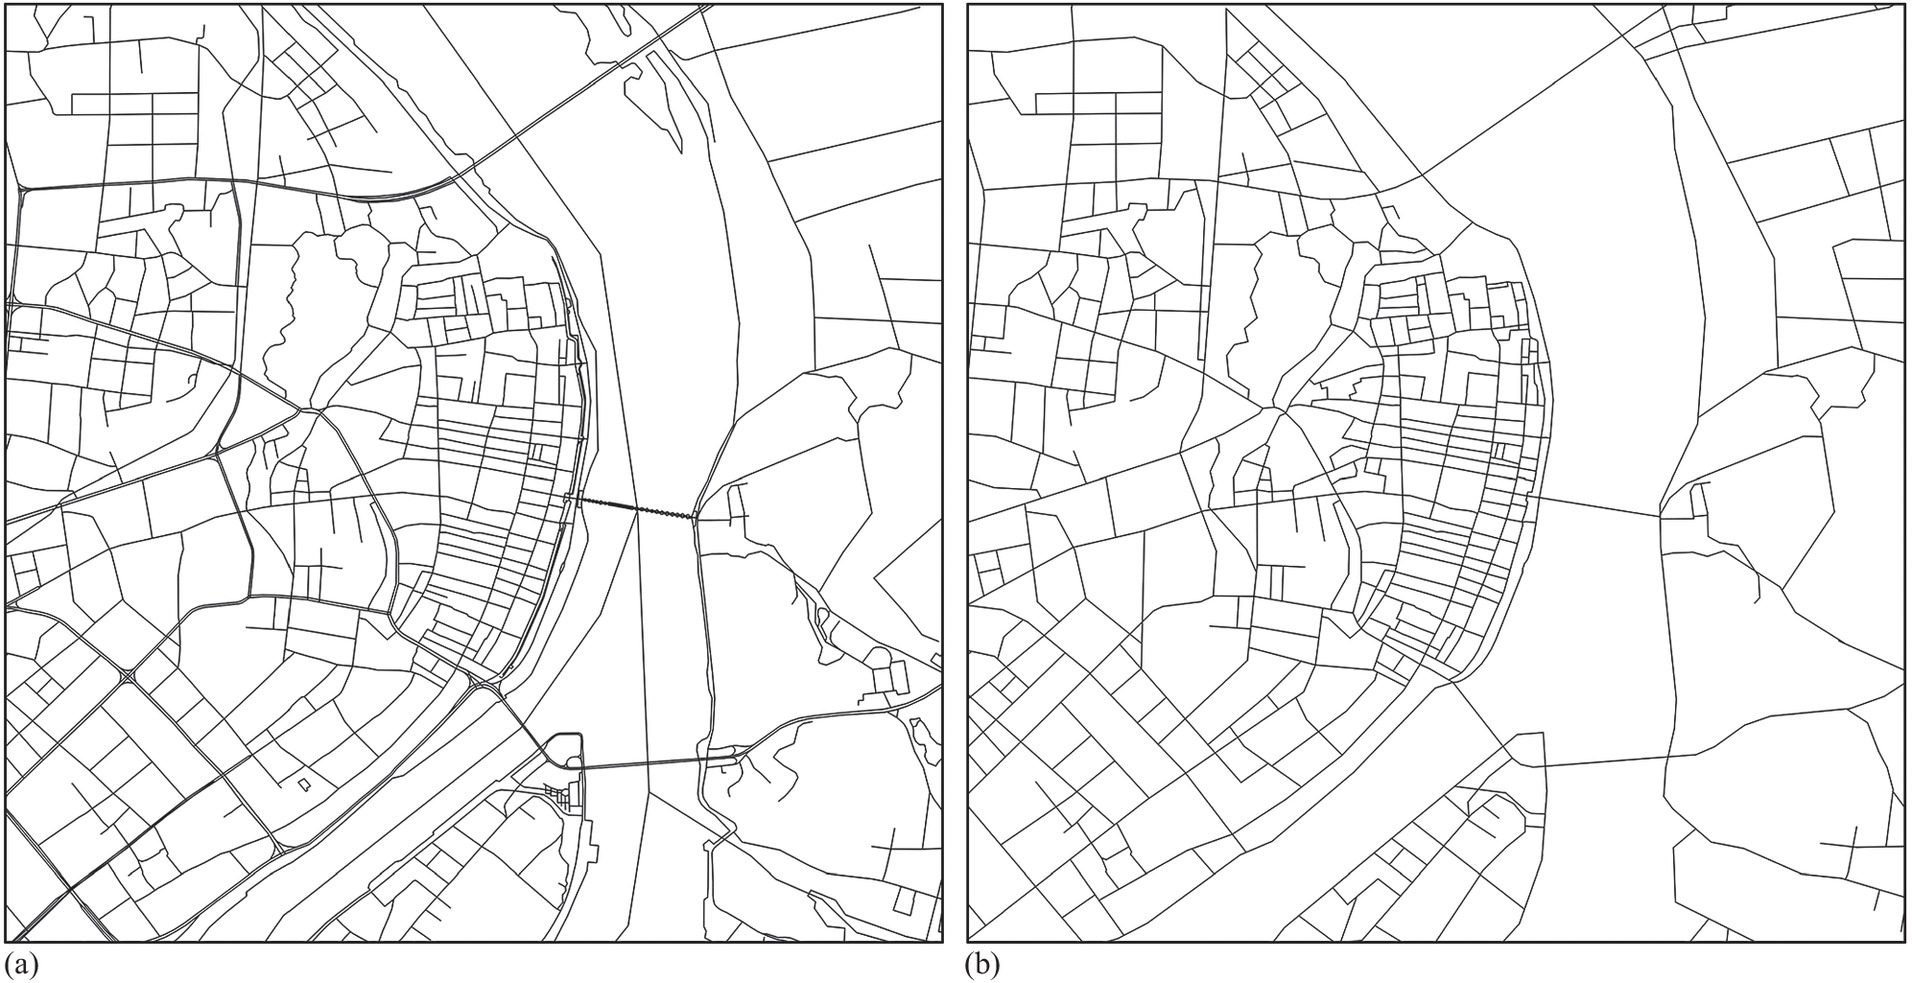
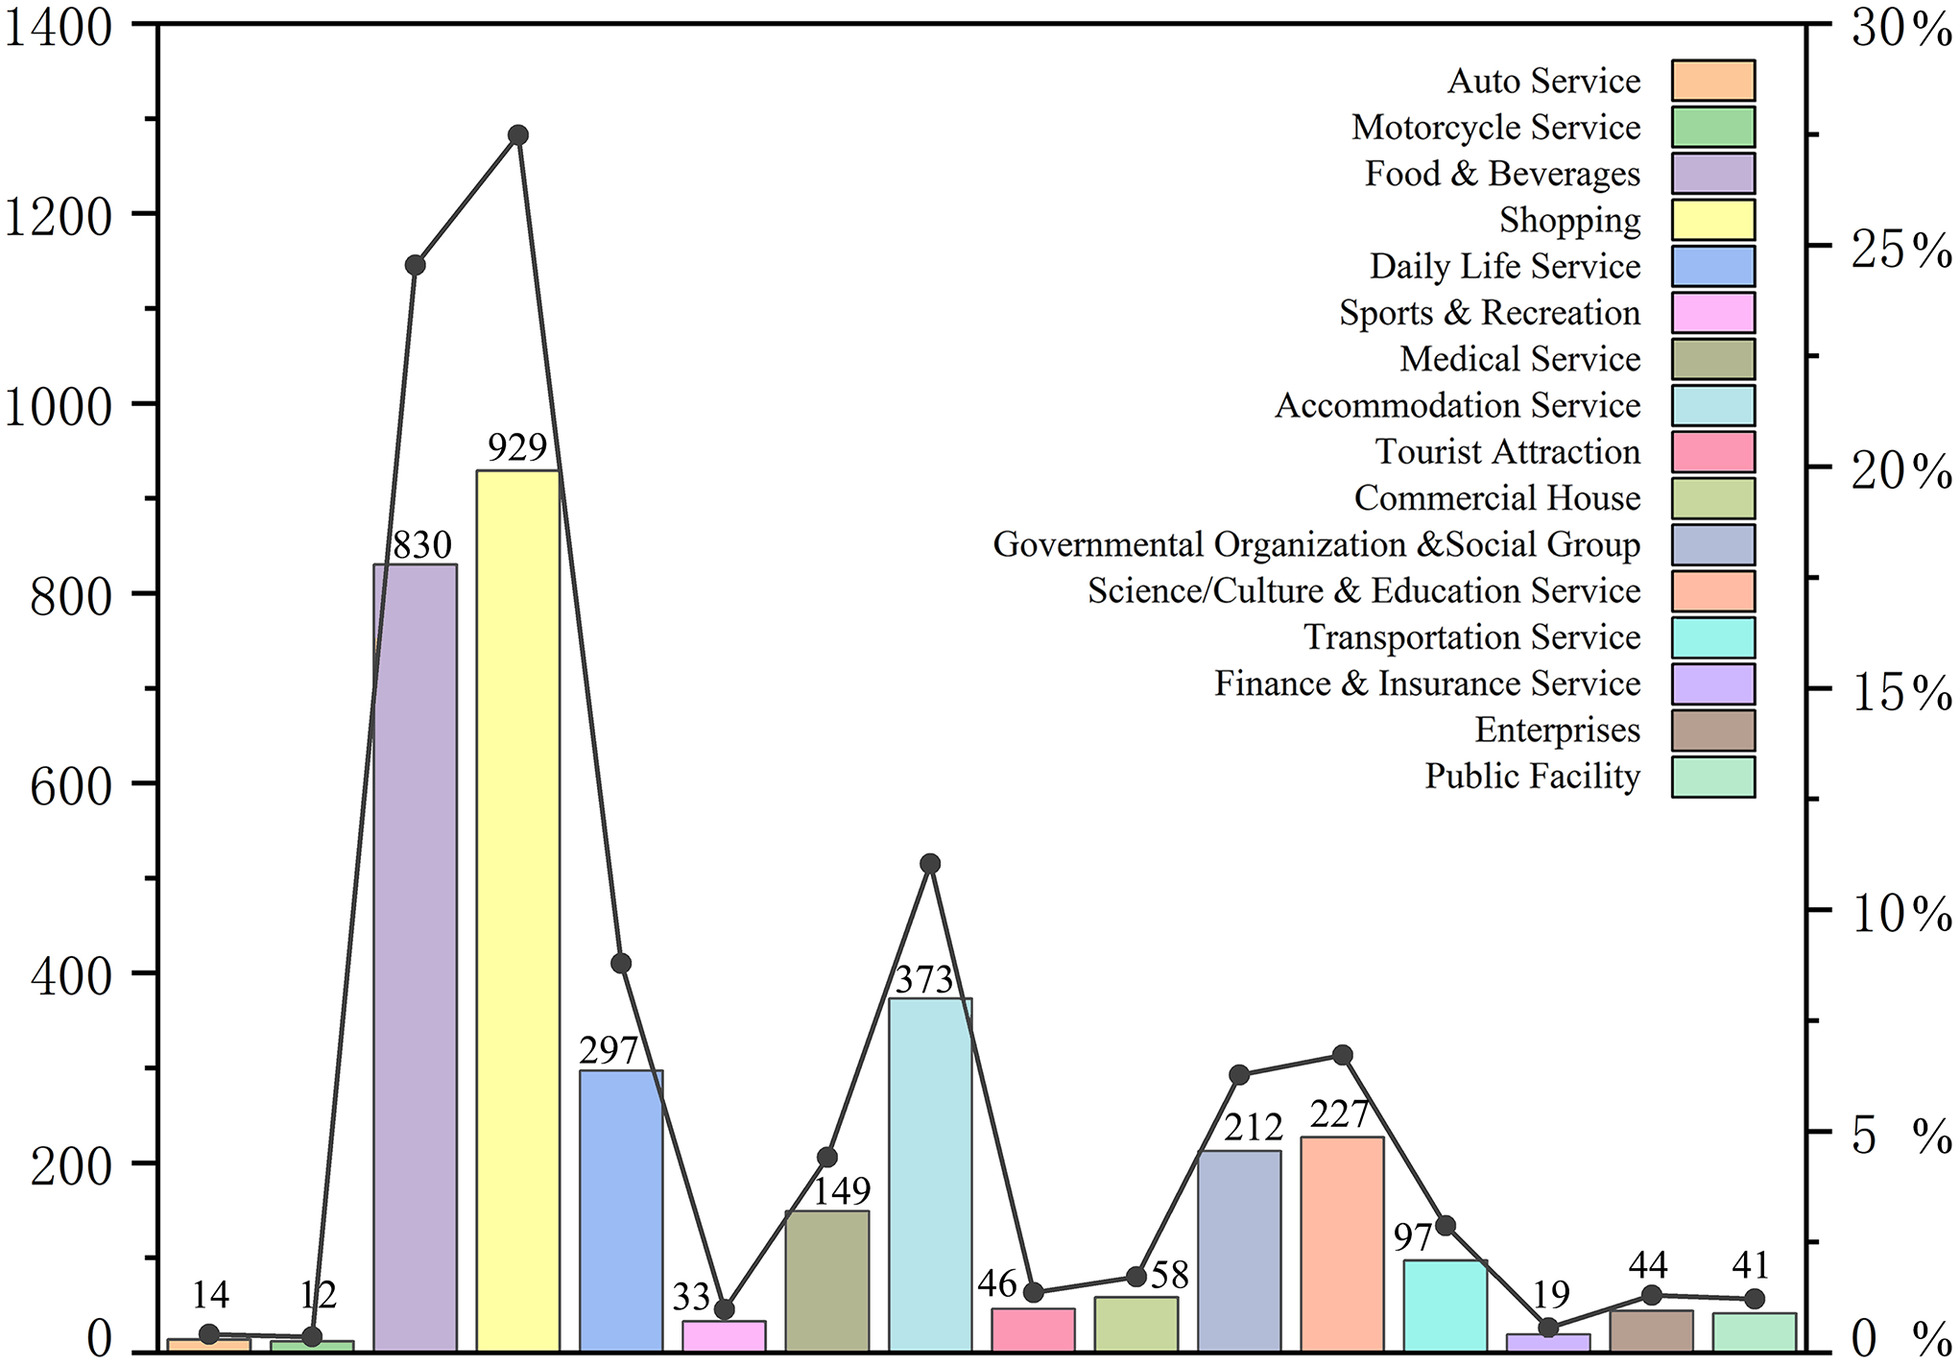
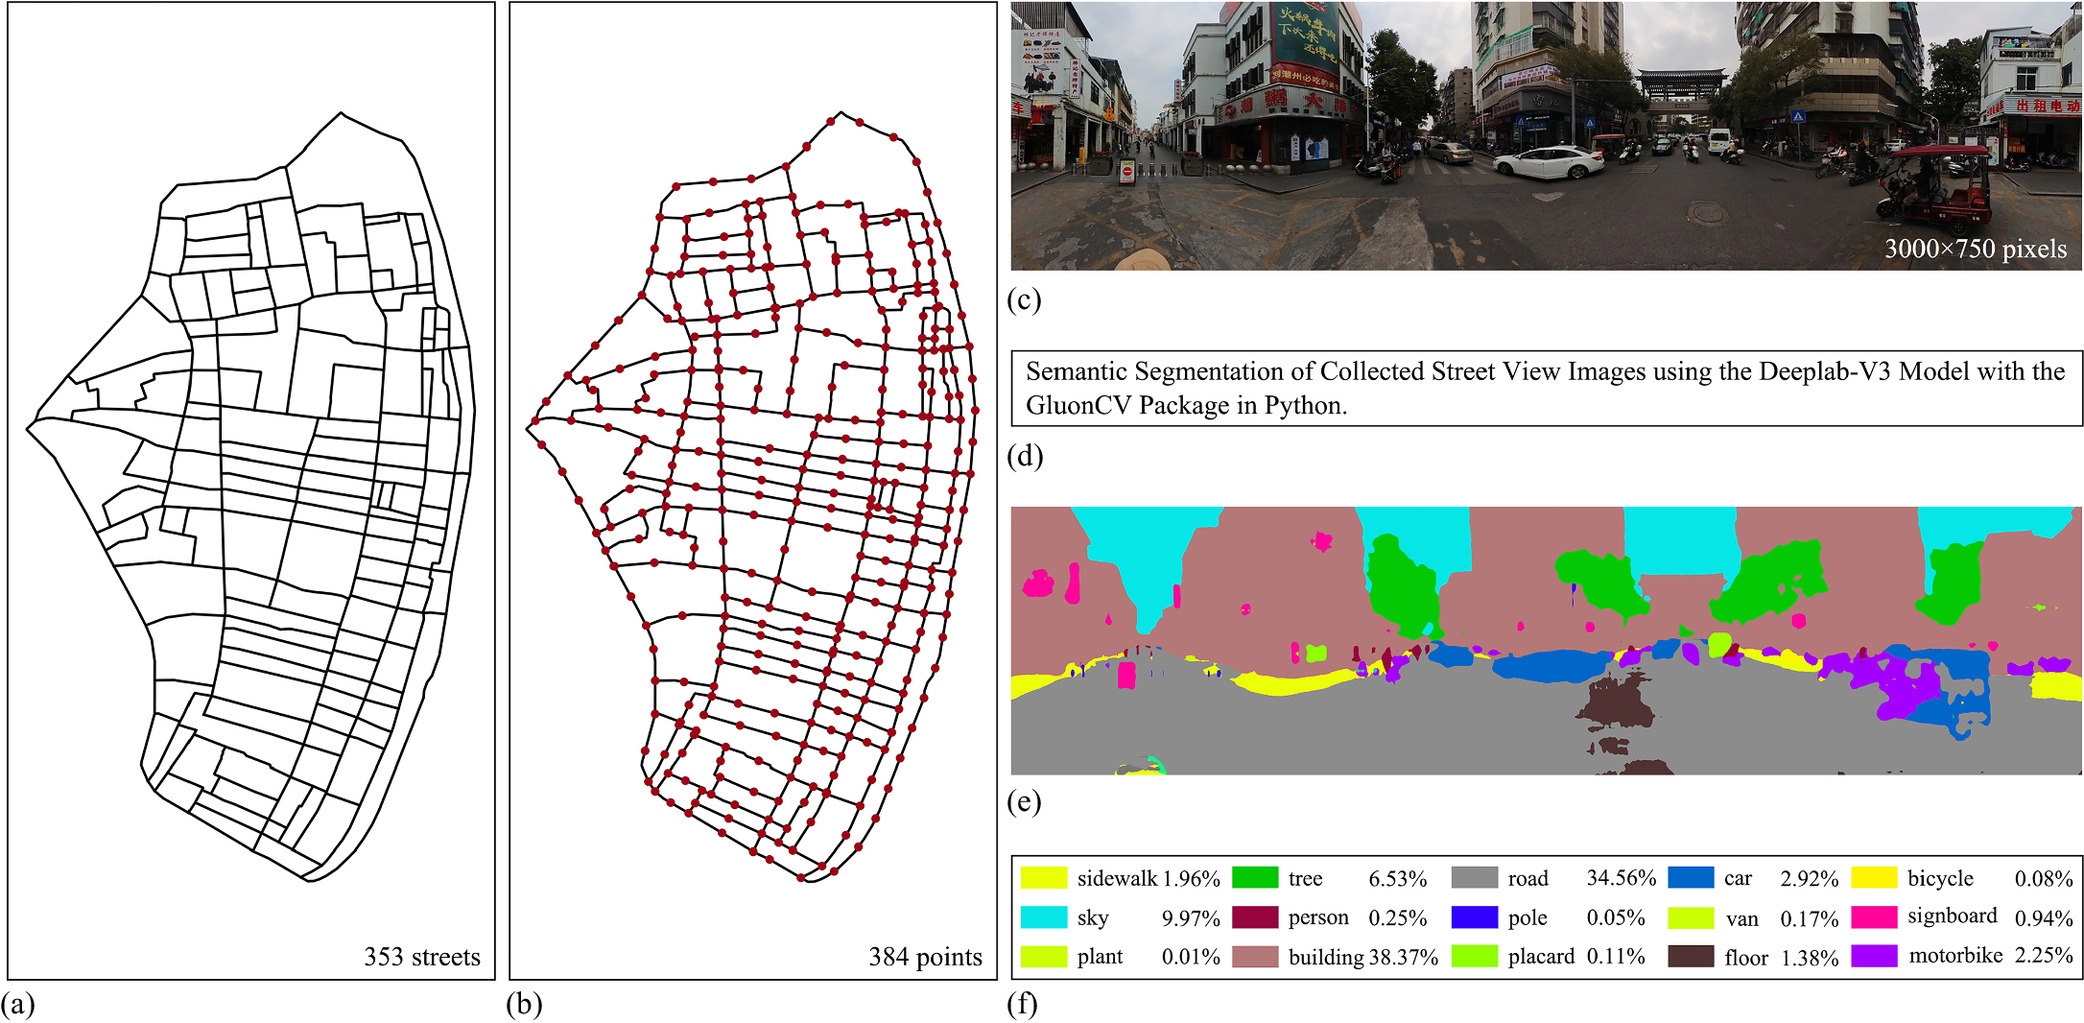
We collected data from various sources, including online platforms, governmental documents, historical records, and field research. Street network data were collected from OpenStreetMap (Fig. 4). After cleaning the street network data, spatial units were created in QGIS based on the width categories of Chaozhou ancient city streets (22–32, 15–16, 9–11, and 2–6 m). Street intersections served as nodes, and buffers (50, 35, 30, and 25 m) corresponding to street categories were applied from the centerline of each street. This approach was designed to more accurately encompass the majority of points of interests (POIs) and adjacent buildings influencing street vitality, resulting in a total of 353 spatial units. POI data were retrieved via the Amap open platform web service API in June 2023, within the geographical range of east longitude 116.615°–116.655° and north latitude 23.641°–23.685°. Initially, 5,420 records were collected. To accurately reflect the urban area's functional features and crowd activities, records of five categories were removed, namely, geographical names, indoor facilities, transit facilities, events, and public amenities. After this filtering process, 3,381 records were retained within the study area (Fig. 5). Data on buildings and streets were sourced from CAD architectural drawings and field research. Additionally, we utilized the Insta360 panoramic camera to capture street view images, and Python was employed for semantic segmentation to measure the street environment (Fig. 6).
Regression Analysis
Historic city vitality levels measured using both weekday and weekend Baidu Heat Map data were considered as distinct outcomes. Before applying regression models, we performed data normalization, assessed collinearity, conducted spatial autocorrelation tests, and compared regression models.
Data Normalization
To address variations in metrics’ dimensions and units, we uniformly normalized each assessment criterion.
Collinearity Diagnosis
Before regression, we used the variance inflation factor (VIF) to ensure the accuracy and reliability of the regression results. We excluded independent variables that failed the multicollinearity test conducted using variance inflation factors. Since our study primarily focuses on pedestrian behavior, we retained the local integration index. Consequently, the built environment indicators for the historic city excluded global integration and street level. The adjusted model displayed stability, with all indicators having VIF values below 3, meeting the collinearity diagnosis criteria.
Spatial Autocorrelation Test
We conducted spatial autocorrelation analysis to assess the need for incorporating a sophisticated spatial model. Appendix shows that the dependent variables exhibit significant spatial autocorrelation patterns, warranting the use of spatial econometrics for accuracy.
Model Comparison
We compared the OLS, GWR, and GTWR models to assess GTWR’s performance on the same data set. GTWR, as an extension of GWR, introduces a temporal dimension into the regression model, enhancing its ability to explain spatiotemporal data characteristics and investigate local spatiotemporal parameters (Fotheringham et al. 2015; Huang et al. 2010). The GTWR model can incorporate time data as an additional dimension into the regression parameters, enabling a simultaneous consideration of spatial and temporal variations.
Results
Table 2 presents weekday and weekend OLS, GWR, and GTWR results, with reported values for the Akaike information criterion corrected (AICc) and coefficient of determination (R2). Weekday models show R2 values are 0.210 (OLS), 0.475 (GWR), and 0.678 (GTWR). These results show that the GTWR model outperforms the OLS and GWR models, providing a better explanation for data with both spatial and temporal characteristics. Consequently, we choose the GTWR model as the analytical framework.
| Model name | Weekday | Weekend | ||
|---|---|---|---|---|
| AICc | R2 | AICc | R2 | |
| OLS | 6,007.981 | 0.210 | 13,850.347 | 0.211 |
| GWR | 3,784.760 | 0.475 | 11,577.600 | 0.480 |
| GTWR | 1,272.720 | 0.678 | 8,026.050 | 0.732 |
Tables 3 and 4 show descriptive statistics of GTWR model coefficients, summarizing the impact of explanatory variables on weekday and weekend vitality. The minimum (Min), maximum (Max), mean, and standard deviation (SD) are reported. Overall, the GTWR model reveals diverse local connections between built environment indicators and spatiotemporal historic city vitality, with fluctuating relationships across all 12 variables encompassing both positive and negative associations.
| Variable | Min | 1/4 quantile | Median | 3/4 quantile | Max | Mean |
|---|---|---|---|---|---|---|
| Functional density | −0.441 | −0.044 | 0.195 | 0.374 | 2.446 | 0.233 |
| Functional diversity mixture | −0.739 | 0.063 | 0.162 | 0.254 | 0.408 | 0.131 |
| Local integration | −1.333 | −0.312 | −0.105 | 0.050 | 0.712 | −0.136 |
| Choice | −0.957 | 0.069 | 0.163 | 0.398 | 1.731 | 0.275 |
| Distance to bus stops | −1.232 | −0.712 | −0.320 | 0.027 | 0.351 | −0.344 |
| Density of aged buildings | −1.354 | −0.416 | −0.237 | −0.103 | 0.301 | −0.297 |
| Diversity of building ages | −0.886 | −0.241 | −0.103 | 0.034 | 0.452 | −0.115 |
| Street length | −1.420 | −0.340 | −0.217 | 0.140 | 1.413 | −0.110 |
| D/H | −1.238 | −0.215 | −0.052 | 0.111 | 0.793 | −0.071 |
| Sky view ratio | −0.854 | −0.281 | −0.151 | −0.060 | 1.738 | −0.148 |
| Green view ratio | −1.948 | −0.372 | −0.112 | 0.039 | 1.827 | −0.144 |
| Walkability | −2.658 | −0.168 | 0.032 | 0.172 | 0.858 | −0.033 |
| Variable | Min | 1/4 quantile | Median | 3/4 quantile | Max | Mean |
|---|---|---|---|---|---|---|
| Functional density | −1.140 | 0.043 | 0.284 | 0.485 | 5.042 | 0.393 |
| Functional diversity mixture | −2.141 | −0.065 | 0.072 | 0.165 | 0.788 | −0.016 |
| Local integration | −2.274 | −0.360 | −0.064 | 0.222 | 1.983 | −0.114 |
| Choice | −1.542 | 0.011 | 0.099 | 0.505 | 2.990 | 0.314 |
| Distance to bus stops | −2.673 | −1.337 | −0.594 | −0.239 | 0.088 | −0.801 |
| Density of aged buildings | −3.800 | −0.815 | −0.309 | −0.007 | 0.279 | −0.599 |
| Diversity of building ages | −1.791 | −0.510 | −0.203 | −0.052 | 0.880 | −0.311 |
| Street length | −2.655 | −0.189 | −0.021 | 0.375 | 3.192 | 0.069 |
| D/H | −2.250 | −0.189 | −0.051 | 0.246 | 1.153 | −0.054 |
| Sky view ratio | −1.282 | −0.296 | −0.150 | −0.015 | 1.913 | −0.129 |
| Green view ratio | −4.709 | −0.701 | −0.145 | −0.026 | 3.607 | −0.371 |
| Walkability | −2.385 | −0.229 | 0.036 | 0.326 | 2.159 | 0.020 |
Model results for weekday and weekend show significant positive correlations between functional density, functional diversity mixture, choice, and walkability with dynamic historic city vibrancy. Conversely, local integration, distance to bus stops, density of aged buildings, diversity of building ages, street length, D/H, sky view ratio, and green view ratio demonstrate a negative relationship with dynamic historic city vibrancy (see the coefficients of GTWR, especially median local coefficients).
Through GTWR analysis, we assessed the temporal fluctuations in average coefficients for explanatory variables on weekday and weekend and visualized their temporal trends. Fig. 7 shows the temporal average coefficients of the built environment variables for 17 timestamps, in which positive coefficients suggest a positive relationship with the dependent variable, and negative coefficients imply a negative relationship. These indicators exhibit fluctuating temporal average coefficients at different timestamps.
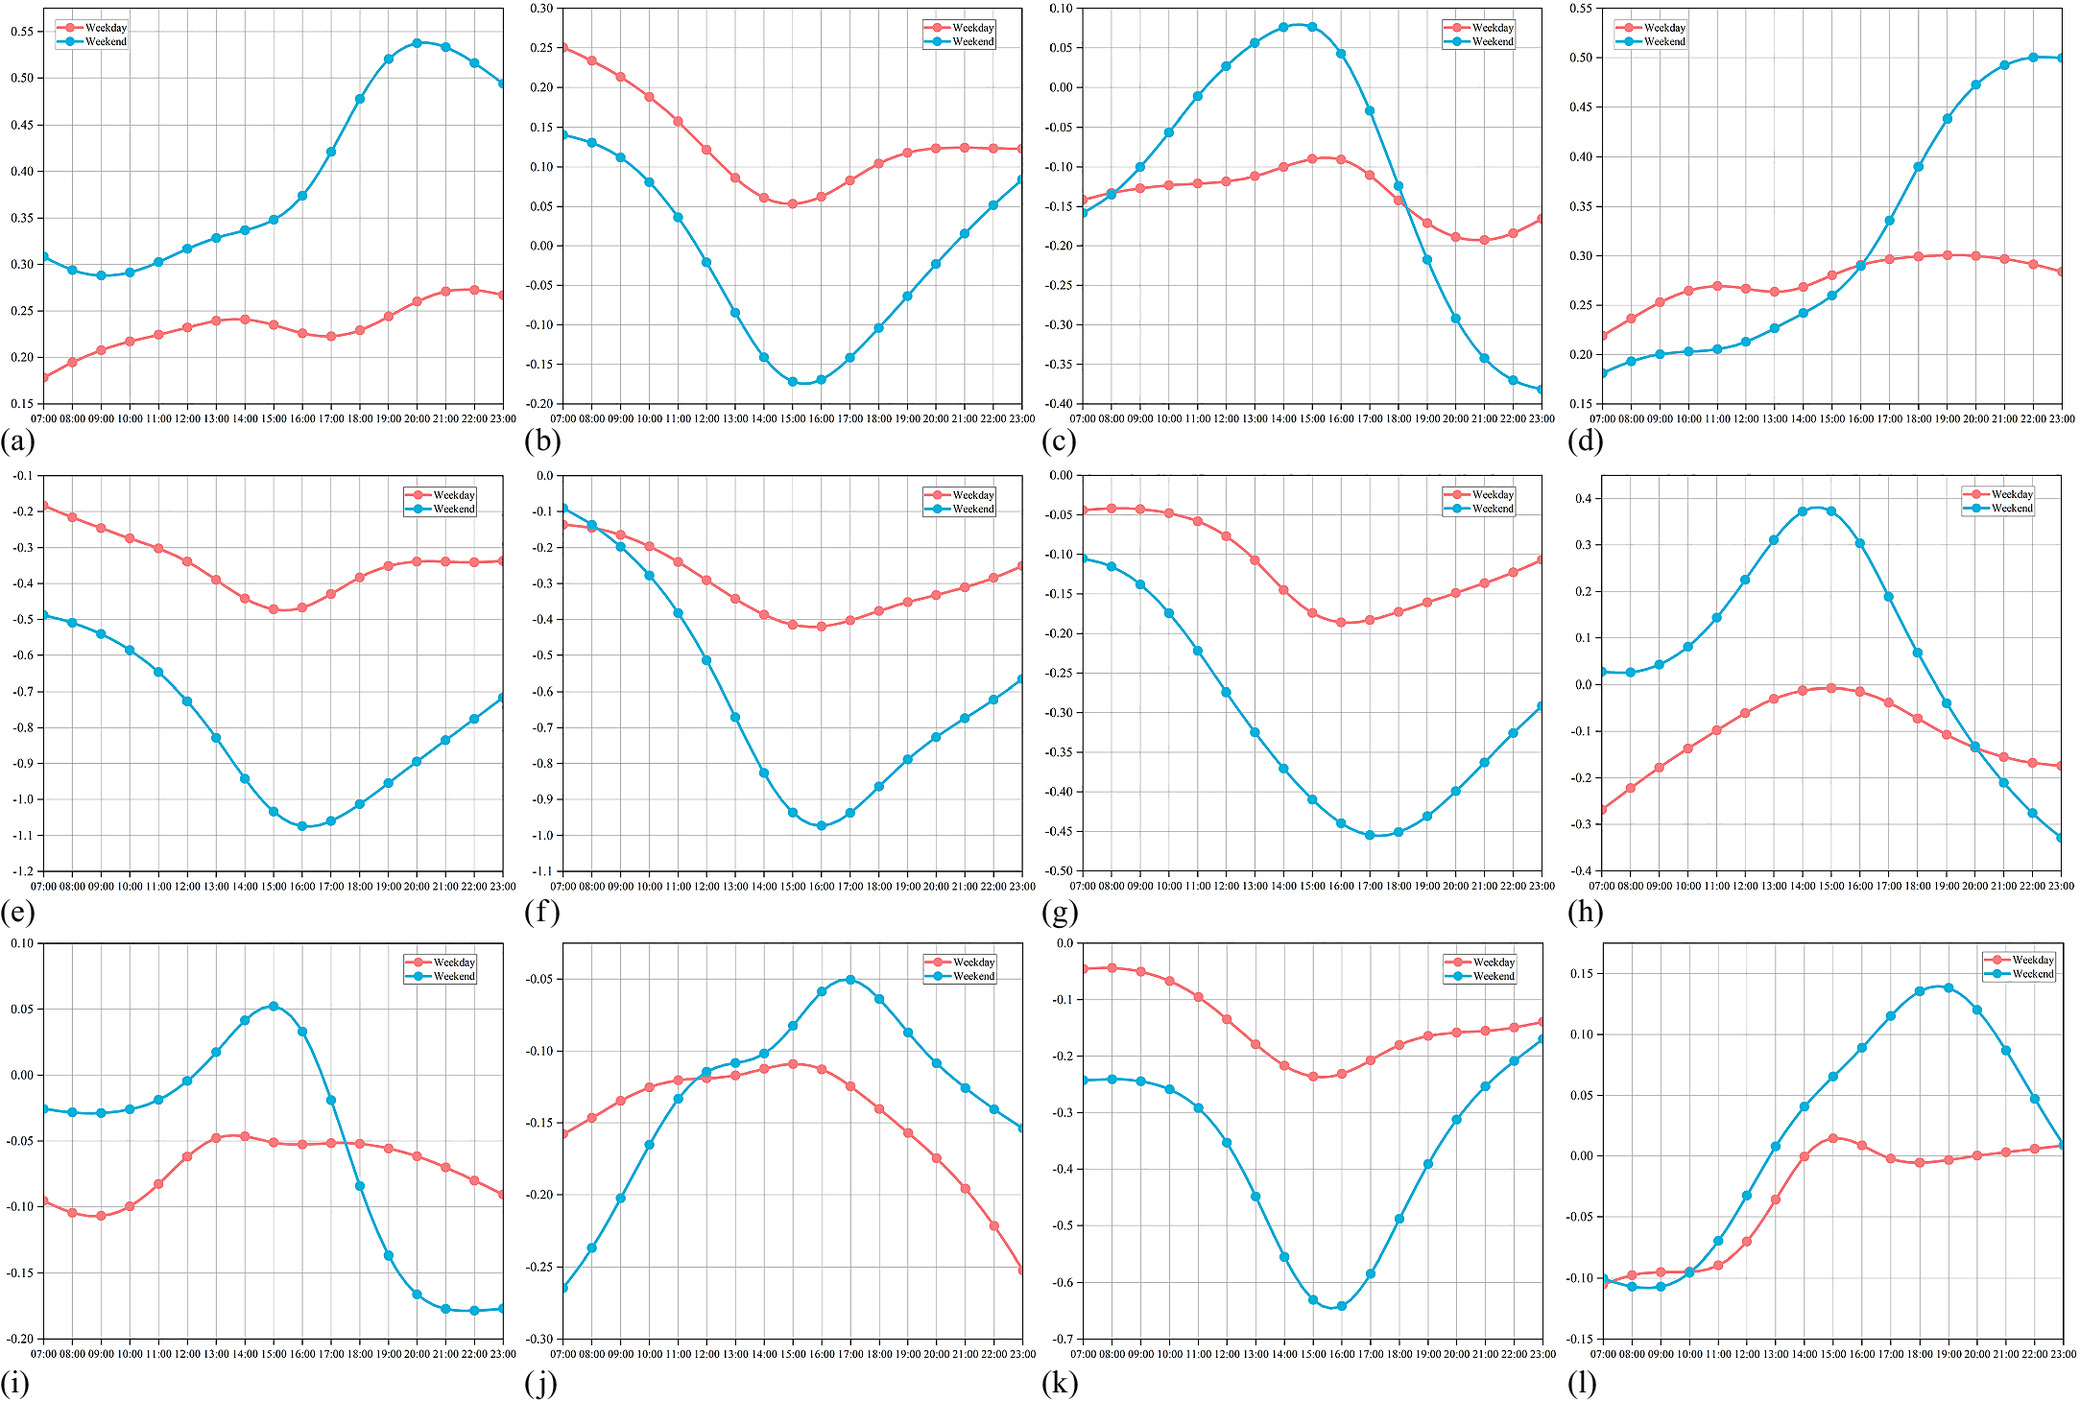
Firstly, functional density is generally higher on weekends compared with weekdays, peaking at 20:00. Secondly, functional diversity mixture shows similar trends on weekdays and weekends, with more pronounced changes on weekends. Thirdly, local integration generally has negative coefficients but turns positive during 11:30–16:30 on weekends, with a more significant degree of change. Choice peaks in the evening on weekends. Distance to bus stops exhibits negative temporal average coefficients, especially on weekends. Fourthly, density of aged buildings trends similarly across the week, with the negative impact being more pronounced on weekends. The diversity of building ages follows a similar pattern. Fifthly, street length is negative on weekdays but positive from 7:00 to 18:30 on weekends. D/H is negative, turning positive from 12:30 to 16:30 on weekends, with more weekend fluctuations. Finally, the sky view ratio has a more significant impact in the afternoons to evenings on weekdays and in the mornings on weekends. The green view ratio dips in the afternoons, with more weekend variations. Walkability is negative in the mornings on both weekdays and weekends but turns positive during two periods on weekday afternoons (14:00–17:00 and 20:00–23:00) and from 14:30 to 23:00 on weekends.
Figs. 8 and 9 present the spatiotemporal patterns of explanatory variable spatial mean coefficients on weekday and weekend, providing insights into their spatial influence on street vitality. We use the Jenks natural breaks method to categorize coefficients for the same indicator on weekday and weekend, setting 0 as the threshold manually. Fig. 10 summarizes the distribution of spatial average coefficients for built environment indicators. In summary, diverse built environment relationships with street vitality exhibit distinct spatial distribution patterns.
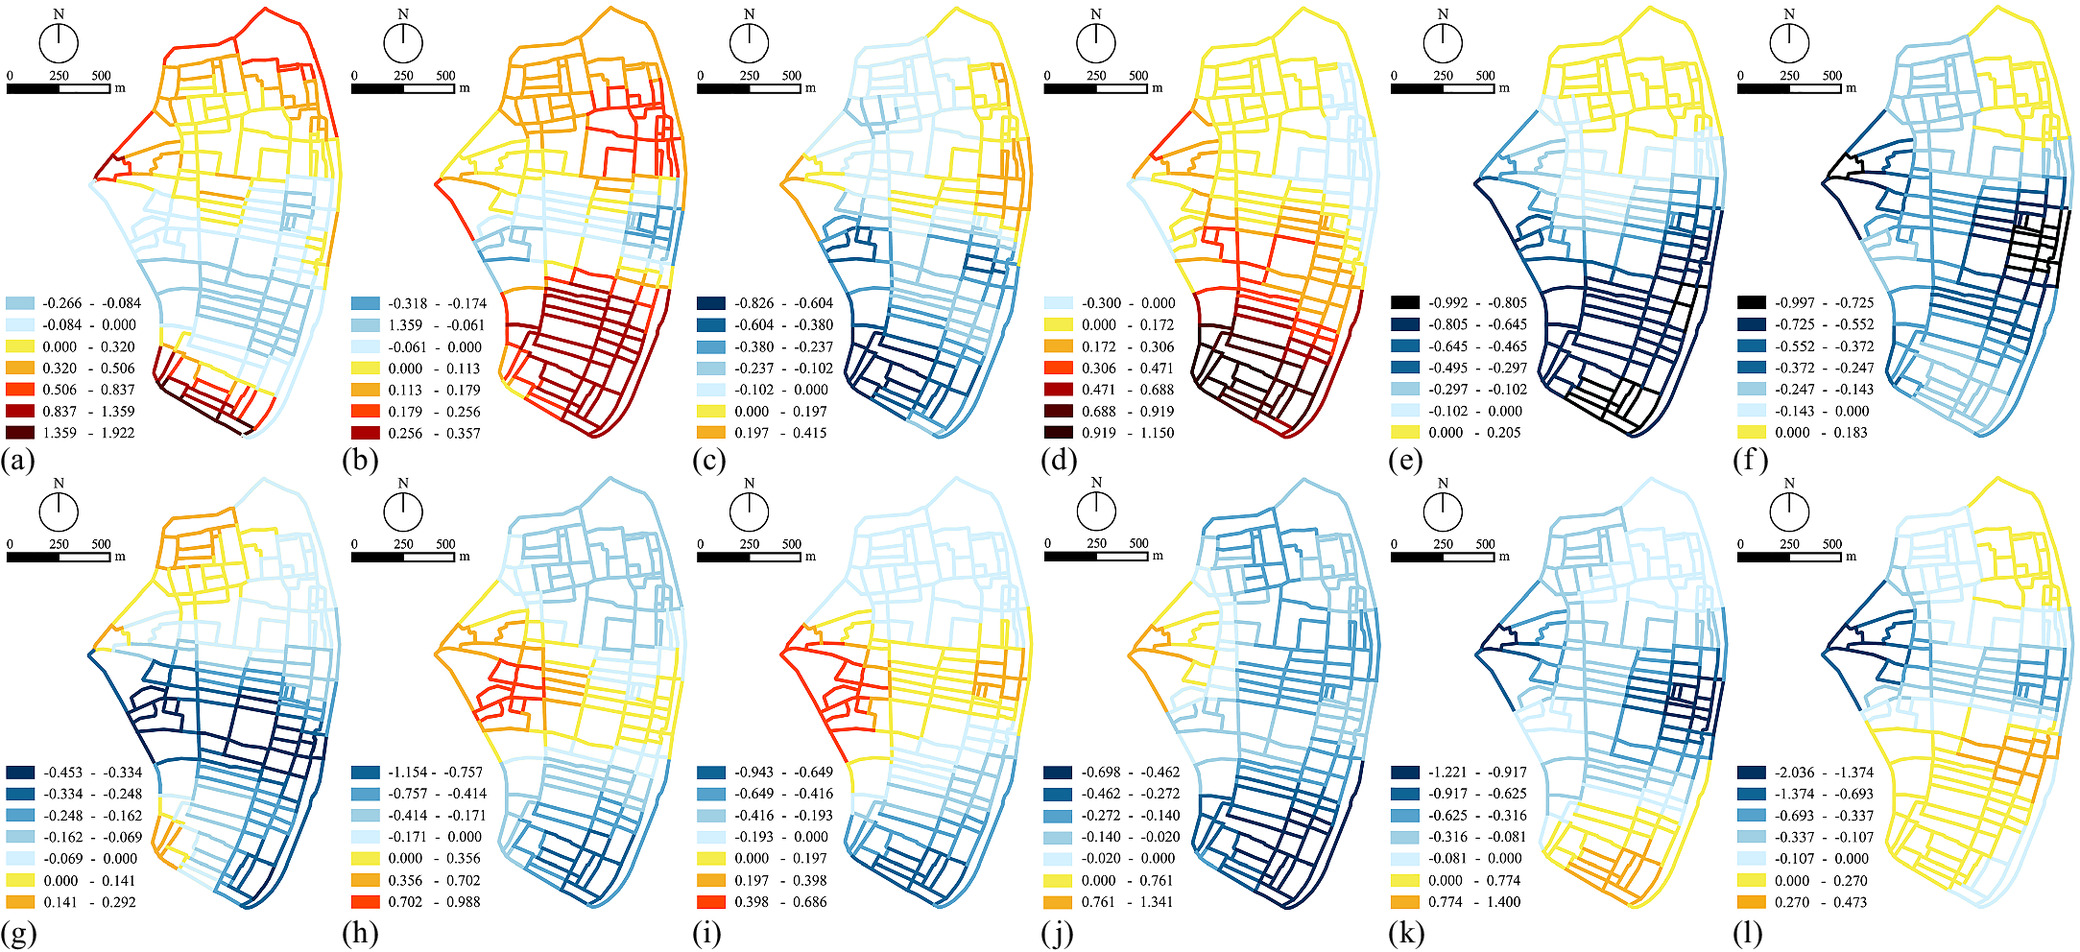
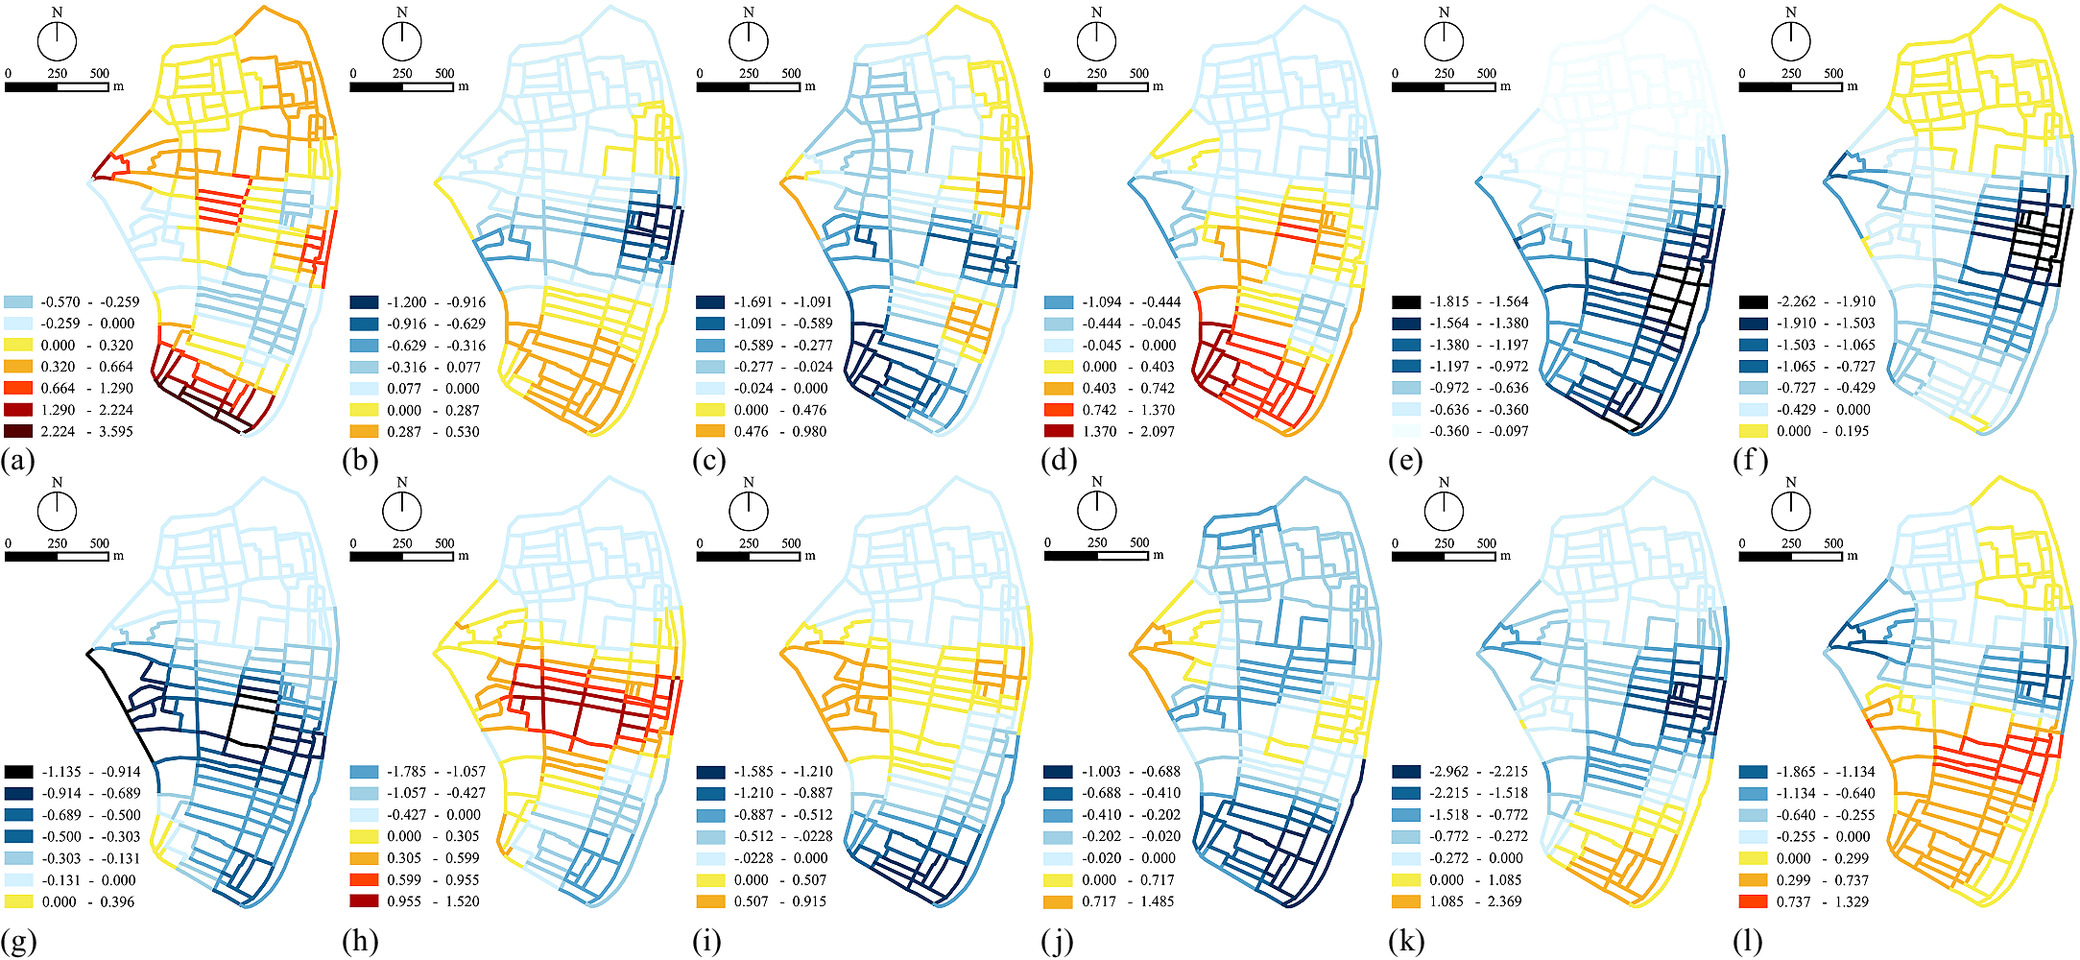
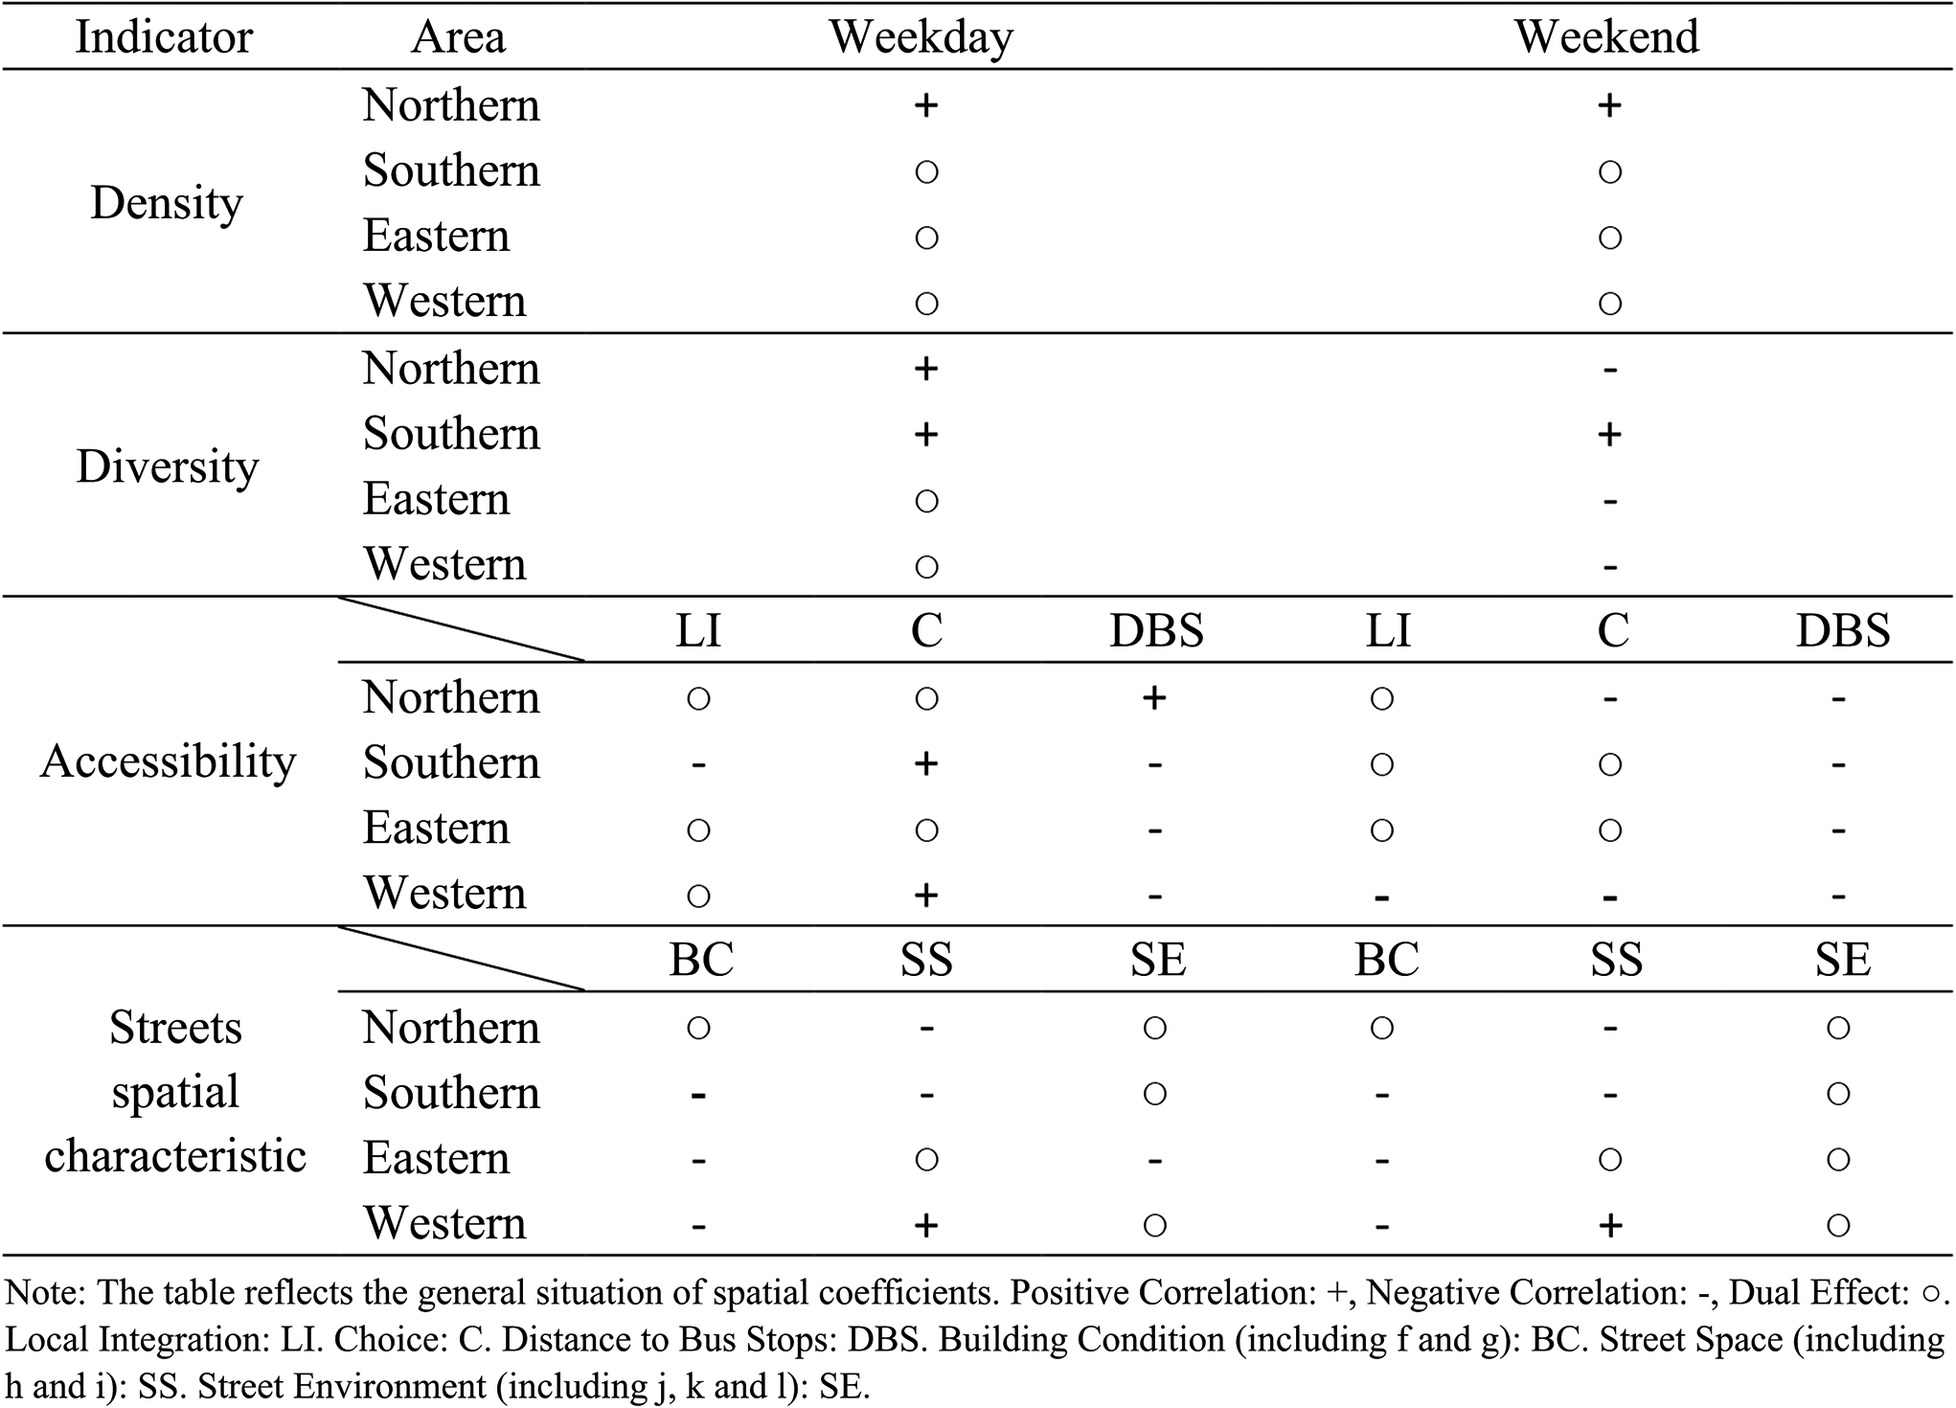
Chaozhou ancient city largely retains its historical spatial layout, with the east along the Han River as a commercial area, the west historically designated for industry, the affluent residing in the southern area, and the north serving as the historical administrative center. Presently, Chaozhou ancient city is composed of 4 streets and 17 community committees, closely aligning with the historic spatial divisions. Accordingly, we divided Chaozhou ancient city into four areas based on street community clusters, provided a tabular description of the population composition, and visualized the built environment indicators (Fig. 11), to facilitate the spatial analysis of regression coefficients.
Density
The spatial average coefficients of functional density show similar distributions on weekday and weekend. They are positive in the northern area, while exhibiting a dual effect in the other three areas.
Diversity
The spatial average coefficients of functional diversity mixture show significant variations between weekday and weekend. In the southern area, the coefficients are consistently positive, whereas in other areas, there are more pronounced positive and negative changes.
Accessibility
There is little spatial variation in local integration coefficients, but the coefficients for choice and distance to bus stops show greater variations in the northern and western areas.
Street Spatial Characteristic
The spatial distribution of the density of aged buildings and diversity of building ages shows differences mainly in the northern area on weekdays and weekends, with negative values in the other three areas. The positive coefficients of street length and D/H are primarily distributed in the eastern and western areas, while they are mostly negative in the north and south. The spatial average coefficients for sky view ratio, green view ratio, and walkability show little variation between weekdays and weekends, presenting a dual effect in the street environment they constitute.
In general, the relationships between each built environment indicator and street vitality change over time and space. Particularly, the coefficients of the built environment indicators vary across the 17 timestamps. Similarly, the strength of the impact of built environment indicators on the spatial vitality of the streets varies within the spatial units for both weekday and weekend.
Discussion
This study extends previous research in several aspects. First, the Baidu Heat Map was used to record real-time human activities and their spatial distribution and intensity. Second, the investigation delves into the spatiotemporal heterogeneity between historic city streets and their vitality, revealing dynamic variations in their relationship. The results reveal that the relationship between built environment characteristics and street vitality varies both spatially and temporally, highlighting the dynamic variation rather than the static one in their relationship. Human behavioral activity patterns influence both the temporal fluctuations and the spatial distribution of historic city vitality, intertwined with the role of the built environment in shaping these activities.
Major Findings
Density
Functional density is a key predictor of historic city vitality (Wu et al. 2018; Ye et al. 2018; Huang et al. 2020, 2023). This pattern holds true temporally in Chaozhou ancient city. However, spatially, there are areas where the city’s vitality negatively correlates with functional density. Generally, higher functional density corresponds to greater human activity (Si et al. 2021), with dining and entertainment venues playing a prominent role (Huang et al. 2022). Meanwhile, in historic districts, commercial layout and diversity significantly enhance vitality (Zhang et al. 2019). Yet, some studies have shown that not all increases in spatial functional density correlate positively with vitality, with the impact of increasing POI density having only a limited impact on neighborhood vitality (Yue et al. 2017) or not being statistically significant (Wu et al. 2022). Functional density partially mirrors community needs. Chaozhou ancient city's uniqueness lies in its dual role as a residential area and a tourist destination, houses 46,587 residents, numerous post-1980s’ buildings, and social service facilities. Its demographic breakdown includes 12.63% of people aged 0–14, 56.36% aged 15–59, and 31.01% aged over 60, with 65.91% being local registrants. The relatively high elderly population and about a third being migrant workers or transient populations might present an obvious tidal phenomenon of crowd activity (Zhang et al. 2019, 2021; Si et al. 2021; Chen et al. 2023). These demographic factors contribute to distinct activity patterns on weekdays and weekends. On the other hand, as an important spatial carrier of functional density, the planar configuration, layout, and openness of buildings significantly impact the city's vitality. Areas with a negative correlation between functional density and vitality are mainly concentrated in streets with long alleys, older residential areas, or streets carrying essential urban services like schools and hospitals. These areas are less interconnected with the city, with streets located within relatively enclosed blocks and buildings typically elongated and closed off externally, or serving a singular but significant service function. Additionally, the saturation of traditional arcade street businesses needs attention. Increasing functional density in these areas has limited impact on enhancing vitality. Nonetheless, functional density is one of the crucial factors in stimulating the vitality of ancient cities.
Diversity
Functional diversity displays significant spatiotemporal heterogeneity in its relationship with street vitality. In theory, it is considered a primary generator of vitality (Jacobs 1961; Montgomery 1998). The coexistence of various functions is crucial for facilitating a range of human activities (Yue et al. 2017; Niu et al. 2019; Huang et al. 2020; Wang et al. 2022; Vidal Domper et al. 2023). Some studies propose that enhancing functional diversity might not universally elevate vitality; its impact could be limited to specific time intervals (Si et al. 2021) or result in modest enhancements (Meng and Xing 2019). Similarly, in Chaozhou ancient city, the relationship between functional diversity and vitality varies, with both positive and negative associations observed at specific times and locations. Our findings indicate that functional diversity does not uniformly enhance vitality in every street of the historic city. For instance, streets with high functional diversity sometimes exhibit a negative correlation with vitality, especially on weekends. This could be influenced by the varying activity patterns of different population groups and the type and mix of functional formats, which is also reflected temporally. In residential areas dominated by traditional and modern housing, the demand for functional diversity remains stable. In areas with essential urban facilities like hospitals and schools, while vital, limit functional diversity. The aggregation of people in these areas is influenced more by key functions than by diversity features. These factors lead to varying impacts of functional diversity on vitality in different areas, sometimes even inhibiting it.
Accessibility
Previous research has demonstrated that accessibility plays a critical role in enhancing street vibrancy (Sung and Lee 2015; Huang et al. 2020; Wu et al. 2022; Huang et al. 2023; Vidal Domper et al. 2023; Dong et al. 2023); however, some studies have suggested that proximity to public transportation is unrelated to physical activity (Sallis et al. 2016). The results of this study demonstrate a spatiotemporal correlation between accessibility and the vitality of historic city streets. Although the observed seasonal climate effects somewhat diminish the positive correlation between local integration and historic city vitality during winter, the overall results from spatial syntax analysis still subtly reveal the potential of historic city streets as pedestrian destinations and significant urban transit nodes. Chaozhou ancient city streets create a convenient road network, while areas farther from transportation hubs limit mobility and activities due to transportation inconveniences. However, in this study, a positive correlation was observed between weekday vitality and distance to bus stops in the northern part. Field research indicates that this phenomenon is closely related to the unique geographical characteristics of the northern part, the limited number of buses, and their sparse distribution, compelling residents to converge on these stops to meet their travel needs. Notably, the impact of accessibility on vitality varies by day or night and on weekdays or weekends, aligning with findings from other studies (Zhao et al. 2023). On weekdays, street ability to attract traffic and facilitate movement significantly influences vitality. This is reasonable because on weekdays, especially in the mornings, people primarily prioritize travel efficiency. On weekends, street connectivity has a more prominent influence because people have more leisure time, reducing the demand for rapid and efficient travel and focusing more on comfortable walking behaviors (Wu et al. 2022; Chen et al. 2023).
The potential impact of the built environment on vitality has been confirmed internationally (Sallis et al. 2016), with a particular emphasis on its impact within streets (Wu et al. 2022). However, it is essential to consider not only two-dimensional aspects but also three-dimensional factors (Si et al. 2021; Huang et al. 2020). In this context, the three-dimensional characteristics of buildings exert a more significant influence on vitality than their two-dimensional counterparts (Zhang et al. 2021). Streets hold historical memories and serve as vital spaces for structures and activities. Additionally, on a practical level, they play a crucial role in design and renovation. To comprehensively assess their impact on vitality, we divide these spaces into three components: buildings, street spaces, and street environments.
Buildings, as a fundamental infrastructure in historic cities, serve as spaces for accommodating human activities. Traditional wisdom suggests that aged buildings foster urban vitality (Jacobs 1961). This view is also supported by case studies in high-density urban areas of China (Wu et al. 2018). However, our research findings reveal that Chaozhou ancient city deviates from this pattern. Here, the density of aged buildings and diversity of building ages often show negative correlations with vitality across time and space, with some exceptions. This discovery contradicts prior research on residential areas in Seoul (Sung and Lee 2015). Moreover, some studies have pointed out that an appropriate proportion of aged buildings promote street vitality, but this does not hold true for historic streets in China (Niu et al. 2019). We posit that the unique architectural composition of Chaozhou ancient city and urban renewal may lead to different conclusions. Primarily, a significant portion of aged buildings consists of traditional residential structures, often remaining residential or vacant, limiting accessibility and having a relatively homogeneous local resident population. Additionally, aged buildings are subject to preservation constraints, limiting their adaptability and flexibility. Aged buildings, while protected, face constraints in their adaptability and flexibility. Although the historic structures within the ancient city are under strict preservation measures, if they pose a threat to fire safety, demolition becomes necessary to widen roads and ensure safety. Furthermore, the development of modern living facilities and tourist attractions, such as shops, restaurants, residential renovations, and memorials, may affect the preservation of old buildings. This modernization could lead to a decrease in the density of old buildings in these areas. Visitors seeking leisure activities may prefer areas with higher accessibility and comprehensive amenities like dining services (Meng and Xing 2019). Furthermore, areas with greater architectural diversity imply the coexistence of structures from different historical periods, necessitate complex renovation and preservation efforts, and may lack modern facilities, potentially inhibiting vitality. Therefore, considering contemporary activity demands and preservation constraints on aged buildings, both the density of aged buildings and the diversity of building ages tend to exhibit negative associations with vitality in the historic city.
Streets spaces, including street length and D/H, show varying correlations with vitality in the historic city. Existing studies suggest a positive link between street length and vitality (Niu et al. 2019), yet shorter streets with more intersections also promote pedestrian activity (Larranaga et al. 2016). However, extremely short streets may not be ideal (Wu et al. 2022). Furthermore, the impact of street length on vitality varies between weekdays and weekends (Zhao et al. 2023). The historic city's cultural heritage attracts visitors. Longer streets offer more exploration opportunities and sightseeing, but their impact on vitality varies based on walkers’ motivations. The variation in the spatial distribution of street length between weekdays and weekends reflects this distinction. Longer streets may discourage vitality when speed is a priority, leading to increased walking distances. In contrast, shorter street segments enhance road density and traffic efficiency in pedestrian-centric areas, thereby improving traffic efficiency (Wang et al. 2022; Gómez-Varo et al. 2022; Huang et al. 2023). In terms of time and space, the results for D/H and street length have certain similarities with street length. D/H is a measure of spatial openness, with higher values indicating more open spaces and lower values indicating enclosed spaces. Some studies suggest that overly wide walkways can hinder street vitality (Si et al. 2021). However, closed environments, dense buildings, and streets can also deter jogging activities (Dong et al. 2023). In the historic city, unique narrow spatial characteristics enhance the touring experience, attracting more people. However, such narrow streets are spatially limited and may accommodate only a limited number of people. In contrast, streets accommodating both motorized and nonmotorized vehicles often require wider roadways. Pedestrian-prioritized streets adapt to different D/H values, indicating a tolerance for varied spatial openness, yet ensuring adequate width for mixed traffic remains essential.
The street environment encompasses sky view ratio, green view ratio, and walkability. Existing research indicates that a high sky view ratio negatively affects commercial street vitality but positively impacts morning and residential street vitality (Si et al. 2021). Greenery enhances street appeal at a microlevel, but excessive greenery can reduce street functions, stifling vitality (Wu et al. 2022). Additionally, walkability is positively linked to urban vitality (Azmi and Karim 2012; Li et al. 2022). However, in Chaozhou ancient city, both sky view ratio and green view ratio generally exhibit negative temporal and spatial correlations with street vitality. Walkability shows varying positive or negative temporal and spatial associations with historic city vitality. The historic city's buildings, mainly traditional residences and arcade structures, create compact streets with low sky view ratios. These unique streets draw crowds due to their charm. Nevertheless, limited space restricts extensive greening, contributing to the negative correlations of sky view ratio and green view ratio with historic city street vitality. Furthermore, our findings suggest that despite trees along roadsides and riverside parks surrounding Chaozhou historic city, their greenery has a limited impact on vitality, aligning with the findings of some previous research (Meng and Xing 2019; Li et al. 2022), indicating that mere green spaces do not effectively attract human activities, although their preservation contributes to the balanced development of humans and nature. Walkability's correlation with street vitality is closely tied to variations in activities between weekdays and weekends, reflecting the changes in crowd composition.
Limitations
This study has the following limitations. First, we aimed to draw general conclusions using Chaozhou's ancient city as a representative case, although the results may be context-specific. Comparative research with other urban areas is needed to enhance the universality of our methods and conclusions. Second, while we selected time points with a relatively stable user activity and conducted a week-long collection of heat map data, it may not fully represent population density in the research area. Future research could consider supplementation with mobile data to reduce sample bias. Third, our study primarily focused on the objective environment within the historic city, while also taking into account population data including population numbers and age composition. Future research could further engage in field interviews to incorporate more detailed community portraits and surveys. Last, when capturing street view images, movable objects in the streets may obstruct elements in the images, but in this study, we focused on the sky, greenery, and ground, minimizing the impact of crowd obstruction on these areas and ensuring accurate extraction and calculation of street environmental conditions.
Conclusions
This study utilized multisource data to investigate the intricate relationship between street vitality and the built environment in Chaozhou ancient city. Drawing on Jacobs’ vitality theory and the 5D concept, we attempted to establish a preliminary framework from the perspective of the built environment to explore and understand the factors influencing the historic city vitality. Employing the GTWR model, we explored spatiotemporal associations between street vitality and the built environment, providing insights on how indicators of density, diversity, accessibility, and street space characteristics influence the vitality of ancient cities in mesoscale spaces across time and spatial dimensions, thus enriching our understanding of the built environment's role in the historic city. Our findings reveal that functional density, functional diversity mixture, accessibility, and street-lane spatial features are associated with the spatiotemporal dynamics of vibrancy in Chaozhou ancient city. Although density and diversity are recognized as effective predictors of historic city vitality, our empirical results from Chaozhou ancient city demonstrate significant spatiotemporal heterogeneity, indicating their contrasting multifaceted and limited roles in enhancing city vitality. The relationship between functional density and vitality is not constant, exhibiting complex spatiotemporal dynamics. Functional diversity does not uniformly elevate vitality across all streets, and an oversaturated distribution of commercial functions might sometimes even suppress vitality. In discussing the historic city’s accessibility, the capacity of streets to attract traffic flow and their own navigability needs attention, which is crucial for effective traffic and pedestrian flow management during the protection and development of the historic city. The negative correlation between the density of aged buildings, the diversity of building ages, and historic city vitality across time and space indicates issues of underutilization of historical resources in some ancient cities. This prompts a reconsideration of the balance between historic building preservation and utilization and the relationship between historic buildings and modern activity demands. It advocates for the exploration of innovative design and planning methodologies that are aimed at effectively revitalizing historical spaces. Additionally, the impact of the built environment on vitality varies over time, with distinct population dynamics during weekdays and weekends. Compared with spatial nonstationarity, the temporal nonstationarity of the relationship between street space, street environment, and vitality is more pronounced. To enhance the spatial environment and shape the historic city vitality effectively, policymakers and urban planners should consider the spatiotemporal effects of the built environment, focusing on the judicious use of aged buildings and equitable distribution of public services while implementing targeted interventions in different areas within the historic city. This study offers nuanced insights for an in-depth analysis of the impact of the built environment in ancient cities at a human-centric scale on vitality. The findings provide substantial and innovative support for revitalization and preservation efforts in ancient cities.
Appendix. Results of the Spatial Autocorrelation Test
| Time | Weekday | Weekend | ||||
|---|---|---|---|---|---|---|
| Moran’s I | Z-score | P value | Moran’s I | Z-score | P value | |
| Full time | 0.655*** | 33.509 | 0.000 | 0.798*** | 40.766 | 0.000 |
| 7:00 | 0.557*** | 28.366 | 0.000 | 0.551*** | 28.124 | 0.000 |
| 8:00 | 0.585*** | 29.771 | 0.000 | 0.782*** | 39.705 | 0.000 |
| 9:00 | 0.577*** | 29.569 | 0.000 | 0.451*** | 23.033 | 0.000 |
| 10:00 | 0.394*** | 20.479 | 0.000 | 0.438*** | 22.495 | 0.000 |
| 11:00 | 0.489*** | 25.289 | 0.000 | 0.577*** | 29.593 | 0.000 |
| 12:00 | 0.495*** | 25.435 | 0.000 | 0.672*** | 34.433 | 0.000 |
| 13:00 | 0.639*** | 32.769 | 0.000 | 0.729*** | 37.324 | 0.000 |
| 14:00 | 0.659*** | 33.745 | 0.000 | 0.766*** | 39.255 | 0.000 |
| 15:00 | 0.817*** | 41.819 | 0.000 | 0.827*** | 42.269 | 0.000 |
| 16:00 | 0.727*** | 37.188 | 0.000 | 0.777*** | 39.727 | 0.000 |
| 17:00 | 0.738*** | 37.860 | 0.000 | 0.949*** | 48.444 | 0.000 |
| 18:00 | 0.605*** | 30.998 | 0.000 | 0.796*** | 40.704 | 0.000 |
| 19:00 | 0.620*** | 31.792 | 0.000 | 0.843*** | 43.164 | 0.000 |
| 20:00 | 0.769*** | 39.292 | 0.000 | 0.840*** | 42.925 | 0.000 |
| 21:00 | 0.791*** | 40.478 | 0.000 | 0.875*** | 44.776 | 0.000 |
| 22:00 | 0.501*** | 25.830 | 0.000 | 0.557*** | 28.618 | 0.000 |
| 23:00 | 0.690*** | 35.212 | 0.000 | 0.488*** | 25.163 | 0.000 |
Note: ***P < 0.01 is significant at the 1% significance levels.
Data Availability Statement
All data, models, and codes generated or used during the study appear in the published article.
Acknowledgments
This work was supported by the China Scholarship Council (No. 202306150063).
References
Azmi, D. I., and H. A. Karim. 2012. “Implications of walkability towards promoting sustainable urban neighbourhood.” Procedia Social Behav. Sci. 50 (1): 204–213. https://doi.org/10.1016/j.sbspro.2012.08.028.
Cervero, R., and K. Kockelman. 1997. “Travel demand and the 3Ds: Density, diversity, and design.” Transp. Res. Part D Transp. Environ. 2 (3): 199–219. https://doi.org/10.1016/S1361-9209(97)00009-6.
Cervero, R., O. L. Sarmiento, E. Jacoby, L. F. Gomez, and A. Neiman. 2009. “Influences of built environments on walking and cycling: Lessons from Bogotá.” Int. J. Sustainable Transp. 3 (4): 203–226. https://doi.org/10.1080/15568310802178314.
Chen, Y., B. Yu, B. Shu, L. Yang, and R. Wang. 2023. “Exploring the spatiotemporal patterns and correlates of urban vitality: Temporal and spatial heterogeneity.” Sustainable Cities Soc. 91: 104440. https://doi.org/10.1016/j.scs.2023.104440.
Dong, L., H. Jiang, W. Li, B. Qiu, H. Wang, and W. Qiu. 2023. “Assessing impacts of objective features and subjective perceptions of street environment on running amount: A case study of Boston.” Landscape Urban Plann. 235: 104756. https://doi.org/10.1016/j.landurbplan.2023.104756.
El-Basha, M. S. 2021. “Urban interventions in historic districts as an approach to upgrade the local communities.” HBRC J. 17 (1): 329–364. https://doi.org/10.1080/16874048.2021.1938892.
Fan, Z., J. Duan, M. Luo, H. Zhan, M. Liu, and W. Peng. 2021. “How did built environment affect urban vitality in urban waterfronts? A case study in Nanjing reach of Yangtze River.” ISPRS Int. J. Geo-Inf. 10 (9): 611. https://doi.org/10.3390/ijgi10090611.
Fotheringham, A. S., R. Crespo, and J. Yao. 2015. “Geographical and temporal weighted regression (GTWR).” Geogr. Anal. 47 (4): 431–452. https://doi.org/10.1111/gean.12071.
Gehl, J. 1987. Life between buildings: Using public space. 6th ed. Translated by Jo Koch. Washington, DC: Island Press.
Gómez-Varo, I., X. Delclòs-Alió, and C. Miralles-Guasch. 2022. “Jane Jacobs reloaded: A contemporary operationalization of urban vitality in a district in Barcelona.” Cities 123: 103565. https://doi.org/10.1016/j.cities.2022.103565.
Hirt, S., and D. Zahm. 2012. The urban wisdom of Jane Jacobs. London: Routledge.
Huang, B., B. Wu, and B. Michael. 2010. “Geographically and temporally weighted regression for modeling spatiotemporal variation in house prices.” Int. J. Geogr. Inf. Sci. 24 (3): 383–401. https://doi.org/10.1080/13658810802672469.
Huang, B., Y. Zhou, Z. Li, Y. Song, J. Cai, and W. Tu. 2020. “Evaluating and characterizing urban vibrancy using spatial big data: Shanghai as a case study.” Environ. Plann. B: Urban Anal. City Sci. 47 (9): 1543–1559. https://doi.org/10.1177/2399808319828730.
Huang, J., X. Hu, J. Wang, and A. Lu. 2023. “How diversity and accessibility affect street vitality in historic districts?” Land 12 (1): 219. https://doi.org/10.3390/land12010219.
Huang, X., P. Gong, S. Wang, M. White, and B. Zhang. 2022. “Machine learning modeling of vitality characteristics in historical preservation zones with multi-source data.” Buildings 12 (11): 1978. https://doi.org/10.3390/buildings12111978.
ICOMOS (International Council on Monuments and Sites). 1982. Declaration of Tlaxcala on the revitalization of small settlements. Tlaxcala, Mexico: ICOMOS.
ICOMOS (International Council on Monuments and Sites). 1987. Charter for the conservation of historic towns and urban areas. Washington, DC: ICOMOS.
ICOMOS (International Council on Monuments and Sites). 1999. Charter on the built vernacular heritage. Mexico City: ICOMOS.
ICOMOS (International Council on Monuments and Sites). 2011. The Valletta principles for the safeguarding and management of historic cities towns and urban areas. Paris: ICOMOS.
Jacobs, J. 1961. The death and life of great American cities. New York: Random House.
Katz, P., V. J. Scully, and T. W. Bressi. 1994. The new urbanism: Toward an architecture of community. Vol. 10. New York: McGraw-Hill.
Król, K., J. Hernik, B. Prus, and M. Szylar. 2022. “The need to preserve cultural heritage.” In Cultural heritage—Possibilities for land-centered societal development, edited by J. Hernik, M. Walczycka, E. Sankowski, and B. J. Harris, 1–14. Cham, Switzerland: Springer. Environmental History.
Larranaga, A. M., L. I. Rizzi, J. Arellana, O. Strambi, and H. B. B. Cybis. 2016. “The influence of built environment and travel attitudes on walking: A case study of Porto Alegre, Brazil.” Int. J. Sustain. Transp. 10 (4): 332–342. https://doi.org/10.1080/15568318.2014.93398.
Li, X., Y. Li, T. Jia, L. Zhou, and I. H. Hijazi. 2022. “The six dimensions of built environment on urban vitality: Fusion evidence from multi-source data.” Cities 121: 103482. https://doi.org/10.1016/j.cities.2021.103482.
Lynch, K. 1984. A theory of good city form. Cambridge, UK: MIT Press.
Meng, Y., and H. Xing. 2019. “Exploring the relationship between landscape characteristics and urban vibrancy: A case study using morphology and review data.” Cities 95: 102389. https://doi.org/10.1016/j.cities.2019.102389.
Montgomery, J. 1998. “Making a city: Urbanity, vitality and urban design.” J. Urban Des. 3 (1): 93–116. https://doi.org/10.1080/13574809808724418.
Niu, H., and E. A. Silva. 2020. “Crowdsourced data mining for urban activity: Review of data sources, applications, and methods.” J. Urban Plann. Dev. 146 (2): 1–15. https://doi.org/10.1061/(ASCE)UP.1943-5444.0000566.
Niu, X., W. Wu, and M. Li. 2019. “Influence of built environment on street vitality and its spatiotemporal characteristics based on LBS positioning data.” Urban Plann. Int. 34 (1): 28–37. https://doi.org/10.22217/upi.2018.495.
Sallis, J. F., et al. 2016. “Physical activity in relation to urban environments in 14 cities worldwide: A cross-sectional study.” Lancet 387 (10034): 2207–2217. https://doi.org/10.1016/s0140-6736(15)01284-2.
Si, R., Y. Lin, Z. Xiao, and Y. Ye. 2021. “Spatio-temporal analysis of built environment and street vitality relationship based on street-level imagery: A case study of Futian District, Shenzhen.” Sci. Geogr. Sin. 41 (9): 1536–1545.
Sung, H., and S. Lee. 2015. “Residential built environment and walking activity: Empirical evidence of Jane Jacobs’ urban vitality.” Transp. Res. Part D Transp. Environ. 41 (12): 318–329. https://doi.org/10.1016/j.trd.2015.09.009.
Ta, N., Y. Zeng, Q. Zhu, and J. Wu. 2020. “Relationship between built environment and urban vitality in Shanghai downtown area based on big data.” Sci. Geogr. Sin. 40 (1): 60–68.
Tweed, C., and M. Sutherland. 2007. “Built cultural heritage and sustainable urban development.” Landsc. Urban Plan. 83 (1): 62–69. https://doi.org/10.1016/j.landurbplan.2007.05.008.
UNESCO. 2013. New life for historic cities: The historic urban landscape approach explained. Paris: World Heritage Centre.
Vidal Domper, N., G. Hoyos-Bucheli, and M. Benages Albert. 2023. “Jane Jacobs’s criteria for urban vitality: A geospatial analysis of morphological conditions in Quito, Ecuador.” Sustainability 15 (11): 8597. https://doi.org/10.3390/su15118597.
Wang, J. 2012. “Problems and solutions in the protection of historical urban areas.” Front. Archit. Res. 1 (1): 40–43. https://doi.org/10.1016/j.foar.2012.02.008.
Wang, S., Q. Deng, S. Jin, and G. Wang. 2022. “Re-examining urban vitality through Jane Jacobs’ criteria using GIS-sDNA: The case of Qingdao, China.” Buildings 12 (10): 1586. https://doi.org/10.3390/buildings12101586.
Wu, J., N. Ta, Y. Song, J. Lin, and Y. Chai. 2018. “Urban form breeds neighborhood vibrancy: A case study using a GPS-based activity survey in suburban Beijing.” Cities 74: 100–108. https://doi.org/10.1016/j.cities.2017.11.008.
Wu, W., Z. Ma, J. Guo, X. Niu, and K. Zhao. 2022. “Evaluating the effects of built environment on street vitality at the city level: An empirical research based on spatial panel Durbin model.” Int. J. Environ. Res. Public Health 19 (3): 1664. https://doi.org/10.3390/ijerph19031664.
Wu, W., and X. Niu. 2019. “Influence of built environment on urban vitality: Case study of Shanghai using mobile phone location data.” J. Urban Plann. Dev. 145 (3): 1–13.
Ye, Y., D. Li, and X. Liu. 2018. “How block density and typology affect urban vitality: An exploratory analysis in Shenzhen, China.” Urban Geogr. 39 (4): 631–652. https://doi.org/10.1080/02723638.2017.1381536.
Yue, Y., Y. Zhuang, A. G. O. Yeh, J.-Y. Xie, C.-L. Ma, and Q.-Q. Li. 2017. “Measurements of POI-based mixed use and their relationships with neighbourhood vibrancy.” Int. J. Geogr. Inf. Sci. 31 (4): 658–675. https://doi.org/10.1080/13658816.2016.1220561.
Zeng, Z., and X. Wang. 2023. “Will world cultural heritage sites boost economic growth? Evidence from Chinese cities.” Sustainability 15 (10): 8375. https://doi.org/10.3390/su15108375.
Zhang, A., W. Li, J. Wu, J. Lin, J. Chu, and C. Xia. 2021. “How can the urban landscape affect urban vitality at the street block level? A case study of 15 metropolises in China.” Environ. Plann. B: Urban Anal. City Sci. 48 (5): 1245–1262. https://doi.org/10.1177/2399808320924425.
Zhang, Y., C. Yang, and L. Qi. 2019. “Study on the assessment of street vitality and influencing factors in the historic district—A case study of Shichahai historic district.” Chin. Landsc. Archit. 35 (3): 106–111.
Zhao, K., J. Guo, Z. Ma, and W. Wu. 2023. “Exploring the spatiotemporal heterogeneity and stationarity in the relationship between street vitality and built environment.” SAGE Open 13 (1): 1–22.
Information & Authors
Information
Published In
Journal of Urban Planning and Development
Volume 150 • Issue 3 • September 2024
Copyright
This work is made available under the terms of the Creative Commons Attribution 4.0 International license, https://creativecommons.org/licenses/by/4.0/.
History
Received: Sep 26, 2023
Accepted: Mar 25, 2024
Published online: Jun 4, 2024
Published in print: Sep 1, 2024
Discussion open until: Nov 4, 2024
Authors
Metrics & Citations
Metrics
Citations
Download citation
If you have the appropriate software installed, you can download article citation data to the citation manager of your choice. Simply select your manager software from the list below and click Download.