Peracetic Acid: A Tool for Wastewater Disinfection Compliance
Publication: Journal of Environmental Engineering
Volume 149, Issue 7
Abstract
Peracetic acid (PAA) has emerged in North America as a cost-effective alternative to other mature disinfection technologies with its ability to eliminate the use of chlorine, address disinfection by-product formation, and meet disinfection compliance at facilities. There are now several US installations of PAA disinfection that have been deployed to meet either Escherichia coli or Enterococcus limits for wastewater discharge; however, there is limited information related to use of PAA disinfection to meet fecal coliform compliance either as a stand-alone process or in conjunction with ultraviolet (UV) disinfection. This research studies bench-scale and pilot investigations to evaluate the feasibility of PAA as a disinfectant, alone as well as in conjunction with an existing UV disinfection system. Bench-scale results indicated PAA could be used as a stand-alone technology or as a backup to UV disinfection; thus pilot testing was implemented. During pilot testing, fecal coliform limits were met with a dose of PAA and four UV reactors in operation on medium power. Additionally, these effluent limits were also met with a dose of PAA and the UV system turned off. Effluent carbonaceous biochemical oxygen demand (cBOD5) was indistinguishable between pre- and post-PAA, and all pH data points fell within a range of 6.03–7.72. These results show that municipalities can utilize bench-scale kinetics to adequately implement PAA disinfection at their facilities.
Introduction
Population growth and other growing demands on water resources for water supply and recreational uses have significantly increased the opportunity for human exposure to wastewaters discharged into the environment. The benefits of dilution, and distance or time in an environmental buffer, before contact or use have been reduced due to wastewater effluent being discharged in more locations and at larger volumes. Domestic wastewater carries human pathogens, and even treated effluents can affect sources of domestic water supply, recreational waters, and shellfish growing areas (Stevenson 1953; Prüss 1998; Xiao et al. 2018). Many wastewater resource recovery facilities (WRRFs) historically have discharged effluent to water bodies designated as recreational waters or as water supply sources used by downstream communities. Potable water supplies are often extracted from these water bodies, and then are physically and chemically treated and distributed to customers.
Disinfection, in the context of wastewater treatment, aims to reduce pathogen concentrations such that human health risks are acceptable. Several disinfection methods are available to WRRFs to reduce the dissemination of pathogens to the environment (Leong et al. 2008). Chlorination became standard for disinfecting treated wastewater and was key to the public health successes in the 20th century. With awareness of the environmental effects associated with disinfection practices in the 1960s and 1970s, regulators identified a need to balance the destruction of pathogenic microorganisms against the effects of disinfected effluent on the biota in receiving water and the creation of by-products that also have serious public health consequences (Whitby and Scheible 2004). The deleterious effects of halogens on the environment, along with the long-term effects of disinfection by-products (DBPs), prompted governments in North America (Environment Canada 1978; US EPA Task Force on Disinfection of Wastewater 1976) to introduce rules regarding residual chlorine and DBPs that have reduced use of chlorine as a wastewater disinfectant (Riordan 1979). These requirements encouraged use of alternative disinfection methods (Whitby and Scheible 2004); however, high capital costs associated with methods such as ultraviolet (UV) and ozone is still a limitation for many WRRFs.
Peracetic acid (PAA) has recently emerged in North America as a cost-effective alternative to other mature disinfection technologies with its ability to eliminate the use of chlorine, address DBP formation, and meet disinfection compliance at facilities. PAA is a chemical oxidant with disinfecting properties first reported in 1949 (Swern 1949), although it was not until the 1970s that interest in water and wastewater treatment applications emerged (Meyer 1976; Baldry 1983; Baldry and French 1989). Although PAA is a relatively new option to the US municipal wastewater disinfection market, it has historically been applied to the food, beverage, medical, and pharmaceutical industries (Orth 1998; Banach et al. 2015; Chenjiao et al. 2016; Boyce 2016) in part because it is an excellent low-temperature disinfectant (Block 1991). PAA is also used as a biocide in paper mill process waters (Jakara et al. 2000; Kiuru 2011), with ecotoxicological research showing limited toxic, mutagenic, and genotoxic effects on aquatic organisms (Henao et al. 2018; Maurício et al. 2020). After disinfection, PAA breaks down into oxygen, water, and acetic acid, with the residual acetic acid breaking down into carbon dioxide and water.
Studies have shown that PAA disinfection results in limited DBP formation and no persistent residues in the environment even when organic matter is present (Baldry and French 1989; Dell’Erba et al. 2007; Henao et al. 2018; Albolafio et al. 2022). For example, a recent study by Albolafio et al. (2022) demonstrated that when a WRRF switched from chlorinated disinfection to PAA alone or PAA/UV combined, the presence of DBPs in the effluent was reduced to negligible values for the regulated trihalomethanes and haloacetic acids. Because of this benefit, PAA is being used at WRRFs in Europe as a substitute for sodium hypochlorite (Nurizzo et al. 2005), where limiting DBPs is a key driver for its use; in turn, research in Italy has focused on characterizing disinfection efficacy and kinetics for these applications (Antonelli et al. 2006; Azzellino et al. 2011). Other studies have indicated that PAA can oxidize bromide to form brominated DBPs in the presence of phenols and further research on the formation of DBPs needs to be explored (Meng et al. 2022).
The adoption of PAA at WRRFs in the United States has started to gain more traction in recent years. The first two major municipal WRRFs in the United States treating more than [10 million gallons per day (mgd)] were brought online in 2018 to meet Escherichia coli compliance [R. W. Hite Treatment Facility at the Denver Metropolitan Reclamation District, Colorado (Newhart et al. 2020), and M. C. Stiles Wastewater Treatment Plant at the City of Memphis, Tennessee (Hilts et al. 2018)]. Additionally, PAA has been in use at an industrial WRRF designed to treat a peak flow of (43 mgd) in Pasadena, Texas, since January 2016 to meet Enterococcus compliance (Levine et al. 2017).
There is a growing body of fundamental research that demonstrates the effectiveness of PAA as a disinfectant over a wide range of effluent qualities, often achieving bacterial inactivation at low doses (Kitis 2004; Leong et al. 2008; Luukkonen and Pehkonen 2017). Other studies have shown PAA’s effectiveness at removing E.coli, Enterococci, and viruses (Balachandran et al. 2021; Schmitz et al. 2021; Pileggi et al. 2022); however, there is a paucity of literature on site-specific evaluations and case study applications of PAA at North American WRRFs, particularly for fecal coliform compliance (Ao et al. 2021).
The purpose of this study was to conduct a stepwise evaluation of the potential use of PAA and its efficacy to meet fecal coliform discharge limits at a WRRF in North Georgia. Bench-scale and pilot investigations evaluated PAA’s potential as a disinfectant alone, as well as in conjunction with an existing UV disinfection system. Further, it is expected that the kinetic analysis used in this case study can be implemented at other WRRFs to allow users to make informed dosing decisions.
Case Study Background
This research was performed at a WRRF in North Georgia and was one of multiple wastewater treatment facilities operated by the municipality. The facility has a capacity rating for treatment of an average of (16 mgd) through its treatment processes. Primary treatment at the facility includes influent pumping, screening, and grit removal; secondary treatment includes biological treatment in oxidation ditches; and final clarification is followed by filtration through cloth media filters. Disinfection is provided by a medium-pressure UV disinfection system, after which disinfected effluent is reaerated in a post-reaeration basin. Once reaeration is complete, treated wastewater effluent flows into a tributary of the Apalachicola–Chattahoochee–Flint River Basin system.
Due to construction on site, staff at the WRRF observed an increased trend in effluent fecal coliform concentrations in effluent discharges (Fig. 1). Staff made operational modifications at the WRRF and identified PAA as a potential temporary measure to address disinfection performance objectives. The concept was that PAA could be used either as a supplement or as a full-scale backup to the existing medium-pressure UV system until long-term disinfection system upgrades could be implemented. The medium-pressure UV system was placed in operation in 2000 and, like other UV facilities of similar age, performance issues were observed as the equipment approached the end of its useful life. Although no permit violations occurred, operational concerns regarding performance and compliance of the existing disinfection system needed to be addressed (Gruss et al. 2015).

There are not specific requirements for the WRRF discharge; rather, disinfection treatment objectives are driven by combined discharge limits in the National Pollutant Discharge Eliminations System (NPDES) permit that addresses combined effluent from both this facility where the pilot was conducted and another wastewater facility located in the same watershed. Water quality limits, including the monthly and weekly limits for effluent carbonaceous biochemical oxygen demand (cBOD5), fecal coliform, and pH at each site, as well as the combined effluent discharge limits are summarized in Table 1. A value of “Report” in Table 1 indicates that the permit only requires the WRRF to record the values of each parameter.
| Parameter | Pilot WRRF | WRRF in same watershed | Combined discharge | |||
|---|---|---|---|---|---|---|
| Monthly average | Weekly average | Monthly average | Weekly average | Monthly average | Weekly average | |
| cBOD5 () | Report | Report | Report | Report | 396 | 495 |
| Fecal coliform () (as geometric mean) | Report | Report | 23 | 46 | 25 | 50 |
| pH | Report | Report | Report | Report | 6.0–9.0 | 6.0–9.0 |
To support temporary implementation of PAA, a technology that has not been widely applied in North America, bench-scale dose–response testing was conducted to (1) provide data for proof of concept, and (2) determine a target PAA dose for disinfection. Data from these tests were used for development of the dose–response relationship of the treatment, and to determine whether other permit water quality parameters such as cBOD5 and pH would be impacted. Following evaluation of bench-scale test results, and with approval of the Georgia Environmental Protection Division, a full-scale pilot was implemented to support the assessment of PAA enhanced disinfection performance with the existing UV system as well as PAA disinfection alone.
Experimental Methods
For both bench- and pilot-scale testing, a sample of a commercially available PAA stock solution (15% peracetic acid, and 23% hydrogen peroxide; VigorOx WWT II), US EPA registered for wastewater disinfection, was obtained from the manufacturer (PeroxyChem, Philadelphia). Prior to performing bench tests, an assay of the VigorOx WWT II stock solution was conducted by adding a measured dose of VigorOx WWT II to a measured amount of deionized water in a clean vessel while mixing. The resulting solution was checked to determine the solution concentration using Standard Method 4500-PAA-B (SMWW 2019) using a CHEMetrics (Midland, Virginia) I2020 Single Analyte Meter (SAM). The PAA residual measurement method is based on a N,N-diethyl-p-phenylenediamine (DPD) reaction with the sample and in the presence of excess potassium iodide (KI) and has a minimum detection limit of PAA.
Bench-Scale Testing Procedures
A non-disinfected secondary effluent water sample from the WRRF was employed in the trials. Bacteria inactivation experiments were conducted at ambient temperature and pH. Sterile, PAA demand-free 1-L beakers containing an initial volume of 1,000 mL of un-disinfected effluent were utilized in bench testing procedures. Flasks were continuously mixed throughout the experiment, and after the water matrix was added to the beakers, the appropriate volume of neat PAA was added. The experiment was conducted on samples collected on two separate dates. During Sample Period 1, in addition to a control, five PAA doses (0.25, 0.5, 1.0, 2.0, and ) were tested. Each dose was evaluated at two contact times, 10 and 30 min. For Sample Period 2, higher doses of 1.0, 2.0, and were tested at contact times of 1, 10, and 30 min. For both bench-scale studies, PAA residual was measured for each contact time and PAA dose. Additionally, 100 mL of sample was removed from each 1-L beaker and immediately quenched with sodium thiosulfate (), and quenched samples were packed on ice for delivery and immediate fecal coliform analysis at the municipality laboratory. Fecal coliforms were analyzed using Standard Method 9222 B (SMWW 2018).
In addition to bacteria inactivation testing, pH and cBOD5 of untreated and treated samples were monitored to assess potential water quality changes that could occur as the result of the addition of peracetic acid. Both pH and cBOD5 were selected for analysis based on requirements for NPDES compliance in the combined discharge, as previously shown in Table 1, and were measured using Standard Methods 4500H (APHA 1992) and 5210B (US EPA 1997), respectively.
Kinetic Analysis of Bench Test Data
Disinfectant decay constants () for each experiment were calculated by regressing measured residuals at each sample time using the least-squares method. PAA conforms to first-order kinetics when inactivating most microorganisms (Rajala-Mustonen et al. 1997); therefore, first-order kinetics were assumed according to Eq. (1)where = first-order disinfectant decay rate; = observed disinfectant residual (); = initial disinfectant dose (); and = time from start of experiment to time of sample (min).
(1)
A (residual concentration × time) approach that leverages the chlorine residual concentrations at the end of the contact basin for process control is traditionally used in wastewater systems using chlorine disinfection. However, this approach is not fully adequate to assess the effectiveness of PAA disinfection because of differences in chemical half-lives. For PAA disinfection, it is necessary to capture the decay characteristics of a specific water matrix in combination with a valid microbial inactivation model. There are many models that have been developed to address this effect and most are generalizations of the Chick–Watson formula (Dunkin et al. 2017). Among the published models, Hom’s model [Eq. (2)] is one of the simplest models that can be used to account for deviations from first-order kinetics. Bacterial inactivation was determined by calculating the negative log of the ratio of surviving organisms to initial organisms () at sample times and fit by Hom’s model, which has been well validated in the literature as appropriate for describing PAA disinfection (Rossi et al. 2007; Azzellino et al. 2011). Hom’s model is one of several models derived from the generalized inactivation ratewhere = undisinfected bacteria concentration () at time ; = bacteria concentration () at time ; = inactivation rate constant; and = dimensionless model parameters; and = disinfectant concentration () at time .
(2)
Full-Scale Pilot Experiments
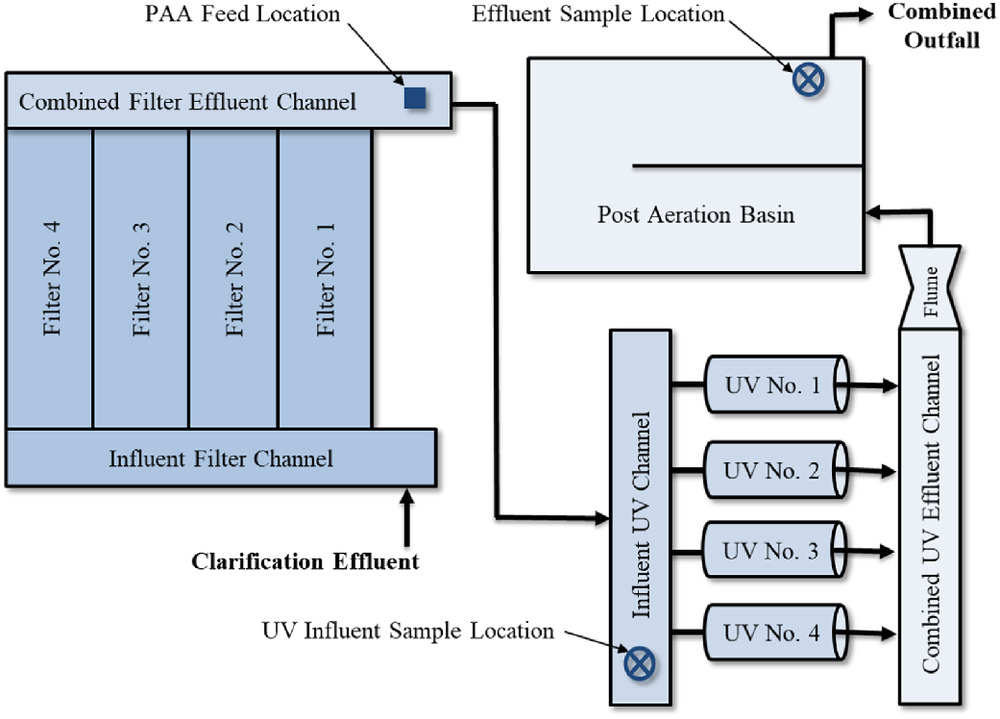
Results of the bench tests were used to inform the development of the protocol used for monitoring and testing the results from implementation of a full-scale trial. A temporary PAA chemical storage and feed system was procured and installed at the WRRF (Fig. 2). The system included a (330-gal.) PAA storage tote installed with secondary containment, a skid with two peristaltic pumps (one duty and one standby), and passivated stainless-steel chemical feed tubing routed to the chemical feed point, as shown in Fig. 3. The system used flow-paced dose control instrumentation and the control scheme included both local and remote mode control of chemical dosing. In addition to a calibration column for each pump, a flowmeter was also provided for each PAA feed pump, and the system was equipped with alarms for the following: low levels in the PAA storage tote, a leak detection alarm for the chemical feed pump skid, and a no-flow alarm for the PAA feed pumps.

Because PAA disinfection efficacy is a function of both PAA concentration and contact time, the available contact time was estimated to aid in developing a full-scale test protocol. Using calculated volumes (based on as-built drawings) along with the average and peak flow conditions, the theoretical hydraulic contact times were calculated, as shown in Table 2. While the actual modal contact time that is available in this volume may be slightly different due to system hydraulics, the theoretical contact time provides an appropriate initial estimate of dose requirements for assessing the feasibility of PAA disinfection at the existing facility.
| Description | Total volume | Theoretical contact time (min) | ||
|---|---|---|---|---|
| (gal.) | () | Average flow, (13.3 mgd) | Peak hour flow, (40 mgd) | |
| From PAA dosing point to UV system | 90,230 | 341.6 | 9.8 | 3.3 |
| From UV system to effluent sample location | 241,800 | 915.3 | 26 | 8.7 |
| Total contact time | 36 | 12 | ||
The pilot analysis consisted of two phases: (1) combined treatment involving PAA dosing followed by UV irradiation, and (2) PAA disinfection alone without employing UV. A common monitoring matrix was proposed for both phases of the evaluation, although dosing scenarios for PAA feed were different between operating conditions representing UV ON (supplemental feed) and UV OFF (stand-alone PAA disinfection). To provide fully staffed pilot operations, the pilot was only operated 4 h per day; the scenario was run on Mondays, Wednesdays, and Fridays and the PAA-only scenario was run on Tuesdays and Thursdays. The pilot was operated for a total period of 5 weeks.
For the scenario representing supplemental feed to the UV disinfection system, a dose of was initially used and was gradually turned down in increments throughout the test period, approximately once per week. For testing to assess PAA as a stand-alone disinfection technology, the disinfection dose was initially set at and was gradually reduced in increments throughout the test period, approximately once per week. Initial PAA dosing concentrations were selected based on the bench-scale testing results. The monitoring matrix for full-scale testing is summarized in Table 3.
| Location description | Pre-UV | Post-disinfection | Analyses notes |
|---|---|---|---|
| UV system operation | Record UV conditions, ON or OFF | At time of sample | |
| Flow (mgd) | Record instantaneous value | At time of sample | |
| pH | 3 per day (or continuous) | At time of sample | |
| cBOD5 () | 1 grab per day (pre-PAA) | 1 grab per day | With first FC grab of day |
| Fecal coliform (FC) () | 3 per day | 3 per day | — |
| PAA residual, grab () | — | 3 per day | — |
It is of note that PAA is an organic acid. As a result, small increases in cBOD5 were observed in the September 16 bench-scale test at the highest PAA dose of . Thus, cBOD5, which has a load-based limit in the combined effluent NPDES permit, was monitored before (not shown in Fig. 3) and after PAA addition during full-scale testing. During full-scale PAA disinfection testing, data were evaluated daily to determine whether results demonstrate that a lower dose may be able to achieve compliance. The daily review of information was used to guide the incremental reduction of PAA dose for optimization of fecal coliform inactivation.
Results and Discussion
Bench-Scale Testing Results
Data collected from bench-scale fecal coliform inactivation experiments are summarized in Tables 4 and 5 for non-disinfected effluent collected in September and October, respectively. Multiple PAA doses were tested at various times through jar testing. In addition to the bacterial inactivation testing and PAA residual measurements, the pH and cBOD5 of the samples were monitored to address any potential ancillary water quality changes that could be anticipated to be a challenge from a discharge perspective. October variables (Table 5) were adjusted based on the first jar testing runs in September. This included adjusting the PAA dose to focus on higher concentrations only to ensure adequate fecal coliform removal and adding a shorter contact time of 1 min to the run because low levels of fecal coliform were already seen after 10 min. Because the final pH and cBOD5 values in the September bench-scale testing fell well within the permit levels, they were not monitored further in subsequent jar tests.
| PAA dose () | Contact time (min) | PAA residual () | pH | cBOD5 () | Fecal coliform () |
|---|---|---|---|---|---|
| Control | N/A | N/A | 7.3 | 1,400 | |
| 0.25 | 10 | 0.05 | 7.6 | 1,500 | |
| 30 | 0 | 400 | |||
| 0.5 | 10 | 0.18 | 7.4 | 500 | |
| 30 | 0.14 | 86 | |||
| 1.0 | 10 | 0.57 | 7.4 | 142 | |
| 30 | 0.52 | 5 | |||
| 2.0 | 10 | 1.37 | 7.4 | 11 | |
| 30 | 1.35 | 0 | |||
| 3.0 | 10 | 2.22 | 7.2 | 2.4 | 6 |
| 30 | 2.02 | 0 |
| PAA dose () | Contact time (min) | PAA residual () | Fecal coliform () |
|---|---|---|---|
| Pre-UV | N/A | N/A | 1,450 |
| Post-UV | N/A | N/A | 4 |
| 1.0 | 1 | 0.64 | Not sampled |
| 10 | 0.59 | 172 | |
| 30 | 0.50 | 15 | |
| 2.0 | 1 | 1.60 | Not sampled |
| 10 | 1.44 | 111 | |
| 30 | 1.29 | 2 | |
| 3.0 | 1 | 2.42 | Not sampled |
| 10 | 2.19 | 8 | |
| 30 | 1.95 | 5 |
Hom’s model was fitted to the data presented in Tables 4 and 5, after censoring data where results were nondetected for either fecal coliform or for PAA residual. The model fit had an value of 0.8994, with the resulting Eq. (3)
(3)
Using this model, predicted inactivation curves were prepared for the various theoretical contact times calculated in Table 2. The model reflects the results, which showed that a minimum of PAA dose with a 30-min contact time or a PAA dose at 10-min contact time was required to achieve less than the target of fecal coliform. Providing that the contact time could be validated in the existing infrastructure, it could be anticipated that a PAA dose between 1 and would be adequate to meet permit requirements for discharge without the existing UV system in use. Although samples were collected post-UV for testing to assess a potentially lower PAA dose, the bench test data did not clearly show that a lower supplemental PAA dose would be adequate to meet permit requirements.
Based on the disinfection treatment performance objectives to meet the combined discharge requirements outlined in the NPDES permit (Table 1) and findings of bench-scale testing, it was concluded that PAA could be used either as a supplemental disinfectant or as a full-scale backup to the existing UV disinfection system for fecal coliform compliance.
Full-Scale PAA Disinfection
Full-scale testing was implemented based on preliminary bench-scale results. The locations of the grab samples are shown in Fig. 3. Initial samples were collected prior to the UV disinfection system and final disinfected effluent samples were collected at the end of the reaeration tank. PAA dosing commenced 3 months prior to this full-scale testing to ensure the system was running properly and to get approval for testing PAA alone without UV in service. After initial start-up, PAA was fed at a rate of as a supplemental feed to the UV disinfection system. For this evaluation, the PAA pilot dose alternated between UV ON and UV OFF days. On the first UV OFF day, PAA was fed at an initial rate of . For both scenarios, laboratory results were reviewed on the day following sample collection to inform the pilot operations.
Test results for PAA as a supplemental feed to UV and PAA alone are summarized in Figs. 4 and 5, respectively. For each figure, the influent (short PAA contact time) fecal coliform concentration is shown along with the PAA dose applied and the final disinfected, effluent fecal coliform concentrations. Results for fecal coliforms are plotted as a log plot of concentrations. The permit limit for the monthly geometric mean of the combined discharge is shown as a dotted line at .


The full-scale experiments conducted at the WRRF showed that PAA could be used to provide supplemental disinfection for aging or underperforming UV disinfection systems as well as a stand-alone disinfection method. The advanced oxidation process of UV/PAA is known to create hydroxyl radicals (), as well as acetoxy radicals [] and acetylperoxyl radicals [], aiding in oxidation-reduction reactions for disinfection (Ao et al. 2021; Chen et al. 2022). All final disinfected effluent samples for all experiments showed that fecal coliform concentrations would be below the monthly geometric mean for the combined discharge. In both experimental conditions, as the PAA concentration was optimized by reducing the dose, there was an incremental increase in the final disinfected effluent fecal coliform concentrations, indicating that Hom’s model provides an excellent means of conducting preliminary evaluations of PAA disinfection feasibility, and that process optimization should be conducted in a stepwise fashion.
In addition to the assessment of the efficacy of PAA, data were collected on the impact of PAA on final effluent cBOD5. Fig. 6 summarizes the cBOD5 data collected throughout the test period for all UV ON conditions. In general, there is no measurable increase in cBOD5 at the doses tested ( PAA), and this parameter would not be of significant concern in a permanent installation.

Similarly, data were collected on the impact of PAA on final effluent pH because PAA is an acid. Fig. 7 summarizes the pH data collected throughout the test period for both UV ON and UV OFF conditions. In general, there is a slight decrease in pH through the test period, but the PAA doses were decreasing and therefore should have had less effect on pH at the end of the test period than the beginning. Therefore, the slight decrease in pH may be attributed to seasonal bulk water quality changes. Regardless, all pH data points fell within a range of 6.03–7.72, indicating that at the doses tested ( PAA), pH would not be of significant concern in a permanent installation.

Conclusions
This study found that PAA could be used either as a supplemental wastewater disinfectant or as a full-scale backup for fecal coliform compliance. Pilot testing fecal coliform limits were met with a dose of PAA and four UV reactors in operation on medium power. Additionally, these effluent limits were also met with a dose of PAA and the UV system turned off. While other studies have shown PAA’s effectiveness at removing E. coli, Enterococci, and viruses, this novel research focuses on fecal coliform disinfection. In addition to fecal coliform limits, cBOD5 and pH effluent compliance was also met. Effluent cBOD5 was indistinguishable between pre- and post-PAA, and all pH data points fell within a range of 6.03–7.72. The robustness of PAA to disinfect makes it an ideal option to be deployed to ensure disinfection compliance.
Current research shows limited toxic, mutagenic, and genotoxic effects on aquatic organisms, though further chronic toxicity testing is needed to ensure that organisms do not suffer from unacceptable risk. Because PAA has the potential to increase the organic content in the effluent water, there is the potential for microbial regrowth within the receiving water. Though PAA was not observed to increase cBOD5 concentrations in this study, it is important to investigate the potential long-term effects, if any, PAA disinfection has on microbial communities within the receiving water. Investigating these effects is particularly important for WRRFs that may have lower cBOD5 permit limits. Currently, there is only limited research that examines the potential long-term impacts of acetic acid on receiving water; therefore, future studies should address this effect in various waters, along with the implication of PAA quenching using sodium bisulfite.
The findings of this study provide valuable support for the design and process of PAA for disinfection. PAA is a viable disinfectant to supplement existing disinfection options and there remains great potential for how PAA implementation, as well as future research, can be applied for wastewater applications. Our method of bench-scale testing and kinetic analysis can be utilized to adequately implement PAA disinfection at other municipalities and WRRFs.
Data Availability Statement
All data, models, or code that support the findings of this study are available from the corresponding author upon reasonable request.
References
Albolafio, S., A. Marin, A. Allende, F. Garcia, P. J. Simon-Andreu, M. A. Soler, and M. I. Gil. 2022. “Strategies for mitigating chlorinated disinfection byproducts in wastewater treatment plants.” Chemosphere 288 (2022): 132583. https://doi.org/10.1016/j.chemosphere.2021.132583.
Antonelli, M., S. Rossi, V. Mezzanotte, and C. Nurizzo. 2006. “Secondary effluent disinfection: PAA long term efficiency.” Environ. Sci. Technol. 40 (15): 4771–4775. https://doi.org/10.1021/es060273f.
Ao, X. W., J. Eloranta, C. H. Huang, D. Santoro, W. J. Sun, Z. D. Lu, and C. Li. 2021. “Peracetic acid-based advanced oxidation processes for decontamination and disinfection of water: A review.” Water Res. 188 (Jan): 116479. https://doi.org/10.1016/j.watres.2020.116479.
APHA (American Public Health Association). 1992. “APHA method 4500-H: Standard methods for the examination of water and wastewater.” Accessed April 25, 2023. https://archive.org/details/gov.law.apha.method.4500-h.1992/page/n1/mode/2up.
Azzellino, A., M. Antonelli, R. Canziani, F. Malpei, M. Marinetti, and C. Nurizzo. 2011. “Desalination and water treatment multivariate modelling of disinfection kinetics: A comparison among three different disinfectants.” Desalin. Water Treat. 29 (1–3): 128–139. https://doi.org/10.5004/dwt.2011.1610.
Balachandran, S., L. V. Charamba, K. Manoli, P. Karaolia, S. Caucci, and D. Fatta-Kassinos. 2021. “Simultaneous inactivation of multidrug-resistant Escherichia coli and enterococci by peracetic acid in urban wastewater: Exposure-based kinetics and comparison with chlorine.” Water Res. 202 (Sep): 117403. https://doi.org/10.1016/j.watres.2021.117403.
Baldry, M. G. C. 1983. “The bactericidal, fungicidal and sporicidal properties of hydrogen peroxide and peracetic acid.” J. Appl. Bacteriol. 54 (3): 417–423. https://doi.org/10.1111/j.1365-2672.1983.tb02637.x.
Baldry, M. G. C., and M. S. French. 1989. “Disinfection of sewage effluent with peracetic acid.” Water Sci. Technol. 21 (3): 203–206. https://doi.org/10.2166/wst.1989.0100.
Banach, J. L., I. Sampers, S. Van Haute, and H. van der Fels-Klerx. 2015. “Effect of disinfectants on preventing the cross-contamination of pathogens in fresh produce washing water.” Int. J. Environ. Res. Public Health 12 (8): 8658–8677. https://doi.org/10.3390/ijerph120808658.
Block, S. S. 1991. “Peroxygen compounds.” In Disinfection, sterilization, and preservation, edited by S. S. Block, 167–181. 4th ed. Philadelphia: Lea and Felbinger.
Boyce, J. M. 2016. “Modern technologies for improving cleaning and disinfection of environmental surfaces in hospitals.” Antimicrob. Resist. Infect. Control 5 (1): 1–10. https://doi.org/10.1186/s13756-016-0111-x.
Chen, L., J. Duan, P. Du, W. Sun, B. Lai, and W. Liu. 2022. “Accurate identification of radicals by in-situ electron paramagnetic resonance in ultraviolet-based homogenous advanced oxidation processes.” Water Res. 221 (Aug): 118747. https://doi.org/10.1016/j.watres.2022.118747.
Chenjiao, W., Z. Hongyan, G. Qing, Z. Xiaoqi, G. Liying, and F. Ying. 2016. “In-use evaluation of peracetic acid for high-level disinfection of endoscopes.” Gastroenterol. Nurs. 39 (2): 116–120. https://doi.org/10.1097/SGA.0000000000000192.
Dell’Erba, A., D. Falsanisi, L. Liberti, M. Notarnicola, and D. Santoro. 2007. “Disinfection by-products formation during wastewater disinfection with peracetic acid.” Desalination 215 (1–3): 177–186. https://doi.org/10.1016/j.desal.2006.08.021.
Dunkin, N., S. Weng, K. Schwab, J. McQuarrie, K. Bell, and J. Jancagelo. 2017. “Comparative inactivation of murine norovirus and MS2 bacteriophage by peracetic acid and monochloramine in municipal secondary wastewater effluent.” Environ. Sci. Technol. 51 (5): 2972–2981. https://doi.org/10.1021/acs.est.6b05529.
Environment Canada. 1978. Wastewater disinfection in Canada. EPS 3-WP-78-4. Gatineau, QC, Canada: Environment Canada.
Gruss, A. B., D. Funk, C. Wilbanks, and K. Bell. 2015. “PAA—An alternative for wastewater disinfection.” In Proc., Annual GAWP Conf. & Exposition. Savannah, GA: Georgia Association of Water Professionals.
Henao, L. D., A. Turolla, and M. Antonelli. 2018. “Disinfection by-products formation and ecotoxicological effects of effluents treated with peracetic acid: A review.” Chemosphere 213 (Dec): 25–40. https://doi.org/10.1016/j.chemosphere.2018.09.005.
Hilts, B., S. Morgan, J. Goldman, S. Stewart, and A. Garibi. 2018. “Procuring & delivering the two largest WRRF PAA disinfection systems in the world—Memphis style.” Proc. Water Environ. Fed. 2018 (17): 456–460. https://doi.org/10.2175/193864718825137584.
Jakara, J., A. Paren, P. Hukkanen, and P. Autio. 2000. “Effect of peracetic acid in fine paper production.” In Vol. 1 of Proc., 54th Appita Annual General Conf., 167–173. Melbourne, Australia: Appita.
Kitis, M. 2004. “Disinfection of wastewater with peracetic acid: A review.” Environ. Int. 30 (1): 47–55. https://doi.org/10.1016/S0160-4120(03)00147-8.
Kiuru, J. 2011. “Interactions of chemical variations and biocide performance at paper machines.” Ph.D. thesis, Dept. of Forest Products Technology, Aalto Univ.
Leong, L. Y. C., J. Kuo, and C.-C. Tang. 2008. Disinfection of wastewater effluent—Comparison of alternative technologies. WERF 04-HHE-4. Alexandria, VA: Water Environment Research Foundation.
Levine, L., C. Hennagir, J. MacDougall, S. A. Steward, and A. P. Eaton. 2017. “Peracetic acid disinfection for industrial wastewater treatment—Washburn tunnel case study.” Proc. Water Environ. Fed. 2017 (13): 1490–1499.
Luukkonen, T., and S. O. Pehkonen. 2017. “Peracids in water treatment: A critical review.” Crit. Rev. Environ. Sci. Technol. 47 (1): 1–39. https://doi.org/10.1080/10643389.2016.1272343.
Maurício, R., J. Jorge, R. Dias, J. P. Noronha, L. Amaral, M. A. Daam, A. P. Mano, and M. S. Diniz. 2020. “The use of peracetic acid for estrogen removal from urban wastewaters: E2 as a case study.” Environ. Monit. Assess. 192 (2): 114. https://doi.org/10.1007/s10661-020-8079-7.
Meng, L., J. Chen, D. Kong, Y. Ji, J. Lu, X. Yin, and Q. Zhou. 2022. “Transformation of bromide and formation of brominated disinfection byproducts in peracetic acid oxidation of phenol.” Chemosphere 291 (1): 132698. https://doi.org/10.1016/j.chemosphere.2021.132698.
Meyer, E. 1976. “Disinfection of sewage waters from rendering plants by means of peracetic acid.” J. Hyg. Epidemiol. Microbiol. Immunol. 21 (3): 266–273.
Newhart, K. B., J. E. Goldman-Torres, D. E. Freedman, K. B. Wisdom, A. S. Hering, and T. Y. Cath. 2020. “Prediction of peracetic acid disinfection performance for secondary municipal wastewater treatment using artificial neural networks.” ACS ES&T Water 1 (2): 328–338. https://doi.org/10.1021/acsestwater.0c00095.
Nurizzo, C., M. Antonelli, M. Profaizer, and L. Romele. 2005. “By-products in surface and reclaimed water disinfected with various agents.” Desalination 176 (1–3): 241–253. https://doi.org/10.1016/j.desal.2004.11.012.
Orth, R. 1998. “The importance of disinfection for the hygiene in the dairy and beverage production.” Int. Biodeterior. Biodegrad. 41 (3–4): 201–208. https://doi.org/10.1016/S0964-8305(98)00036-5.
Pileggi, V., J. R. Bicudo, M. Nowierski, M. Manoharan, G. Lai, T. Fletcher, and A. Simhon. 2022. “Side-stream comparison of peracetic acid and chlorine as hypochlorite for disinfection of municipal wastewater effluent at a full-scale treatment facility, Ontario, Canada.” ACS ES&T Eng. 2 (8): 1465–1474. https://doi.org/10.1021/acsestengg.2c00005.
Prüss, A. 1998. “Review of epidemiological studies on health effects from exposure to recreational water.” Int. J. Epidemiol. 27 (1): 1–9. https://doi.org/10.1093/ije/27.1.1.
Rajala-Mustonen, R. L., P. S. Toivola, and H. Heinonen-Tanski. 1997. “Effects of peracetic acid and UV irradiation on the inactivation of coliphages in wastewater.” Water Sci. Technol. 35 (11–12): 237–241. https://doi.org/10.2166/wst.1997.0740.
Riordan, C. 1979. “Perspectives on wastewater disinfection: A view from headquarters.” In Proc., National Symp. on Wastewater Disinfection Technology, edited by A. D. Venosa, 5–6. Cincinnati: US Environmental Protection Agency.
Rossi, S., M. Antonelli, V. Mezzanotte, and C. Nurizzo. 2007. “Peracetic acid disinfection: A feasible alternative to wastewater chlorination.” Water Environ. Res. 79 (4): 341–350. https://doi.org/10.2175/106143006X101953.
Schmitz, B. W., H. Wang, K. Schwab, and J. Jacangelo. 2021. “Selected mechanistic aspects of viral inactivation by peracetic acid.” Environ. Sci. Technol. 55 (23): 16120–16129. https://doi.org/10.1021/acs.est.1c04302.
SMWW (Standard Methods for the Examination of Water and Wastewater). 2018. “9222 membrane filter technique for members of the coliform group.” In Standard methods for the examination of water and wastewater, edited by W. C. Lipps, T. E. Baxter, and E. Braun-Howland. Washington, DC: APHA Press.
SMWW (Standard Methods for the Examination of Water and Wastewater). 2019. “4500-PAA peracetic acid (residual) (proposed).” Accessed April 25, 2023. https://archive.org/details/gov.law.apha.method.4500-h.1992/page/n1/mode/2up.
Stevenson, A. H. 1953. “Studies of bathing water quality and health.” Am. J. Public Health 43 (5 pt 1): 529–538. https://doi.org/10.2105/AJPH.43.5_Pt_1.529.
Swern, D. 1949. “Organic peracids.” Chem. Rev. 45 (1): 1–68. https://doi.org/10.1021/cr60140a001.
US EPA. 1997. “Standard method 5210B (5-day BOD test): Biochemical oxygen demand (BOD).” Accessed June 29, 2022. https://www.epa.gov/.
US EPA Task Force on Disinfection of Wastewater. 1976. Disinfection of wastewater. EPA-430/9-75-012. Washington, DC: USEPA.
Whitby, G. E., and O. K. Scheible. 2004. “The history of UV and wastewater.” IUVA News 6 (3): 15–26.
Xiao, S., S. Hu, Y. Zhang, Z. Xiaoyun, and W. Pan. 2018. “Influence of sewage treatment plant effluent discharge into multipurpose river on its water quality: A quantitative health risk assessment of Cryptosporidium and Giardia.” Environ. Pollut. 233 (Feb): 797–805. https://doi.org/10.1016/j.envpol.2017.11.010.
Information & Authors
Information
Published In

Journal of Environmental Engineering
Volume 149 • Issue 7 • July 2023
Copyright
This work is made available under the terms of the Creative Commons Attribution 4.0 International license, https://creativecommons.org/licenses/by/4.0/.
History
Received: Oct 16, 2022
Accepted: Mar 4, 2023
Published online: May 12, 2023
Published in print: Jul 1, 2023
Discussion open until: Oct 12, 2023
ASCE Technical Topics:
- Acids
- Bacteria
- Benchmark
- Business management
- Chemical compounds
- Chemical processes
- Chemicals
- Chemistry
- Disinfection
- Engineering fundamentals
- Environmental engineering
- Feasibility studies
- Management methods
- Methodology (by type)
- Pollutants
- Practice and Profession
- Radiation
- Research methods (by type)
- Ultraviolet radiation
- Wastewater management
- Water treatment
Authors
Metrics & Citations
Metrics
Citations
Download citation
If you have the appropriate software installed, you can download article citation data to the citation manager of your choice. Simply select your manager software from the list below and click Download.
Cited by
- Diogo Sousa, Rita Dias, Rita Lourinho, Rita Maúricio, Exploring the Potential of Peracetic Acid for Wastewater Disinfection: Insights from a Pilot-Scale Study, Journal of Environmental Engineering, 10.1061/JOEEDU.EEENG-7449, 150, 1, (2024).