Experimental Research of the Characteristics of Microscopic Pore Production during Displacement in a Shale Oil Reservoir
Publication: Journal of Energy Engineering
Volume 149, Issue 6
Abstract
The evaluation method for determining the pore production range during displacement in shale cores is established based on displacement experiments, core analysis using online nuclear magnetic resonance (NMR), and pore size analysis using high-pressure mercury injection. By transforming the abscissa of the NMR spectrum into pore-throat radius using the conversion formula between relaxation time and pore radius, the production behavior of crude oil in pores of different scales during displacement is analyzed. The target shale oil reservoir, located in eastern China, consists of two sets of salt beds. Crude oil is predominantly found in mesopores and smaller macropores. While water injection can saturate the salt and enhance seepage, the reactive areas of water imbibition are still smaller compared to those of injection. It is observed that the displacement efficiency of injection exhibits a negative correlation with the clay mineral content, with the swept pores mainly consisting of mesopores and small macropores. The proportion of crude oil produced from pores with diameters less than 0.1 μm during displacement is significantly higher than that during water displacement. The displacement effect of in mesopores and smaller macropores improves with increasing injection pressure. Above the miscible pressure condition, the oil displacement efficiency of is 11% higher than that of water displacement, indicating that displacement is more suitable for this shale oil reservoir.
Practical Applications
Exploiting oil from shale formations through water injection is challenging due to the presence of micrometer or nanoscale pores. However, in the target reservoir, which is a typical saline deposition, both water injection and gas injection, such as supercritical injection, are suitable for enhancing oil recovery. When compared to water injection, supercritical injection offers advantages such as higher injection capacity, wider swept volume, and better displacement effect. It is particularly effective in producing oil from pores smaller than 0.1 μm. Furthermore, increasing the injection pressure improves the displacement efficiency. In this type of shale oil reservoir, the average oil displacement efficiency of displacement is nearly 11% higher than that of water displacement. This method not only provides energy for the reservoir and enhances shale oil recovery but also contributes to carbon storage, making it an advanced approach for shale oil reservoir development.
Introduction
The term shale oil refers to the oil that remains in a shale formation or migrates and accumulates over a very short distance after hydrocarbon expulsion during the hydrocarbon generation phase. It represents a typical reservoir that undergoes self-generation and self-storage in situ (Hu et al. 2020). The main porous medium for the occurrence of shale oil is the shale formation itself, which may include thin layers of tight sandstone, carbonate rock, and even intercalated volcanic rock (Song et al. 2020). Shale oil reservoirs exhibit complex physical characteristics typical of oil and gas reservoirs, including diverse lithology, mineral composition, organic matter composition, fine pore morphology, and natural fracture systems. These characteristics significantly impact the physical properties of fluids. Understanding the pore-throat structure of shale oil reservoirs is essential for elucidating fluid occurrence and production (Li et al. 2020a).
The target reservoir is characterized by typical saline deposition, and the distribution area of the shale formation is constrained by the distribution area of rock salt. The extent of the shale reservoir’s distribution is directly influenced by the distribution area of rock salt. Thicker individual rock salt layers correspond to thinner individual shale reservoir layers and lower terrigenous debris content, and vice versa. This characteristic sets it apart from conventional shale reservoirs. Consequently, the percolation mechanism within the salt shale reservoir is distinct and complex.
displacement is a recognized method for enhancing oil recovery in shale oil reservoirs. Numerous experts have analyzed and studied the percolation mechanism of injection in low permeability reservoirs from a microscopic pore perspective using nuclear magnetic resonance (NMR) technology (Li et al. 2020b; Zhang et al. 2009). Pu et al. (2021) conducted displacement experiments of injection in tight oil using NMR technology and investigated the displacement behavior of in tight pores at a microscopic level. Wang et al. (2021) performed NMR analysis experiments on heterogeneous cores subjected to water drive and water-gas alternation, concluding that water-gas alternation after water drive can improve oil recovery in different heterogeneous cores. Lang et al. (2021) employed online NMR to observe real-time crude oil production processes and the distribution of remaining oil, analyzing the impact of temperature, pressure, time, fracture development degree, and other factors on the effectiveness of displacement.
However, there is a lack of research on the oil production mechanism in pores of different scales during the displacement of shale oil (Li et al. 2021). This paper aims to bridge this gap by utilizing a combination of displacement experiments, online NMR core analysis, high-pressure mercury injection pore size analysis, and other methods to investigate the displacement mechanism in shale reservoirs. The study also examines the behavior of displacement in pores of different scales from a microscopic perspective.
Experimental Conditions
The shale oil reservoir of interest is located in eastern China and is characterized by two sets of salt beds in the overlying and underlying strata. These salt beds primarily consist of glauberite, dolomite, argillaceous dolomite, and dolomitic mudstone (Wang et al. 2016; Li et al. 2019; Sun et al. 2019; Yang et al. 2020; Wu et al. 2013). The experimental cores used in this study were obtained from the main layer of the target area, and their information is presented in Table 1. The mineral composition of the cores can be found in Table 2.
| Sample No. | Lithology | Permeability () | Porosity (%) |
|---|---|---|---|
| SO1 | Calciferous mirabilite dolomite | 0.257 | 7.65 |
| SO2 | Dolomitic mudstone | 0.353 | 6.20 |
| CW1 | Dolomitic mudstone | 0.047 | 4.64 |
| CW2 | Argillaceous dolomite | 0.13 | 9.31 |
| CW3 | Muddy dolomite | 0.084 | 7.02 |
| CW4 | Dolomitic mudstone | 0.253 | 6.06 |
| CW5 | Dolomitic mudstone | 0.423 | 6.98 |
| CW6 | Dolomitic mudstone | 0.126 | 5.86 |
Note: SO = saturated Oil; and CW = carbon water.
| Lithology | Mineral (%) | ||||
|---|---|---|---|---|---|
| Dolomite | Calcite | Salt | Clay | Others | |
| Dolomitic mudstone | 14.00 | 20.00 | 2.80 | 38.30 | 24.90 |
| Argillaceous dolomite | 30.00 | 14.00 | 2.00 | 19.00 | 35.00 |
| Muddy dolomite | 42.00 | 18.00 | 3.30 | 14.60 | 22.10 |
Analyzing Tables 1 and 2 reveals that argillaceous dolomite exhibits the highest porosity, followed by glauberite dolomite and muddy dolomite, while dolomitic mudstone generally has lower porosity. There is a close correlation between reservoir porosity and shale content in this particular reservoir. Higher shale content is associated with poorer pore development and lower porosity.
Experimental Device and Method NMR Online Displacement System
The experiment utilizes the GeoSpec 2+/53 analyzer, manufactured by Oxford Instruments (Abingdon, UK), which is a high-temperature and high-pressure gradient field NMR core instrument. The NMR instrument consists of a control system, a permanent magnet, and an NMR probe. The key test parameters include a magnetic field intensity of 0.0470 T (470 Gauss), hydrogen resonance frequency of 2.0 MHz, magnetic field uniformity of less than 100 ppm, a uniformity range of 52 mm in diameter and 50 mm in length, and a working temperature of the magnet set between 35°C and 40°C. The minimum echo time for the φ25 mm NMR probe is 60 μs, ensuring a stable internal magnetic field. The following are the test parameters of the GeoSpec 2+/53 NMR rock sample analyzer used in this experiment: Carr-Purcell-Meiboom-Gill (CPMG) pulse sequence with an echo interval of 200 μs, 1,024 echoes, 64 scans, a recovery time of 3,000 ms, and 64 points for spectrum fitting. The experimental process is illustrated in Fig. 1.
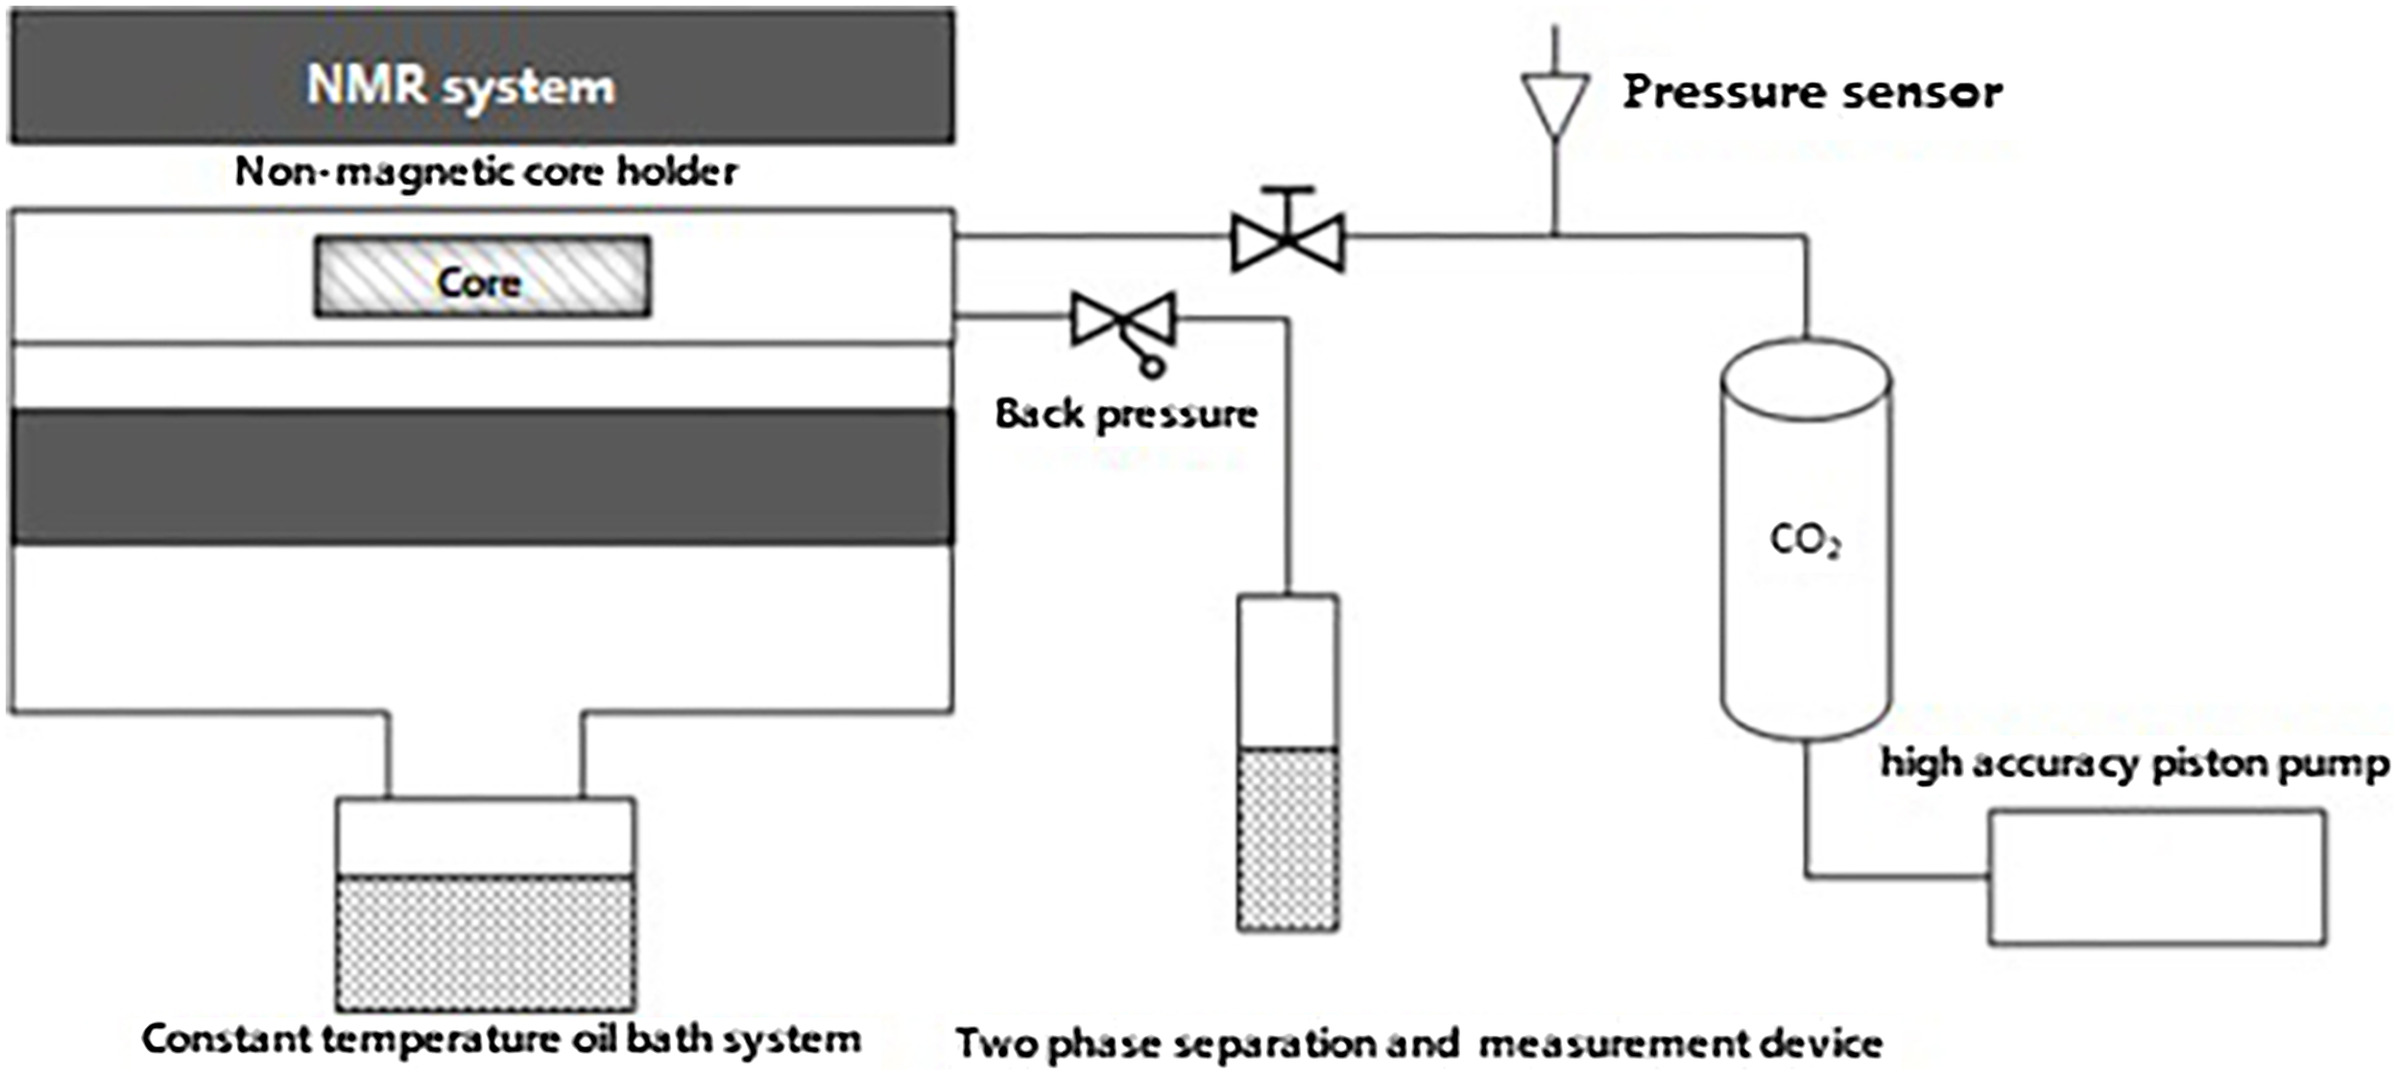
The system’s pressure is controlled by multiple Vindum high-precision pumps, offering an accuracy of up to . The experimental temperature is regulated by a constant temperature oil bath system, with fluorine oil circulating as the nonmagnetic signal fluid. The injected gas is 99.99% pure . All nuclear magnetic signals obtained during the test are derived from crude oil.
High-Pressure Mercury Intrusion Test
The mercury intrusion method is used to measure the distribution of pore sizes by applying external pressure to allow mercury to overcome surface tension and enter the pores. As the applied pressure increases, mercury can enter smaller pores, resulting in an increase in the amount of mercury entering the pores. Typically, mercury does not wet solids, and external pressure is necessary to facilitate mercury entry into the pores. The radius of the pore where mercury can enter decreases with increasing external pressure. By measuring the amount of mercury entering the pores under different external pressures, the corresponding pore volume can be determined. The Washburn equation is utilized to calculate the pore size distribution data of shale samples with pore sizes greater than or equal to 3.2 nm, as shown in Eq. (1)where = pressure applied to the liquid surface (Pa); = surface tension of the liquid (); = contact angle between the wetting liquid and the substance (degrees); and = pore radius (m). For mercury, the surface tension is , and the contact angle between mercury and various substances typically ranges from 135° to 150°, with an average value of 140°. Hence, Eq. (1) can be simplified to Eq. (2)
(1)
(2)
The high-pressure mercury intrusion test was conducted using the Poresmaster mercury intrusion instrument (Quantachrome Instrument, Boynton Beach, Florida). In this study, the maximum injection pressure for high-pressure mercury intrusion was set at 413 MPa, allowing for the measurement of pore sizes ranging from 3.2 to 950,000 nm. The sample used for the test was prepared as a plunger with a diameter of 25 mm and a length of 15 mm.
Relaxation Time and Pore Radius Conversion Method
Both NMR spectra and capillary pressure curves can characterize the pore structure of rocks, and they are also correlated. Many domestic and foreign researchers have established a conversion model between NMR spectrum and capillary pressure curve based on the fractal structure assumption (Dai et al. 2019; Li et al. 2018, 2008, 2015). The relationship between pore radius and value of NMR transverse relaxation time is as follows:where = core pore radius (μm); = conversion coefficient between transverse relaxation time and pore radius (); = transverse surface relaxation rate, which is a parameter characterizing rock properties (); = pore shape factor; and = transverse relaxation time (ms).
(3)
(4)
The No.1 curve relationship between spectrum and NMR cumulative signal is obtained from the NMR experiment. And the No. 2 curve relationship between pore radius and mercury injection saturation is obtained from high-pressure mercury intrusion test. No.1 curve shape is approximately coincidence with No. 2 curves, through moving the curve in -axis direction. After that, the relationship between pore radius and spectrum is obtained.
Experimental Procedure
As the source rock, the shale core is reserved with little bound water. It is unnecessary to establish bound water. First, the shale core is saturated with oil under high pressure. The shale core is put into the nonmagnetic core holder and evacuated by molecular vacuum pump for 72 h (vacuum degree is low to ), then n-Dodecanese is injected at different pressures. During the saturation, each pressure point shall be maintained for more than 6 h. The shale core is saturated completely by continuously monitoring and recording the nuclear magnetic resonance spectrum until the nuclear magnetic resonance spectrum curve remains unchanged. The initial spectrum curve of the saturated core is determined. Then, different pressure of injection is implemented with the displacement of 0.05 pore volume (PV), and the NMR spectrum is monitored and recorded continuously. It is necessary to compare the displacement efficiency between injection and water injection in the same core. The microscopic characteristic of shale could be changed through the salt solution reaction during water injection, while injection cannot. So, injection is implemented prior to water injection. The injection residual oil should be removed by soaking in supercritical at least 7 days before the water injection experiment. As the source rock, the shale core is reserved with little bound water. It is unnecessary to establish bound water. The saturation process begins by pressurizing the shale core with oil under high pressure. The core is then placed in a nonmagnetic core holder and evacuated using a molecular vacuum pump for 72 h, achieving a vacuum level of . Subsequently, n-Dodecane is injected at various pressures, and each pressure point is maintained for at least 6 h to ensure complete saturation. Saturation is confirmed by continuously monitoring and recording the NMR spectrum until the spectrum curve stabilizes, indicating full saturation. The initial spectrum curve of the saturated core is then determined. Next, injection is performed at different pressures with a displacement of 0.05 PV, and the NMR spectrum is continuously monitored and recorded. To assess the displacement efficiency, a comparison is made between injection and water injection in the same core. It is important to note that water injection can cause changes in the microscopic characteristics of shale due to salt solution reactions, whereas injection does not. Therefore, injection is conducted before water injection. Prior to the water injection experiment, any residual oil from the injection is removed by soaking the core in supercritical for a minimum of 7 days.
Experimental Results and Analysis Distribution of Micropore Size
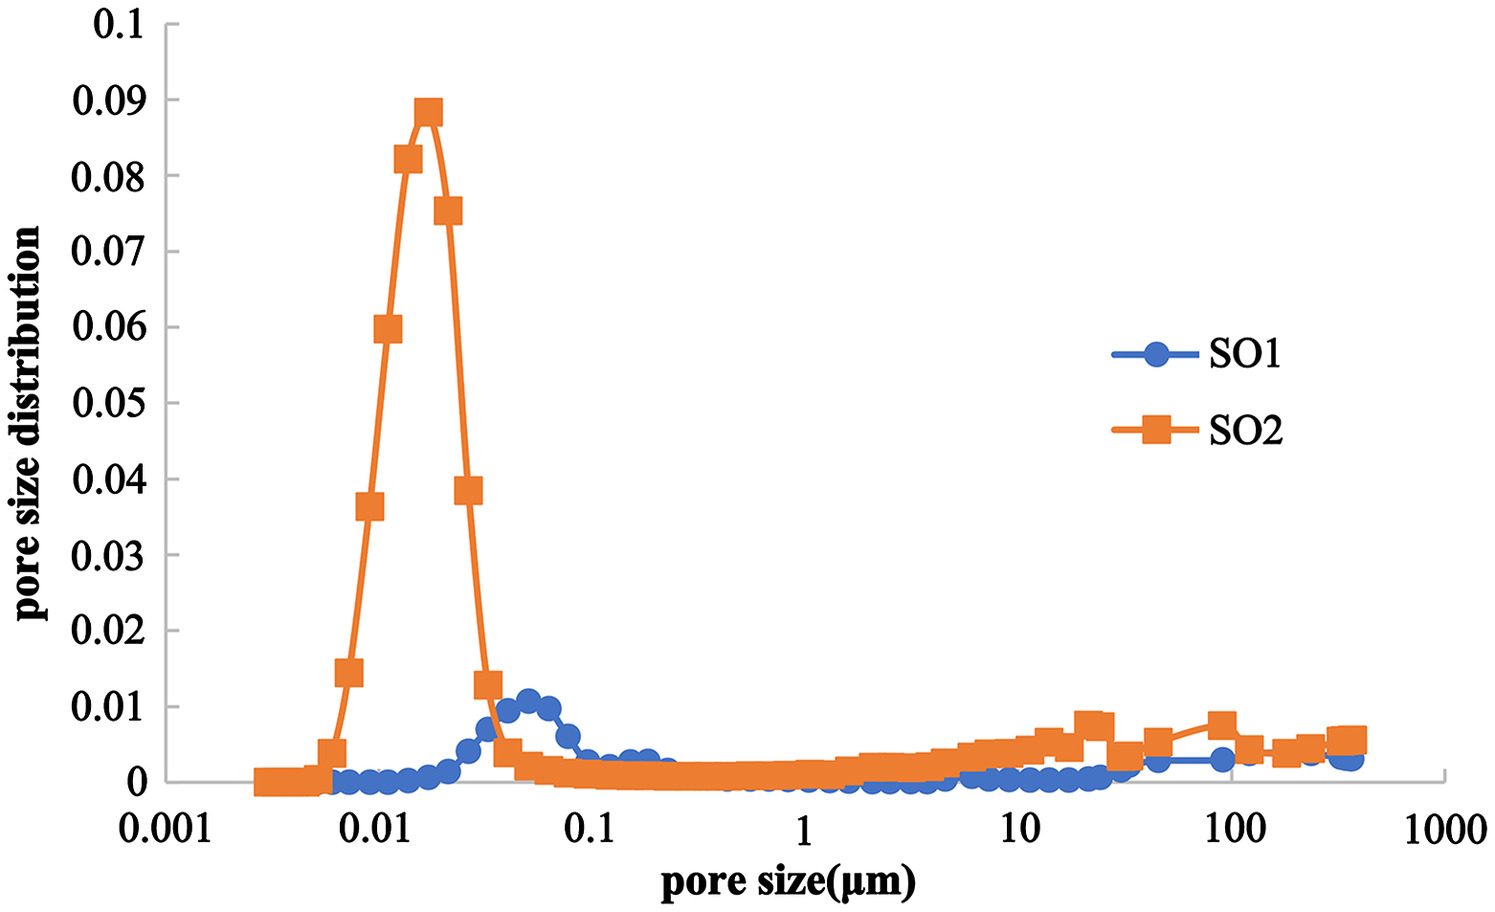
Based on the division standards of the International Union of Pure and Applied Chemistry (IUPAC) for pore size (Shen et al. 2018; Sing 1985), macropores can be further categorized as follows: pores with a size are referred to as micropores, pores with a pore-throat radius between 0.002 and 0.05 μm are called mesopores, pores with a pore-throat radius between 0.05 and 1 μm are termed smaller macropores, and pores with a size are classified as larger macropores. In Fig. 2, the pore size distribution curves of high-pressure mercury intrusion for samples SO1 and SO2 are depicted. Both samples exhibit a small number of larger macropores. SO1 also exhibits a significant number of smaller macropores, while SO2 displays a considerable quantity of mesopores.
Occurrence Characteristics of Shale Oil
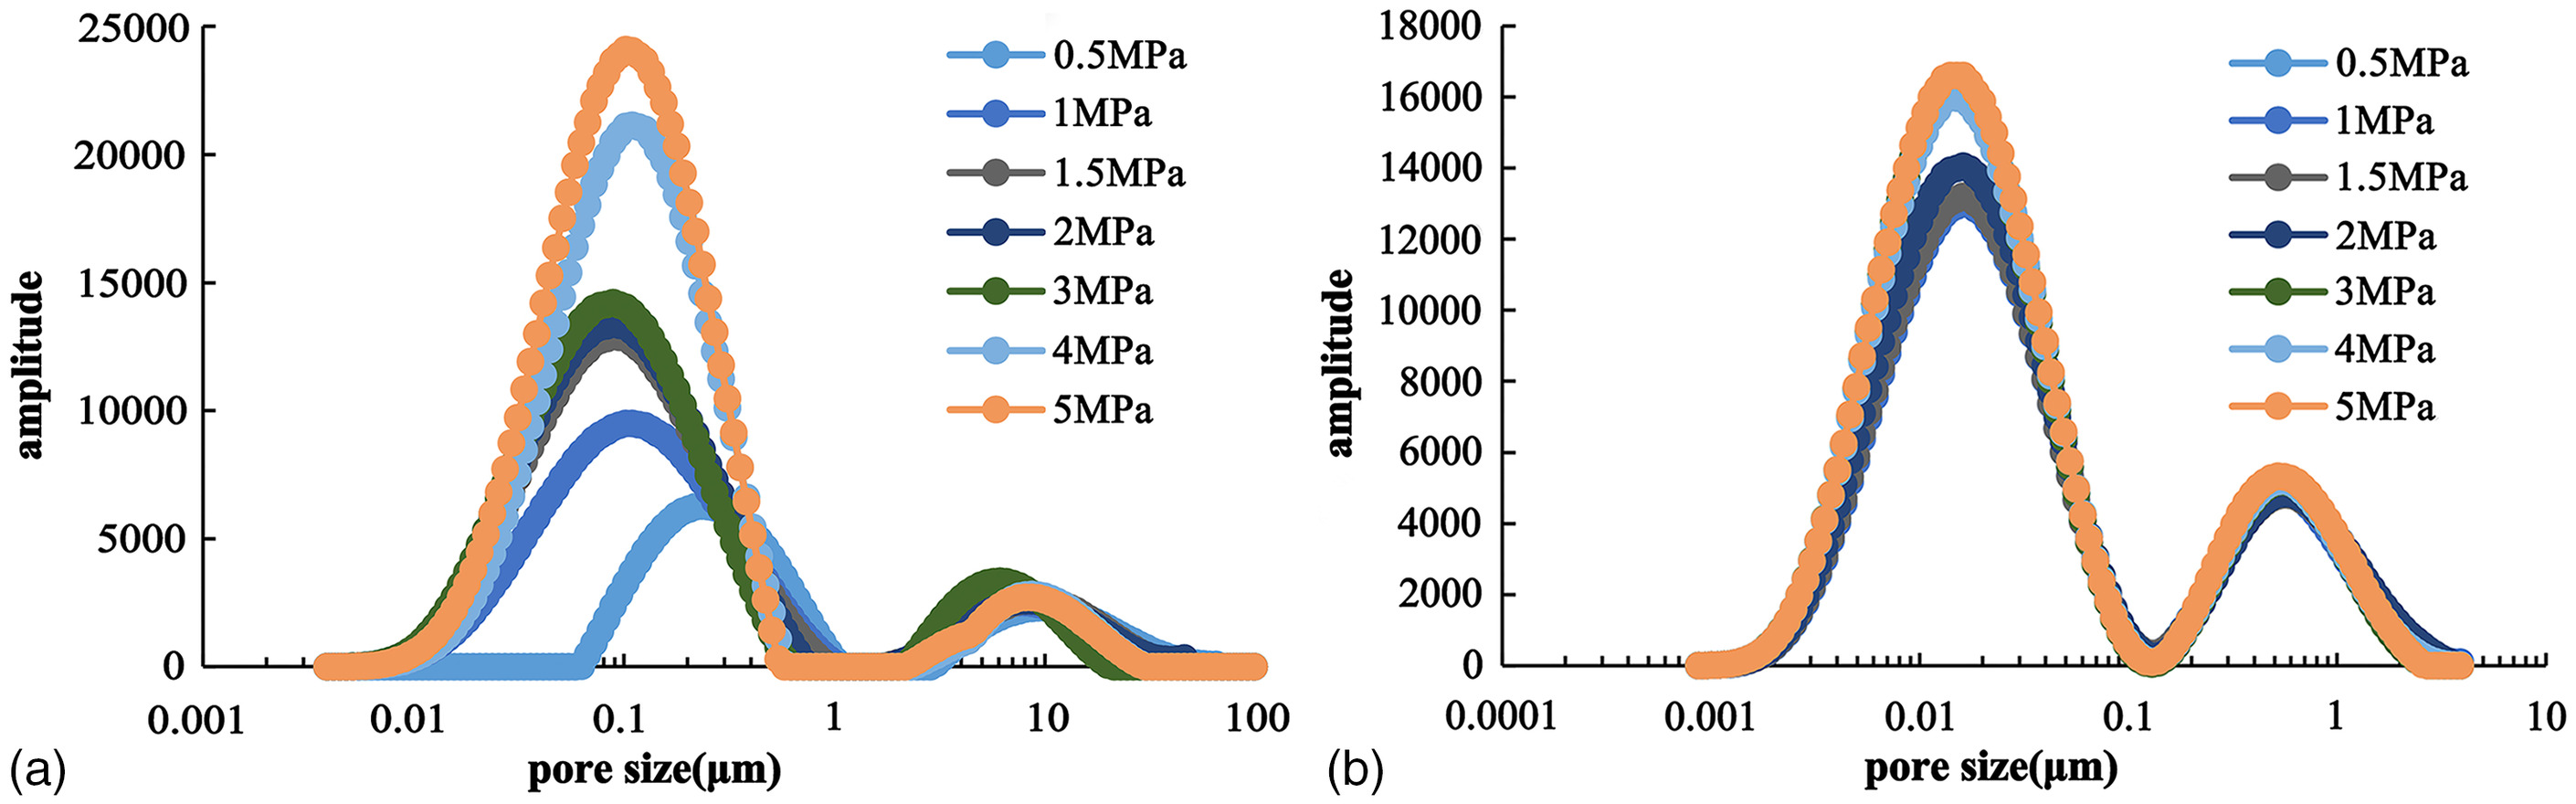
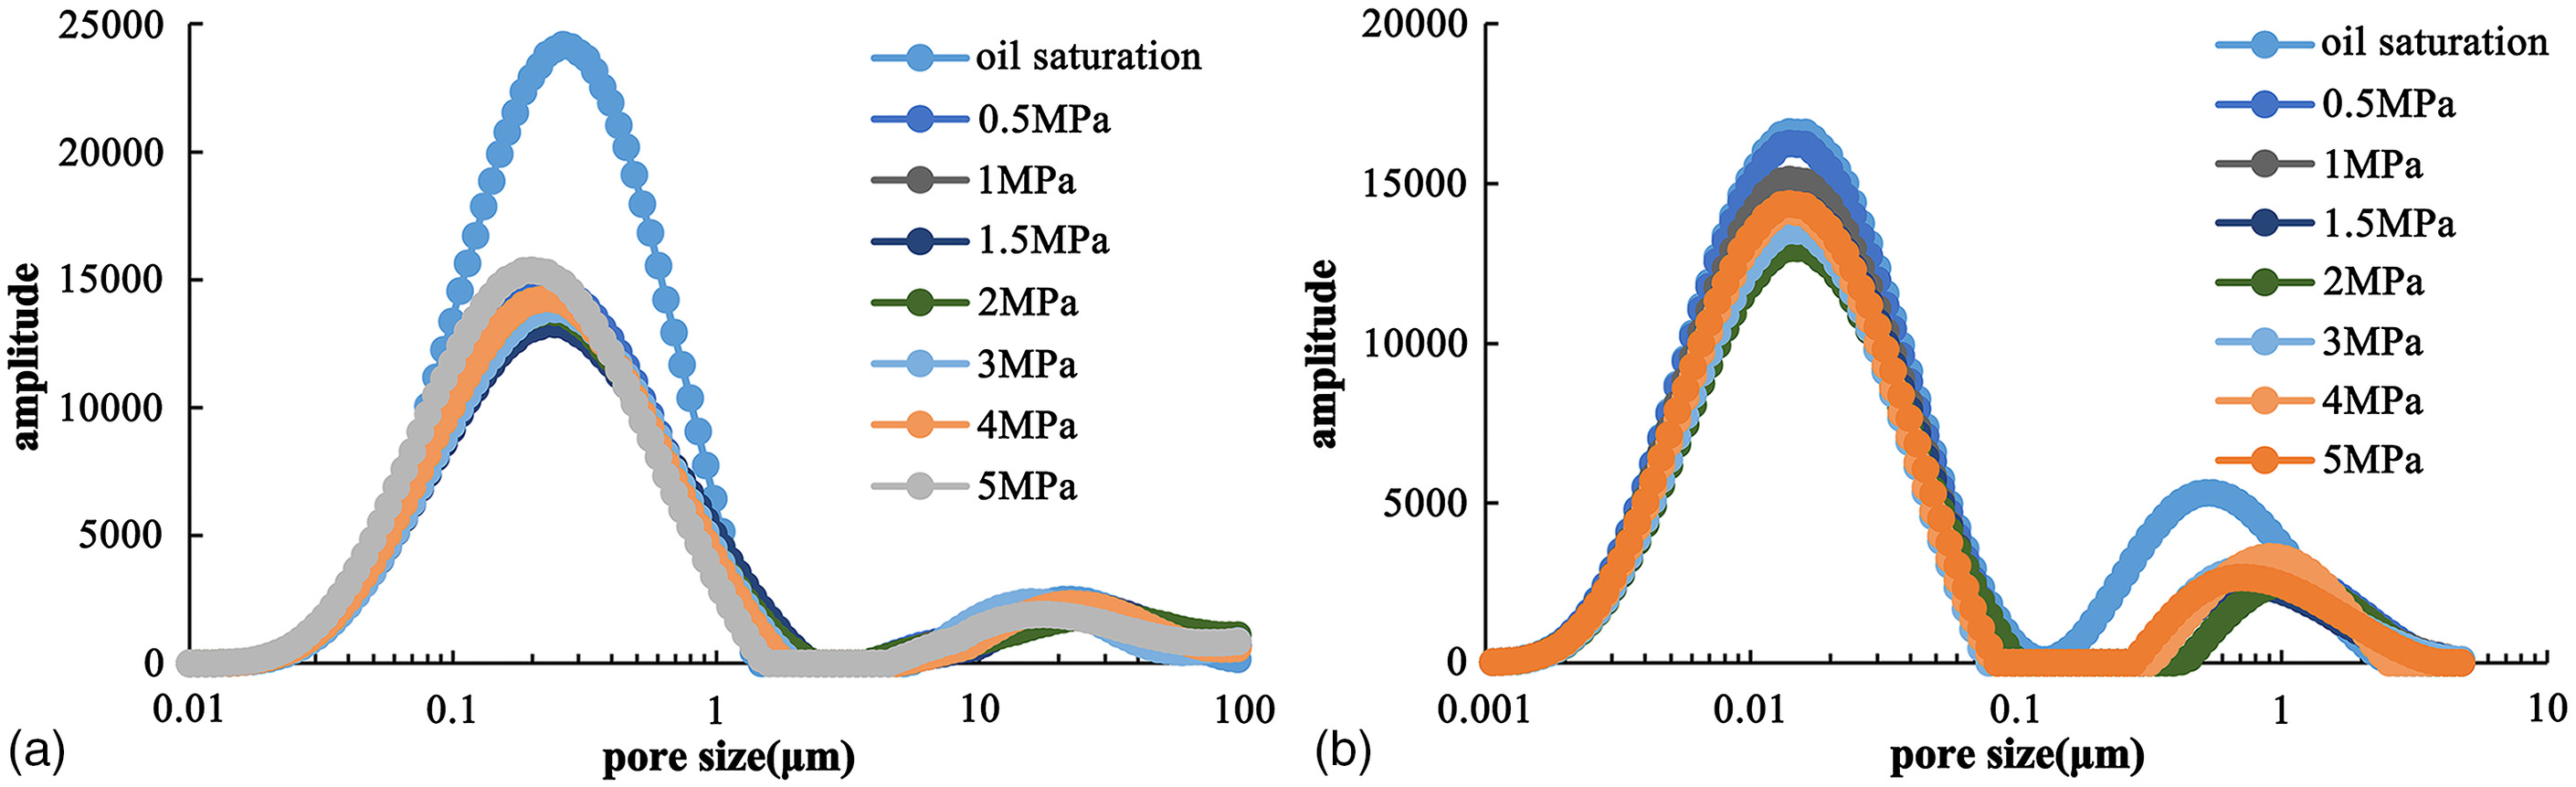
In the process of n-Dodecane injection, as the injection pressure increases, the NMR signal quantity also increases, and the peak value of the signal quantity appears between a pore size of 0.02 and 0.1 μm, as shown in Fig. 3.
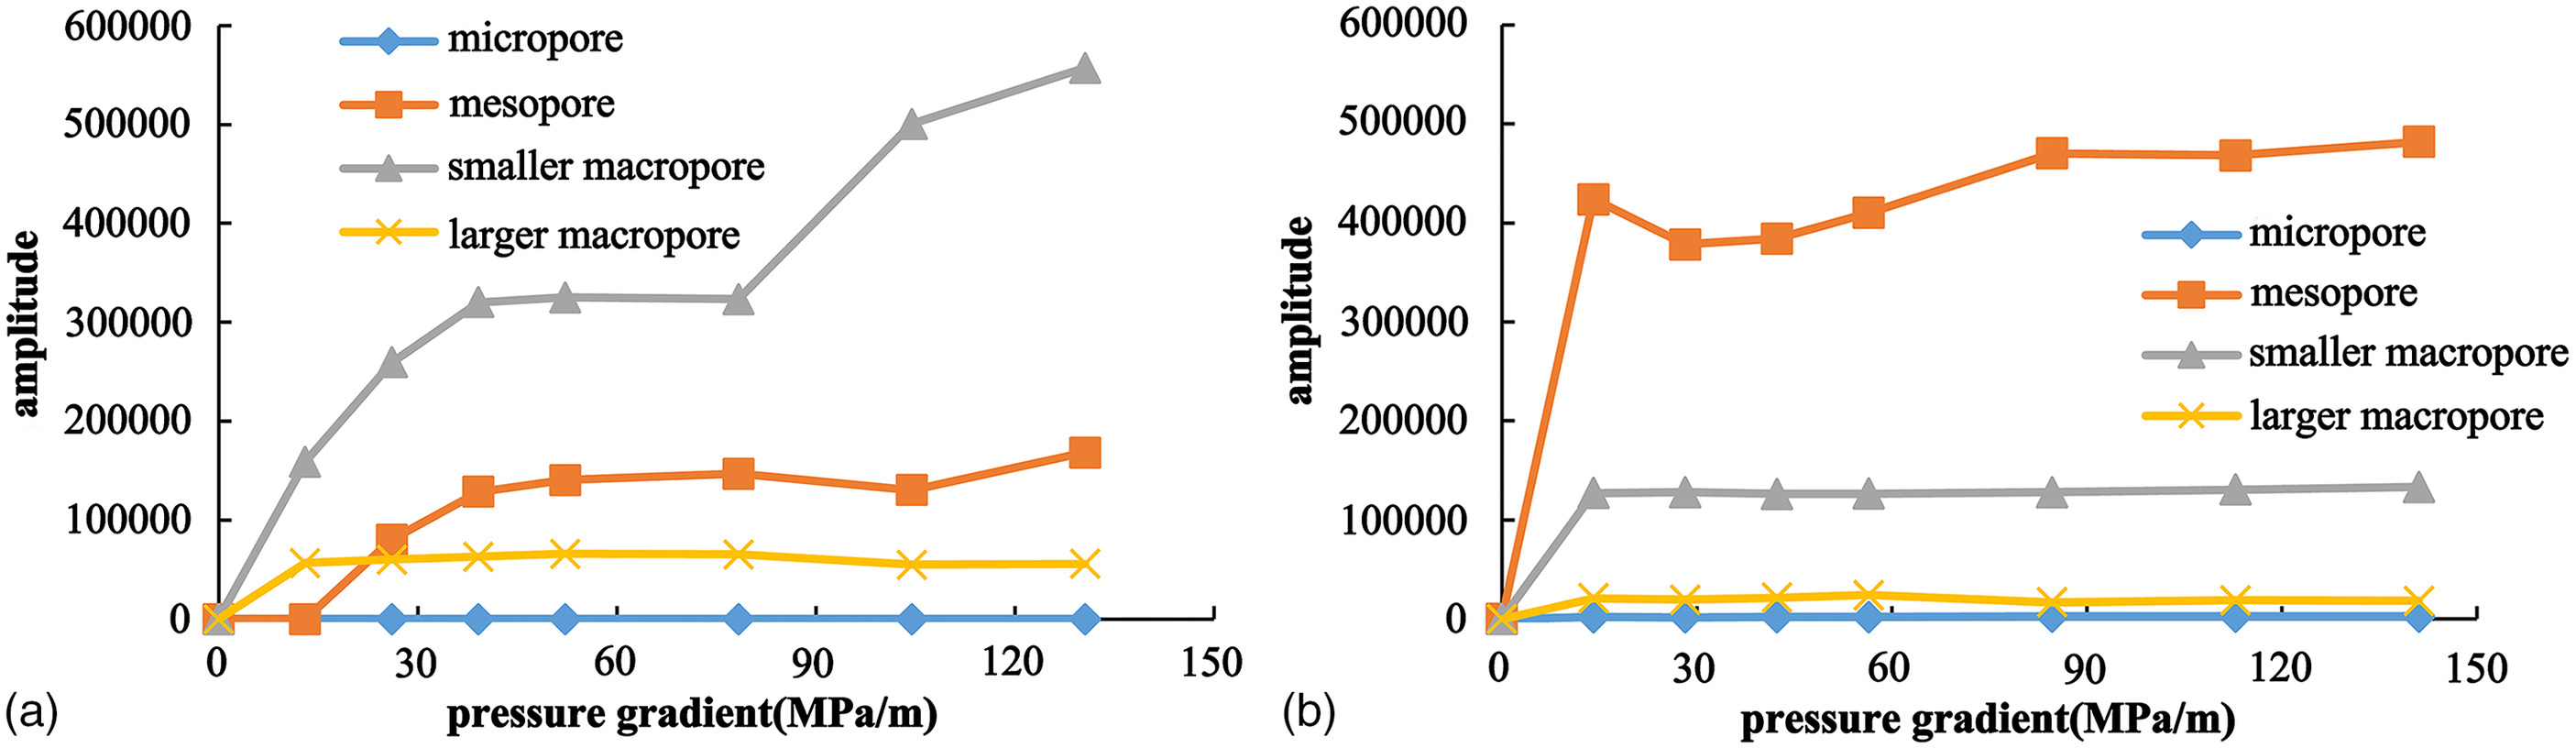
The changes in NMR signal of SO1 samples vary significantly in different pore sizes. The signal quantity in micropores remains close to zero as the pressure gradient increases, indicating the difficulty of crude oil injection into these micropores. The signal quantity in mesopores shows a significant increase with the pressure gradient, indicating the ingress of crude oil into these mesopores. The most obvious change is observed in the smaller macropores, where the signal quantity substantially increases with the pressure gradient, indicating that a majority of the crude oil enters these smaller macropores. In larger macropores, the signal quantity remains relatively unchanged with the pressure gradient, indicating a consistent oil content, albeit higher than that in micropores, as depicted in Fig. 4(a). The NMR signal variation pattern in SO2 samples follows the same trend as in SO1 samples in micropores and macropores. The signal quantity in mesopores initially decreases and then slowly increases with the pressure gradient. Among all the pores, the signal quantity in mesopores is the highest, suggesting the infiltration of crude oil into these mesopores during the injection process. The signal quantities in smaller macropores and larger macropores remain relatively stable as the pressure gradient increases, and their values are higher than those in micropores, as illustrated in Fig. 4(b). The majority of crude oil in the shale reservoir of the target area is primarily hosted in smaller macropores and mesopores.
Displacement Characteristics
oil displacement efficiency is influenced by the lithology of rocks. In terms of oil displacement efficiency, the rocks can be roughly ranked from high to low as follows: muddy dolomite, argillaceous dolomite, and dolomitic mudstone. Generally, a higher shale content leads to lower oil displacement efficiency, as depicted in Fig. 5. The average oil displacement efficiency for dolomite is 52.3%, while for dolomitic mudstone it is 41.5%. The displacement efficiency is influenced by the mineral composition. Higher argillaceous content results in poor pore development, lower oil content, and reduced displacement efficiency.

During the displacement process, the peak value of the NMR signal gradually decreases with increasing displacement pressure difference. Notably, the NMR signal within the pore-throat radius range of 0.03–1 μm experiences a significant reduction, as shown in Fig. 6. This indicates that the pore size range for in the shale reservoir of the target area is 0.1–1 μm.
With an increasing displacement pressure gradient, the nuclear magnetic signal of micropores and larger macropores exhibits slight changes, while the signal in mesopores and smaller macropores is significantly reduced. This suggests that as the pressure gradient increases, the oil content in mesopores and smaller macropores decreases significantly. Subsequently, with further increases in pressure gradient, the oil content in these pores remains relatively unchanged. The changes in signals of different pore sizes during displacement are illustrated in Fig. 7. As depicted, the drive primarily affects mesopores and smaller macropores, while the oil content in pores of other scales remains relatively stable. This indicates the formation of a dominant channel, leading to gas channeling in pores of other sizes.

Analysis of Displacement and Water Displacement
Due to the presence of salt beds in the shale layers, water displacement experiments with good injectivity have been conducted in the pilot study. In order to evaluate the pore range of displacement and water displacement, parallel samples were subjected to and water displacement experiments. water was utilized to remove the signal from injected water while retaining the signal from oil, enabling the investigation of oil production patterns in different pores.
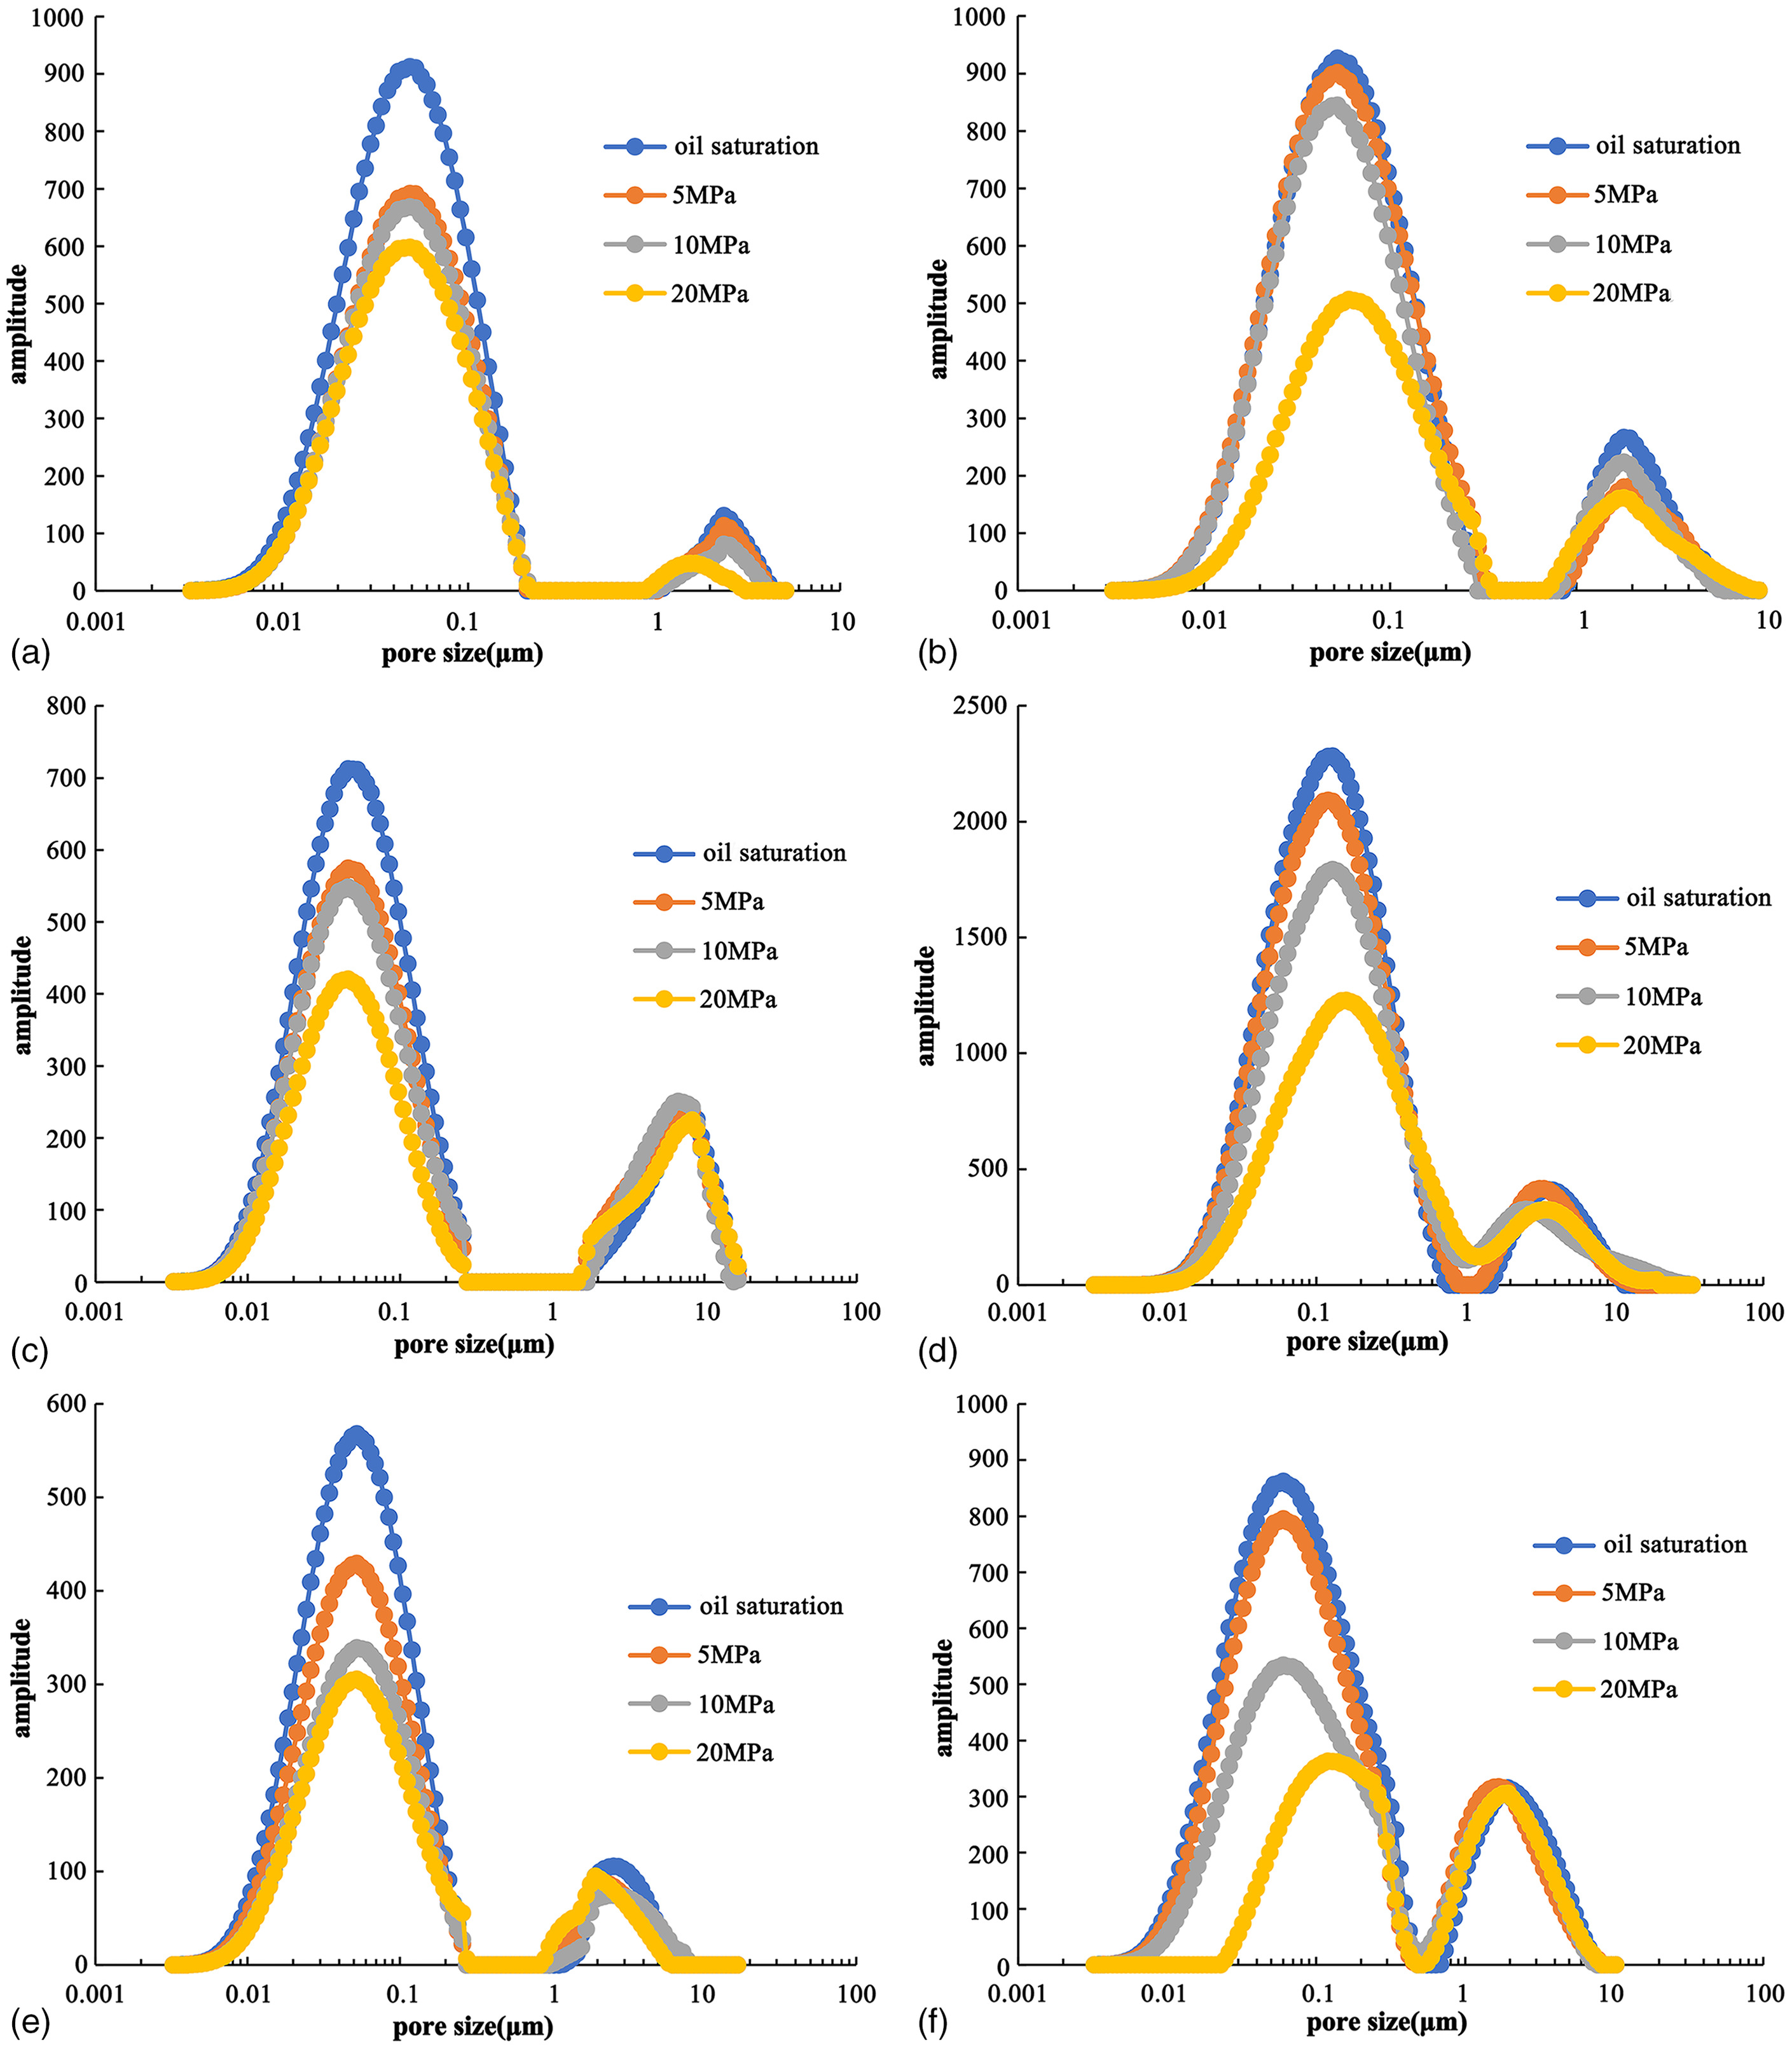
Fig. 8 indicates that as the displacement pressure increases, the nuclear magnetic signal quantity gradually decreases, indicating the displacement of more oil. Generally, the difference in oil displacement efficiency between water and is relatively small in pores with a diameter range of 1–10 μm. However, the oil displacement efficiency of in pores with a diameter range of 0.01–0.2 μm is significantly higher than that of water. The average oil displacement efficiency of in the parallel samples is 45.1%, while the average oil displacement efficiency of water injection is 34.4%. This implies that the average oil displacement efficiency of is nearly 11% points higher than that of water displacement.
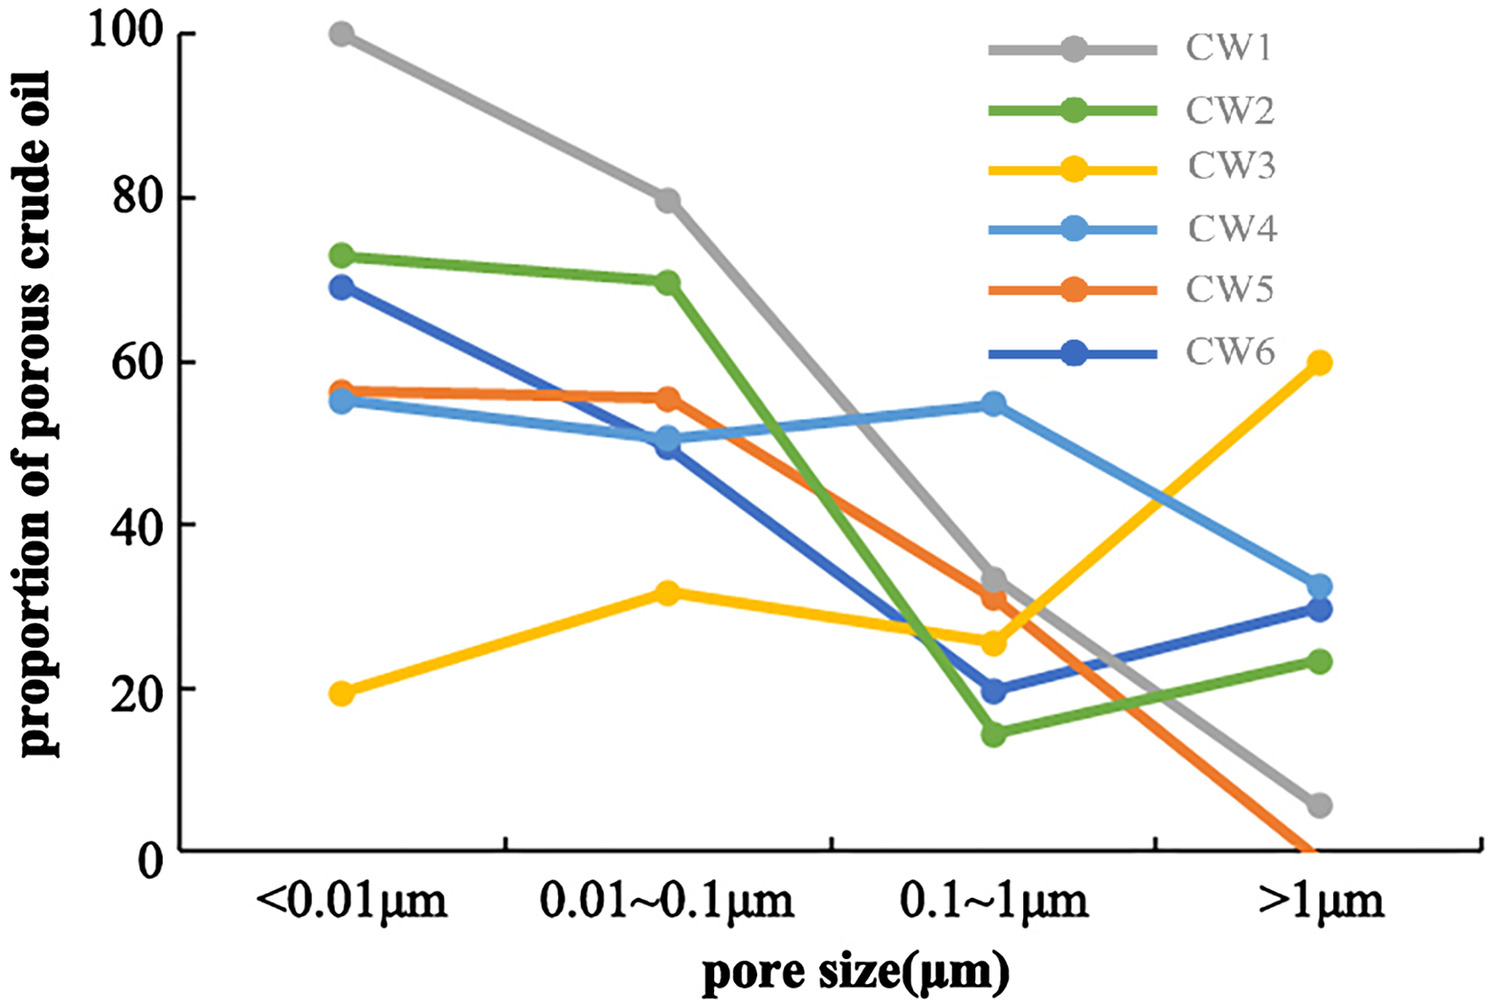
Figs. 9 and 10 present broken line diagrams illustrating the proportion of crude oil produced from different segmented pores through water and displacement, respectively, at a displacement pressure of 20 MPa. The difference in crude oil proportion between water and displacement is not significant in pores with a pore-throat radius greater than 0.1 μm. However, in pores with a pore-throat radius less than 0.1 μm, the proportion of crude oil produced by displacement is notably higher than that of water displacement. When forms a miscible phase with oil, it leads to a wider swept volume range, which helps prevent gas channeling to some extent.

Conclusion
The occurrence of crude oil in a shale reservoir with salt beds in eastern China is mainly in mesopores and smaller macropores. During injection, oil can be produced from mesopores and smaller macropores, while oil cannot be produced from micropores. There is a negative correlation between displacement efficiency and the clay mineral content of shale cores.
The effect of injection in pores larger than 0.1 μm is equivalent to that of water injection, while the effect of injection in pores smaller than 0.1 μm is significantly better than that of water injection.
miscible displacement can not only improve the micro-oil washing efficiency in shale oil but also prevent the formation of gas channeling, which can potentially enhance the microscopic sweep efficiency. Therefore, miscible displacement has a significant effect on oil displacement. In the shale oil reservoir of the target area, the average oil displacement efficiency of displacement is nearly 11% points higher than that of water displacement.
Data Availability Statement
All data, models, and code generated or used during the study appear in the published article.
Acknowledgments
This work was supported by a SINOPEC Science and Technology Project “Microscopic flow simulation and multiphase multiscale flow characteristics of shale oil.”
References
Dai, C., R. Cheng, X. Sun, Y. Liu, H. Zhou, Y. Wu, Q. You, Y. Zhang, and Y. Sun. 2019. “Oil migration in nanometer to micrometer sized pores of tight oil sandstone during dynamic surfactant imbibition with online NMR.” Fuel 245 (Jun): 544–553. https://doi.org/10.1016/j.fuel.2019.01.021.
Hu, S. Y., W. Z. Zhao, and J. H. Hou. 2020. “Development potential and technical countermeasures of continental shale oil in China.” Pet. Explor. Dev. 47 (4): 819–828.
Lang, D. J., Z. M. Lun, and C. Y. Lv. 2021. “NMR experiment on influencing factors of injection in shale oil to enhance oil recovery.” Pet. Explor. Dev. 48 (3): 603–612.
Li, A. F., X. X. Ren, and G. J. Wang. 2015. “Method and application of NMR to study pore structure of tight sandstone.” J. China Univ. Pet. 39 (6): 92–98.
Li, H. B., J. Y. Zhu, and H. K. Guo. 2008. “Study on pore radius distribution converted by nuclear magnetic resonance spectrum.” J. Spectro. 25 (2): 273–280.
Li, H.-B., Z.-M. Yang, R.-S. Li, T.-Y. Zhou, H.-K. Guo, X.-W. Liu, Y.-X. Dai, Z.-G. Hu, and H. Meng. 2021. “Mechanism of enhanced oil recovery in shale reservoirs.” Pet. Sci. 18 (6): 1788–1796. https://doi.org/10.1016/j.petsci.2021.09.040.
Li, L., Z. X. Wang, and Y. H. Zheng. 2019. “Enrichment mechanism of shale oil in salt rhythmic layer of the third member of Qianjiang formation in Jianghan basin.” Geosciences 44 (3): 1012–1023.
Li, S., Q. Wang, K. Zhang, and Z. Li. 2020a. “Monitoring of and oil-based foam flooding processes in fractured low-permeability cores using nuclear magnetic resonance (NMR).” Fuel 263 (Mar): 116648. https://doi.org/10.1016/j.fuel.2019.116648.
Li, X., J. Cai, H. Liu, X. Zhu, Z. Li, and J. Liu. 2020b. “Characterization of shale pore structure by successive pretreatments and its significance.” Fuel 269 (Jun): 117412. https://doi.org/10.1016/j.fuel.2020.117412.
Li, Z. Q., Y. Sun, and R. L. Hu. 2018. “Study on the characteristics of shale nano pore structure based on NMR method.” J. Eng. Geol. 26 (3): 758–766.
Pu, W. F., C. Y. Wang, and Y. B. Li. 2021. “NMR experimental study of flooding in tight oil reservoir.” Sci. Technol. Eng. 17 (7): 30–34.
Shen, R., Z. M. Hu, and H. K. Guo. 2018. “Shale occurrence space and gas bearing regularity of Longmaxi formation in Changning, Sichuan basin.” Lithologic Reservoirs 30 (5): 11–17.
Sing, K. S. W. 1985. “Reporting physisorption data for gas/solid systems with special reference to the determination of surface area and porosity (Recommendations 1984).” Pure Appl. Chem. 57 (4): 603–619. https://doi.org/10.1351/pac198557040603.
Song, M. S., H. M. Liu, and Y. Wang. 2020. “Understanding and exploration practice of Paleogene shale oil enrichment law in Jiyang depression.” Pet. Explor. Dev. 47 (2): 225–235.
Sun, Z., F. Wang, S. He, Y. Zheng, S. Wu, and J. Luo. 2019. “The pore structures of the shale about typical inter-salt rhythm in the Paleogene of Qianjiang depression.” J. Shenzhen Univ. Sci. Eng. 36 (3): 289–297. https://doi.org/10.3724/SP.J.1249.2019.03289.
Wang, F. R., S. He, and Y. H. Zheng. 2016. “Study on mineral composition and brittleness characteristics of inter salt shale oil reservoir of Qianjiang formation in Jianghan basin.” Pet. Geol. Exp. 38 (2): 211–218.
Wang, Y.-F., Z.-Y. Li, S.-M. Zhang, D.-X. Liu, and M.-C. Ding. 2021. “Remaining oil distribution in models with different heterogeneities after WAG injection: Visual research by nuclear magnetic resonance technique.” J. Cent. South Univ. 28 (5): 1412–1421. https://doi.org/10.1007/s11771-021-4712-z.
Wu, S. Q., X. S. Tang, and X. J. Du. 2013. “Geological characteristics of continental shale oil in Qianjiang sag, Jianghan basin.” J. East China Univ. Technol. 36 (3): 282–286.
Yang, Z. M., R. S. Li, and H. B. Li. 2020. “Core experimental evaluation of salt dissolution of inter salt shale oil reservoir.” Pet. Explor. Dev. 47 (4): 750–755.
Zhang, S., P. Yang, and L. Y. Ye. 2009. “Application of nuclear magnetic resonance in the study of gas drive percolation mechanism in low permeability reservoirs.” J. Eng. Geophys. 6 (6): 675–680.
Information & Authors
Information
Published In

Journal of Energy Engineering
Volume 149 • Issue 6 • December 2023
Copyright
This work is made available under the terms of the Creative Commons Attribution 4.0 International license, https://creativecommons.org/licenses/by/4.0/.
History
Received: Dec 13, 2022
Accepted: Jun 29, 2023
Published online: Sep 15, 2023
Published in print: Dec 1, 2023
Discussion open until: Feb 15, 2024
ASCE Technical Topics:
- [Inorganic compounds]
- Carbon compounds
- Carbon dioxide
- Cavitation
- Chemicals
- Chemistry
- Continuum mechanics
- Displacement (mechanics)
- Energy engineering
- Energy sources (by type)
- Engineering mechanics
- Environmental engineering
- Fluid dynamics
- Fluid mechanics
- Fuels
- Geology
- Geomechanics
- Geotechnical engineering
- Hydraulic engineering
- Hydraulic structures
- Hydrologic engineering
- Non-renewable energy
- Oils
- Organic compounds
- Petroleum
- Pore size distribution
- Reservoirs
- Rocks
- Shale
- Soil mechanics
- Soil properties
- Solid mechanics
- Structural mechanics
- Water and water resources
Authors
Metrics & Citations
Metrics
Citations
Download citation
If you have the appropriate software installed, you can download article citation data to the citation manager of your choice. Simply select your manager software from the list below and click Download.