Economic Value of Flood Forecasts and Early Warning Systems: A Review
Abstract
As population growth, economic development, and climate change increase the risks of inland flooding across the US and worldwide, a range of flood mitigation approaches must be considered and evaluated, including flood forecast and early warning systems (FFEWS). Cost–benefit analysis (CBA) has long been used to scrutinize flood mitigation investments, and although most applications have addressed physical infrastructure projects, a growing body of research has focused on assessing the benefits of information-based approaches such as FFEWS. This review summarizes research to date on the economic benefits of FFEWS, using value-of-information (VOI) analysis as a conceptual and organizing framework. This framework emphasizes the role of FFEWS in improving protective action decisions and flood-related outcomes. I also use the framework to categorize the methods used to assess FFEWS benefits, distinguishing between methods that focus specifically on prevented flood damage and those that take a more holistic VOI-based approach. Through a systematic search and screening of the literature, I identified 66 articles and reports published from 1970 to 2023 in more than 15 countries. Overall, I found that relatively few of the studies (15) applied a VOI-based approach, and most of them estimated VOI in relative rather than absolute (i.e., monetary) terms. In contrast, almost half of the studies used expert assessments or surveys of household or businesses to quantify the effectiveness of warnings for prompting protective actions and for reducing damages. Even so, evidence from these studies regarding the economic value of avoided flood damages is limited and is particularly lacking for the US. These findings highlight the continuing need for empirical research to inform VOI analyses of FFEWS and to isolate the effect of FFEWS on incurred flood damages and on protective action costs.
Introduction
In the US, flooding consistently is among the most damaging and costly types of natural disaster. Over the last 15 years, river and flash flooding events on average have been responsible for almost $8 billion in annual physical damages and nearly , and exposures to flood risks are likely to continue increasing due to the combined effects of population growth, economic development, and climate change (Wing et al. 2018).
Addressing these risks has led to substantial investments in flood mitigation, not only using traditional structural approaches such as levee and dam construction, but also nonstructural approaches such as flood forecast and early warning systems (FFEWS). For example, for over 50 years the US National Weather Service has managed a nationwide network of River Forecast Centers charged with developing and disseminating flood forecasts and warnings to stakeholders. Many states and localities also have invested in flood early warning systems to protect themselves and minimize the impacts of flooding.
To ensure that flood and disaster management funds are allocated and spent efficiently, cost–benefit analysis (CBA) has long been used, particularly by agencies such as the USACE and FEMA, to evaluate flood mitigation investments. However, measuring economic benefits and returns on investment (ROIs) for FFEWS continues to be particularly challenging. Although there are well-established methods and tools for measuring avoided flood damages from physical and natural infrastructure projects, these methods are not by themselves sufficient for assessing the benefits of information-based approaches to flood mitigation. Instead, as I discuss in this paper, these traditional economic valuation methods need to be integrated within a broader value-of-information (VOI) framework that accounts for human behavioral responses to forecasts and warnings.
Therefore, the purpose of this review is to provide a summary and assessment of research to date on the economic benefits of FFEWS, including identifying main gaps in the literature and implications for future research. To guide the review, I articulate and apply a VOI-based conceptual model connecting four main modeling components—forecast, decision, outcome, and valuation models—as a holistic framework for classifying, describing, comparing, and evaluating studies. Section “Conceptual Framework: Value of Information Analysis” describes the origins and main features of VOI analysis, and it describes the VOI conceptual model, which is illustrated using a simple flood forecast and response example. Using this framework and concepts from the non-market valuation literature, section “Methods for Valuing Forecast Information” identifies and describes the main types of methods used in the literature for assessing the benefits of FFEWS. In particular, it distinguishes between methods that are based on VOI analysis and other approaches that focus specifically on flood damages that are prevented through the use of FFEWS. Section “Selection and Screening of Papers” describes the procedures used to search, screen, and select studies to be included in the review. Section “Results” presents the results of the review, which included 66 studies conducted between 1970 and 2023 and in more than 15 countries or regions across the globe. Section “Conclusion” summarizes the main findings from the review and discusses the implications of these findings, including the main gaps in the literature and needs for future research.
Conceptual Framework: Value-of-Information Analysis
VOI analysis refers to a decision-analytic approach for estimating the gains (in monetary terms) from reducing uncertainty in parameters that inform decisions (Wilson 2015). Its roots date back to seminal work in decision analysis by Raiffa and Schlaifer (1961) and Howard (1968) and to subsequent extensions in the field of economics by, for example, McCall (1982) and Hirshleifer and Riley (1992). Since then, VOI methods have been applied to assess the benefits and ROI from a wide variety of information and knowledge-based products, ranging from investments in health care research (Fenwick et al. 2020) to earth observation data collection (Kruse et al. 2017) and environmental monitoring (Koski et al. 2020). It also has seen widespread use for evaluating the benefits of hydrometeorological forecasts, particularly for climate and weather applications (Lazo et al. 2010); however, as discussed in the present paper, its use for valuing FFEWS thus far has been more limited.
The fundamental question underlying VOI analysis is what is the maximum amount that a decision maker would be willing and able to pay for new information, prior to making a decision? If the decision maker’s objective can be represented simply as the maximization of expected value (i.e., risk neutrality), then VOI can be defined as the increase in expected value of outcomes resulting from decisions made with the information, compared with decisions made without the information. This definition underscores the important point that the value of reducing uncertainty with new information is not simply related to how uncertainty affects the expected utility of risk averse decision makers. Rather, VOI is derived from its ability to help even risk neutral or risk loving decision makers to avoid mistakes, which are actions that differ from what they would have chosen if they had been fully informed (i.e., with no uncertainty).
Conducting detailed quantitative VOI analyses to assess the value of flood forecast is challenging for several reasons, including, most importantly, lack of data on response actions by emergency managers and flood-affected property owners and on the associated costs and avoided flood damages from these actions. Nevertheless, VOI analysis provides an important conceptual and organizing framework for summarizing and evaluating existing research on the economic benefits of FFEWS.
Fig. 1 provides a graphical representation of the key components of VOI analysis applied to forecast information, which are illustrated with a simple flood forecast example. The a priori unknown state of nature, , in this example is flood severity, which in its simplest form is represented by a binary (flood, no flood) indicator. This future state of nature and the corresponding forecast or predicted state, , are both functions of upstream conditions, , which for simplicity are treated here as known levels of precipitation, but in practice are more complex and typically also are subject to uncertainty.
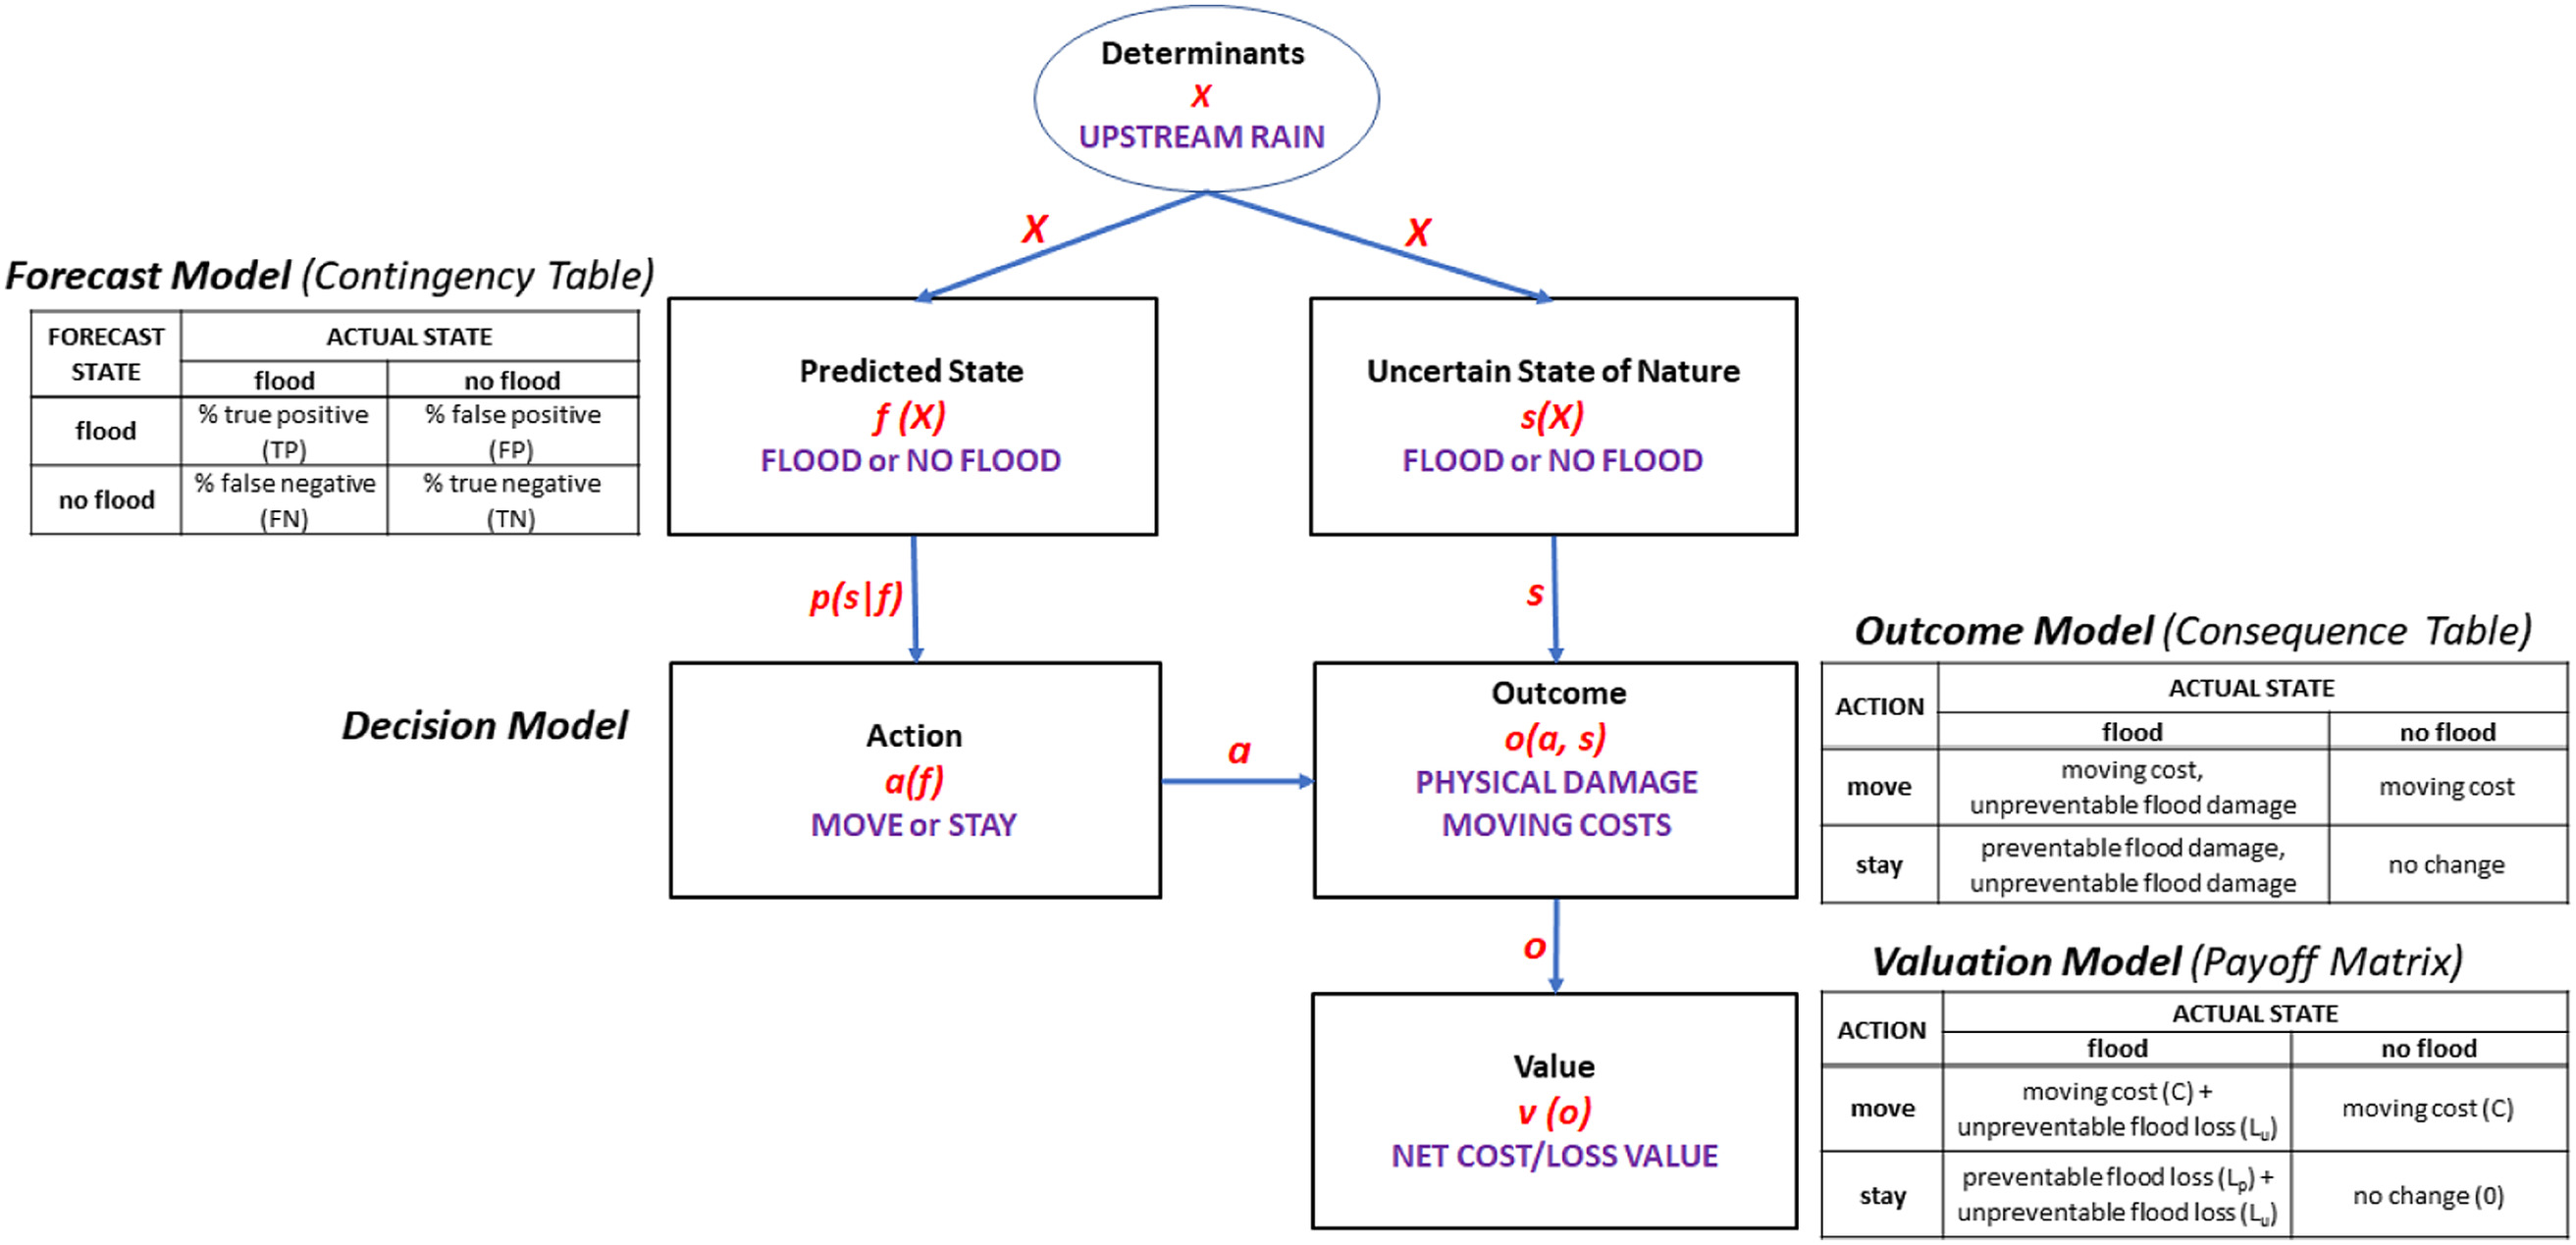
The VOI framework integrates four main modeling components (Fig. 1): forecast, decision, outcome, and economic valuation models. The forecast model, , predicts the unknown state of nature based on the observed conditions, and in the simple binary flood example its expected performance can be represented by a contingency table. For a forecast to provide perfect information, the percentage of predictions shown as false positive (FP) or false negative (FN) must both be zero.
The decision model, , represents the process by which the forecast information determines a choice of action by the decision maker. In the case of flood forecasts, it is a choice of protective action against potential flood harms or damages. In the simple example, the decision maker is assumed to be a property owner in a potentially flood-affected area, and the protective action is represented by a binary choice to either move building contents to a safer location (move) or leave them in place (stay).
In principle, the decision model could take many forms, including simple rules of thumb; however, in most VOI applications, the decision model is treated as an optimization problem, such that forecast information is used to select the action that maximizes the expected value (or expected utility) of future outcomes. Specifically, the forecast provides information about the probability of the future state, and these probabilities are used to weight future outcomes. The forecast-based probabilities can be represented as conditional probabilities, . Examples based on the contingency includewhere TP = true positive; and TN = true negative. The forecast uncertainty incorporated into decision-making also can be represented by the likelihood function, . Using the contingency table or applying Bayes’ rule, which states that , examples of these likelihoods include
(1)
(2)
(3)
(4)
Importantly, the outcome of the decision makers’ choice depends not only on the selected action but also on the actual state of the world that occurs. Therefore, the outcome model is represented as , such that every combination of and potentially can produce a different outcome. In the simple flood example, the results of the outcome model can be represented by the consequence table in Fig. 1.
To be comparable, the outcomes produced by this model must be measured with respect to a common baseline, which in this case is conditions before the uncertain state is realized. However, for this part of the analysis, the outcomes do not necessarily need to be measured in the same units. For example, if the action is to move and then a flood occurs, the outcomes could be measured as (1) the time (hours) and out-of-pocket costs (dollars) of moving items, and (2) the number of items that were damaged in the flood because they could not be moved.
The final step is the valuation model, , which converts all outcomes into a common monetary unit of measure so that they can be combined and compared directly across states and actions. The results of the valuation model can be presented in a payoff matrix, such as that in Fig. 1 for the flood example. These payoffs often are referred to as a cost–loss model because the monetized outcomes fall into two main categories: (1) costs of protective actions (e.g., moving costs), and (2) flood losses.
The valuation model results can be used to determine the best (i.e., highest valued) action for each actual state. In the simple flood example, it is the action that minimizes the sum of moving costs and flood losses (both of which have negative payoffs compared with preflood conditions). As long as moving costs () are less than preventable flood losses (), the best action if a flood occurs is to move items because is less than . The best action if no flood occurs is to stay because the cost of no change (zero) is less than .
Using the payoff matrix, one also can measure the penalties from mistakes. For each actual state, the penalty is the difference between the value of the best action and the value of an alternative action. In this context there are two types of mistakes
1.
underprotection, i.e., staying in the event of a flood, in which case the penalty is (i.e., incurring preventable flood losses, despite avoiding moving costs); and
2.
overprotection, i.e., moving in the event of no flood, in which case the penalty is (i.e., incurring unnecessary moving costs).
To derive the value of forecast information using this framework, one must first define the without-forecast reference conditions. Typically, it is assumed that without a forecast, decision makers rely on a prior probability of flooding, , based on past observations, rather than on new forecast information. In the simple flood example, if decision makers are assumed to maximize expected value, it has been shown that the chosen action in the reference condition will depend on how the cost–loss ratio () compares with the prior probability . If the cost–loss ratio is less (greater) than , then the default action will be to move (stay).
Given these reference conditions, the VOI framework can be used to assess the value of perfect forecast information (VOPI). With perfect information, there are no forecast errors and mistakes are avoided. In the simple example, the probability of false positive or false negative forecasts are both zero. VOPI represents the maximum amount that decision makers should be willing to pay ahead of time to completely avoid those mistakes. In the simple flood example, VOPI can be expressed in the following two ways:
•
if the reference point action is to stay and a mistake penalty of is incurred each time it floods, then ; and
•
If the reference point action is to move and a mistake penalty of is incurred each time it does not flood, .
The VOI framework also can be extended to assess the value of imperfect forecast information (VOII). In this case, the probabilities of false positive or false negative forecasts are not zero, so mistakes are possible. VOII represents the maximum amount that decision makers should be willing to pay ahead of time to decrease the probability of mistakes. The imperfect forecast has positive value if it reduces the expected value of penalties from mistakes by more than it increases them.
If the reference point action is to stay, then
(5)
In other words, if a forecast correctly predicts a flood and changes action from stay to move, then the decision maker will avoid the mistake of underprotection. However, there also is a probability that the flood forecast will be incorrect, in which case deciding to change action to move will result in a mistake of overprotection. The VOII is the difference between the probability-weighted value of avoiding the underprotection penalty [Eq. (5), first expression] and the probability-weighted loss in value from incurring the overprotection penalty [Eq. (5), second expression].
Conversely, if the forecast indicates no flooding, then there will be no change in action, mistake, or penalty relative to the reference condition. Therefore, no additional information value is expected or derived from a no-flood forecast when the reference point action is to stay.
If the reference point action is to move, then
(6)
In this case the VOII is the difference between the probability-weighted value of avoiding the overprotection penalty (unnecessary moving costs) and the probability-weighted value of incurring the underprotection penalty (preventable flood loss).
In summary, the value of an imperfect flood forecast includes not only the expected value of avoided flood losses but also the expected value of avoiding unnecessary flood protection costs. These benefits also must be weighed against the additional costs of protective actions (correct and mistaken) and the potential flood losses from false negatives (misses).
The VOI framework also can be used to assess the relative economic value (REV) of an imperfect forecast
(7)
In the simple 2-state × 2-action example, which is sometimes referred to as a cost–loss model, it has been by shown (e.g., Richardson 2000; Zhu et al. 2002) that the calculation of REV can be simplified to the following equation, based on only four model parameters:where = cost–loss ratio (); = prior probability, , of flood (based on the observed frequency of floods); = false alarm rate of the imperfect forecast; and = hit rate of the imperfect forecast. Moreover, Richardson (2000) showed that the maximum obtainable REV for a forecast system across potential cost–loss values is equal to the difference between its hit rate and its false alarm rate (), which also is referred to as its Peirce skill score, and Wandishin and Brooks (2002) showed that the range of cost–loss ratios for which REV is positive is equal to the difference between a forecast system’s frequency of hits [] and its detection failure ratio [)], which also is referred to as its Clayton skill score.
(8)
Although the simple cost–loss model is useful for illustrating the VOI framework, it is important to emphasize that (1) the framework can be generalized to include any number of states (actual and forecast) and actions, and (2) the basic principles of the simple model are equally relevant when more states and actions are included. In particular, the value of an imperfect forecast (relative to the reference condition) is equal to the expected value of avoided mistakes and associated penalties, net of the expected value of new mistakes and penalties. The framework also can be generalized to include both deterministic and probabilistic forecasts by recognizing that probabilistic forecasts directly communicate the conditional probabilities of flood states, , rather than those probabilities being implied by the error rates underlying an imperfect deterministic forecast.
Methods for Valuing Forecast Information
A wide variety of economic methods have been developed for estimating the monetary value to humans of changes in outcomes, risks, and assets. Although less commonly used for valuing intangible products such as publicly provided forecast information, many of these methods nonetheless are well suited and adaptable to these types of applications. This is particularly the case for nonmarket valuations methods, which focus on goods and services that are not connected directly to market transactions or prices.
To categorize methods used to value to the benefits of flood forecasts and warnings, I first distinguish between (1) VOI methods, which explicitly or implicitly address the full VOI framework, and (2) prevented damage methods, which focus more narrowly on that component of the VOI framework.
VOI Methods
Within this category, it is useful also to distinguish between deductive and inductive nonmarket valuation approaches (Young and Loomis 2014) applied to VOI analysis. Deductive methods, which proceed from general to specific, refer to approaches that begin with theoretical models detailing the assumed drivers of human behavior and their connections to values. They then parameterize key components of the model using available empirical evidence and typically use simulation and optimization methods to operationalize the model. Most applications of VOI analysis use this type of approach, beginning with a conceptual framework such as that described in the previous section, then parameterize the main components of the model—e.g., forecast, decision, outcome, and valuation modules—and finally simulate behaviors, outcomes, and values under alternative scenarios.
In contrast, inductive methods proceed from specific to general. In this context it means that they rely on observed behaviors, outcomes, or survey data to statistically model preferences or economic benefits. Inductive nonmarket valuation methods often are grouped into two main categories: revealed-preference (RP) methods, and stated-preference (SP) methods.
Revealed-preference inductive methods rely on observed behaviors, outcomes, or prices in indirectly related markets to infer people’s willingness to pay (WTP) for changes or commodities that are not exchanged directly through market transactions. For example, analyses of how lake water quality conditions affect anglers’ choices of which recreation sites to visit have been used to estimate their WTP for better water quality. Although RP methods rarely have been used to estimate the value of information, there are exceptions. For example, Leggett (2002) and Jakus and Leggett (2005) showed that they can be used to assess the value of recreation site health advisories which provide information about health risks. More recently, RP methods have been used to assess the benefits of routine weather forecasts (Shrader et al. 2023) The main advantage of RP methods lies in their use of actual behaviors or transactions to infer values; however, the data requirements for RP analyses often can be challenging, and it often is difficult to directly observe the information individuals rely on for making decisions.
Stated-preference inductive methods use surveys to directly elicit respondents’ preferences or WTP for changes described to them in the survey instrument. They have been used widely, for example, to assess the benefits of changes in health, personal safety, and environmental risks and outcomes. They also have been used to estimate WTP for a range of private and publicly provided information products including, for example, public health advisories (Krieger and Hoehn 1999) and weather forecast information (Lazo et al. 2010). A main advantage of SP methods is that they give researchers the flexibility to define the changes of interest; however, the hypothetical nature of SP scenarios makes it difficult to verify whether respondents are answering truthfully or with full consideration and understanding of the presented scenarios (Johnston et al. 2017).
For inductive methods, the VOI framework serves mainly as a theoretical model for interpreting behaviors or preferences related to information. Unlike deductive VOI methods, which explicitly connect and model the different components of the VOI framework, inductive methods can treat the framework simply as a set of assumptions for understanding and explaining the links between information, decisions, and values, without separately modeling or quantifying the individual components.
Prevented Damage Methods
In practice, many studies describing or analyzing the economic benefits of FFEWS focus exclusively on prevented flood damages and losses. As discussed in Section “Conceptual Framework: Value of Information Analysis” and indicated by Eq. (5), preventable flood losses (represented by ) are a key component of the value of forecast information; however, a comprehensive VOI analysis also accounts (explicitly or implicitly) for flood prevention costs (e.g., moving costs) and the possibility of under- or overprotection mistakes (e.g., unnecessary protective actions and costs) with imperfect forecasts.
In the current literature, four main approaches are used to estimate prevented flood damages from flood forecasts and warnings:
•
primary data collection through surveys of households or businesses;
•
expert assessment, often using structured expert elicitation interviews with small samples of flood specialists or other key stakeholders;
•
flood risk models that account for the hydraulic impacts of temporary mitigation measures triggered by FFEWS; and
•
benefit transfer (BT) approaches (Johnston et al. 2018), in which previously estimated benefits from existing studies analyzing similar situations are transferred to the application(s) of interest.
In addition, several studies have provided mainly qualitative assessments or reviews of existing studies rather than original estimates or quantitative analyses of prevented damages.
Selection and Screening of Papers
To conduct a comprehensive search of the literature for relevant studies, I began with keyword searches using multiple online scholarly databases (Web of Science, Google Scholar, and Science Direct). The selected keywords included phrases such as “flood forecast,” “river forecast,” “flood warning,” and “flood early warning” combined with “economic benefit,” “cost–benefit analysis,” “value of information,” “willingness to pay,” and “damage reduction.” I then screened the titles and abstracts included in the search results, flagged and created a bibliography of potentially relevant studies, acquired full versions of the studies, and conducted more in-depth screening of the study contents to rank them as either high, low, or no relevance. For the studies ranked high relevance, I also reviewed their references and citations, and I screened the identified studies using the same criteria as for the initial screening, selection, and ranking process.
Based on full text review of all high ranked studies, I arrived at a final list of studies by excluding those that, on further inspection, did not provide relevant estimates or perspectives on the value of flood forecasts or warnings. I then created a database summarizing key features of the studies, including date and type of publication, geographic focus, and methods used. For the subset of studies that applied a deductive VOI approach, a more in-depth summary was conducted based on the four-component structure of the VOI framework outlined in Section “Conceptual Framework: Value of Information Analysis.” For the empirical studies that analyzed protective actions in response to flood warnings, I also summarized key features and parameter estimates related to warning awareness, warning response, and avoided damages.
Results
Through the previously described search process I identified 66 studies that provide distinct empirical, methodological, or other qualitative contributions to understanding the economic value of flood forecast or warning systems. A full list and summary of the studies is provided in the Supplemental Materials.
The years of publication for the studies range from 1970 to 2023; however, roughly two-thirds were published during the period from 2005 to 2019 (Fig. 2). The 5-year period providing the most studies (19) was 2005 to 2009. Almost 70% (45) of the studies were published as peer-reviewed journal articles, and 26% (17) were published as reports from various sources. The remaining three studies were published as book chapters or conference proceedings.
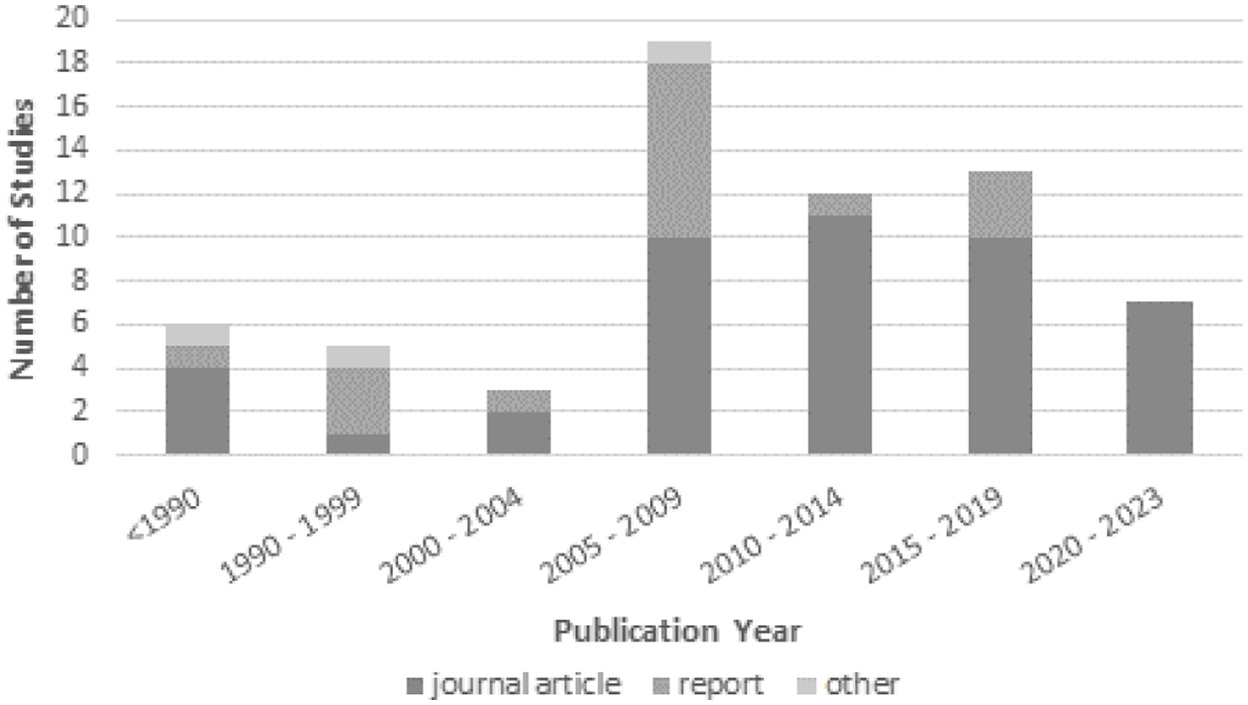
Table 1 summarizes both the regional distribution and methods employed across the 66 identified studies. Roughly 60% (39) of the studies focused on flood forecast or warning systems in Europe, and most of these were conducted for Germany (15) and the United Kingdom (UK) (14). From a methodological perspective, only 23% (15) of the studies applied a deductive or inductive VOI approach. In contrast, 51 studies focused on prevented damage values and behaviors, including 23 studies that analyzed data collected through surveys of flood-affected households and businesses. Overall, only 11 of these studies focused on flood forecasts or warning system in the US, none of which involved primary data collection through surveys.
| Region | VOI method | Prevented damage method | Total | |||||
|---|---|---|---|---|---|---|---|---|
| Deductive | Inductive (SP) | Review or conceptual | Household or business survey | Expert assessment | Flood risk modeling | Benefit transfer | ||
| US | 0 | 1 | 2 | 0 | 4 | 1 | 4 | 12 |
| Global | 0 | 0 | 2 | 0 | 0 | 0 | 0 | 2 |
| Europe | 6 | 1 | 5 | 20 | 3 | 0 | 4 | 39 |
| Canada | 5 | 0 | 0 | 0 | 1 | 0 | 0 | 6 |
| Asia-Pacific | 1 | 1 | 1 | 2 | 2 | 0 | 0 | 7 |
| All regions | 12 | 3 | 10 | 22 | 10 | 1 | 8 | 66 |
Deductive VOI Studies
Through the literature search, I identified 12 papers that applied a deductive approach to assess the economic value of flood prediction systems. All these studies were published during the period 2006–2019, and they predominantly involved case study applications in Europe (six) and Canada (five), along with one application in Thailand.
Tables 2–5 summarize and compare the VOI methods applied in these 12 papers, and are organized around the four main modeling components—forecast, decision, outcome, and valuation models—outlined in Section “Conceptual Framework: Value of Information Analysis.” Eight of the papers evaluated flood predictions from short-term streamflow forecast systems, and lead times across these systems ranged from 1 to 9 days; one study used satellite data to represent near-real-time estimates of flooding. Two of the papers focused on precipitation forecasts as indicators of short-term flood risk. In contrast to the other studies, Alfonso et al. (2016) focused on the information value from long-term flood risk predictions, which support longer-term decisions regarding land development rather than short-term flood avoidance behaviors.
| Study | Walser and Rotach (2006) | Roulin (2007) | Buizza (2008) |
|---|---|---|---|
| Geographic context | Switzerland | Belgium, two catchments (Demer and Ourthe) | Europe |
| Forecast model output | Daily precipitation across 1.5° land cells for Fall 2004 | Daily streamflow across two catchments for 2002 | Daily precipitation and temperature across 0.5° land cells for Summer 2007 |
| Forecast states used in VOI analysis | Two: above or below precipitation thresholds (90th percentile) | Two: above or below streamflow threshold (95th percentile) | Two: above or below precipitation thresholds (5 and ) and temperature anomalies () |
| Forecast lead time | 66-h lead time | 1- to 9-day lead times | 6-day lead time |
| Decision model actions | Take action (generic) | Take action (generic) | Take action (generic) |
| Number of actions modeled | Two: action versus no action | Two (static model): action versus no action; | Two: action versus no action |
| Three (two-stage dynamic model): act now, act later, do not act | |||
| Outcome model | Flood loss (generic); | Flood loss (generic); | Flood loss (generic); |
| Cost of action (generic) | Cost of action (generic) | Cost of action (generic) | |
| Unit(s) of outcome model | Not specified, all costs and losses expressed in relative terms | Not specified, all costs and losses expressed in relative terms | Not specified, all costs and losses expressed in relative terms |
| Valuation model | Same as outcome model | Same a outcome model | Same as outcome model |
| Decision model | Maximize expected value of outcomes | Maximize expected value of outcomes | Maximize expected value of outcomes |
| VOI model runs | Estimates REV for single land cell under alternative forecast systems | Estimates REV under alternative forecast and sensitivity scenarios | Estimates REV under alternative forecast scenarios |
| Cost–loss data | None; uses assumed relative values for costs and losses | None; uses assumed relative values for costs and losses | None; uses assumed relative values for costs and losses |
| Forecast alternatives | Ensemble precipitation forecast with and without high resolution weather prediction model | • Deterministic versus probabilistic forecast • Three alternative lead times (3, 6, and 9 days) | Deterministic versus probabilistic (ensemble) forecasts |
| Other sensitivity analyses | N/A | Sensitivity of REV to cost–loss ratio (static model), relative costs of early versus late action (dynamic model), and decision rule probability threshold (probabilistic forecasts) | N/A |
| Key findings | Forecasts based on high resolution numerical weather prediction model provide greater REV for cost–loss ratios less than 0.3 | Demonstrates how cost–loss decision model can be (1) used to assess REV and its sensitivity to forecast characteristics and cost–loss parameters, and (2) expanded to include two-stage dynamic model | Probabilistic forecast has higher REV than deterministic |
| Study | Van den Bergh and Roulin (2010) | Muluye (2011) | Verkade and Werner (2011) |
|---|---|---|---|
| Geographic context | Belgium, Meuse and Scheldt Basins | Canada, Quebec, Chute-du-Diable Basin | Scotland, Glasgow, White Cart Water (tributary of the river Clyde) |
| Forecast model output | Daily streamflow across 12 subcatchments for 2006–2009 | Daily streamflow at 1 stream gauge for 1997–2001 | 6-h streamflow forecasts at 1 stream gauge for 1996–2007 |
| Forecast states used in VOI analysis | Two: above or below streamflow threshold (90th percentile) | Two: above or below streamflow threshold (90th percentile) | Two: above or below streamflow threshold (local datum ) |
| Forecast lead time | 3-, 6-, and 9-day lead times | 7-day lead time | 1–6-h lead times |
| Decision model actions | Take action (generic) | Take action (generic) | Issue flood warning |
| Number of actions modeled | Two: action versus no action | Two: action versus no action | Two: warning versus no warning |
| Outcome model | Flood loss (generic); | Flood loss (generic); | Hydroeconomic model for flood damages; cost of warning assumed to be percentage of avoided damage |
| Cost of action (generic) | Cost of action (generic) | ||
| Unit(s) of outcome model | Not specified, all costs and losses expressed in relative terms | Not specified, all costs and losses expressed in relative terms | Monetary (British pounds) |
| Valuation model | Same as outcome model | Same as outcome model | Same a outcome model |
| Decision model | Maximize expected value of outcomes | Maximize expected value of outcomes | Maximize expected value of outcomes |
| VOI model runs | Estimates REV under alternative forecast and sensitivity scenarios | Estimates REV under alternative forecast scenarios | Estimates VOPI and REV under alternative forecast and sensitivity scenarios |
| Cost–loss data | None; uses assumed relative values for costs and losses | None; uses assumed relative values for costs and losses | Flood damage estimates derived from local residential property location and value data |
| Forecast alternatives | Probabilistic forecast with three alternative lead times (3, 6, and 9 days) | • Deterministic versus probabilistic (ensemble) forecasts • With versus without two downscaling methods for incorporating precipitation forecasts | • Deterministic versus probabilistic forecast • Lead time varied between 1 and 6 h |
| Other sensitivity analyses | Comparison of REV for larger versus nested subcatchments | N/A | Sensitivity of REV to (1) cost–loss ratio, and (2) decision rule probability threshold (probabilistic forecasts) |
| Key findings | • REV generally was higher for combined versus nested subcatchments. • Forecasts with shorter lead times had higher REV. | • Probabilistic forecast has higher REV than deterministic forecast. • Forecasts based on downscaled precipitation models provide greater REV. | • REV for probabilistic forecast is higher than for deterministic forecast. • REV is not monotonically related to lead time, but depends on how lead time affects forecast uncertainty and cost–loss ratio. |
| Study | Boucher et al. (2012) | Abaza et al. (2013) | Alfonso et al. (2016) |
|---|---|---|---|
| Geographic context | Canada, Quebec, Gatineau Basin, two reservoirs | Canada, Quebec, eight watersheds in four river systems | France, Barcelonnette |
| Forecast model output | Daily streamflow across six subcatchments for Fall 2003 | 3-h streamflow forecasts across eight watersheds for Sept–Oct 2010 | Long-term flood risk for land cells near river |
| Forecast states used in VOI analysis | Continuous (streamflow in ) | Two: above or below streamflow threshold (2-year return period) | Two: wet (high risk) or dry (low risk) for land cells |
| Forecast lead time | 24-h lead time | 3-day lead times | Long-term, multiyear |
| Decision model actions | Daily reservoir volumes (% full) and flow through turbines () | Take action (generic) | Change land use through development |
| Number of actions modeled | Continuous | Two: action versus no action | Two: build or not build on the land parcels |
| Outcome model | Linked hydrologic-hydropower model for flood damages and electricity generation | Flood loss (generic); | Flood damage model for flooded cells; income loss model for nonflooded cells |
| Cost of action (generic) | |||
| Unit(s) of outcome model | Hydropower production (GWh); inundation days; spillage (GWh) | Not specified, all costs and losses expressed in relative terms | Monetary (Euros) |
| Valuation model | Same as outcome (net value measured in terms of GWh) | Same as outcome model | Same as outcome model |
| Decision model | Optimization model (maximize hydropower with penalty for flooding) | Maximize expected value of outcomes | Optimize expected value for land use change (development) decisions |
| VOI model runs | Estimates daily power production, spillage, and inundation for 10-week high flood period under alternative forecast and decision scenarios | Estimates REV under alternative forecast and sensitivity scenarios | Estimates increase in expected value from probabilistic flood map (compared with observed land-use change) |
| Cost–loss data | Cost and loss data derived from decision support tool developed by Hydro-Quebec | None; uses assumed relative values for costs and losses | Flood damages and lost income derived from property value and agricultural yield data |
| Forecast alternatives | • Deterministic forecast based on high-resolution precipitation forecast • Probabilistic forecast based on ensemble of lower resolution precipitation forecasts | • Deterministic versus probabilistic forecast • Global versus regional ensemble for probabilistic forecasts | Probabilistic flood map based on Monte Carlo simulations applied to hydrologic model |
| Other sensitivity analyses | N/A | Sensitivity of REV to cost–loss ratio | N/A |
| Key findings | • Use of forecast and decision support tool improved hydropower and flooding outcomes for all forecasts. • High-resolution deterministic forecast produced better outcomes than low-resolution ensembles. | REV for probabilistic and deterministic forecasts is positive for most cost–loss ratios and basins. | Higher VOI for floodplain locations with high land-use-change consequences and high uncertainty regarding inundation probability |
| Study | Matte et al. (2017) | Thiboult et al. (2017) | Oddo and Bolten (2019) |
|---|---|---|---|
| Geographic context | Canada, Quebec, Montmorency River | Canada, Quebec, 20 catchments | Thailand, Bangkok |
| Forecast model output | 3-h streamflow forecasts at one stream gauge for 2011–2014 | Daily streamflow across 20 catchments for 2008–2010 | Maximum flood depths along emergency vehicle routes during 2011 flood |
| Forecast states used in VOI analysis | 12 streamflow categories | Two: above or below streamflow threshold (90th percentile) | Two: above or below depth threshold (300 mm) |
| Forecast lead time | 5-day lead times | 9-day lead time | Near real time |
| Decision model actions | Level of daily emergency management spending over 5 days | Take action (generic) | Choice of route by emergency vehicles between dispatch and population centers |
| Number of actions modeled | Continuous levels of spending | Two: action versus no action | Two options for each combination of origin (dispatch) and destination (population) () |
| Outcome model | Function measuring damages minus costs with respect to streamflow and EM spending | Flood loss (generic); | Routing model calculating response time for each route with- and without-flood |
| Cost of action (generic) | |||
| Unit(s) of outcome model | Monetary value ($) of damages minus EM spending | Not specified, all costs and losses expressed in relative terms | Emergency response route time (min) |
| Valuation model | Monetary value ($) of WTP based on assumed utility function | Same as outcome model | Monetary value of avoided mortality per minute of reduced response time |
| Decision model | Optimization (select EM spending level that maximizes expected utility) | Maximize expected value of outcomes | Select route with lowest response time, based on expected flood state |
| VOI model runs | Numerical simulations using data for 2011–2014 with focus on flood event circa May 17, 2014 | Estimates REV under alternative scenarios | Estimates VOPI (with known flood depths) compared with baseline routes assuming no flooding |
| Cost–loss data | Damage estimates based on flow-damage function for structures. Cost of EM action based on observations from 2014 flood. | None; uses assumed relative values for costs and losses | Emergency response times based on open-source OpenRouteService navigation service |
| Forecast alternatives | Three probabilistic forecasts alternatives: • Dressed deterministic, using past error statistics • Meteorological ensemble • Ensemble with random noise added to weather inputs | • 6 forecast systems (deterministic and probabilistic) using alternative techniques for addressing uncertainty • 20 hydrologic models • 4 alternative lead times (1, 3, 5, and 9 days) | N/A |
| Other sensitivity analyses | • Vary risk aversion coefficient in utility function • Vary spending constraints • Vary damage multiplier | Sensitivity of REV to cost–loss ratio | One-at-a-time sensitivity analysis of response times to selected model parameters representing effects of flood depth on average road speed |
| Key findings | • Forecast value is sensitive to decision maker’s risk aversion. • Forecast skill does not necessarily translate to higher value when risk aversion is included. | • Addressing uncertainty in hydromet model improved REV for all lead times. • REV is positively related forecast accuracy and, to a lesser extent, reliability. | Incorporating near-real-time information on flood depth can significantly reduce emergency response times and increase life- saving benefits. |
Although all the studies used meteorological and/or hydrologic forecast models that produce precipitation, streamflow, or flood-level estimates along a continuous scale, almost all of them converted these outputs to a two-level discrete indicator representing with- and without-flood conditions for the VOI analysis. In most cases, a percentile threshold (e.g., 90th or 95th) was assumed and derived from a distribution of past observations. This simplification reflects the computational challenges of expanding the dimensions of the analysis beyond the simple cost–loss framework described in the previous section.
Most of the studies estimated and compared the information value derived from alternative forecast model specifications. For example, seven of the studies compared VOI for deterministic and probabilistic forecasts, and two compared alternatives methods for incorporating uncertainty in the probabilistic forecasts. Four studies compared results for different lead-time assumptions, and four included alternative specifications of the meteorological or hydrologic models used for developing forecasts.
Although the studies differ regarding the decision, outcome, and valuation models used in the VOI analysis, eight of them applied a simple cost–loss framework to estimate and compare REV under alternative forecast model specifications. This approach [Eq. (8)] greatly simplifies the analysis, because REV can be calculated without (1) identifying any specific actions taken in response to flood forecasts or warnings, or (2) any estimation of outcomes or values related to costs and losses. Instead, it requires the specification of a generic cost–loss ratio, which in these applications typically is varied between the extremes of 0 and 1 as part of a sensitivity analysis. Only one of these eight REV studies (Verkade and Werner 2011) specified an action decision (i.e., whether to issue flood warning) and an approach for estimating cost–loss outcomes and values.
Across the four non-REV studies, the action decisions were diverse, including level of spending on emergency management (EM) response (Matte et al. 2017), level of reservoir releases (Boucher et al. 2012), choice of emergency vehicle route (Oddo and Bolten 2019), and land-use change (Alfonso et al. 2016). This diversity of decisions also resulted in a diversity of approaches for estimating outcomes and values. In several cases, outcomes were expressed directly in monetary terms, and in one case (Boucher et al. 2012) outcomes were expressed only in physical terms (gigawatt-hours of power generation) and were not translated into monetary terms.
In all cases, the assumed decision rule involves some form of optimization based on the specified outcome or valuation model; however, they did not all assume that decision makers simply maximize expected value. For example, Boucher et al. (2012) assumed that decision makers maximize electricity generation with flood avoidance included as a constraint on reservoir releases. Matte et al. (2017) assumed that the decision makers maximize expected utility, for which, for risk averse decision makers, utility is defined as a nonlinear function of monetary costs and losses.
Several key findings emerge from these 12 studies, despite the range of applications and methods used. First, they all demonstrate how a deductive approach to VOI analysis can be operationalized to conduct economic evaluations of flood forecasts. Although the REV approach used in several studies does not produce monetary estimates of forecast benefits, it does provide a systematic approach for evaluating and comparing alternative forecast methods in a way that includes economic considerations rather than just traditional measures of forecast accuracy and skill. Second, several studies found that the VOI from probabilistic forecasts is greater than that from deterministic forecasts because they give decision makers the flexibility to define action thresholds that are tailored to their individual cost–loss conditions. Third, although the lower uncertainty associated with shorter forecast lead times provides information value, this gain must be traded off against potential changes in the range of actions available and in the costs and losses associated with shorter time windows for action. Fourth, as Matte et al. (2017) showed, it is possible to incorporate risk averse preferences by decision makers into VOI analysis for flood forecast; however, higher risk aversion does not always translate to higher WTP for forecast information.
Finally, as shown in Tables 2–5, thus far there have been relatively few applications of VOI analysis to flood forecasts. More importantly, very few of them included empirical estimates of avoided flood damages or flood avoidance costs, and none of them provided direct evidence of flood forecast benefits for the US.
Inductive VOI Studies
The literature search also identified three studies that used inductive VOI methods. Each study applied a SP approach to directly elicit individuals’ WTP for flood forecast or warning information. No studies using a RP approach to assess the value of FFEWS were identified.
The earliest of the three studies (Arias et al. 2015) used a contingent valuation approach to collect WTP data from 497 households living in flood-prone municipalities of Laguna, Philippines. Through in-person interviews, respondents were presented with information about a potential project that could bring a flood early warning system to their town and would provide subscribers with 2–4 h advance warning of flooding through text messages. Using a well-accepted referendum technique, Arias et al. then asked whether respondents would be willing to vote in favor of the project if it cost them a fixed amount per month, and these fixed payment values were varied randomly across respondents. Based on responses, Arias et al. estimated that households were willing to pay the equivalent of $3.50/month on average. Applying these estimates in a cost–benefit analysis, Arias et al. concluded that the system would provide significant net benefits to the user population, with an overall benefit–cost ratio of over .
In a more recent US study, Lim et al. (2022) conducted a contingent valuation study collecting mail survey data from 295 farmers in the Red River Basin region of Minnesota and North Dakota. This survey presented respondents with information about a new satellite data product that could be used by their River Forecast Center to improve spring flood predictions in the basin, and it asked them about their WTP to support this of use of this product. Lim et al. found that respondents were willing to pay roughly $13/year on average; however, this may well be an underestimate of true WTP because Lim et al. presented the payment as a voluntary contribution (rather than a compulsory payment by everyone), which can induce free-riding behavior (Johnston et al. 2017).
Arnal et al. (2016) also used a SP approach to elicit WTP for flood forecast information; however, the study was conducted in an experimental setting using flood management experts as participants, rather than as a survey study of potential beneficiaries. Participants in the experiment were given a budget of tokens and presented with a game scenario in which their objective was to use probabilistic forecasts to protect a fictitious town from flooding while spending as few tokens as possible on forecasts. Although the study did not provide estimates of actual monetary WTP for forecast information, it does provide insights into factors that affect perceived forecast value, including the perceived quality of the forecasts, experience with the forecasts, and available budget.
These studies demonstrate that SP methods offer a viable approach for estimating the value of flood forecast information. However, the small number of existing applications also most likely is an indication of their limitations, including concerns about the hypothetical nature of SP scenarios and the often high costs of conducting SP surveys. The complete lack of RP studies in this arena also most likely is an indication of the data challenges presented by these methods for valuing flood information. In principle it should be possible to estimate whether and by how much lower forecast errors result in lower combined costs and losses (controlling for actual flood levels); however, the data needs for such an analysis are difficult to meet.
Prevented Flood Damages
Compared with the relatively small number of previously described studies that explicitly applied VOI methods to assess the benefits of FFEWS, I identified 51 studies that focused on protective actions and/or prevented flood damages. They explored key components of the VOI framework, but in a less comprehensive way than the previously described studies.
Reviews and Conceptual Studies
Nine of the identified studies provided mainly qualitative assessments or reviews of existing studies rather than original estimates or quantitative applications of prevented damages. For example, in a report developed for planners at the USACE, Yoe (1994) presented a conceptual framework for evaluating the benefits of flood warning systems and summarized methods for estimating these benefits. The framework focuses on how traditional depth–damage relationships for estimating flood damages can be adapted to account for (1) the number of hours of advance warning provided, (2) the different types of behavioral responses available to the public for reducing damages, and (3) factors influencing the effectiveness of risk communication embodied in the warnings. Although the report demonstrated the framework with numerical examples, it concluded that empirical evidence was lacking (at the time of publication) for many key model parameters.
In the early 2000s, three studies in particular provided assessments of the state of practice in the UK for assessing flood warning benefits. Penning-Rowsell and Green (2000), Parker et al. (2005), and Parker and Tunstall (2007) all discussed how the appraisal of flood warning systems was evolving at the time to address key data and knowledge gaps, many of which were also highlighted by Yoe (1994). In many ways, these studies set the stage for the subsequent empirical research on avoided flood damages (which is discussed subsequently) that was conducted in the UK and other parts of Europe. Parker et al. (2009a, b) provided an updated summary of evidence of flood warning response behaviors, including a summary of findings from that empirical research. They also proposed an updated UK Flood Hazard Research Centre (FHRC) modeling framework for estimating flood damages avoided due to flood warnings. At its core, this framework includes three main factors: (1) the portion of total potential flood damages that are composed of damages to moveable inventory, (2) the portion of flood-affected households that receive official flood warnings, and (3) the portion of those receiving warnings who are able to take effective actions to reduce damages.
Hallegate (2012), Perera et al. (2019), and Suckall and Soares (2022) reviewed and summarized evidence regarding the benefits of hydrometeorological services, including flood forecasts and warning systems, for less-developed countries and South Asia. All three studies concluded that empirical evidence regarding protective behaviors and avoided flood damages in response to flood warnings is particularly lacking for non-European and lower-income countries. They also stressed that this evidence is needed to properly evaluate and prioritize investments in hydrometeorological services, which are essential tools for adaptive flood management in the face of climate change.
Survey and Expert Assessment Studies
The literature search identified 33 studies that estimated the magnitude of behavioral responses or prevented flood damages in response to FFEWS using data collected through surveys or expert assessments. Key aspects of these studies are summarized in Table 6. In particular, Table 6 reports estimated ratios from these studies under three general categories: (1) the percentage of affected populations who receive warnings (), (2) the percentage who take protective action in response to warnings (), and (3) the percentage reduction in damage resulting from those actions (). Details regarding the study-specific assumptions and components of those ratio also are provided in the table.
| Study | Area studied | Method | Population studied | Estimated ratio (%) | Ratio type | Ratio components (numerator/denominator) |
|---|---|---|---|---|---|---|
| Day (1970) | US (Susquehanna River Basin) | Expert judgment | Residential | 34 | Potential preventable content damage with warning/total potential damage to structure + content | |
| Residential | 28 | Potential preventable content damage with 12–24-h warning/total potential damage to structure + content | ||||
| Day and Lee (1976) | US (Connecticut River Basin) | Expert judgment | Residential | 36 | Potential preventable content damage with 12–24-h warning/total potential damage to structure + content | |
| Residential | 26 | Potential preventable content damage with 6–8-h warning/total potential damage to structure + content | ||||
| Chatterton et al. (1979) | UK (Nottingham) | Expert judgment | Residential | 7 | Potential preventable content damage with 0.5-h warning/total potential damage to structure + content | |
| Residential | 25 | Potential preventable content damage with 2-h warning/total potential damage to structure + content | ||||
| Residential | 50 | Potential preventable content damage with 4-h warning/total potential damage to structure + content | ||||
| Smith (1981) | Australia (Lismore, New South Wales) | Survey () () () | Residential | 48 | Prevented damage/total potential damage to content + structure | |
| Commercial | 77 | Prevented damage/total potential damage to content + structure | ||||
| Industrial | 94 | Prevented damage/total potential damage to content + structure | ||||
| Carroll (1986) | US (Fort Wayne, Indiana) | Expert judgment | Municipal | 10–20 | Prevented flood damage due to forecast system/damage in event without warning | |
| McBean et al. (1988) | Canada (Ontario) | Expert judgment | Residential | 3–22 | Potential preventable content damage with 6–12-h warning/total potential damage to structure + content | |
| Parker (1991) | UK | Survey () | Residential | 55 | Households available to receive warning/potentially affected households | |
| Residential | 75 | Households able to respond to warning/potentially affected households receiving warning | ||||
| Residential | 70 | Households responding effectively/potentially affected households available and able to respond | ||||
| Torterotot et al. (1992) | France (eight sites) | Survey () | Residential | 64 | Households receiving advance warning from some source/households in flood-affected area | |
| Residential | Households taking some protective action/households in flood-affected area | |||||
| Wind et al. (1999) | Netherlands (Meuse River Basin) | Before–after analysis | Municipal | 35 | Reduction in flood damage from warning and experience/damage during previous flood event without warning | |
| Carsell et al. (2004) | US | Expert judgment | Residential | 24 | Potential preventable content damage with 6-h warning/total potential damage to content | |
| Residential | 39 | Potential preventable content damage with 12-h warning/total potential damage to content | ||||
| Residential | 49 | Potential preventable content damage with 48-h warning/total potential damage to content | ||||
| Penning-Rowsell et al. (2005) | UK | Expert judgment | Residential | 21 | Potential preventable damage with maximum warning/total potential damage to structure + content | |
| Parker et al. (2007a, b), and Tunstall et al. (2006) | UK | Survey () | Residential | 38 | Households receiving warning from some source/potentially flood-affected household | |
| Residential | 55 | Households responding effectively to warning/potentially affected households receiving warning | ||||
| Residential | 71 | Households responding effectively to warning/potentially affected households receiving warning | ||||
| Thieken et al. (2005, 2007), and Kreibich et al. (2005) | Germany (Elbe and Danube Basins) | Survey () | Residential | 74 | Households receiving advance warning from some source/households in flood-affected area | |
| Residential | 41 | Households receiving advance warning from local authorities/households in flood-affected area | ||||
| Residential | Households taking some protective action/households in flood-affected area | |||||
| Kreibich et al. (2007) | Germany (Elbe River Basin) | Survey () | Business | 55 | Businesses receiving advance warning from some source/businesses in flood-affected area | |
| Business | 67 | Businesses taking some protective action/businesses in flood-affected area | ||||
| Business | 66–72 | Businesses able to reduce equipment or inventory damage/businesses taking protective action | ||||
| Steinfuhrer and Kuhlicke (2007) | Germany (Mulde catchment) | Survey () | Residential | 90 | Households receiving advance warning from some source/households in flood-affected area | |
| Residential | 77 | Households taking some protective action/households in flood-affected area | ||||
| Schröter et al. (2008) | Austria (Traisen Basin) and Spain (Besòs Basin) | Survey () | Business | 20 | Expected prevented damage with 1-h warning/total potential damage | |
| Business | 60 | Expected prevented damage with 12-h warning/total potential damage | ||||
| Holland (2008) | Fiji (Navua) | Expert judgement | Health and safety | 10–50 | Expected prevented loss/total potential flood loss | |
| Residential | 20–55 | Expected prevented loss/total potential flood loss | ||||
| Personal income | 15–30 | Expected prevented loss/total potential flood loss | ||||
| Business | 10–60 | Expected prevented loss/total potential flood loss | ||||
| Kreibich et al. (2011) | Germany (Elbe and Danube Basins) | Survey () () | Residential | 87–88 | Households receiving advance warning from some source/households in twice flood-affected area | |
| Business | 76–88 | Businesses receiving advance warning from some source/businesses in twice flood-affected area | ||||
| Residential | 90–95 | Households taking some protective action/households in twice flood-affected area | ||||
| Business | 79–93 | Businesses taking some protective action/businesses in twice flood-affected area | ||||
| Residential | 51–92 | Households able to protect contents from damage/households taking protective action | ||||
| Business | 36–77 | Businesses able to reduce equipment or inventory damage/businesses taking protective action | ||||
| Kienzler et al. (2015) | Germany (Elbe, Danube, Oder, and Rhine Basins) | Survey () | Residential | 73–94 | Households receiving advance warning from some source/households in flood-affected area | |
| Residential | Households taking some protective action/households in flood-affected area | |||||
| Rözer et al. (2016) | Germany (Hersbruck, Lohmar, Osnabrück) | Survey () | Residential | 31 | Households receiving advance warning from some source/households in flood-affected area | |
| Residential | 69 | Households taking some protective action/households receiving warning | ||||
| Kreibich et al. (2017) | Germany (Saxony, Saxony-Anhalt, Bavaria) | Survey () () | Residential | 95 | Households receiving advance warning from some source/households in flood-affected area | |
| Business | 97 | Businesses receiving advance warning from some source/businesses in flood-affected area | ||||
| Residential | 55–66 | Households receiving advance warning from public authorities/households in flood-affected area | ||||
| Business | 49 | Businesses receiving advance warning from some source/businesses in flood-affected area | ||||
| Residential | 94 | Households taking some protective action/households in flood-affected area | ||||
| Business | 99 | Businesses taking some protective action/businesses in flood-affected area | ||||
| RTI International (2018) | Bangladesh (Jamuna flood plain) | Survey () | Residential | 11 | Households receiving advance warning from some source/households in flood-affected area | |
| Residential | 5.5–6.3 | Expected prevented damage with 3–8 day warning/total potential damage | ||||
| Rai et al. (2020) | Nepal (Lower Karnali River Basin) | Survey () | Residential | 96 | Households able to save property in last flood/households in flood-affected area |
Many of the earlier efforts to assess the benefits of flood forecast systems focused on estimating potentially preventable damages to household contents. Based largely on expert judgment, they provided what can best be interpreted as upper-bound estimates of actually prevented damages, because they do not account for barriers in households’ ability to receive, understand, or respond to warnings.
For example, in the US, Day (1970) and Day and Lee (1976) primarily considered the effects of evacuating residential property to upper floors or higher ground. After collecting detailed inventories of household items for their study areas, they used expert judgment to adjust depth–damage relationships for household contents under two main scenarios: (1) maximum practical evacuation, and (2) limited-warning partial evacuation. The duration of advance warning for the two scenarios differed across the two studies (Table 6). Applying these adjusted relationships to flood damage simulations of their study areas, they estimated that potentially preventable damages under full-evacuation scenarios averaged 34%–36%, compared with the total damages to structures and contents that would have occurred without any early warning. For the partial-evacuation scenario, they found that potentially preventable damage ratios averaged 26%–28%. In addition, they estimated the costs of evacuating property for the two scenarios, based on assumptions about the labor and materials required to remove and return items from the home or business. In general, they found that these costs were relatively small, ranging 3% to 8% of potentially preventable damages. Chatterton et al. (1979) conducted a similar study in the UK, also using expert assessments to adjust depth–damage relationships, and applying them in a flood damage simulation analysis. They estimated potentially preventable flood damages ranging from 7% to 50% for warning lead times ranging from ½ to 4 h.
Other studies using expert assessments to measure the effect of early warnings on potentially preventable flood damages focused on adjustments to depth–damage relationships. For example, McBean et al. (1988) conducted interviews with 287 floodplain residents in Ontario, Canada to gather detailed information on household contents, and then used their own expert judgment to adjust damages under alternative depth and lead time assumptions. Overall, these adjustments ranged from 3% to 22% in potentially avoided damages. In the US, Carsell et al. (2004) convened a panel of 11 floodplain management and damage experts in the US and asked them to estimate how household damages potentially could be reduced for different flood depths and warning lead times. Averaged across respondents and depths, the potentially avoided content damages ranged from 24% (6-h lead time) to 49% (48-h lead time) compared with total content damages with no warning (i.e., not including damages to structures). In the UK, Penning-Rowsell et al. (2005) recommend assuming that (1) household inventory accounts for 52% of total potential flood damages to households on average, and (2) movable inventory accounts for 41% of potential inventory damages. Multiplying these two ratios, potentially preventable damages (with warning times of at least 12 h) represent roughly 21% of total potential damages.
I also identified three studies that relied on expert judgment to estimate actual prevented damages due to FFEWS. The first was conducted in New South Wales, Australia (Smith 1981) to estimate avoided damages during a previous flood event. Data on damages incurred during the flood were collected via survey from 140 residences, 212 commercial establishments, and 26 industrial establishments. Estimates of what damages would have been without early warning were assessed based on input from a professional valuer. The resulting estimated ratios of actually avoided damages relative to total potential damage were 48%, 77%, and 94% for the residential, commercial, and industrial samples, respectively. Smith interpreted these ratios as best-case scenarios because they were based on a community that was very accustomed to flooding and that had established procedures for reducing flood damages, including a flood warning system. The second study was conducted in Fort Wayne, Indiana to assess damages from flooding on the Maumee River in 1985 (Carroll 1986). This study compiled actual damages to the city in 1985 and then used a USACE model to estimate what the damages would have been without recently implemented flood improvement systems, including a new flood alert system. Based on expert judgment, Carroll attributed 7%–10% of the avoided damages to flood alerts, which translated to 6%–9% of the total potential damages that could have occurred.
The third study relying on expert judgment to estimate prevented damages was an analysis of expected benefits for a future flood warning system in Navua, Fiji (Holland 2008). In this case, various local stakeholders were asked to estimate the range of actual reductions in flood losses they expected under worst- and best-case scenarios. They were asked to estimate avoided losses not only for residential damages but for several other flood-affected sectors as well. The estimates of prevented damages ranged from 10% to 60% of total potential losses in each sector (Table 6).
One additional study that also could be described as relying on expert assessment is that of Wind et al. (1999), who compared aggregate-level flood damage estimates for two similar flood events that affected communities along the Netherland’s Meuse River in 1993 and 1995. The study found that, despite similar flood magnitudes, the event in 1995 resulted in 35% less flood damage. Wind et al. attributed this reduction to a combination of longer flood warning times in 1995 and the experience gained by residents from the previous flood event, but they acknowledged that the causal effect of warning systems cannot be determined from their study.
The first studies that used surveys to acquire detailed information from households and businesses about protective actions and prevented damages in response to flood warnings were conducted in the UK. Parker (1991) reported the findings from a seminal survey study investigating the determinants and prevalence of protective actions in response to early warning systems. Based on input from over 1,200 property owners affected by flooding, the study found that 55% of potentially affected residence were available to respond to a warning, 75% of these available residents were able to respond, and 70% of these able residents did respond effectively to warnings. Combined, these ratios imply that less than 30% of potentially affected households were able to effectively respond to flood warnings.
Follow-up survey studies of 341 UK residents affected by flooding in the early 2000s collected detailed data on incurred and avoided damages to household items (Tunstall et al. 2006; Parker et al. 2007a, b). Accounting for the observed proportion of households that received advance warnings of flooding of any kind (38%) and the proportion of potential damages to moveable inventories that were prevented through protective actions by these households—55% for those receiving warning with lead times less than 8 h, and 71% for those with lead time greater than 8 h—these studies estimated that 21%–27% of potential damages to moveable inventories were avoided by households taking protective actions in response to warnings. However, they also found evidence that 75% of households that did not receive warnings took protective actions, and these households reduced damages by 45%. Therefore, the incremental effect of warnings on the percentage of damages avoided was 10%–26%. Interestingly, Torterotot et al. (1992) found similar results in a survey study of flood-affected residents in France. Based on data from more than 400 respondents across eight study sites, they estimated that 38% received some form of advance warning, and that across all households, 75% took protective actions.
Following severe flooding across central Europe in 2002, a series of survey studies was launched in Germany to investigate the effectiveness of flood warning, preparedness, and response. One of the first was a study by Steinfuhrer and Kuhlicke (2007), who surveyed more than 300 residents in the Mulde River Basin after the 2002 flood. They found that 79% of respondents had been called upon to evacuate, and only 10% had not received any prior warning; 77% reported taking some protective action, including leaving the house with most important things (22%) and securing some things in the house (21%).
Following the same flood event, a separate study was conducted for three particularly hard-hit areas in the Elbe River and Danube River watersheds (Kreibich et al. 2005; Thieken et al. 2005, 2007). A total of 1,697 flood-affected households were surveyed, of which 74% reported receiving some form of advanced warning about flooding (including from their own observations), and 41% specifically receiving these warnings from local authorities. The average lead time among those who received warnings was 37 h. Some form of protective action was taken by over 50% of all respondents. The most common actions were moving household contents upstairs and moving vehicles to safe locations. Despite the relatively high rates of awareness of and response to flood warnings, the analysis did not report estimates of either potential or actual reductions in flood damages due to the emergency measure taken. In fact, the study found somewhat counterintuitively that households with higher reported losses also tended to be those with relatively longer warning lead times.
Kreibich et al. (2007) conducted a survey of local businesses in the Elbe River area. Of the 415 flood-affected businesses surveyed, 55% reported receiving advance flood warnings (25% from local or regional authorities), with an average (median) lead time of 20 (8) h. Based on these warnings or their own observations, 67% of businesses also reported taking some form of emergency measures. Of those taking action, 72% indicated at least some success in avoiding damage to equipment, and 66% reported at least some success in avoiding damages to inventories. Overall, those reporting success in taking emergency action were able to reduce damages by 52% compared with those that did not report success in taking emergency action. In addition, Kreibich et al. found that businesses on average spent almost €9,000 on emergency protective measures against flooding.
Kreibich et al. (2011, 2017), Kienzler et al. (2015), and Rözer et al. (2016) followed-up on the 2002 flood year studies by surveying German households and businesses affected by flooding from 2005 to 2013. Kreibich et al. (2011) compiled comparative data from residents and businesses in areas affected by flooding in both 2002 and 2006. Although they did not find significant differences in the percentages of households or businesses receiving warnings or engaging in emergency measures across the two years, they did find that the measures taken in 2006 were more successful in avoiding damages for both households and businesses. Kienzler et al. (2015) collected data from over 1,000 residents affected by floods in 2005, 2006, 2010, and 2011 in the Elbe, Danube, Oder, and Rhine basins. Overall, they found that the percentage receiving warnings was higher than in the 2002 flood study, but the percentages of those taking protective actions, such as moving household contents and vehicles, was similar. They also found that longer advance warning times were associated with lower flood damages; however, the magnitude of this effect was not quantified. Rözer et al. (2016) conducted a survey of flood-affected households in three urban areas in Germany after floods in 2005 and 2010. In contrast to other studies in Germany, they found that only 31% of households in their study areas reported receiving advance warnings; however, of those who did receive some type of advance warning, 69% reported taking some form of protective action.
After floods in 2013, Kreibich et al. (2017) interviewed 1,355 households and 197 businesses in the same flood-affected states as studied by Kreibich et al. (2005). Due in part to advances in flood warning systems in the regions, they found that rates of both reception of and response to warnings were consistently higher in 2013 than in 2002. Although the perceived effectiveness (by respondents) of emergency actions also was significantly higher in 2013 than in 2002, the study did not report evidence of damage reductions attributable to advance warnings or protective actions.
Despite providing important insights regarding the public’s awareness of and responsiveness to flood warnings in Germany and collecting information on flood damages, the nine previously described studies provide relatively little evidence regarding the magnitude of prevented damages. However, a separate set of studies used and combined the survey data across multiple years to analyze the main determinants of flood damages, including the role of flood warnings and protective actions. Elmer et al. (2010), Merz et al. (2013), and Schröter et al. (2014) analyzed flood damages using the survey data collected from over 1,000 households affected by floods in 2002, 2005, and 2006, and Vogel et al. (2018) and Mohor et al. (2020) expanded these analyses to also include data from households affected by floods in 2010, 2011, and 2013. Although these studies applied a variety of statistical methods to analyze flood damages, including principal component analysis, multivariate regression, and Bayesian network approaches, ultimately none of them found strong evidence or reported robust measures of the effects of early warnings or protective measures on reducing flood damages.
One other survey-based study that was conducted in other parts of Europe, namely flood-affected areas of Austria (Traisen basin) and Spain (Besòs basin), was that by Schröter et al. (2008). They analyzed the effectiveness and efficiency of early warnings for industries, in part through a survey asking respondents “Suppose you receive an alert some time before a flash flood, by which percentage could you reduce flood damage?” Each respondent was asked to respond to four potential lead times: 1, 3, 6, and 12 h. Although the study received only 12 completed questionnaires, the average estimates ranged from 20% for a 1-h warning to 60% for a 12-h warning. The study also estimated the costs of protective actions (based on employee time costs), which were roughly 4.5% of avoidable damage.
The review also identified two more recent survey-based studies conducted in Asia. The first, RTI International (2018), analyzed conditions in northern Bangladesh. The study gathered data from over 2,000 households in areas affected by 2016 floods and found that only 11% had received prior warnings about the flooding. However, when asked about the potential benefits from an improved system that would give them several days of advance warning, on average households expected that it would reduce flood losses by 5.5% with a 3-day advance notice and by 6.3% with an 8-day advance notice. The study also estimated out-of-pocket and time costs for alternative protective actions and found that the cost-effectiveness of these measures varied widely, in some cases by more than an order of magnitude.
In a survey study of 453 mostly rural households in the Lower Karnali River Basin of Nepal, Rai et al. (2020) found high levels of protective action in response to a local flood warning system—96% of households indicated they were able to use the warning to save property in the last flood. The average reported value of items saved, including cash, jewelry, vehicles, and livestock, was the equivalent of $1,083/household. Although the study did not report these savings as a percentage of total potential damages, it did indicate that this amount was roughly equivalent to the average per capita annual income in the studied region. The survey also found that all households participated in annual mock drills related to the warning system; therefore, awareness and engagement with the warning system was particularly high in the study area.
Flood Risk Models
Prevented flood damages, particularly for structural flood mitigation approaches that can be triggered by flood warnings such as temporary barriers (e.g., sandbags or bladder dams) or water pumps, also can be estimated using hydraulic flood risk models (Nofal and van de Lindt 2021). However, my search identified only one study that has used this method specifically to estimate prevented damages attributable to FFEWS. Nofal et al. (2021) developed a hydrodynamic flood hazard model to represent a flood scenario across Santa Clara County, California, which they combined with a community model representing vulnerable structures across the study and depth–damage relationships to estimate expected damages under a baseline without-FFEWS scenario. They then reran the model under a range of scenarios accounting for different types and potential levels of protective actions in response to advance warnings, including elevating water-sensitive building components and installing flood barriers, and estimated the reduction in damages. The results from more than 100 mitigation simulations demonstrated millions of dollars in potentially prevented damages at the community level.
Benefit Transfer Studies
The literature search also identified seven studies that used benefit transfer methods to assess the benefits of FFEWS. In other words, they used, adapted, and combined existing benefit estimates from the literature to develop their own assessments of benefits. For example, in a study conducted for NOAA, Stallings (1997) estimated the nationwide economic benefits of NWS hydrologic forecasts. To estimate the benefits of flood avoidance actions taken by communities, the analysis assumed that advance warnings reduce total flood damages by 10%, based a range of findings from studies conducted between 1939 and 1976. The report estimated that, over the 20-year period from 1976 to 1996, total annual benefits of flood forecasts in the US averaged $1.39 billion/year. In 2002, the National Hydrologic Warning Council (NWHC 2002) released a report updating the finding of the Stallings report. It estimated that the benefits of flood forecasts in the US from 1981 to 2000 averaged $1.6 billion/year.
To demonstrate how the UK’s FHRC model could be adapted to estimate the benefits of flood warnings in other parts of Europe, Tapsell et al. (2008) conducted a case study analysis of flooding in Grimma, Germany in 2002. Applying estimates derived from several sources, including survey-based evidence from Thieken et al. (2007) and Steinfuhrer and Kuhlicke (2007), Tapsell et al. estimated that 58% of households received flood warnings and 31% were able to respond effectively with protective actions. Overall, they estimated that residential damages avoided due to flood warnings were the equivalent of roughly 6% of total potential residential damages.
Priest et al. (2011) proposed an expanded modeling framework for assessing the potential benefits of flood warning systems in Europe. This framework—the Flood Warning Response and Benefit Pathways (FWRBP) model—includes both structural (e.g., flood gate systems) and nonstructural (e.g., evacuation of belongings) methods for avoiding flood damages. They demonstrate the framework with case study examples in the UK and in Grimma, Germany, by transferring results from Parker et al. (2007b) and Thieken et al. (2007), among others, to estimate warning responses and damage reduction rates. They found that a combination of structural and nonstructural approaches would reduce flood damages by 23% in the UK example and by 73% in Grimma.
Pappenberger et al. (2015) also applied a modeling approach to estimate the potential monetary benefits of a European continental-scale flood warning system. To parameterize avoided flood damages in this model, they also used results from several previously described studies, such as Parker (1991) and Parker et al. (2007b). Like Priest et al. (2011), they did not include estimates of the costs of protective actions in their analysis; however, unlike the other studies described in this section, they did explicitly account for forecast uncertainty by including estimates of hit and false alarm rates. Using this model, they estimated a benefit–cost ratio of roughly 400:1 for a continental-scale forecast system.
On a smaller geographic scale, Dale et al. (2014) and Johnson et al. (2020) also used benefit transfer to estimate the value of protective actions in England and in the San Francisco Bay area, respectively. Dale et al. presented a risk-based decision support framework for using probabilistic flood forecasts, which they demonstrated with the example of a flood barrier on the River Severn and by transferring existing estimates of avoided flood damages and barrier costs. Johnson et al. used evidence from Day (1970) and Carsell et al. (2004) to estimate avoided flood damages and related benefits from flood warnings that are informed by an advanced quantitative precipitation information (AQPI) system being developed for the San Francisco Bay area.
Finally, Rose et al. (2023) developed and applied a cost–benefit analysis framework to evaluate the net benefits of deploying low-cost flood inundation sensors as early warning systems across the US. To capture the relationship between warning time and damage reductions they used results from previously described studies, including Day (1970) and Carsell et al. (2004). Using these benefit estimates, they found benefit–cost ratios ranging from 1 to 1.4 for the proposed sensor systems.
This collection of benefit transfer studies demonstrates how results from existing studies of specific flood locations or events can and have been used to assess the benefits of FFEWS on a larger scale and for future investments in flood management. However, they also underscore the limitations of the existing research, which often relied on a relatively small number of studies, many of which are decades old.
Conclusion
As flood risks persist and are likely to increase in the US and around the world due to the combined effects of climate change, population growth, and economic development, forecast and warning systems have a potentially pivotal role to play in mitigating these risks by helping communities to protect themselves, avoid flood damages, and adapt to climate change. However, adequately evaluating these systems and measuring the expected returns from investing in them requires conceptual models and supporting empirical research into the economic benefits of flood forecast and warning information.
In this paper, I argue that a conceptual model based on VOI analysis provides a holistic framework for assessing these benefits. By connecting four main modeling components—forecast, decision, outcome, and valuation models—it shows how forecast value can be derived not only from avoiding flood losses but also in some cases from avoiding unnecessary flood protection costs. To value imperfect forecasts, which reduce but do not eliminate flood risk uncertainty, it also underscores that the benefits of resulting changes in protective actions must be weighed against their costs.
After describing the framework, I applied it to systematically review, summarize, and evaluate the existing research literature on the economic value of FFEWS. Based on a systematic search and screening of the current literature, this review focused on 66 studies published between 1970 and 2023.
Several key findings emerged from this review. First, despite its advantages in providing a holistic framework for valuing forecast information, relatively few studies have applied a VOI approach to assess the benefits of flood forecasts or warning systems. Moreover, of the 11 identified studies that did use a deductive VOI approach, most (6) only estimated information value in relative terms (i.e., as REV), rather than providing absolute estimates of forecast benefits. This paucity of VOI studies is at least in part due to the challenges of incorporating all four components of the VOI framework, in particular outcome models that include empirical estimates of flood damages and protective action costs.
Second, a comparatively large number of studies evaluated the benefits of FFEWS by analyzing how effective they are in prompting protective actions, especially for household and businesses, and in preventing flood damages. For example, I identified 32 studies that used expert assessments or survey data to quantify these benefits. In contrast to the VOI analyses, few of these studies estimated the costs of protective actions or accounted for the effects of forecast errors (i.e., false alarms or misses) on decisions and outcomes.
Third, despite these research efforts, evidence regarding the magnitude of avoided flood damages due to advance warnings remains limited. Although several survey-based studies collected information on flood-related behaviors and damages, and many found high rates of protective actions by households and businesses in advance of flooding, relatively few studies provided monetized estimates of prevented damages. For example, in Germany, despite multiple rounds of survey data collection and analysis following flood events since 2002, surprisingly little evidence [other than from Kriebich et al. (2007) for flood-affected businesses] has emerged linking flood warnings to reduced damages. However, this lack of evidence may have more to do with the challenges of identifying cause-and-effect relationships between warnings and damages than with an absence of actual prevented damages.
Fourth, evidence regarding the benefits of forecast and warning systems is particularly lacking for the US. Only one of the VOI studies, a SP study estimating farmers’ WTP for improved flood forecasts (Lim et al. 2022), and none of the deductive VOI studies was conducted in the US. No survey-based studies analyzing protective actions by households or businesses in the US were found. As a result, most of the US-based evidence is from older studies relying on expert judgment (Day 1970; Day and Lee 1976; Carroll 1986; Carsell et al. 2004), many of which focused on potential rather than actual avoided damages.
These findings highlight the need for additional data and evidence regarding the effectiveness and impacts of flood forecasts and warnings, particularly in the US. The comparatively extensive research efforts that have been conducted, for example, in the UK and Germany could provide important examples and lessons for similar future effort in the US. More surveys of flood-affected households, businesses, and communities, certainly would help to address this research gap especially if, guided by the VOI framework, they collect information on both the costs and prevented damages from protective actions and if they explore how forecast uncertainties (i.e., perceived probabilities of false alarms and misses) affect these behaviors.
Furthermore, a more reliable quantification of the damage-reducing effects of flood warnings may require the use of causal design research methods such as experiments, natural experiments (e.g., the failure of a warning system in one region for technical reasons) or other quasi-experimental designs (instrumental variables estimation, difference-in-difference methods, or propensity score methods). These rigorous approaches could help ensure that the estimated effects of warnings are truly explained by the warning system and not obscured by other factors related to receipt of a warning and to the flood damage outcomes of interest.
Finally, although the avoidance of flood-related fatalities and injuries is a key objective of any FFEWS, the literature search failed to identify any studies that quantified these types of impacts. This suggests a need for research investigating the links between flood forecast information, protective actions such as evacuations and road closures, and human safety outcomes.
Supplemental Materials
File (supplemental materials_nhrefo.nheng-2094_houtven.pdf)
- Download
- 239.98 KB
Data Availability Statement
Some or all data, models, or code that support the findings of this study are available from the corresponding author upon reasonable request, including a list of all the studies that were identified and reviewed as potential candidates for the review but that did not meet the criteria for inclusion in the review.
Acknowledgments
Funding for this project was provided by the National Oceanic and Atmospheric Administration (NOAA), awarded to the Cooperative Institute for Research on Hydrology (CIROH) through the NOAA Cooperative Agreement with The University of Alabama, NA22NWS4320003.
References
Abaza, M., F. Anctil, V. Fortin, and R. Turcotte. 2013. “A comparison of the Canadian global and regional meteorological ensemble prediction systems for short-term hydrological forecasting.” Mon. Weather Rev. 141 (10): 3462–3476. https://doi.org/10.1175/MWR-D-12-00206.1.
Alfonso, L., M. M. Mukolwe, and G. Di Baldassarre. 2016. “Probabilistic flood maps to support decision-making: Mapping the value of information.” Water Resour. Res. 52 (2): 1026–1043. https://doi.org/10.1002/2015WR017378.
Arias, J. K. B., R. A. Dorado, M. E. T. Mendoza, and V. G. Ballaran. 2015. “Exploring the potentials of a technology-based flood early warning system in Laguna, Philippines: A cost-benefit analysis.” In Cost-benefit studies of natural resource management in Southeast Asia, 369–387. Singapore: Springer.
Arnal, L., M. H. Ramos, E. Coughlan de Perez, H. L. Cloke, E. Stephens, F. Wetterhall, S. J. van Andel, and F. Pappenberger. 2016. “Willingness-to-pay for a probabilistic flood forecast: A risk-based decision-making game.” Hydrol. Earth Syst. Sci. 20 (8): 3109–3128. https://doi.org/10.5194/hess-20-3109-2016.
Boucher, M. A., D. Tremblay, L. Delorme, L. Perreault, and F. Anctil. 2012. “Hydro-economic assessment of hydrological forecasting systems.” J. Hydrol. 416 (Apr): 133–144. https://doi.org/10.1016/j.jhydrol.2011.11.042.
Buizza, R. 2008. “The value of probabilistic prediction.” Atmos. Sci. Lett. 9 (2): 36–42. https://doi.org/10.1002/asl.170.
Carroll, T. R. 1986. “Cost-benefit analysis of airborne gamma radiation snow water equivalent data used in snowmelt flood forecasting.” In Proc., Western Snow Conf., 1–11. Minneapolis: Office of Hydrology, National Weather Service.
Carsell, K. M., N. D. Pingel, and D. T. Ford. 2004. “Quantifying the benefit of a flood warning system.” Nat. Hazard. Rev. 5 (3): 131–140. https://doi.org/10.1061/(ASCE)1527-6988(2004)5:3(131).
Chatterton, J. B., J. Pirt, and T. R. Wood. 1979. “The benefits of flood forecasting.” J. Inst. Water Eng. Sci. 33 (3): 237–252.
Dale, M., J. Wicks, K. Mylne, F. Pappenberger, S. Laeger, and S. Taylor. 2014. “Probabilistic flood forecasting and decision-making: An innovative risk-based approach.” Nat. Hazards 70 (1): 159–172. https://doi.org/10.1007/s11069-012-0483-z.
Day, H. J. 1970. Flood warning benefit evaluation-Susquehanna River Basin (urban residences). Silver Spring, MD: Weather Bureau, Office of Hydrology.
Day, H. J., and K. K. Lee. 1976. “Flood damage reduction potential of river forecast.” J. Water Resour. Plann. Manage. Div. 102 (1): 77–87. https://doi.org/10.1061/JWRDDC.0000012.
Elmer, F., A. H. Thieken, I. Pech, and H. Kreibich. 2010. “Influence of flood frequency on residential building losses.” Nat. Hazards Earth Syst. Sci. 10 (10): 2145–2159. https://doi.org/10.5194/nhess-10-2145-2010.
Fenwick, E., L. Steuten, S. Knies, S. Ghabri, A. Basu, J. F. Murray, H. E. Koffijberg, M. Strong, G. D. Sanders Schmidler, and C. Rothery. 2020. “Value of information analysis for research decisions—An introduction: Report 1 of the ISPOR value of information analysis emerging good practices task force.” Value Health 23 (2): 139–150. https://doi.org/10.1016/j.jval.2020.01.001.
Hallegatte, S. 2012. A cost effective solution to reduce disaster losses in developing countries: Hydro-meteorological services, early warning, and evacuation. Washington, DC: World Bank.
Hirshleifer, J., and J. G. Riley. 1992. The analytics of uncertainty and information. New York: Cambridge University Press.
Holland, P. 2008. Fiji technical report—An economic analysis of flood warning in Navua. Suva, Fiji: Pacific Islands Applied Geoscience Commission.
Howard, R. A. 1968. “The foundations of decision analysis. IEEE transactions on systems science and cybernetics.” EEE Trans. Syst. Cybern. Syst. 4 (3): 211–219.
Jakus, P. M., and C. G. Leggett. 2005. The value of information provided by fish consumption advisories. Logan, UT: Utah State Univ.
Johnson, L. E., R. Cifelli, and A. White. 2020. “Benefits of an advanced quantitative precipitation information system.” J. Flood Risk Manage. 13 (Apr): e12573. https://doi.org/10.1111/jfr3.12573.
Johnston, R. J., et al. 2017. “Contemporary guidance for stated preference studies.” J. Assoc. Environ. Resour. Econ. 4 (2): 319–405. https://doi.org/10.1086/691697.
Johnston, R. J., J. Rolfe, and E. Zawojska. 2018. “Benefit transfer of environmental and resource values: Progress, prospects and challenges.” Int. Rev. Environ. Resour. Econ. 12 (2–3): 177–266. https://doi.org/10.1561/101.00000102.
Kienzler, S., I. Pech, H. Kreibich, M. Müller, and A. H. Thieken. 2015. “After the extreme flood in 2002: Changes in preparedness, response and recovery of flood-affected residents in Germany between 2005 and 2011.” Nat. Hazards Earth Syst. Sci. 15 (3): 505–526. https://doi.org/10.5194/nhess-15-505-2015.
Koski, V., N. Kotamäki, H. Hämäläinen, K. Meissner, J. Karvanen, and S. Kärkkäinen. 2020. “The value of perfect and imperfect information in lake monitoring and management.” Sci. Total Environ. 726 (Jun): 138396. https://doi.org/10.1016/j.scitotenv.2020.138396.
Kreibich, H., M. Müller, K. Schröter, and A. H. Thieken. 2017. “New insights into flood warning reception and emergency response by affected parties.” Nat. Hazards Earth Syst. Sci. 17 (12): 2075–2092. https://doi.org/10.5194/nhess-17-2075-2017.
Kreibich, H., M. Müller, A. H. Thieken, and B. Merz. 2007. “Flood precaution of companies and their ability to cope with the flood in August 2002 in Saxony, Germany.” Water Resour. Res. 43 (3): W03408. https://doi.org/10.1029/2005WR004691.
Kreibich, H., I. Seifert, A. H. Thieken, E. Lindquist, K. Wagner, and B. Merz. 2011. “Recent changes in flood preparedness of private households and businesses in Germany.” Reg. Environ. Change 11 (1): 59–71. https://doi.org/10.1007/s10113-010-0119-3.
Kreibich, H., A. H. Thieken, T. Petrow, M. Müller, and B. Merz. 2005. “Flood loss reduction of private households due to building precautionary measures–lessons learned from the Elbe flood in August 2002.” Nat. Hazards Earth Syst. Sci. 5 (1): 117–126. https://doi.org/10.5194/nhess-5-117-2005.
Krieger, D. J., and J. P. Hoehn. 1999. “The economic value of reducing environmental health risks: Contingent valuation estimates of the value of information.” J. Environ. Manage. 56 (1): 25–34. https://doi.org/10.1006/jema.1999.0263.
Kruse, J. B., J. Crompvoets, and F. Pearlman. 2017. GEOValue: The socioeconomic value of geospatial information. Boca Raton, FL: CRC Press.
Lazo, J. K., D. M. Waldman, B. H. Morrow, and J. A. Thacher. 2010. “Household evacuation decision making and the benefits of improved hurricane forecasting: Developing a framework for assessment.” Weather Forecasting 25 (1): 207–219. https://doi.org/10.1175/2009WAF2222310.1.
Leggett, C. G. 2002. “Environmental valuation with imperfect information the case of the random utility model.” Environ. Resour. Econ. 23 (3): 343–355. https://doi.org/10.1023/A:1021289010879.
Lim, S. H., Y. Ge, J. M. Jacobs, and X. Jia. 2022. “Measuring the economic benefits of advanced technology use for river flood forecasting.” J. Flood Risk Manage. 15 (2): e12781. https://doi.org/10.1111/jfr3.12781.
Matte, S., M. A. Boucher, V. Boucher, and T. C. Fortier Filion. 2017. “Moving beyond the cost–loss ratio: Economic assessment of streamflow forecasts for a risk-averse decision maker.” Hydrol. Earth Syst. Sci. 21 (6): 2967–2986. https://doi.org/10.5194/hess-21-2967-2017.
McBean, E. A., J. Gorrie, M. Fortin, J. Ding, and R. Monlton. 1988. “Adjustment factors for flood damage curves.” J. Water Resour. Plann. Manage. 114 (6): 635–646. https://doi.org/10.1061/(ASCE)0733-9496(1988)114:6(635).
McCall, J. J. 1982. “Introduction to ‘The economics of information and uncertainty’.” In The economics of information and uncertainty, 11. Chicago: University of Chicago Press.
Merz, B., H. Kreibich, and U. Lall. 2013. “Multi-variate flood damage assessment: A tree-based data-mining approach.” Nat. Hazards Earth Syst. Sci. 13 (1): 53–64. https://doi.org/10.5194/nhess-13-53-2013.
Mohor, G. S., P. Hudson, and A. H. Thieken. 2020. “A comparison of factors driving flood losses in households affected by different flood types.” Water Resour. Res. 56 (4): e2019WR025943. https://doi.org/10.1029/2019WR025943.
Muluye, G. Y. 2011. “Implications of medium-range numerical weather model output in hydrologic applications: Assessment of skill and economic value.” J. Hydrol. 400 (3–4): 448–464. https://doi.org/10.1016/j.jhydrol.2011.01.056.
Nofal, O. M., and J. W. van de Lindt. 2021. “High-resolution flood risk approach to quantify the impact of policy change on flood losses at community-level.” Int. J. Disaster Risk Reduct. 62 (Aug): 102429. https://doi.org/10.1016/j.ijdrr.2021.102429.
Nofal, O. M., J. W. van de Lindt, H. Cutler, M. Shields, and K. Crofton. 2021. “Modeling the impact of building-level flood mitigation measures made possible by early flood warnings on community-level flood loss reduction.” Buildings 11 (10): 475. https://doi.org/10.3390/buildings11100475.
NWHC (National Hydrologic Warning Council). 2002. Use and benefits of the national weather service river and flood forecasts. Denver: NWHC.
Oddo, P. C., and J. D. Bolten. 2019. “The value of near real-time Earth observations for improved flood disaster response.” Front. Environ. Sci. 7 (Feb): 127. https://doi.org/10.3389/fenvs.2019.00127.
Pappenberger, F., H. L. Cloke, D. J. Parker, F. Wetterhall, D. S. Richardson, and J. Thielen. 2015. “The monetary benefit of early flood warnings in Europe.” Environ. Sci. Policy 51 (Sep): 278–291. https://doi.org/10.1016/j.envsci.2015.04.016.
Parker, D., S. Tapsell, and S. McCarthy. 2007a. “Enhancing the human benefits of flood warnings.” Nat. Hazards 43 (3): 397–414. https://doi.org/10.1007/s11069-007-9137-y.
Parker, D., and S. Tunstall. 2007. “Damage reducing effects of flood warnings.” In Evaluating flood damages: Guidance and recommendations on principles and methods, edited by F. Messner, E. Penning-Rowsell, C. Colin Green, V. Meyer, S. Tunstall, and A. van der Veen. Oxfordshire, UK: FLOODsite Project.
Parker, D., S. Tunstall, and T. Wilson. 2005. “Socio-economic benefits of flood forecasting and warning.” In Vol. 17 of Proc., Int. Conf. on Innovation Advances and Implementation of Flood Forecasting Technology. Tromso, Norway: Achieving Technological Innovation in Flood Forecasting.
Parker, D. J. 1991. The damage-reducing effects of flood warnings. London: Middlesex Univ.
Parker, D. J., S. J. Priest, A. Schildt, and J. W. Handmer. 2009a. Developing models to estimate the benefits from flood warnings. Oxfordshire, UK: FLOODsite.
Parker, D. J., S. J. Priest, and S. M. Tapsell. 2009b. “Understanding and enhancing the public’s behavioural response to flood warning information.” Meteorol. Appl. 16 (1): 103–114. https://doi.org/10.1002/met.119.
Parker, D. J., S. M. Tunstall, and S. McCarthy. 2007b. “New insights into the benefits of flood warnings: Results from a household survey in England and Wales.” Environ. Hazards 7 (3): 193–210. https://doi.org/10.1016/j.envhaz.2007.08.005.
Penning-Rowsell, E., C. Johnson, S. Tunstall, S. Tapsell, J. Morris, J. Chatterton, and C. Green. 2005. The benefits of flood and coasal risk management: A manual of assessment techniques (the multicoloured manual). Enfield, London: Flood Hazard Research Centre.
Penning-Rowsell, E. C., and C. Green. 2000. “New Insights into the appraisal of flood-alleviation benefits:(1) flood damage and flood loss information.” Water Environ. J. 14 (5): 347–353. https://doi.org/10.1111/j.1747-6593.2000.tb00272.x.
Perera, D., et al. 2019. Flood early warning systems: A review of benefits, challenges and prospects. Hamilton, ON, Canada: United Nations Univ. Institute for Water, Environment and Health.
Priest, S. J., D. J. Parker, and S. M. Tapsell. 2011. “Modelling the potential damage-reducing benefits of flood warnings using European cases.” Environ. Hazards 10 (2): 101–120. https://doi.org/10.1080/17477891.2011.579335.
Rai, R. K., M. J. van den Homberg, G. P. Ghimire, and C. McQuistan. 2020. “Cost-benefit analysis of flood early warning system in the Karnali River Basin of Nepal.” Int. J. Disaster Risk Reduct. 47 (Jul): 101534. https://doi.org/10.1016/j.ijdrr.2020.101534.
Raiffa, H., and R. Schlaifer. 1961. Applied statistical decision theory. New York: Wiley.
Richardson, D. S. 2000. “Skill and relative economic value of the ECMWF ensemble prediction system.” Q. J. R. Meteorolog. Soc. 126 (563): 649–667.
Rose, A., D. Wei, J. Machado, and K. Spencer. 2023. “Benefit–cost analysis of low-cost flood inundation sensors.” Nat. Hazard. Rev. 24 (1): 05022011. https://doi.org/10.1061/(ASCE)NH.1527-6996.0000596.
Roulin, E. 2007. “Skill and relative economic value of medium-range hydrological ensemble predictions.” Hydrol. Earth Syst. Sci. 11 (2): 725–737. https://doi.org/10.5194/hess-11-725-2007.
Rözer, V., M. Müller, P. Bubeck, S. Kienzler, A. Thieken, I. Pech, K. Schröter, O. Buchholz, and H. Kreibich. 2016. “Coping with pluvial floods by private households.” Water 8 (7): 304. https://doi.org/10.3390/w8070304.
RTI (Research Triangle Institute) International. 2018. Valuing the impact of flood early warning in Bangladesh. Research Triangle Park, NC: RTI International.
Schröter, K., H. Kreibich, K. Vogel, C. Riggelsen, F. Scherbaum, and B. Merz. 2014. “How useful are complex flood damage models?” Water Resour. Res. 50 (4): 3378–3395. https://doi.org/10.1002/2013WR014396.
Schröter, K., C. Velasco, H. P. Nachtnebel, H. Bianca, M. Beyene, C. Rubin, and M. Gocht. 2008. Effectiveness and efficiency of early warning systems for flash-floods (EWASE). London: Crue Funding Initiative on Flood Risk Management Research.
Shrader, J. G., L. Bakkensen, and D. Lemoine. 2023. Fatal errors: The mortality value of accurate weather forecasts. Cambridge, MA: National Bureau of Economic Research.
Smith, D. I. 1981. “Actual and potential flood damage: A case study for urban Lismore, NSW, Australia.” Appl. Geogr. 1 (1): 31–39. https://doi.org/10.1016/0143-6228(81)90004-7.
Stallings, E. A. 1997. The benefits of hydrologic forecasting. Silver Spring, MD: National Oceanic and Atmospheric Administration.
Steinfuhrer, A., and C. Kuhlicke. 2007. Social vulnerability and the 2002 flood. Country Report Germany (Mulde River). Oxfordshire, UK: FLOODsite.
Suckall, N., and M. B. Soares. 2022. “Evaluating the benefits of weather and climate services in South Asia: A systematic review.” Reg. Environ. Change 22 (3): 104. https://doi.org/10.1007/s10113-022-01947-7.
Tapsell, S., et al. 2008. Socio-economic and ecological evaluation and modelling methodologies. Oxfordshire, UK: FLOODsite.
Thiboult, A., F. Anctil, and M. H. Ramos. 2017. “How does the quantification of uncertainties affect the quality and value of flood early warning systems?” J. Hydrol. 551 (Sep): 365–373. https://doi.org/10.1016/j.jhydrol.2017.05.014.
Thieken, A. H., H. Kreibich, M. Müller, and B. Merz. 2007. “Coping with floods: Preparedness, response and recovery of flood-affected residents in Germany in 2002.” Hydrol. Sci. J. 52 (5): 1016–1037. https://doi.org/10.1623/hysj.52.5.1016.
Thieken, A. H., M. Müller, H. Kreibich, and B. Merz. 2005. “Flood damage and influencing factors: New insights from the August 2002 flood in Germany.” Water Resour. Res. 41 (12): W12430. https://doi.org/10.1029/2005WR004177.
Torterotot, J. P., L. A. Kauark-Leite, and P. A. Roche. 1992. “Analysis of individual real-time responses to flooding and influence on damage to households.” In Floods and flood management, edited by A. J. Saul, 363–387. Berlin: Springer.
Tunstall, S., S. Tapsell, and A. Fernandez-Bilbao. 2006. Objective 13: The damage reducing effects of flood warnings: Results from new data collection. London: Joint Defra/Environment Agency Flood and Coastal Erosion Risk Management R&D Programme.
Van den Bergh, J., and E. Roulin. 2010. “Hydrological ensemble prediction and verification for the Meuse and Scheldt basins.” Atmos. Sci. Lett. 11 (2): 64–71. https://doi.org/10.1002/asl.250.
Verkade, J. S., and M. G. F. Werner. 2011. “Estimating the benefits of single value and probability forecasting for flood warning.” Hydrol. Earth Syst. Sci. 15 (12): 3751–3765. https://doi.org/10.5194/hess-15-3751-2011.
Vogel, K., L. Weise, K. Schröter, and A. H. Thieken. 2018. “Identifying driving factors in flood-damaging processes using graphical models.” Water Resour. Res. 54 (11): 8864–8889. https://doi.org/10.1029/2018WR022858.
Walser, A., and M. W. Rotach. 2006. “The benefit of a limited-area ensemble prediction system with respect to flood forecasting.” In Proc., CHR Workshop ‘Ensemble Prediction and uncertainties in flood forecasting’, 31–36. Utrecht, Netherlands: International Commission for the Hydrology of the Rhine Basin.
Wandishin, M. S., and H. E. Brooks. 2002. “On the relationship between Clayton’s skill score and expected value for forecasts of binary events.” Meteorol. Appl. 9 (4): 455–459. https://doi.org/10.1017/S1350482702004085.
Wilson, E. C. F. 2015. “A practical guide to value of information analysis.” Pharmacoeconomics 33 (2): 105–121. https://doi.org/10.1007/s40273-014-0219-x.
Wind, H. G., T. M. Nierop, C. J. de Blois, and J. L. de Kok. 1999. “Analysis of flood damages from the 1993 and 1995 Meuse floods.” Water Resour. Res. 35 (11): 3459–3465. https://doi.org/10.1029/1999WR900192.
Wing, O. E., P. D. Bates, A. M. Smith, C. C. Sampson, K. A. Johnson, J. Fargione, and P. Morefield. 2018. “Estimates of present and future flood risk in the conterminous United States.” Environ. Res. Lett. 13 (3): 034023. https://doi.org/10.1088/1748-9326/aaac65.
Yoe, C. 1994. Framework for estimating national economic development benefits and other beneficial effects of flood warning and preparedness systems. Alexandria, VA: Army Engineer Institute for Water Resources.
Young, R. A., and J. B. Loomis. 2014. Determining the economic value of water: Concepts and methods. New York: Routledge.
Zhu, Y., Z. Toth, R. Wobus, D. Richardson, and K. Mylne. 2002. “The economic value of ensemble-based weather forecasts.” Bull. Am. Meteorol. Soc. 83 (1): 73–83. https://doi.org/10.1175/1520-0477(2002)083%3C0073:TEVOEB%3E2.3.CO;2.
Information & Authors
Information
Published In

Natural Hazards Review
Volume 25 • Issue 4 • November 2024
Copyright
This work is made available under the terms of the Creative Commons Attribution 4.0 International license, https://creativecommons.org/licenses/by/4.0/.
History
Published online: Aug 12, 2024
Published in print: Nov 1, 2024
Discussion open until: Jan 12, 2025
ASCE Technical Topics:
- Business management
- Climate change
- Climates
- Disaster preparedness
- Disaster risk management
- Disaster warning systems
- Disasters and hazards
- Economic factors
- Engineering fundamentals
- Environmental engineering
- Floods
- Forecasting
- Mathematics
- Mitigation and remediation
- Natural disasters
- Population projection
- Practice and Profession
- Statistics
- Sustainable development
- Water and water resources
Authors
Metrics & Citations
Metrics
Citations
Download citation
If you have the appropriate software installed, you can download article citation data to the citation manager of your choice. Simply select your manager software from the list below and click Download.