Modeling Disaster Habitation for Improved Mitigation Project Analysis
Abstract
Natural disasters devastate communities by damaging built infrastructure systems that support residential habitation, forcing people to evacuate from their homes, find alternative housing, and eventually rehabitate. Disaster mitigation projects can reduce damage to built infrastructure and community recovery time. Most mitigation projects are analyzed using monetary measures, thereby not fully accounting for benefits due to other factors, such as residential habitation, which are difficult to quantify and model. A recent US Army Corps of Engineers policy requires the inclusion of nonmonetary impacts in mitigation project analyses. However, rigorous modeling and quantification methods of nonmonetary impacts are needed. This paper describes such a modeling approach and the Disaster Habitation Model (DHM) for rigorously modeling and quantifying the habitation impacts of disaster mitigation projects for project analysis and selection. The DHM combines the impacts of critical internal infrastructure systems in a community to simulate habitation over a community’s disaster experience. The approach and model are illustrated using the Halls Bayou watershed in Houston, Texas. Results estimate the habitation benefits of a proposed mitigation program and thereby provide a basis for including other social effects of projects in mitigation project analyses. The approach and method are found to be capable of realistically portraying disaster habitation behavior and are useful in quantifying improvements due to mitigation efforts. Application across different disaster types, mitigation efforts, limitations, and future development opportunities are discussed.
Introduction
Natural disasters such as floods and wildfires lead to population displacements, as people evacuate to avoid harm and seek alternative shelter to their damaged dwellings and supporting critical infrastructure systems. Displaced community residents often pass through different housing phases: emergency sheltering, temporary sheltering, temporary housing, and permanent housing (Quarantelli 1982). In the immediate aftermath of a disaster, these residents are forced to seek emergency shelters in schools, churches, stadiums, etc. Following the peak of the disaster or emergency period, the population moves to temporary shelters. Temporary sheltering involves living outside one’s quarters, including staying with families and friends, mass shelters organized by charity bodies, and squatting in abandoned buildings and tents. Temporary housing involves re-establishing household routines in temporary quarters such as trailers and refitted shipping containers. Temporary housing may also include apartments or lodgings procured with assistance from a government body or nongovernment organization (NGO) or living in a damaged and not fully functional primary residence while it is repaired, with the understanding that these arrangements are for a limited period. Permanent housing involves re-establishing a predisaster household routine in permanent quarters such as homes and apartments.
Complete community recovery requires protecting and restoring physical, cultural, and social conditions to near pre-event conditions or better. Many community functions occur or depend heavily on resident activities in their homes. Therefore, returning populations to permanent and fully functioning housing is a critical part of disaster recovery and a goal of many government-assisted disaster recovery processes (Arlikatti et al. 2015; Brown et al. 2008). This is because the habitation of fully functional residences benefits individuals, families, and the community by helping return the population to normal daily activities and pre-event conditions. The current work describes a rigorous approach to modeling disaster habitation that improves mitigation project analysis and selection. A case study is used to illustrate the method and model and as the basis for discussing its applicability.
Background
In the United States, the Army Corps of Engineers (USACE) is the primary developer of disaster mitigation projects. The USACE bases project evaluation on benefit–cost analyses (BCA). A BCA compares a project’s benefits to its costs using a benefit cost ratio (BCR) to estimate its economic efficiency (Mechler 2016). A BCR greater than 1.0 indicates that the project provides more benefits than it incurs in costs and vice versa. A BCA is a systematic way to measure economic efficiency with simple and easily defensible results. However, society values many factors other than economic efficiency. Current BCA processes primarily focus on avoided physical damages and emergency costs (GAO 2019). But the effects of disasters are more extensive than these initial physical damages. For example, inadequate housing can adversely impact a community’s economy and recovery by constraining its workforce. Mitigation project analysis should consider the social implications for the community, the impacts on built infrastructure, and the direct economic impacts. Habitation, residents living in their homes, is an important social behavior that BCA does not capture.
Benefits of increased habitation that are not typically captured in traditional disaster mitigation planning and analyses include the following:
•
Larger available workforces for businesses, public works, education, and charitable and other nonprofit organizations (Watson et al. 2020; McWhirter 2022).
•
Retained community nongovernmental organizations (NGOs), houses of worship, and other community support and development operations through improved volunteer and participant availability.
•
Reduced displacement of residents (i.e., prevented evacuation) that reduces private disaster costs by eliminating the need for residents to use their limited resources to evacuate and relocate back into their homes (Nguyen et al. 2019).
•
Improved mental health of community residents by eliminating or reducing the risks and potential of evacuation, relocated residency, and rehabitation and by eliminating or reducing the psychological trauma and anxiety that those risks and events create, and by reducing the risk of health disorders associated with extended stays in temporary shelters (Van Griensven et al. 2006; Patel and Makarand 2013; Scurfield 2007).
•
Maintained demand for community enterprises that accelerate recovery (Watson et al. 2020).
•
Reduced loss of learning by students by keeping schools in operation and reduced pressure on school districts and teachers that host displaced students (Picou and Marshall 2007; DeVaney et al. 2009).
•
Decreased loss of trust by residents and businesses in governments and their ability to mitigate and manage natural disasters (Akbar and Aldrich 2017).
•
Maintained revenues for public organizations and public participation in governance, such as public meetings and elections (McWhirter 2022).
•
Reduced or eliminated need to shift the government and public’s focus and efforts from community operations, growth, and life to disaster management (e.g., opening and operating temporary shelters) and infrastructure restoration (Benson and Edward 2004; Chhibber and Laajaj 2008).
In response to the need for more inclusive project analysis, the USACE recently expanded the breadth of impacts to be included in project analyses beyond national economic impacts to include (1) regional economics; (2) other social effects; and (3) environments (USACE 2021). Most relevant, the “Other Social Effects” category includes “urban, rural, and community impacts; life, health, and safety factors; displacement; and long-term productivity.” Displacement and community impacts include the loss of residential habitation due to people being forced to evacuate their homes because a disaster has rendered those residences uninhabitable or incapable of fully supporting normal daily activities. Accordingly, mitigation project analysis should include the impacts of projects on community habitation.
Problem Description
Community recovery from natural disasters is a complex multidimensional challenge in which both social and built infrastructures influence habitation. Social systems play a critical role in community recovery. For example, Oliver-Smith (1990) identified governance and public health as “core elements” to the recovery and rehabitation of Yungay, Peru, after the 1970 earthquake–avalanche, and Davis (1972) and Oliver-Smith (1996) highlighted the importance of the Russian Orthodox Church to the reconstruction of Pacific Eskimo villages damaged during the 1964 earthquake. Recovery experiences also differ across social groups. Social sciences research has identified how social vulnerability impacts housing recovery through income, poverty, race and ethnicity, gender, age, housing tenure, status, education, religion, and political affiliation. For example, characteristics of financial resources such as the quantity and type of funds available to a household (FEMA assistance, SBA loan, personal savings, insurance, borrowing from friends or family) can predict housing recovery outcomes (Andrew et al. 2013; Sutley and Hamideh 2018). Income, race, and ethnicity contribute to access to important recovery resources, such as insurance, the main funding source for home repairs and construction in the US. Black and Hispanic households are more likely to report insufficient insurance settlements for reconstruction and repairs, as are poor and minority households (Bolin 1982; Bolin and Bolton 1986; Peacock and Girard 1997). In addition, major national insurance providers that are more likely to offer acceptable settlements have routinely neglected to underwrite insurance in neighborhoods with a high concentration of minorities, particularly black neighborhoods (Van Zandt et al. 2012). Low-income households are also less likely to qualify for federal reconstruction loan programs such as the Small Business Assistance (SBA) loans provided by FEMA in the aftermath of a disaster. The social aspects of communities, such as those described above, and other factors influence how people respond to and recover from the sudden changes in their built and social environments brought on by natural disasters.
Built infrastructures also play a critical role in community recovery from natural disasters by providing essential support for population and social system operations. Most social activities require built infrastructures to operate normally. Residences provide populations shelter from environmental and social threats. Utilities provide potable water, remove and treat wastes, and facilitate communication. Roadways and public transit allow large scale commerce, governance, and other functions. When natural disasters damage built infrastructure, the social functions they support are constrained. Therefore, many disaster mitigation projects focus on built infrastructure protection and restoration to reduce damage and speed recovery by returning built infrastructures, and thereby social infrastructures and activities to pre-event conditions or better as quickly as possible. Currently built infrastructure mitigation project analysis methodologies, such as benefit–cost analysis (BCA), do not fully capture noneconomic project impacts and benefits, such as habitation. This is partially due to the focus on impacts that can be easily monetized. Excluding habitation benefits reduces the effectiveness and thoroughness of project analyses and selection, thereby increasing the risk of selecting projects with fewer overall benefits to a community. For example, Pacheco (2021) investigated the analyses of flood mitigation projects in southern Harris County and northern Galveston County, Texas, that are intended to play a critical role in protecting the health and well-being of the residential parts of the community. Using traditional BCA, the analyses generated BCR far below the minimum required value of 1.0 for all but one (a very cheap but low-benefit) proposed project, partially due to the lack of benefits such as habitation. Including disaster-related habitation in project analysis can help improve project selection by including more benefits valued by society than can be captured with traditional BCA. This requires a rigorous method of mitigation project analysis.
Disaster impacts on habitation have been studied and modeled in different forms. For example, Koliou and van de Lindt (2020) developed building restoration functions for different types of disasters, and Mitsova et al. (2021) modeled the impacts of damaged residences, electric power supply, and public health on postdisaster household recovery. However, these studies focused on structural damage to residences and the impacts of physical infrastructure damage on residences independently. In contrast to investigating infrastructure impacts independently, multiple infrastructures are required for a fully functional residence. Therefore, effective mitigation project analysis requires modeling damages to multiple critical infrastructures that drive habitation. No models are known to simultaneously forecast the combined impacts of multiple critical infrastructure systems on disaster habitation for mitigation analysis. To partially overcome these challenges, the current work addresses the question, “How can disaster habitation be rigorously modeled to quantify benefits for inclusion in mitigation project analysis?”
Disaster Habitation Modeling Approach
Defining Disaster Habitation for Modeling Mitigation Project Benefits
Many of the benefits of habitation do not accrue if residents are not in a fully functioning permanent residence. For example, few people living in temporary shelters are likely to re-establish household routines, go to work daily, or shop (Quarantelli 1995). Disaster habitation benefits are more fully captured by people living in and using a fully functional residence. In the current work habitation requires a fully functional residence where residents can live and work as they would without a disaster event. Therefore, for a residence to be considered habitable, all necessary infrastructure services for conducting normal daily activities unhindered must be present. However, because brief service disruptions do not render a residence uninhabitable, as residents typically respond by waiting for services to be restored and do not evacuate, short infrastructure service disruptions are not considered to interrupt habitation. Therefore, herein, a residence is considered uninhabitable when supporting infrastructures for normal activities are unavailable for a sustained period, typically longer than a day, and habitable when those infrastructures are generally available.
Dynamic Nature of Disaster Habitation
Disaster habitation is inherently dynamic, primarily because many components of a disaster experience interact to impact habitation, including a community and its ability to restore infrastructures, a proposed mitigation project (or lack thereof), and a disaster event (actual or simulated). These, in combination, impact infrastructure and, thereby, habitation, causing them to evolve throughout a community’s recovery. In the current work, a specific combination of disaster experience components is referred to as a disaster scenario. This dynamic perspective is consistent with existing research [e.g., Masterson et al. (2014)]. Dynamic disaster behaviors are illustrated in the built infrastructure recoveries after the 2011 Great East Japan earthquake and the 1995 Great Hanshin-Awaji earthquake (Fig. 1). In Fig. 1, blue lines represent water system recovery, red lines represent gas system recovery, and green lines represent electric power system recovery, with solid lines representing the Great East Japan earthquake and dashed lines representing the Great Hanshin-Awaji Earthquake. Notice that some recovery starts are delayed, and recovery rates and times to full recovery vary but are characteristic of specific infrastructures, and the elongated “S” behavior mode (shape over time) is similar across infrastructures and scenarios.
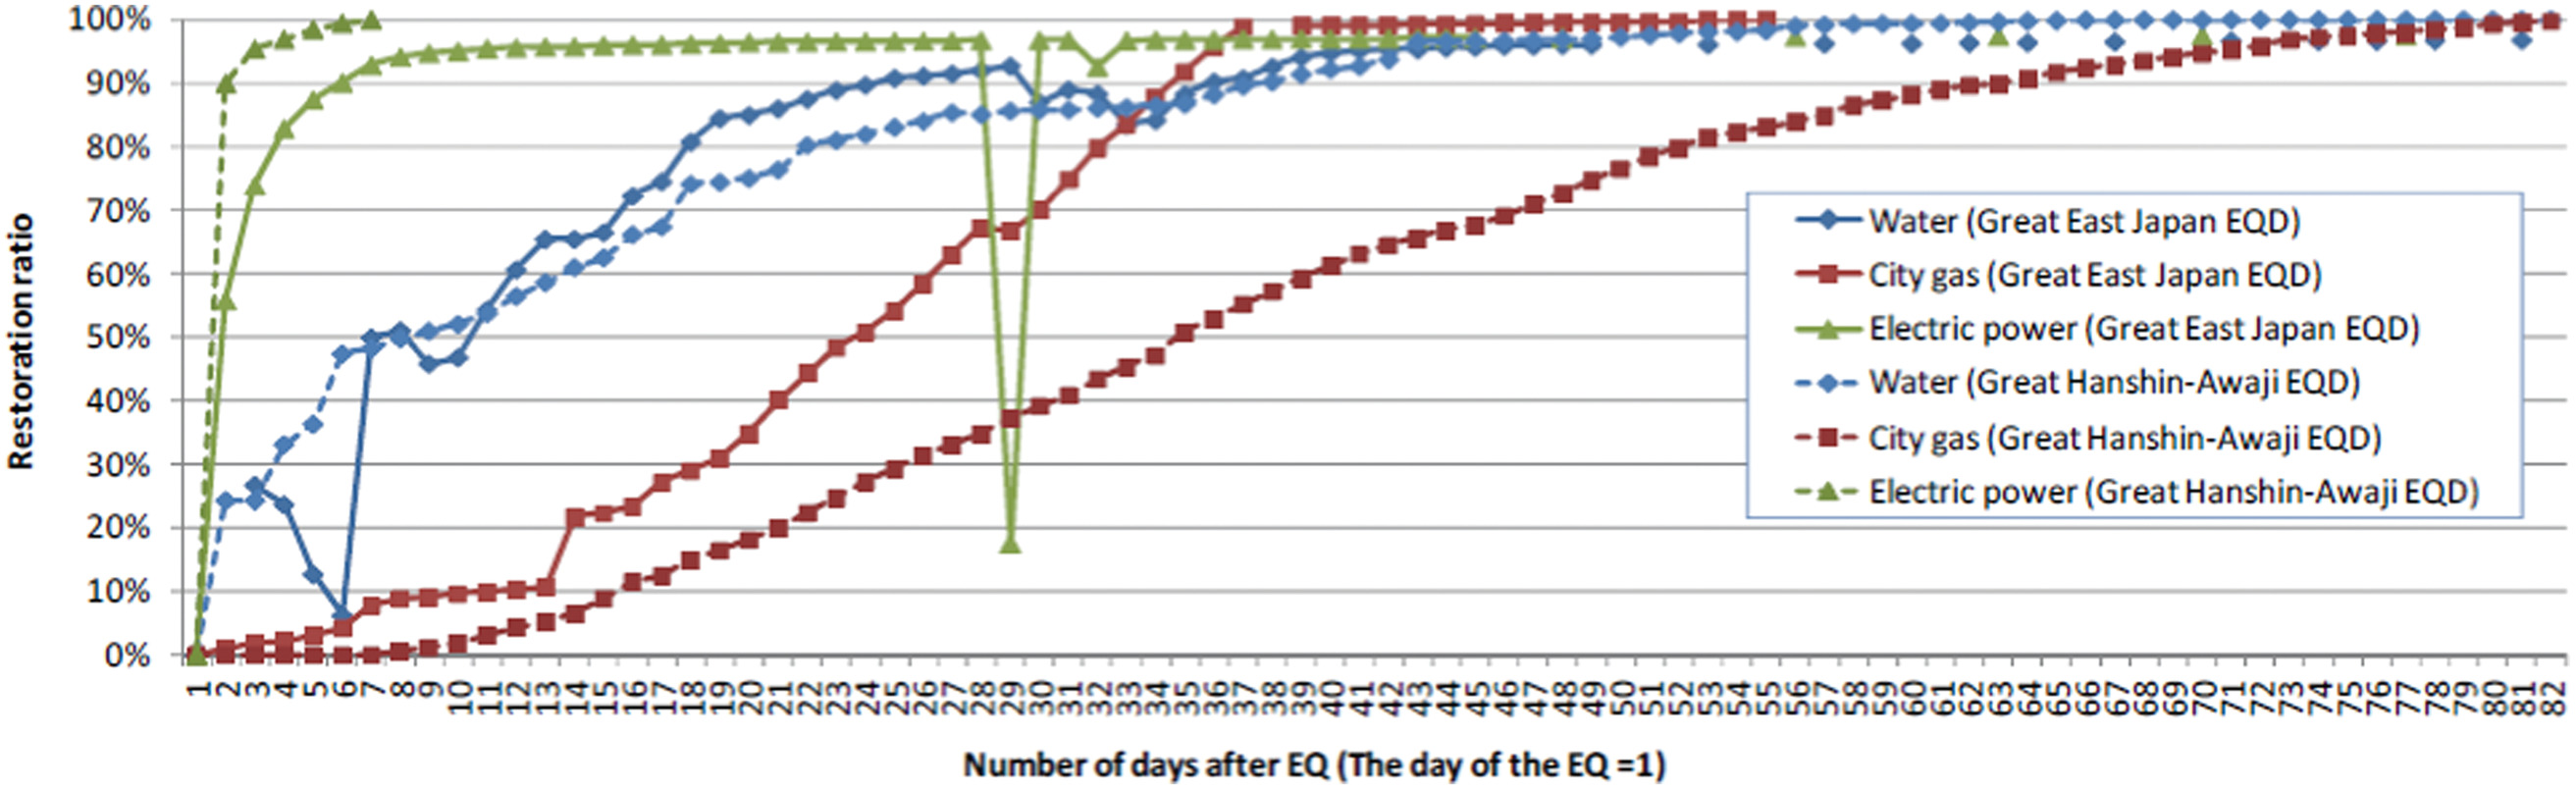
These disaster habitation behaviors over time are the basis for understanding and explaining habitation experiences and quantifying habitation benefits of mitigation projects. Non-disaster-related factors also impact community evolution during a disaster experience, such as endogenous growth or decay and ongoing development efforts. These are ignored here to reveal and focus on disaster impacts and recovery.
Three general approaches can be taken to influence the behavior of a dynamic system. First, preoperations planning, design, and construction can build systems that behave as desired when the system is subsequently operated. Second, operations management can design and implement policies to guide decisions and actions during the operation of existing systems to control dynamic behavior. Third, the design and construction and the operations management approaches can be combined. Without minimizing operational control of community recovery, the current work focuses on how system planning and design influences habitation after a natural disaster (the first approach). It specifically models how mitigation project analysis during design impacts community habitation dynamics. The resulting descriptions of dynamic habitation behaviors are used to quantify habitation for project analysis.
Critical Internal Infrastructure Systems for Habitation
Multiple built infrastructure systems are needed to provide the products and services required for habitation, but not all built infrastructures must be modeled to reflect their impacts on habitation. Shelters damaged by flooding and wind are perhaps the most visible impact to habitation of a built infrastructure due to natural disasters, but habitation also depends on other built infrastructures. For example, during Winter Storm Uri in Texas in early 2021, the electrical power supply to many residences was disrupted for days, leaving residents without heat and therefore rendering the residences uninhabitable (Donald 2021). Other infrastructures, such as drinking water, sanitary services, access and egress, and communication, are also necessary for the habitability and functionality of a residence. Some infrastructures have subsystems that experience disasters very differently than the primary system. For example, during Hurricane Harvey, the electrical power supply was disrupted as substations were flooded and power lines were downed (NERC 2018; Fischbach 2017). Although power generation had an external replacement, the supply subsystems could not function, leaving residences uninhabitable. In cases such as these, subsystems of critical infrastructure systems must be modeled separately from the primary system. Other infrastructures are not critical for habitation, such as recreational areas. A rigorous method for modeling disaster habitation must focus on individual critical community infrastructure systems and subsystems.
In most communities, some infrastructure products and services can continue to be provided after a natural disaster because they are generated outside the impacted area. Infrastructure systems that externally provide products and services to damaged communities do not prevent habitation, force evacuation, or prevent rehabitation, as they continue to perform adequately. In contrast, damaged infrastructures located within an impacted area without an external replacement may prevent habitation until they are restored. A rigorous method for modeling disaster habitation must focus on the community infrastructures that constrain the availability of functional residences. These critical internal infrastructure systems (CIIS) must be identified and modeled. The infrastructure systems critical to habitation can differ across communities, social groups, and geographical locations. Therefore, the CIIS can differ across communities. For example, in an urban metropolis, the availability of retail infrastructure is critical for habitation but may not require internal restoration because residents can shop in adjacent communities. On the other hand, retail commerce may be critical for a small rural community and only adequately restored for habitation after an internal restoration. Rigorous modeling requires attention to the specific CIIS of specific communities.
The current work models built infrastructures with their capacity available for providing products and services. By modeling capacity (versus physical damage or cost, for example), both physical and social factors can be included. For example, modeling water treatment plant flooding with the loss of service to specific geographic areas and their populations can reflect physical damage at the plant, unavailability of parts for repairs, unavailability of operators, government response to flooding (e.g., boil notices), population responses to loss of service, and other factors. More narrowly focused engineering and social science research identify and model physical and social factors in detail. Their impacts are aggregated here in infrastructure capacity to facilitate a focus on their impacts on habitation.
Measuring Habitation Performance
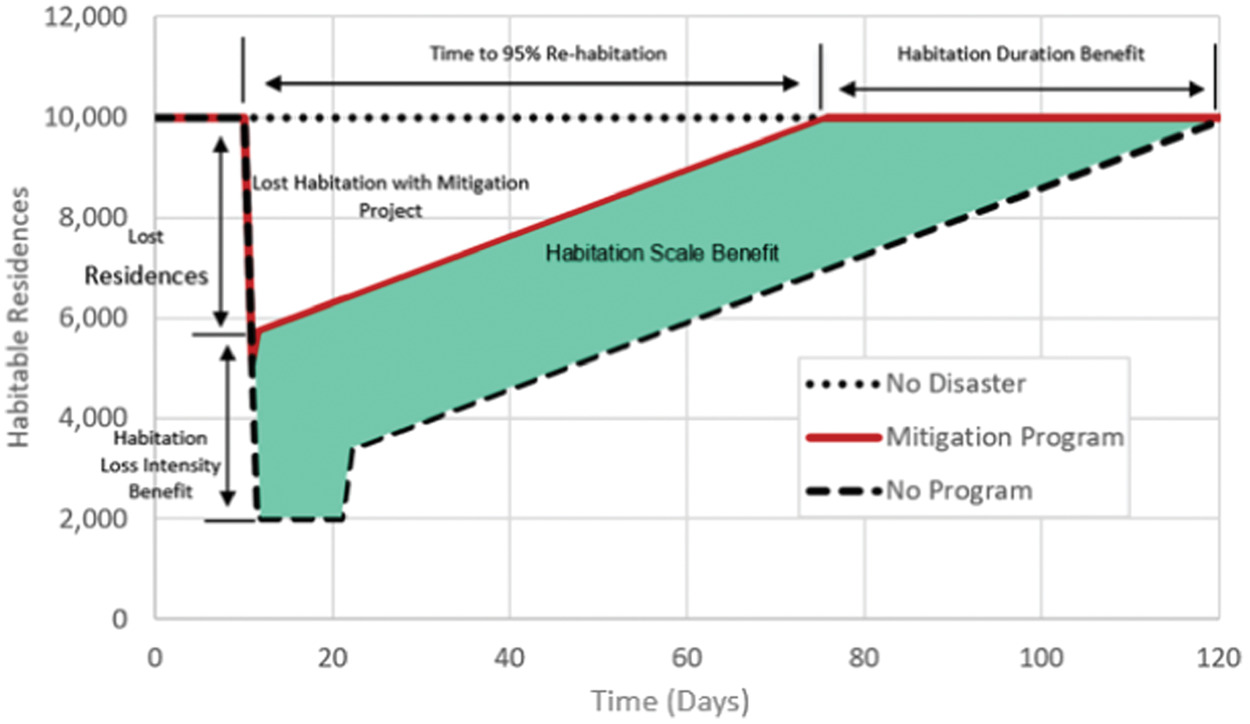
Communities care about at least three features of disaster habitation, shown in the stylized habitation behavior over time graph (BOTG) in Fig. 2: (1) habitation loss intensity; (2) habitation loss scale; and (3) habitation loss duration. Habitation loss intensity can be measured with the number of available residences initially made uninhabitable after the onset of a disaster event. A disaster scenario with a mitigation project that protects a community and thereby requires only 10% of residents to evacuate is preferable to a no-project scenario that requires 50% of residents to evacuate. Habitation loss scale can be measured with the amount of habitation, measured in residence days, not available during a disaster experience. Scenarios allowing more residence days of habitation are preferred. Habitation loss duration can be measured with the time required for a given fraction of impacted residences (e.g., 95%) to be rehabitated. The restoration delays that increase habitation loss duration can be long and created by a multitude of drivers, such as bureaucratic delays in starting infrastructure restoration, inefficiencies in built infrastructure restoration (e.g., due to fraud, corruption), information delays concerning community conditions, and population resistance to rehabitate due to psychological stress. A scenario that returns a community to near pre-event habitation levels faster is preferable to a slower scenario. These metrics (habitation loss intensity, scale, and duration) provide a much richer description of habitation performance than any single measure. Differences in these metrics with and without projects are used to quantify project habitation benefits. If described using loss fractions or percentages of pre-event conditions, the three disaster habitation performance metrics normalize disaster habitation across communities, disasters, and projects and can be used to compare disaster habitation scenarios across a wide variety of circumstances.
Disaster Habitation Model
The CIIS within a community interacts in complex ways. Qureshi (2020) modeled recovery interactions, finding a dense set of interactions among community systems. The Disaster Habitation Model focuses on a subset of those systems (the CIIS) and interactions that describe how built infrastructures impact the quantity of habitation.
Model Scope and Boundary
The Disaster Habitation Model (DHM) focuses on a community, i.e., a single geographic area impacted by a natural disaster. The model disaggregates the impacted area into geographic zones with similar disaster experiences. Causal relations within the model use exogenous data to simulate residence availability for habitation in each zone over time. The framework within which the model was built is described by the modeling approach described above, a dynamic, critical, and internally restored built infrastructure description of a community that is causally linked to the availability of residences to reflect functionally defined habitation. More specifically, Fig. 3 describes the model scope by listing some of the most important exogenous inputs, internally generated variables, and features not included in the current version of the model.
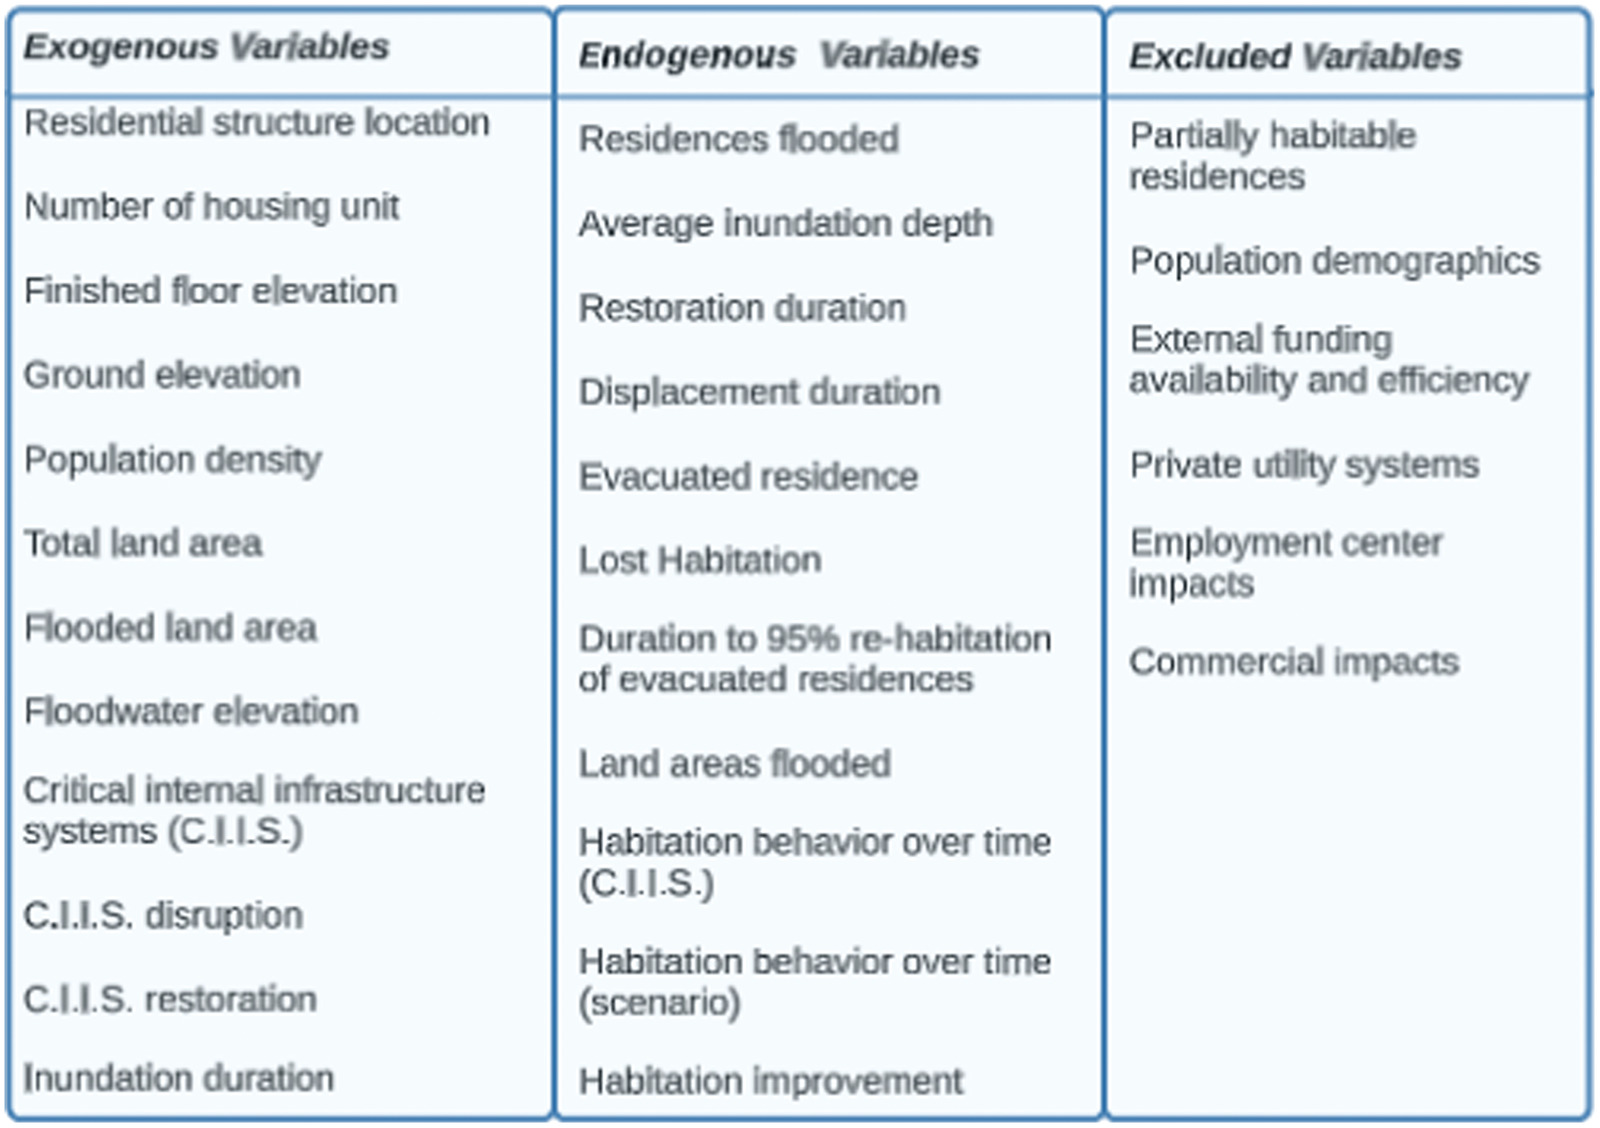
In Fig. 3 is below, the exogenous (external) variables are data inputs that describe the system and its environment, the model generates values of the endogenous (internal) variables, and the excluded variables are those that may influence housing restoration, but are assumed to not directly affect the availability of habitable residences. Some of the excluded variables in Fig. 3 are examples of social aspects of disaster recovery that have been addressed in social science and disaster recovery research.
Modeling Event Impacts on Critical Internal Infrastructure Systems
Event impacts on individual CIIS were estimated using hydraulic modeling outputs and a Geographic Information System (GIS). The census block groups published by the US Census Bureau were used to define zones of similar disaster experiences within the community (US Census Bureau 2021). Data from the Harris County Flood Control District (HCFCD) Structure Inventory data set and the 2020 Census were used to estimate the number of residences in each block group. Preprocessing of this data for estimating residential units per structure included deleting some structure types (hotel, motel, bed and breakfast, guest cottage, or lodge) and adding several residences to some structures that reported none (e.g., mobile home, condo, apartment) if larger than 500 square feet. Buildings smaller than 500 sf were assumed to be nonoccupied, such as a tool shed. Finished floor elevations (FFE) and other attributes were updated to create an enhanced version of the HCFCD Structure Inventory.
Modeling Residential Shelter Flooding
To estimate the impacts of flooding on residential structures, inundation depth was calculated as the difference between the maximum flood elevation (FE) from field data or hydrologic and hydraulic flood simulations at each structure location and individual structure finished floor elevations (FFE). Structures with FFE > FE were not considered to be flooded. Inundation depths for each structure were multiplied by the number of units in the structure to derive a residence-weighted inundation depth. It is assumed that flooding above the finished floor elevation impacts all residents in a structure, regardless of the floor of the residence. Residence-weighted inundation depths were summed in each zone and divided by the number of flooded units in that zone to derive an average residence-weighted inundation depth [Eq. (1)]. See the supporting documents for sample calculations:where = average residence’s weighted inundation depth for zone ; = flood elevation at location of structure in zone ; = finished floor elevation of structure in zone ; = number of units in structure of zone ; = number of flooded units in zone ; and = number of structures in the zone.
(1)
Next, inundation depths at 12-h intervals were compared to the first floor above ground height to estimate inundation durations. This was used to estimate the number of days a structure was inundated:where = inundation duration {days} of structure in zone ; Inundated time periods = times when the zone was inundated; and = time between inundation measurements.
(2)
For example, if flood waters were above FFE in three consecutive 12-h timesteps, the residence was flooded for one day (two 12-h periods).
A residence-weighted inundation duration was calculated by multiplying the number of residential units in a structure by its inundation duration. These were summed for each zone and divided by the number of flooded units in that zone to derive an average residence-weighted inundation duration [Eq. (3)]:where = average residence’s weighted inundation duration.
(3)
is the infrastructure outage duration due to flooding in a zone, i.e., the difference between the infrastructure loss start and infrastructure restoration start.
Modeling Utility Service Loss Impacts on Habitation
Utility service areas align reasonably well with block groups. Therefore, each block group was assumed to be either totally impacted (100% residences losing service) or not impacted by conditions for each utility CIIS and restored as soon as service was restored. The average time to occupy and restart activities time is the time from the initial service loss until complete infrastructure restoration, the sum of the infrastructure outage due to the flooding, and the restoration/rehabilitation durations [Eq. (4)]:where = average time to occupy and restart activities of zone ; = infrastructure outage duration due to flooding of zone ; and = infrastructure restoration duration of zone .
(4)
For shelter flooding, infrastructure outage duration , the average residence-weighted inundation duration. For other infrastructures, the value was assumed to be the duration of flooding at the infrastructure asset location. In calculating the shelter restoration duration, the infrastructure restoration was assumed to begin immediately after the flood waters had receded. The restoration duration for flooded residences was estimated at 45 days per foot of inundation as extracted from FEMA flood loss restoration functions (FEMA 2013). This estimation considers not just the time needed to restore the structure physically, but also the time needed for clean-up, permits, contractor availability, and any potential hazardous material issues.
Modeling Disaster Scenario Habitation, Performance, and Project Benefits
The modeling products described above were used to generate time series of habitation due to each CIIS in an Excel spreadsheet. The residences affected by infrastructure service losses were subtracted from the pre-event number of available residences and added back to the number of available residences after the average time to occupy and restart activities. These CIIS time series were plotted to generate a BOTG of habitation available for each CIIS and to develop habitation performance indices to describe the habitation driven by each CIIS.
The minimum number of available residences by all CIIS at any time in each experience zone describes the zone’s net habitation. Net habitation over time values were used to create BOTG that describe a scenario’s habitation evolution. These can be used to measure the habitation performance of any modeled disaster scenario in terms of habitation loss intensity, scale, and duration. Differences in performance with and without proposed projects quantify the habitation benefits of the project.
Modeling Testing
The Disaster Habitation Model structure and behavior were tested to develop confidence in modeling results. The model structure was compared with the modeled system at the whole-model, model sector, and equation levels. For example, at the equation level, model variables and relations were compared with those in the case study scenarios modeled to establish one-to-one reflections of the modeled system in the model. Flood experts on the modeling team evaluated model variables and their relations for consistency with practice. Variable units were tested for consistency across equations. The BOTG modes (shapes over time) were compared with known behavior modes for reasonableness, such as the sudden drop in infrastructure services and available residences immediately after the onset of a disaster and rapid or gradual restoration of infrastructures and residences. BOTGs for individual CIIS were compared with narratives of modeled scenarios. See the support document for details. Based on these and other tests, the DHM was assessed to be capable of generating realistic and reliable simulations of disaster habitation.
Case Study: Application to Halls Bayou Watershed and Hurricane Harvey
The Halls Bayou watershed in Houston, Texas, was modeled with the DHM based on its experience after Hurricane Harvey in 2017 and two simulated floods to measure habitation performance with and without a proposed mitigation program and thereby assess program benefits.
The Community
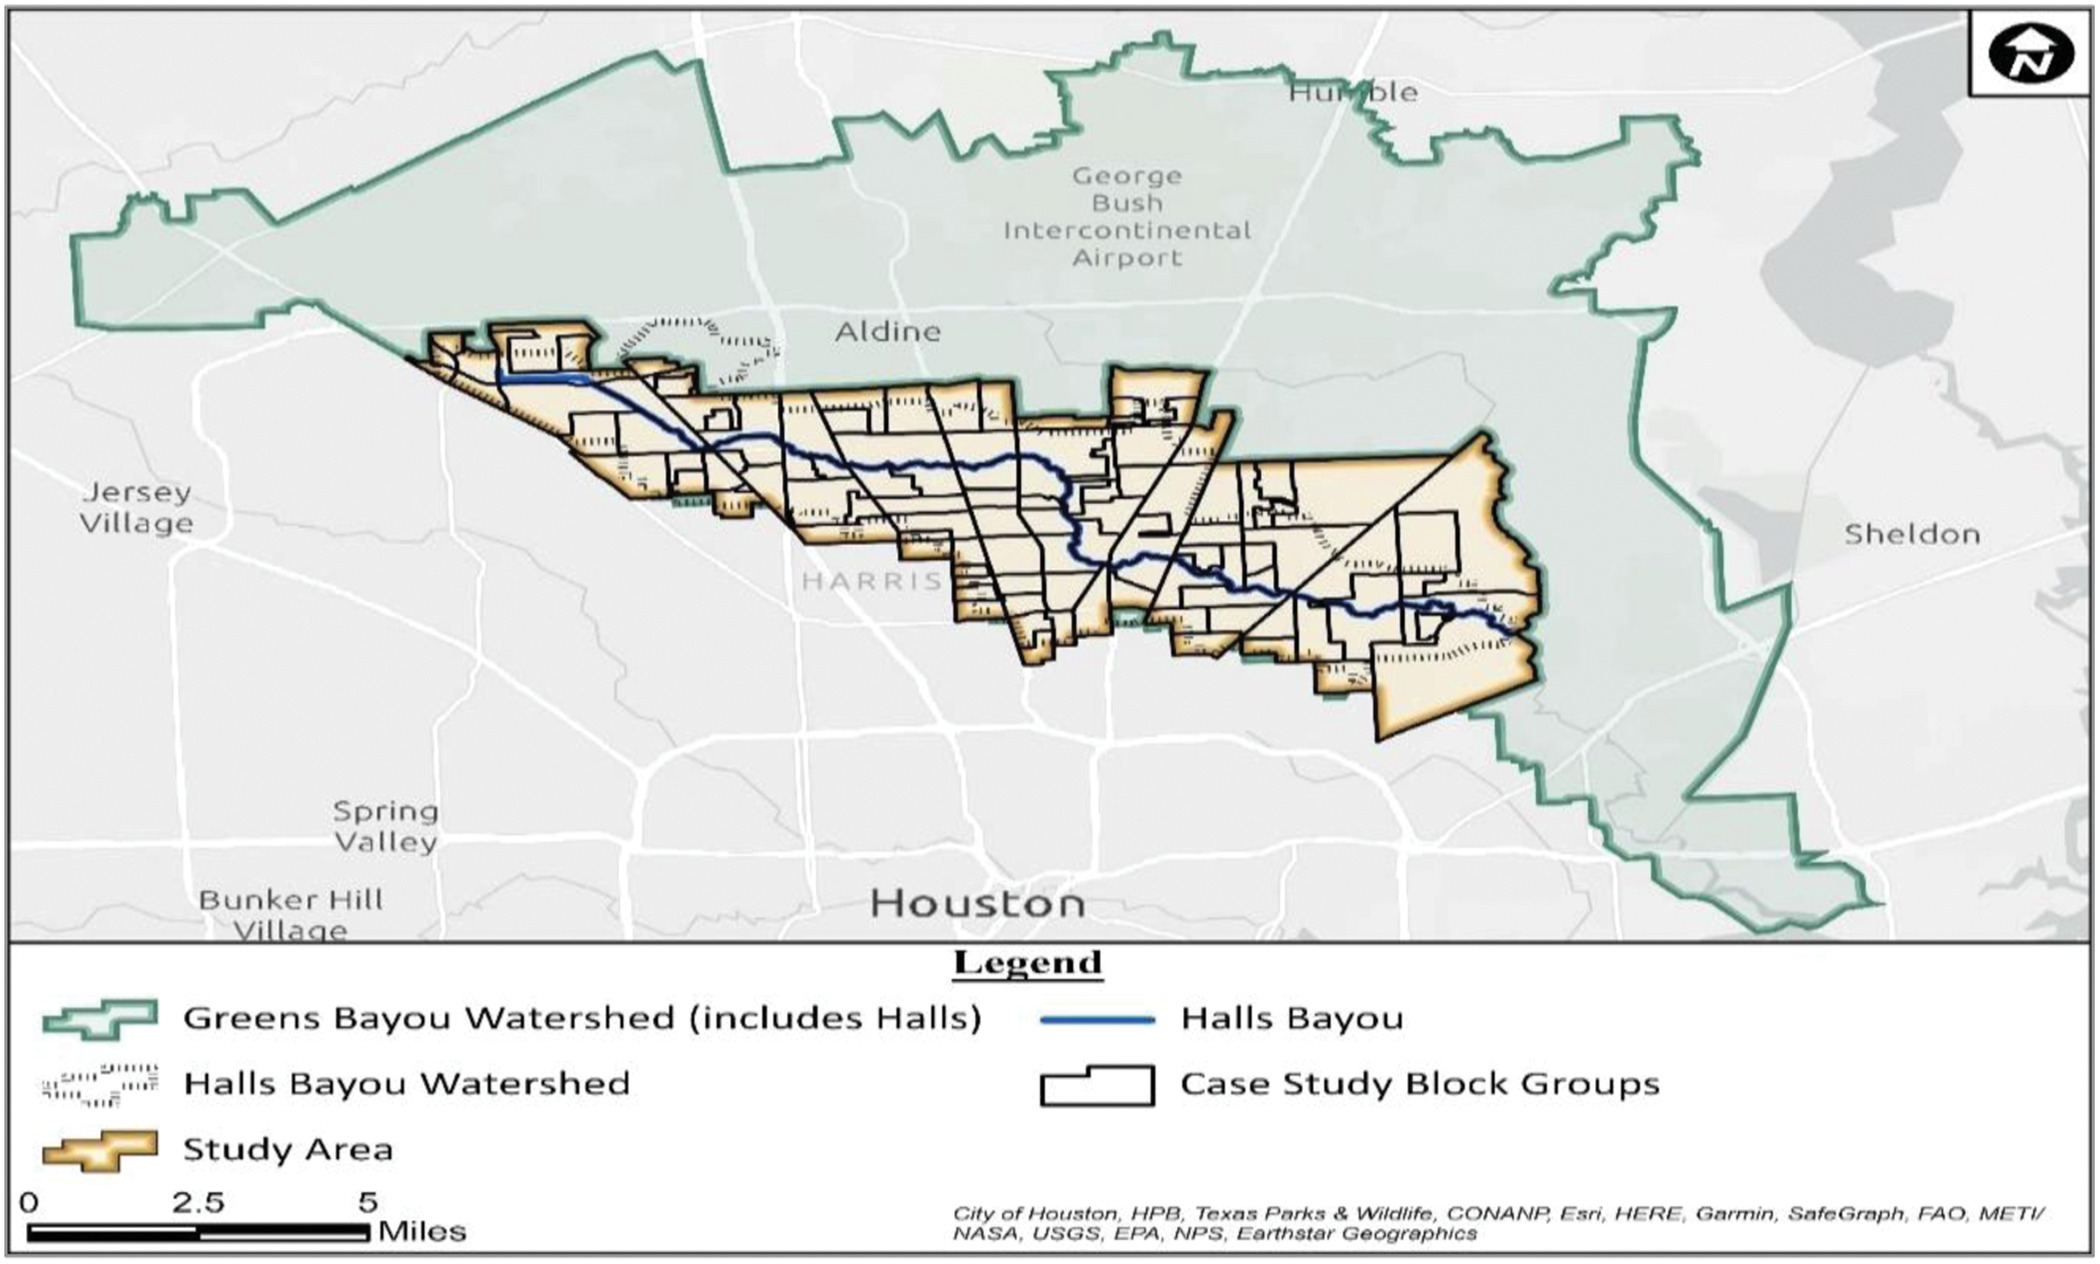
Halls Bayou, approximately 20 miles in length, collects stormwater from the Veterans Memorial Drive area, flowing east until it joins Greens Bayou at the City of Houston’s Brock Park. The watershed (Fig. 4) includes 37 tributaries that are more than one mile in length. The watershed comprises approximately 45 square miles, mostly developed with a mix of residential, commercial, and industrial uses. The watershed’s population was approximately 160,100 in 2010 (HCFCD 2022). The study area includes 115 Census block groups.
Disaster Events
Three flood disaster events were used to create disaster scenarios: Hurricane Harvey, a 100-year simulated storm event, and a 500-year simulated storm event. Between August 25 and 30, 2017, Hurricane Harvey dropped an estimated 1 trillion gallons of water over Houston and surrounding areas, leading to widespread residential flooding. In the early hours of Sunday, August 27, all 22 primary channels and bayous in Harris County spilled over their banks. The communities along Halls Bayou were significantly impacted, with thousands of residential structures flooded (HCFCD 2022), as well as wastewater treatment facilities, electrical power distribution components, drinking water production wells, and distribution system components. Every bayou in Harris County flooded simultaneously. Flood data was collected from HCFCD, the City of Houston, and utility services suppliers such as CenterPoint Energy to model the Hurricane Harvey event. In addition, expected flooding data due to a 100-year and 500-year return period storms simulated by Lockwood, Andrews & Newman, Inc., were used for project habitation modeling.
Proposed Mitigation Program
In response to Hurricane Harvey, in August 2018, Harris County voters approved a $2.5 billion bond program for a program of flood risk reduction projects. The Halls Bayou portion of the program included new channel construction, existing channel improvements, construction of stormwater detention basins, and acquisition and demolition of building structures. The impacts of these projects on floodwater elevations were used in the 100-year and 500-year storm models. The support files provide a more detailed description of the proposed mitigation program.
Critical Internal Infrastructure Systems for the Halls Bayou Watershed
Based on Qureshi (2020), 16 infrastructure systems were considered potential CIIS for the Halls Bayou Hurricane Harvey scenario. Qualitative descriptions and analysis of the scenario for each CIIS were developed to build a rich understanding of resident experiences and the drivers of those experiences. Official flood and CIIS data from reports were corroborated by descriptions of disaster experiences of Halls Bayou residents collected from public sources (e.g., newspaper accounts). This analysis revealed five built infrastructures as CIIS: shelter flooding, electric power distribution, potable water, wastewater collection, and wastewater treatment.
Modeling Results
Fig. 5 shows the BOTG of habitation evolution due to the impact of Hurricane Harvey on the five Halls Bayou CIIS. The proposed mitigation program was not included since it was not operational when Hurricane Harvey occurred. Flooding started on August 27, 2017, modeled as simulation day 10. The five infrastructures have very different impacts on habitation, as shown by the different shapes of the BOTG in Fig. 5. The individual infrastructures also impacted habitation performance differently. Wastewater treatment created the largest loss of residences (habitation loss intensity = 15,734) but recovered on day 14. Drinking water loss affected 2,466 residences on day 12 and recovered on day 17. Wastewater collection and electric power distribution loss affected 1,530 and 2,494 residences and fully recovered on days 12 and 14, respectively. Shelter spaces have the second highest infrastructure loss, with 7,498 residences flooded and the most extended recovery duration.
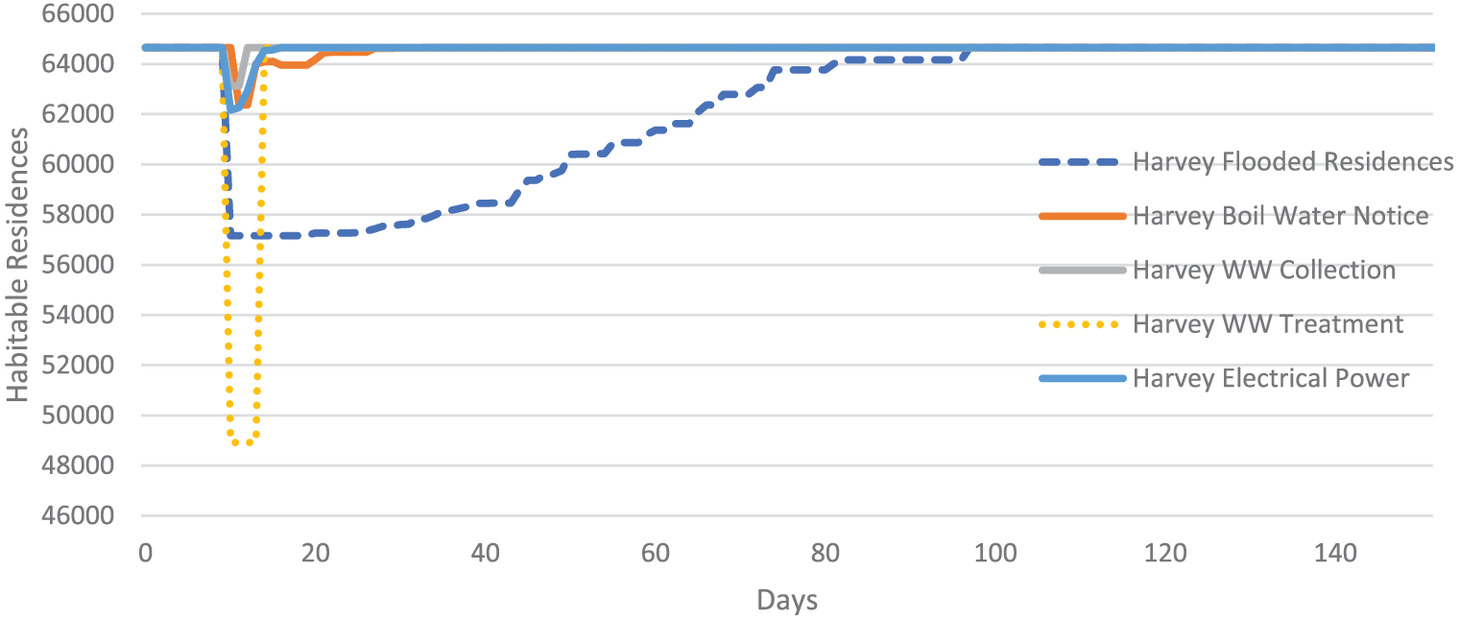
Fig. 5 shows that modeling different CIIS independently reveals which CIIS controls habitation loss in different dimensions (intensity, scale, duration) and in different time periods. For example, in Fig. 5, wastewater treatment losses controlled habitation loss intensity immediately after Hurricane Harvey, but shelter flooding controlled this performance measure thereafter. Shelter flooding controlled habitation loss duration, with other infrastructures generating relatively small duration losses. Fig. 5 also shows that, in this scenario, the other CIIS impacts were subsumed under the wastewater treatment and shelter flooding impacts. These insights demonstrate why rigorous disaster habitation modeling requires attention to all CIIS individually and then integrating CIIS BOTG. Table 1 shows the quantified description of habitation and habitation performance of the Halls Bayou/Hurricane Harvey/No Program scenario. Habitation calculations were conducted using a simulation period of 400 days. However, the BOTG included here are within a limit of 150 days for legibility.
| Metric | Units of measure | Residential flooding | Drinking water | Wastewater collection | Wastewater treatment | Electric power distribution |
|---|---|---|---|---|---|---|
| Habitation without disaster | Residence × Days | 25,862,000 | 25,862,000 | 25,862,000 | 25,862,000 | 25,862,000 |
| Habitation loss scale | Residence × Days | 357,886 | 10,823 | 3,060 | 62,936 | 7,483 |
| Total predisaster residential capacity | Residence | 64,655 | 64,655 | 64,655 | 64,655 | 64,655 |
| Habitation loss intensity | Residence | 7,498 | 2,466 | 1,530 | 15,734 | 2,494 |
| Recovery date for 95% of evacuated residencies | Date | November 22, 2017 | August 27, 2017 | August 29, 2017 | August 31, 2017 | August 30, 2017 |
| Habitation loss duration (to 95% rehabitation) | Days | 87 | 17 | 2 | 4 | 4 |
| Total evacuated residences | Percent | 12 | 4 | 2 | 24 | 4 |
Mitigation Program Analysis
The DHM was also used to analyze the proposed mitigation program using Halls Bayou experiencing a simulated 500-year storm without the proposed mitigation program and Halls Bayou experiencing the same storm with the proposed mitigation program. The 500-year storm was chosen for mitigation program analysis because it is the simulated storm with habitation impacts most like Hurricane Harvey. Flood elevation data for these two scenarios were simulated by others and used as input. Fig. 6 shows the evolution of habitable residences with and without the mitigation program. The proposed mitigation program led to the removal of 215 residences to make way for detention basins, creating the minor difference in the initial (before day 10) number of residences between the two scenarios. Individual CIIS BOTG can be found in the supporting document.
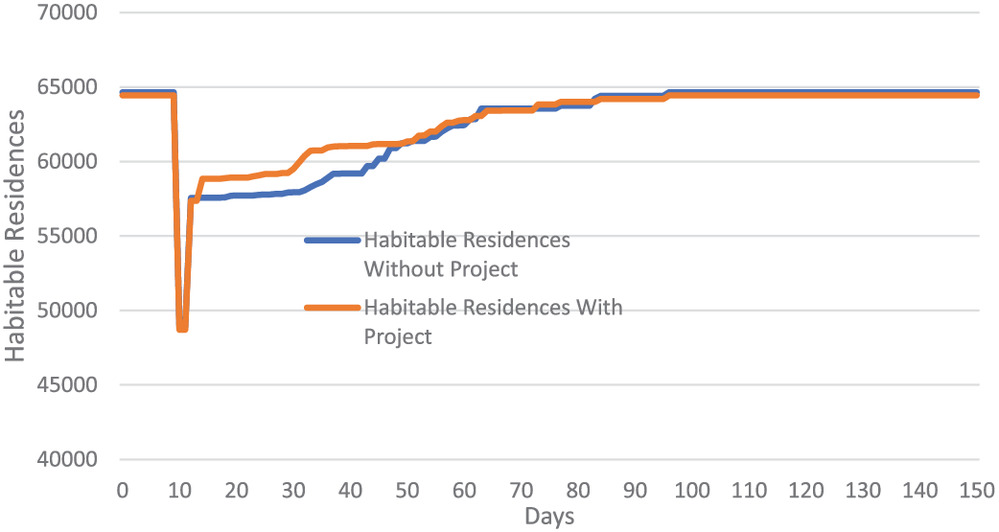
The proposed program does not impact habitation loss intensity, as indicated by the same initial decrease in the number of habitable residences due to the loss of wastewater treatment services that occurs in both scenarios. This is consistent with the focus of the mitigation program on reducing flooding to residences. After the wastewater treatment recovery, the program’s benefits are visible in the more significant habitation earlier with the program (orange line) than without the program (blue line) due to fewer flooded residences. Table 2 shows the quantification of habitation, performance, and program benefits.
| Metric | Units of measure | 500-year no project | 500-year project | Difference | Percentage improvement (%) |
|---|---|---|---|---|---|
| Habitation without disaster | Residence × Days | 25,862,000 | 25,776,000 | 86,000 | 0 |
| Habitation loss scale | Residence × Days | 322,329 | 251,542 | 70,787 | 22 |
| Total predisaster residential capacity | Residence | 64,655 | 64,440 | 215 | 0 |
| Habitation loss intensity | Residence | 15,734 | 15,734 | 0 | 0 |
| Percentage of total residences evacuated | Percent | 24% | 24% | 0% | 0 |
| Habitation loss duration (to 95% re-habitation) | Days | 73 | 67 | 6 | 8 |
The proposed program reduces habitation loss scope by 70,787 residence-days (22%) and the habitation loss duration by 6 days (8%), but does not decrease habitation loss intensity. Results such as those above provide mitigation program analysts with objective, rigorous, and explanatory descriptions of mitigation program impacts on habitation that can be compared to other alternatives and used to reject or justify proposed mitigation efforts.
Conclusions
This research proposed and demonstrated a new modeling approach and model for assessing habitation loss due to natural disasters. The approach establishes a dynamic perspective, critical internal infrastructure systems, and habitation performance metrics as a basis for modeling. A causal model was developed to simulate habitation evolution driven by built infrastructure systems, thereby quantifying habitation postdisaster. The dynamic evolution of habitation was modeled by creating behavior over time graphs, specifying disaster scenarios, and analyzing a proposed disaster mitigation program. The usefulness of the approach and model was assessed with model testing and a case study of the Halls Bayou watershed by modeling the impacts of Hurricane Harvey on the watershed and disaster habitation improvements due to a proposed mitigation program assuming a simulated 500-year storm.
Results indicate that the approach and method provide an objective means of analyzing the impacts of disasters on habitation and the benefits of proposed mitigation projects. Multiple CIIS drive habitation at different times during recovery, highlighting the need to consider CIIS first independently and then aggregately. In the case study, the CIIS that most affected habitation losses were wastewater treatment and shelter flooding. In that scenario the proposed mitigation program reduces habitation loss scale by 22% and habitation loss duration by 8%, but did not decrease habitation loss intensity. The model uses the evolution of infrastructure systems to help explain this performance.
The work makes several contributions to disaster management. The modeling approach and methodology generate more accurate performance estimates than heuristic-based modeling by being more closely based on scenario data and behaviors. Application of the approach and methodology can help disaster managers quantify habitation impacts and select the most effective programs and projects for mitigating disaster habitation losses. The methodology can be used to improve disaster program and project evaluation by including habitation as well as easily monetized impacts in analyses. This work also provides an improved understanding of the drivers of flooding disaster habitation in the Harris County area and potentially in other communities. The metrics developed can be used to quantify disaster habitation and estimate displaced populations and habitation benefits across diverse communities, disasters, and mitigation efforts. More broadly, the approach and method can lead to improved public policies for analyzing, evaluating, and selecting disaster mitigation projects, improving disaster management, and thereby saving more lives and property.
The modeling approach and method has limitations that can be the basis for future research. For example, the modeling of CIIS interdependencies can be formalized and improved to include important restoration delays. Drivers can be modeled in more detail to describe specific physical and social influences. Research into disaster infrastructure interdependencies (e.g., Qureshi 2020, 2022) can be the basis for this modeling. Each residence was assumed to be either fully functional and therefore habitable or uninhabitable. Modeling residence functionality and housing insecurity in more detail may improve analysis accuracy and allow investigations of other performance metrics such as psychological stress on populations. Opportunities for expansion of the modeling method include the incorporation of other CIIS, gathering and using more and different data, application to other types of disasters, watersheds and communities, and disaster management efforts, analysis of performance across watersheds, and analysis of subwatersheds. The model can also be the basis for analyzing habitation from a social viewpoint by disaggregating watersheds into geographic zones of subpopulations, such as those distinguished by their social vulnerability indices or income levels. This can lead to project selection and policies that customize disaster management to specific community needs or objectives. Finally, the modeling method used here requires copious amounts of data, making application difficult in its absence. A modeling methodology that uses the approach described here but facilitates implementation when much less data is available can make the approach and method more widely applicable. The research team is currently exploring some of these opportunities.
Developing improved models of disaster habitation will improve mitigation project analysis and selection and thereby the effectiveness and efficiency of disaster management efforts, which can save lives and property.
Data Availability Statement
Some data, models, or code that support the findings of this study are available from the corresponding author upon reasonable request. These data include census block group populations (HCFCD 2022), census block group housing count (US Census Bureau 2021), and locations of affected water supply districts (TCEQ 2017).
Acknowledgments
The authors thank the Harris County Flood Control District for providing data and financial support, the Galveston District of the United States Army Corps of Engineers for support, the City of Houston for coordination support and access to prior engineering work, CenterPoint Energy for data, Lockwood, Andrews & Newman, Inc., for flood simulation data, and TxDOT via the Texas A&M Transportation Institute for funding portions of this work.
References
Akbar, M. S., and D. P. Aldrich. 2017. “Determinants of post-flood social and institutional trust among disaster victims.” J. Contingencies Crisis Manage. 25 (4): 279–288. https://doi.org/10.1111/1468-5973.12152.
Andrew, S. A., S. Arlikatti, L. C. Long, and J. M. Kendra. 2013. “The effect of housing assistance arrangements on household recovery: An empirical test of donor-assisted and owner-driven approaches.” J. Hous. Built Environ. 28 (Mar): 17–34. https://doi.org/10.1007/s10901-012-9266-9.
Arlikatti, S., S. A. Andrew, J. M. Kendra, and C. S. Prater. 2015. “Temporary sheltering, psychological stress symptoms, and perceptions of recovery.” Nat. Hazards Rev. 16 (3): 04014028. https://doi.org/10.1061/(ASCE)NH.1527-6996.0000166.
Benson, C., and J. C. Edward. 2004. Understanding the economic and financial impacts of natural disasters. Washington, DC: World Bank.
Bolin, R., and P. Bolton. 1986. Race, religion, and ethnicity in disaster recovery. Boulder, CO: Univ. of Colorado.
Bolin, R. C. 1982. Long-term family recovery from disaster. Boulder, CO: Univ. of Colorado.
Brown, D., K. Saito, R. Spence, T. Chenvidyakarn, B. Adams, A. Mcmillan, and S. Platt. 2008. “Indicators for measuring, monitoring, and evaluating post-disaster recovery.” In Proc., 6th Int. Workshop on Remote Sensing for Disaster Applications. Cambridge, UK: Univ. of Cambridge.
Chhibber, A., and R. Laajaj. 2008. “Disasters, climate change and economic development in sub-Saharan Africa: Lessons and directions.” J. Afr. Econ. 17 (2): 7–49. https://doi.org/10.1093/jae/ejn020.
Davis, N. Y. 1972. The role of the Russian Orthodox church among five pacific Eskimo villages. Newark, DE: Univ. of Delaware.
DeVaney, T., S. Carr, and D. Allen. 2009. “Impact of Hurricane Katrina on the educational system in Southeast Louisiana: One-year follow-up.” Res. Schools 16 (1): 32–44.
Donald, J. 2021. “Winter storm Uri 2021: Economy, Fiscal notes.” Accessed September 19, 2022. https://comptroller.texas.gov/economy/fiscal-notes/2021/oct/winter-storm-impact.php.
FEMA (Federal emergency Management Agency). 2013. Multi-hazard loss estimation methodology, flood model, HAZUS, technical manual. Washington, DC: FEMA.
Fischbach, A. 2017. “Utilities survive storms and rebuild for the future.” Accessed November 14, 2017. https://www.tdworld.com/electric-utility-operations/article/20970490/utilities-survive-storms-and-rebuild-for-the-future.
GAO (Government Accountability Office United States). 2019. Army corps of engineers: Consideration of project costs and benefits in using natural coastal infrastructure and associated challenges. Washington, DC: GAO.
HCFCD (Harris County Flood Control District). 2022. “F-122 watershed wide project implementation program.” Accessed November 25, 2022. https://www.hcfcd.org:https://www.hcfcd.org/Activity/Active-Projects/Halls-Bayou/F-122-Watershed-Wide-ProjectImplementation-Program.
Koliou, M., and J. W. van de Lindt. 2020. “Development of building restoration functions for use in community recovery planning to tornadoes.” Nat. Hazards Rev. 21 (2): 04020004. https://doi.org/10.1061/(ASCE)NH.1527-6996.0000361.
Masterson, J. H., W. G. Peacock, S. S. Van Zandt, H. Grover, L. F. Schwarz, and J. T. Cooper. 2014. Planning for community resilience: A handbook for reducing vulnerability to disasters, 1–58. Washington, DC: Island Press.
McWhirter, C. 2022. “Near Louisiana Coast, storms leave city with wrecked homes, doubts about the future.” The Wall Street Journal. Accessed March 26, 2022. https://www.wsj.com/articles/near-louisiana-coast-storms-leave-city-with-wrecked-homes-doubts-about-the-future-11645365600.
Mechler, R. 2016. “Reviewing estimates of the economic efficiency of disaster risk management: Opportunities and limitations of using risk-based cost–benefit analysis.” Nat. Hazards 81 (3): 2121–2147. https://doi.org/10.1007/s11069-016-2170-y.
Mitsova, D., A. Esnard, A. Sapat, A. Lamadrid, M. Escaleras, and C. Velarde-Perez. 2021. “Effects of infrastructure service disruptions following hurricane Irma: Multilevel analysis of post-disaster recovery outcomes.” Nat. Hazards Rev. 22 (1): 04020055. https://doi.org/10.1061/(ASCE)NH.1527-6996.0000421.
NERC (North American Electricity Reliability Corporation). 2018. “Hurricane harvey event analysis report.” In Event analysis report. Atlanta: NERC.
Nguyen, C., K. J. Schlesinger, F. Han, I. Gür, and J. M. Carlson. 2019. “Modeling individual and group evacuation decisions during wildfires.” Fire Technol. 55 (2): 517–545. https://doi.org/10.1007/s10694-018-0770-7.
Nojima, N. 2012. “Restoration processes of utility lifelines in the Great East Japan Earthquake Disaster, 2011.” In Proc., 15th World Conf. on Earthquake Engineering (15WCEE), 24–28. Tokyo: International Association for Earthquake Engineering.
Oliver-Smith, A. 1990. “Post-disaster housing reconstruction and social inequality: A challenge to policy and practice.” Disasters 14 (1): 7–19. https://doi.org/10.1111/j.1467-7717.1990.tb00968.x.
Oliver-Smith, A. 1996. “Anthropological research on hazards and disasters.” Annu. Rev. Anthropol. 25 (1): 303–328. https://doi.org/10.1146/annurev.anthro.25.1.303.
Pacheco, S. L. 2021. “A quantified community disaster management strategy assessment model.” Master’s thesis, Zachry Dept. of Civil and Environmental Engineering, Texas A&M Univ.
Patel, S., and H. Makarand. 2013. “A framework to construct post-disaster housing.” Int. J. Disaster Resilience Built Environ. 4 (1): 95–114. https://doi.org/10.1108/17595901311299026.
Peacock, W. G., and C. Girard. 1997. “Ethnic and racial inequalities in hurricane damage and insurance settlements.” In Hurricane Andrew: Ethnicity, gender and the sociology of disasters, 171–190. Miami: Florida International Univ.
Picou, J. S., and B. K. Marshall. 2007. “Social impacts of Hurricane Katrina on displaced K–12 students and educational institutions in coastal Alabama counties: Some preliminary observations.” Sociol. Spectrum 27 (6): 767–780. https://doi.org/10.1080/02732170701534267.
Quarantelli, E. L. 1982. “General and particular observations on sheltering and housing in American disasters.” In Disasters, 277–281. New York: Wiley. https://doi.org/10.1111/j.1467-7717.1982.tb00550.x.
Quarantelli, E. L. 1995. “Patterns of sheltering and housing in US disasters.” Disaster Prev. Manage. 4 (3): 43–53. https://doi.org/10.1108/09653569510088069.
Qureshi, R. 2020. “Descriptive design structure matrices for modeling infrastructure interdependencies in community recovery.” Master of Science thesis, Zachry Dept. of Civil and Environmental Engineering, Texas A&M Univ.
Qureshi, R. 2022. “Community disaster recovery resourcing strategy design and assessment.” Doctoral dissertation, Zachry Dept. of Civil and Environmental Engineering, Texas A&M Univ.
Scurfield, R. M. 2007. “Katrina: Post-traumatic stress and recovery over two years later.” In Proc., Annual Conf. of the Mississippi Society for Social Work Leadership in Health Care. Jackson, MI: Mississippi Society of Social Work Leadership in Health Care.
Sutley, E. J., and S. Hamideh. 2018. “An interdisciplinary system dynamics model for post-disaster housing recovery.” Sustainable Resilient Infrastruct. 3 (3): 109–127. https://doi.org/10.1080/23789689.2017.1364561.
TCEQ (Texas Commission on Environmental Quality). 2017. “Public drinking water: Community water systems (CWSs) impacted by hurricane harvey with rescinded boil water notices.” Accessed June 14, 2022. https://www.tceq.texas.gov/assets/public/response/hurricanes/bwn-rescinded.pdf.
USACE (United States Army Corps of Engineers). 2021. Memorandum for commanding general, U.S. Army Corps of Engineers, Subject: Policy Directive—Comprehensive documentation of benefits in decision document. Washington, DC: USACE.
US Census Bureau. 2021. 2020 census redistricting data (Public Law 94-171) summary files. Suitland, MD: US Census Bureau.
Van Griensven, F., et al. 2006. “Mental health problems among adults in tsunami-affected areas in Southern Thailand.” JAMA 296 (5): 537–548. https://doi.org/10.1001/jama.296.5.537.
Van Zandt, S., W. G. Peacock, D. W. Henry, H. Grover, W. E. Highfield, and S. D. Brody. 2012. “Mapping social vulnerability to enhance housing and neighborhood resilience.” Housing Policy Debate 22 (1): 29–55. https://doi.org/10.1080/10511482.2011.624528.
Watson, M., Y. Xiao, J. Helgeson, and M. Dillard. 2020. “Importance of households in business disaster recovery.” Nat. Hazards Rev. 21 (4): 05020008. https://doi.org/10.1061/(ASCE)NH.1527-6996.0000393.
Information & Authors
Information
Published In

Natural Hazards Review
Volume 25 • Issue 2 • May 2024
Copyright
This work is made available under the terms of the Creative Commons Attribution 4.0 International license, https://creativecommons.org/licenses/by/4.0/.
History
Received: Feb 3, 2023
Accepted: Sep 30, 2023
Published online: Feb 27, 2024
Published in print: May 1, 2024
Discussion open until: Jul 27, 2024
Authors
Metrics & Citations
Metrics
Citations
Download citation
If you have the appropriate software installed, you can download article citation data to the citation manager of your choice. Simply select your manager software from the list below and click Download.