Hurricane Wind Loss Estimation for Puerto Rico and the US Virgin Islands: Model Implementation and Validation
Abstract
The implementation and validation of the Federal Emergency Management Agency’s Hazus Hurricane Model for Puerto Rico and the US Virgin Islands are presented in this paper. Previous versions of the model addressed 22 hurricane-prone states in the United States but lacked the necessary data sets for use in the Caribbean territories. To remedy this limitation, several data sets were developed and incorporated into the model, including a comprehensive building inventory, estimates of the relative frequencies of various architectural and structural features of buildings that are relevant to their performance in high winds, estimates of aerodynamic surface roughness, a simplified inventory of characteristics relevant to tree blowdown and debris management, and deterministic wind field footprints. This paper presents results produced by the enhanced model that were validated and calibrated against several metrics of damage and loss reported in the literature for Hurricanes Irma and Maria, with generally good alignment. For those metrics with less robust levels of agreement, the differences appear to be largely attributable to limitations in our knowledge of the building characteristics, limitations in the model’s census tract aggregate level of analysis, or differences between the units of analysis and observation.
Introduction
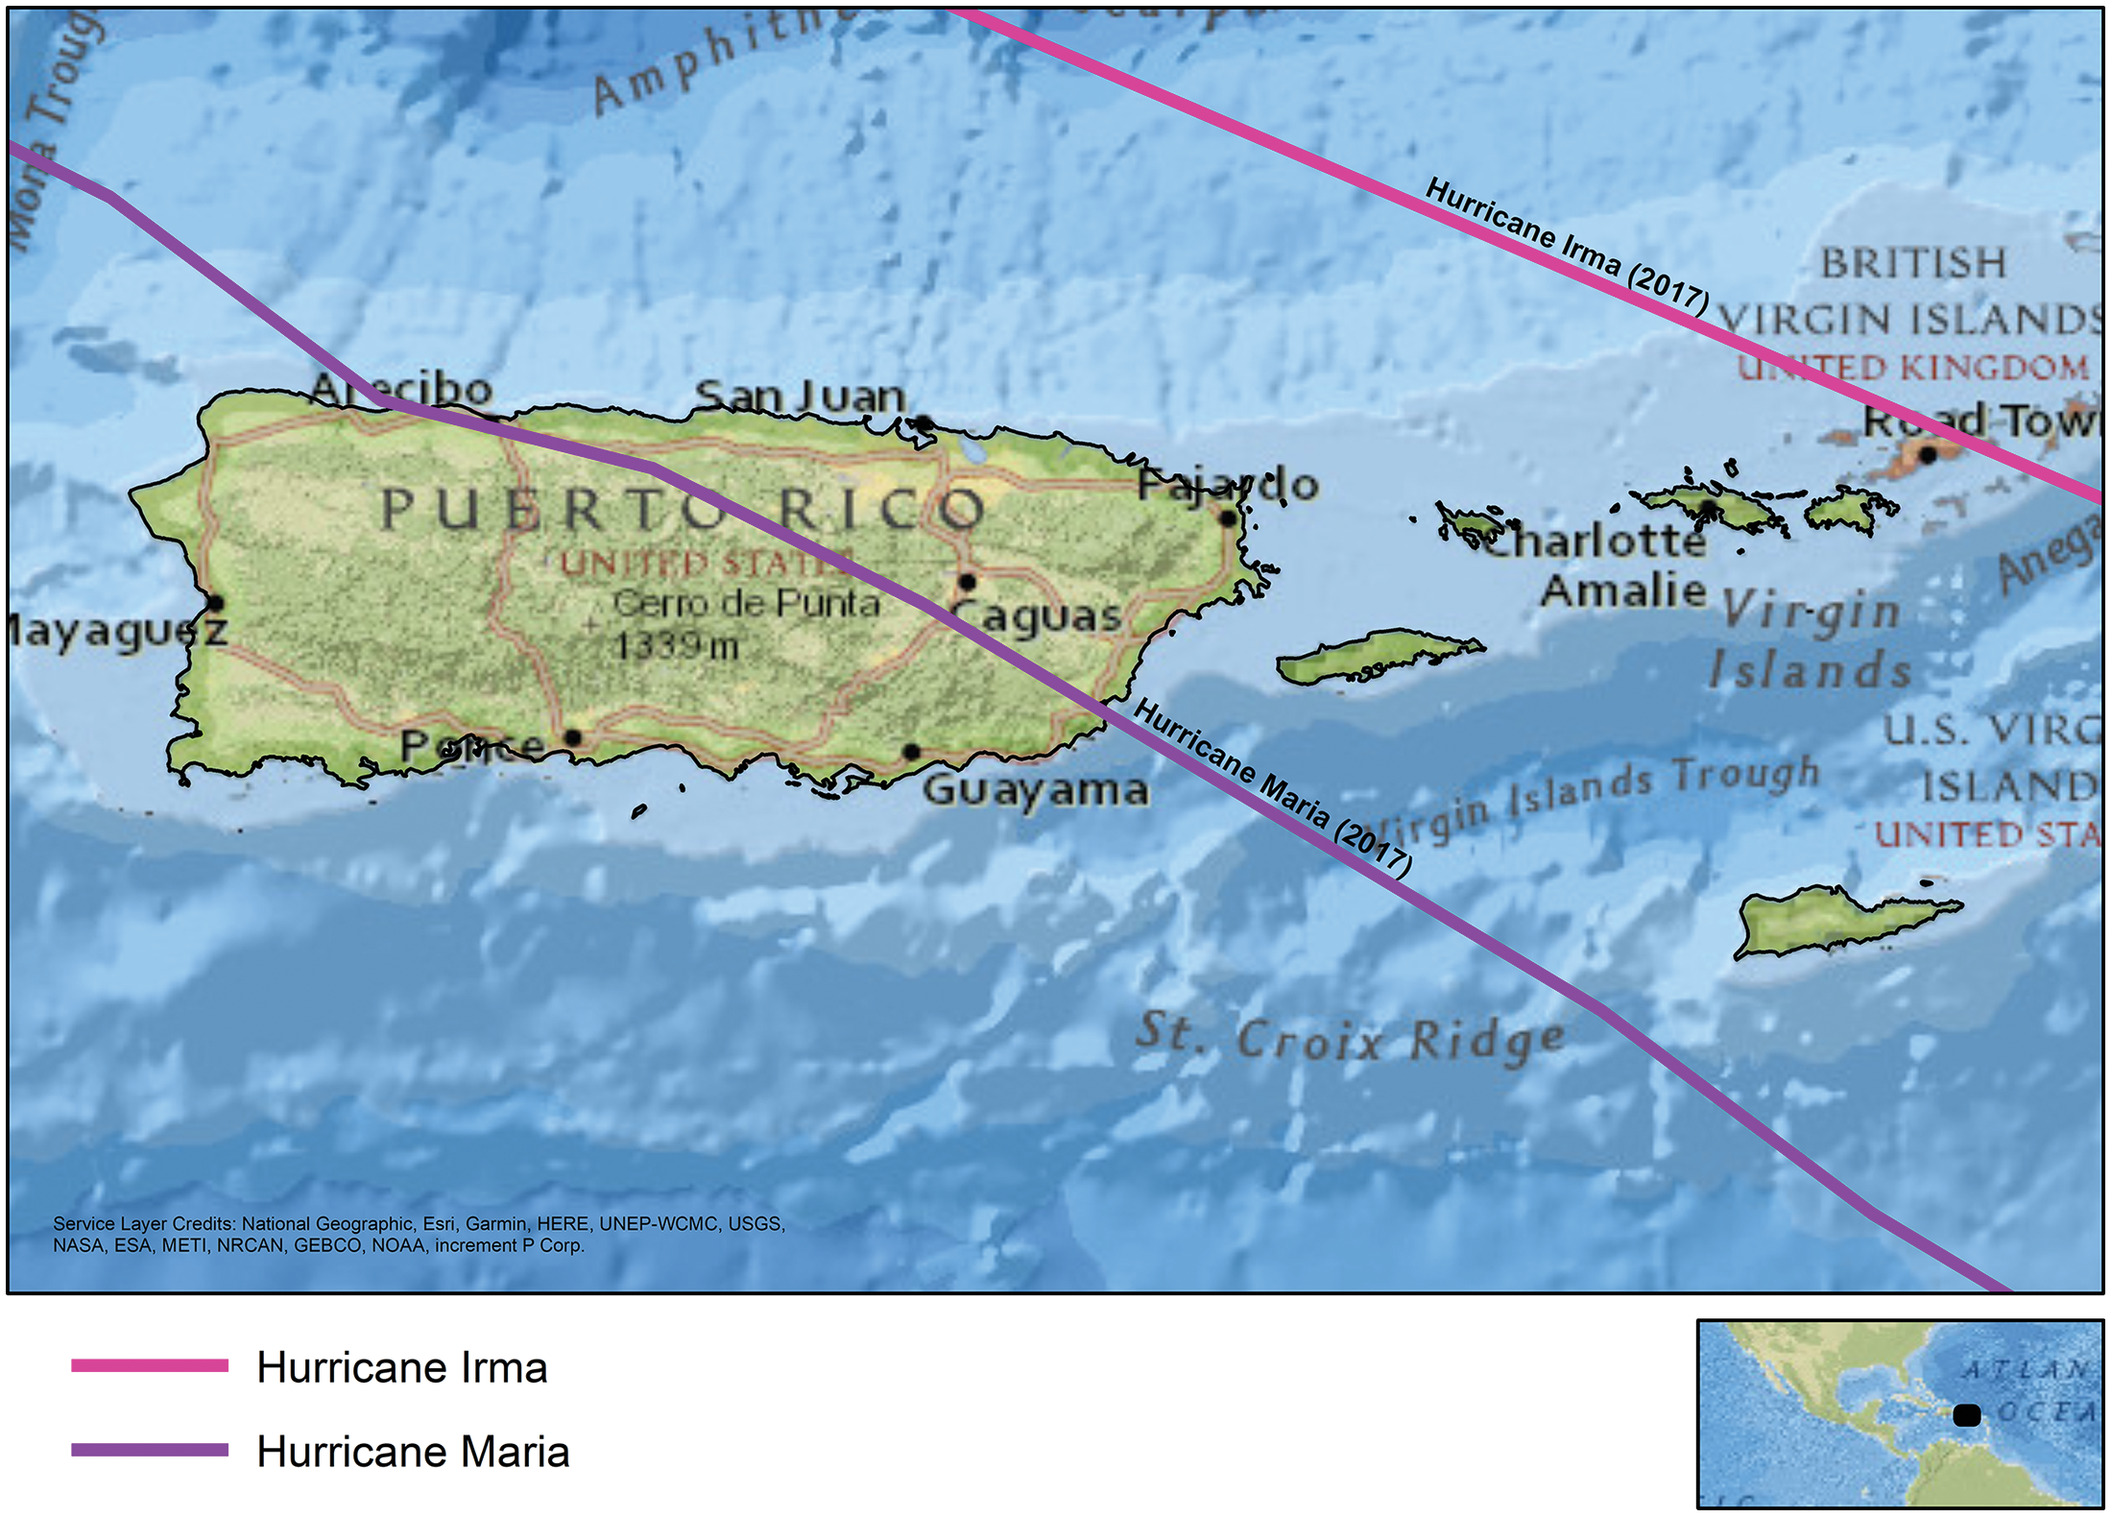
In 2017, Hurricanes Irma and Maria impacted the US territories of Puerto Rico (PR) and the US Virgin Islands (USVI) (Fig. 1). On September 6, Hurricane Irma passed just to the north of the USVI and PR as a Category 5 hurricane, and 2 weeks later, on September 20, Hurricane Maria passed just to the south of St. Croix, USVI, as a Category 5 hurricane, then made landfall near Yabucoa, PR, as a strong Category 4 hurricane, compounding the damage wrought by Hurricane Irma (FEMA 2018b, c).
The need for a validated and publicly available risk assessment and economic loss estimation tool to estimate hurricane impacts, damage, and losses became evident during and immediately after these storms as various federal, territorial, and local emergency managers worked to quickly identify the hardest-hit locations and provide effective response and recovery assistance. The Hazus Hurricane Model (FEMA 2021a; Vickery et al. 2006a, b), henceforth referred to as Hazus or the model, is the most widely used freely available hurricane wind loss model in the United States; however, its geographic scope at the time of these storms did not yet include PR and the USVI.
In this paper, we present the development, implementation, and validation of several new data sets required in Hazus to assess the vulnerability of buildings in PR and the USVI to hurricane winds. The new data sets include a comprehensive building inventory, estimates of the relative frequencies of various architectural and structural features of buildings that are relevant to their performance in high winds, estimates of aerodynamic surface roughness, a simplified inventory of tree coverage and characteristics relevant to tree blowdown and tree debris management, and deterministic wind field footprints. A companion paper (Vickery et al. 2023) describes the development of a new probabilistic hurricane event set for PR and the USVI and the development of 1,040 new sets of wind fragility and vulnerability functions for types of single-family (SF) construction commonly found in PR and the USVI but not previously modeled in Hazus.
A driver behind the addition of new building characteristics and associated vulnerability functions for SF homes is the long-standing pattern of informal construction in the region. Informal construction is that completed outside of the normal design and permitting process, and that therefore may not be code compliant. Garcia (2020) cites a 2018 study of the Puerto Rico Builders Association that estimates the number of informal, unpermitted homes and commercial buildings to be between 585,000 and 715,000, or 45%–55% of all buildings. In addition, Viglucci (2018) notes that although current building codes in PR are robust and appropriate for the hurricane dangers faced, at least 65% of legally built homes were constructed before 1980 when weaker building codes were in place. Similar surveys on the frequency of informal construction are not available for the USVI, but a FEMA damage assessment team (FEMA 2018c) found that the USVI has, in aggregate, had a better history of hazard-resistant building codes and code enforcement than PR.
Data Development
The data sets developed to extend the applicability of the model to PR and the USVI are grouped into eight categories: (1) building inventory, (2) wind-related building characteristics, (3) wind-related building characteristics mapping schemes, (4) surface roughness, (5) tree inventory data, (6) deterministic wind field footprints, (7) probabilistic hazard event footprints, and (8) building fragility and vulnerability functions. The development of the seventh and eighth data sets are described in a companion paper by Vickery et al. (2023). The remainder of this paper focuses on the development of the first six data sets and the implementation, validation, and calibration of Hazus.
Building Inventory
In Hazus, buildings in the general building stock (GBS) are classified using one of seven general occupancies: residential, commercial, industrial, agriculture, religious, government, and education. These general occupancies are further refined into 33 specific occupancies (FEMA 2021a). Residential structures, for example, have six specific occupancy types, ranging from SF homes to nursing homes. The GBS is also classified by type of construction. The five general building types (GBTs) used in each of the Hazus hazard models are wood, masonry, concrete, steel, and manufactured housing.
Building counts, floor areas, and replacement values were aggregated for each census block and tract in PR and the USVI using building footprints derived from lidar data for PR (FEMA 2019, 2021b) and parcel data for the USVI (USVI GIS Division Office 2018). For this project, the PR footprint data were reprocessed to remove overlapping polygons and slivers as documented in FEMA (2021b), and the building counts, areas, and values were updated using the existing methods documented in FEMA (2019).
Wind-Related Building Characteristics
To address construction practices that are frequently found in PR and the USVI, several new wind-related building characteristics (WBCs) have been added to the model for better coverage of the roofing systems and window types found in one- and two-family homes in the two territories. For brevity, we shall refer to these structures as SF homes. Such structures were determined to account for 92% of the buildings in the two territories (FEMA 2021b; USVI GIS Division Office 2018).
Roof Cover
To supplement existing shingle roof cover models, four new roofing materials were added to the model: (1) elastomeric coatings applied to plywood roof decks, (2) corrugated steel roofs, (3) standing seam metal roofs, and (4) concrete roofs.
Elastomeric roof covers are applied as a thick, liquid coating that becomes waterproof when dried. Such roof systems are popular due to their affordability, energy savings, and compatibility with rain catchment systems. Approximately 17% of single-story wood-frame houses and 29% of multistory wood-frame houses in the US Virgin Islands have elastomeric roof coverings. The corresponding figures for masonry houses are 20% and 25%, respectively (USVI GIS Division Office 2018). Elastomeric roof coverings are much less common in PR, but no specific data sources were found. Therefore, the default frequency of elastomeric roofs in PR was set to 0% for each type of SF construction.
On houses with corrugated steel and standing seam metal roofs, two levels of attachment strength were modeled. For lower-cost corrugated roofs, the weak and strong attachment options are nails and screws, respectively. For the more resistant standing seam metal roofs, the weak and strong attachment options are clips and exposed fasteners, respectively.
On houses with standing seam metal roof covers, secondary water resistance (SWR) was included as a mitigation option. SWR is a waterproof seal that prevents rain from entering the attic through the spaces between the roof sheathing panels when the primary roof cover fails and is more likely to be used beneath standing seam metal roof covers. Further details on the modeling of the new roof covering options are provided in a companion paper by Vickery et al. (2023).
Jalousie Windows
Jalousie windows, with parallel louvers that can be tilted open or closed in unison, are also common in the island territories. Jalousie windows are assumed to have greater uncertainty in their resistance to wind pressure and windborne debris than conventional windows (Vickery et al. 2023).
Wind Building Characteristics Mapping Schemes
Mapping schemes allow Hazus users to efficiently model regional construction practices, building code histories, and local mitigation efforts without having to gather detailed information on each individual building in their study region. In the hurricane model, the building inventory is characterized using a three-tier hierarchy of mapping schemes: (1) GBT, (2) specific building type (SBT), and (3) WBC. GBT and SBT distributions are defined for each specific occupancy, whereas WBC distributions are defined separately for each SBT. We refer to each permitted combination of SBT and WBCs as a wind building type (WBT).
The five GBTs—wood, masonry, concrete, steel, and manufactured housing—are common to each of the four Hazus hazard models. For hurricane wind loss estimation, there are 39 SBTs and 5,996 WBTs. The 39 SBTs are unchanged from previous versions of the hurricane wind model (FEMA 2018a), but the number of WBTs represents an increase of 1,040 (21%) over previous versions of the model. The new WBTs are associated with the four SF SBTs: wood-framed single story (WSF1), wood-framed multistory (WSF2), masonry single story (MSF1), and masonry multistory (MSF2). For each WBT, the model requires a set of nine fragility and vulnerability functions for each of the five reference terrains. These damage and loss functions are functions of peak gust wind speed in open terrain. The development of the fragility and vulnerability functions for the 1,040 new WBTs is described in a companion paper by Vickery et al. (2023).
For each SBT, a set of valid WBCs was defined. For example, hip roof shape is included as a WBC for the SF SBTs, but it is not included for SBTs that typically have flat roofs, such as masonry strip malls or concrete high-rise buildings. For each valid SBT-WBC pairing, the percentage of the SBT population having that WBC must be specified. The resulting percentages for all valid SBT-WBC pairings comprise a single WBC mapping scheme.
A partial example of a WBC mapping scheme is provided in Table 1. In this partial example, there are 32 possible WBTs (2 roof shapes × 2 SWR possibilities × 4 roof deck attachments × 2 roof–wall connections), each with its own set of fragility and vulnerability functions and a weighting determined by the appropriate WBC percentages. For simplicity, the relative frequency of each WBC is assumed to be independent of the other WBCs.
| Category | Wind building characteristic | Percent distribution |
|---|---|---|
| Roof shape | Hip | 19 |
| Gable | 81 | |
| Total | 100 | |
| Secondary water resistance | Yes | 0 |
| No | 100 | |
| Total | 100 | |
| Roof deck attachment | 6d nails at spacing | 37 |
| 8d nails at spacing | 33 | |
| mix at spacing | 0 | |
| 8d nails at spacing | 30 | |
| Total | 100 | |
| Roof–wall connection | Toe-nail | 23 |
| Strap | 77 | |
| Total | 100 |
The existing Hazus southeast coastal SBT and WBC mapping schemes were selected as the starting points for new PR and USVI mapping schemes. However, as noted previously, several new WBCs were added to the SF SBTs for the island territories. In addition, several of the existing southeast coastal SBT and WBC percentages were modified. The methods used to estimate the relative frequencies of each WBC are summarized in Table 2 and discussed subsequently. The data sources and methods used include (1) tax assessor data, (2) visual inspection (either manual or machine learning), (3) local building code history and construction practices, and (4) engineering judgment. The estimates for PR and the USVI were developed by separate teams using separate data sources and, in some cases, different assumptions, as discussed in the following.
| Wind building characteristic | Collection methods |
|---|---|
| General building type | Tax assessor data, machine learning, and engineering judgment |
| Specific building type | Tax assessor data, machine learning, and engineering judgment |
| Roof shape | Sampled: orthophotography, street view photos (PR) |
| Sampled: orthophotography, street view photos, and tax assessor data (USVI) | |
| Secondary water resistance | Defaulted: weakest characteristic |
| Roof deck attachment | Defaulted: weakest characteristic |
| Roof–wall connection | Inferred: census year built (PR) |
| Inferred: tax assessor data and year built (USVI) | |
| Shutters | Sampled: street view photos |
| Garages | Sampled: street view photos |
| Roof cover typea | Sampled: machine learning and street view photos (PR) |
| Sampled: orthophotography (USVI) | |
| Roof quality | Defaulted: Hazus southeast coastal mapping scheme (PR) |
| Inferred: tax assessor data (USVI) | |
| Masonry reinforcing | Defaulted: Hazus southeast coastal mapping scheme (PR) |
| Inferred: Hazus earthquake data (USVI) | |
| Roof deck age | Defaulted: Hazus southeast coastal mapping scheme (PR) |
| Inferred: tax assessor year built (USVI) | |
| Roof frame type | Defaulted: Hazus southeast coastal mapping scheme |
| Windborne debris environment | Sampled: spatial analysis |
| Metal roof deck attachment | Defaulted: Hazus southeast coastal mapping scheme (PR) |
| Inferred: tax assessor year built and building code research (USVI) | |
| Joist spacing | Defaulted: Hazus southeast coastal mapping scheme (PR) |
| Inferred: tax assessor year built and building code research (USVI) | |
| Number of units | Defaulted: Hazus southeast coastal mapping scheme (PR) |
| Sampled: orthophotography (USVI) | |
| Window area | Sampled: street view photos |
| Tie downs | Defaulted: weakest characteristic (PR) |
| Inferred: tax assessor year built and building code research (USVI) | |
| Metal fasteninga | Defaulted: Hazus southeast coastal mapping scheme (PR) |
| Defaulted: corrugated metal roofs have weak fasteners; standing seam metal roofs have strong fasteners (USVI) | |
| Window typea | Sampled: street view photos |
Note: Sampled = attribute frequency collected from a random sampling of individual structures; inferred = attribute frequency inferred from related data, such as year built and engineering judgment; and defaulted = attribute frequency assigned based on engineering judgment or taken from an existing Hazus mapping scheme for another region.
a
New building characteristic.
The project team utilized machine learning to predict metal versus concrete roof cover classifications, wood-frame versus masonry building classifications, and single- versus multistory building classifications. The methodology involved training boosted regression tree models (BRTMs) on field-verified data using aerial imagery of individual rooftops and the geometries and lidar-derived heights of individual building footprints. The training data were derived from FEMA substantial damage estimation (SDE) inspections following Hurricane Maria, which involved 8,794 residential structures with information on roof cover type, construction type, and number of stories. These structures served as ground-truth values for the training.
The inputs to the models included the mean, standard deviation, and deciles of the aggregate pixels for each rooftop image for each red, green, blue, and infrared channel, and after conversion for each hue, saturation, and value channel; the deciles, fifth percentile, and 95th percentile of the aggregate lidar-derived height values across each building footprint on a 0.5-m grid; and various geometric features of the building footprints, such as the area, perimeter, and length of the minimum bounding rectangle. Separate models were developed for roof cover type, construction type, and number of stories. For the construction type and number of stories, the models used random undersampling on the majority class of the data set to balance out the class distributions. Approximately 20% of the remaining sample data was held out of training for use in testing. The machine learning methodology and results are described in more detail in FEMA (2021b).
On the test data, the best-performing roof cover model achieved approximately 86% accuracy and 91% mean average precision; the best-performing superstructure model achieved 82% accuracy and 89% mean average precision; and the best-performing number of stories model achieved 86% accuracy and 87% mean average precision. Every building footprint on the island was then run through the final models to estimate the relative frequencies of roof cover type, construction type, and number of stories.
The total numbers of buildings in PR and the USVI were estimated to be 1,406,245 and 45,154, respectively. Table 3 lists the estimated numbers of buildings to which each of the sampled WBCs is applicable. For example, roof shape is applicable to 10 of the 39 SBTs, which comprise 1,215,941 of the structures in PR and 34,319 of the structures in the USVI. For each of the sampled WBCs, random samplings of buildings were drawn to estimate their relative frequencies. The target sample sizes provided in Table 3 are the sample sizes required to achieve 95% confidence that the sampled frequencies will be within of the actual frequencies. In most cases, we were able to meet or exceed the target sample sizes; however, some of the actual sample sizes for PR were less than the target sample sizes due to data availability constraints and resource limitations.
| Wind building characteristic | PR | USVI | ||||
|---|---|---|---|---|---|---|
| SBT count | Target sample size | Actual sample size | SBT count | Target sample size | Actual sample size | |
| Roof shape | 1,215,972 | 385 | 311 | 34,319 | 380 | 27,603 |
| Shutters | 1,406,245 | 385 | 378 | 45,144 | 381 | 774 |
| Garages | 1,211,772 | 385 | 287 | 29,569 | 380 | 412 |
| Roof cover type | 1,406,245 | 385 | 382 | 45,144 | 381 | 8,214 |
| Windborne debris environment | 186,876 | 384 | 71,108 | 9,961 | 370 | 9,961 |
| Number of units | 0 | 0 | 0 | 2,111 | 326 | 632 |
| Window area | 186,876 | 384 | 63 | 7,296 | 365 | 565 |
| Window type | 1,211,772 | 385 | 279 | 29,569 | 380 | 593 |
Surface Roughness
Aerodynamic surface roughness, created by vegetation, buildings, and other obstructions, reduces mean wind speeds and increases wind turbulence near the surface of the earth. Buildings located in rougher terrain experience different wind pressures and windborne debris environments than buildings located in smoother, more open terrain. To account for these differences, the fragility and vulnerability functions used in the model are a function of both the peak gust wind speed in open terrain and the local surface roughness (FEMA 2021a).
In Hazus, each census tract and census block is assigned a characteristic roughness length, denoted by . The roughness lengths developed for PR and the USVI were modeled following the same approach used for the continental United States (CONUS) (FEMA 2021a), but with two improvements: the first concerning the use of tree canopy percentage and the second concerning the averaging of roughness lengths for individual census block or tracts.
Tree canopy percentage is incorporated into the computation of surface roughness for two land use/land cover (LULC) categories: developed, open space and developed, low intensity (MRLC 2003, 2019). For CONUS, the average tree canopy percentage in each of these two LULC categories in each county was used to adjust their roughness length estimates. However, for PR and the USVI, the methodology has been refined to apply the tree canopy adjustments for these two LULCs on a pixel-by-pixel basis.
For census blocks larger than , the average values for PR and the USVI were computed using all of the pixels within the block plus an additional buffer of 500 m beyond the block boundary. In blocks smaller than in area, the average values were computed based on a circular area with a radius of 500 m centered on the census block centroid to ensure a minimum fetch of approximately 500 m. The same rules were used for computing census tract averages.
For PR, raster data layers of the most recently available LULC (MRLC 2003) and tree canopy percentage layers (MRLC 2019) from the National Land Cover Database (NLCD) were used to determine the surface roughness (). The PR LULC classes are listed in Table 4. In areas where tree canopy coverage could not be determined due to obstructions in satellite images, such as shadows or clouds, the municipio (county-equivalent) average tree canopy value for the appropriate LULC was used.
| US and Puerto Rico LULCs (LULC No.) | Corresponding USVI LULCs (LULC No.) | PR (mm) | USVI (mm) |
|---|---|---|---|
| Open water (11) | Water (13) | 3 | 3 |
| Perennial ice/snow (12) | N/A | 12 | N/A |
| Developed, open space (21) | Developed open space (7) | 100 | 150 |
| Developed, low intensity (22) | Developed low intensity (5) | 400 | 300 |
| Developed, medium intensity (23) | Developed medium intensity (6) | 450 | 350 |
| Developed, high intensity (24) | Developed high intensity (4) | 450 | 400 |
| Barren land (31) | Barren (2) | 80 | 70 |
| Deciduous forest (41) | N/A | 900 | N/A |
| Evergreen forest (42) | Forest (8)a | 900 | 900 |
| Mixed forest (43) | N/A | 900 | N/A |
| Shrub/scrub (52) | Shrub (12) | 300 | 150 |
| Grasslands/herbaceous (71) | N/A | 150 | N/A |
| Pasture/hay (81) | N/A | 50 | N/A |
| Cultivated crops (82) | Cultivated (3) | 100 | 100 |
| Woody wetlands (90) | Wetland (14)b | 900 | 200 |
| Emergent herbaceous wetlands (95) | N/A | 100 | N/A |
| N/A | Airport (1) | N/A | 30 |
| N/A | Rangeland (10) | N/A | 200 |
| N/A | Seaside (11) | N/A | 200 |
a
It was assumed that the forest LULC for the USVI mapped to evergreen forest rather than deciduous or mixed forest in Puerto Rico because the NLCD land cover data for Puerto Rico only included evergreen forest.
b
Wetlands for the USVI were mapped to woody wetlands for Puerto Rico. However, wetlands included a mix of woody and emergent herbaceous wetlands.
The NLCD does not include a LULC layer for the USVI; therefore, a locally developed layer with a different classification scheme was used (G. Guannel, unpublished data, 2020). The mapping of the USVI LULC categories to those of PR and CONUS is summarized in Table 4.
The NLCD 2016 tree canopy cover data layer for PR (MRLC 2019) also includes the USVI and was used to adjust the roughness estimates for USVI developed, open spaces and developed, low-intensity spaces (FEMA 2021b). Both the LULC and tree canopy cover data are at 30-m resolution, but the two layers are not perfectly aligned, so the nearest tree canopy pixel was used to compute the roughness adjustments for the developed, open space and developed, low-intensity pixels.
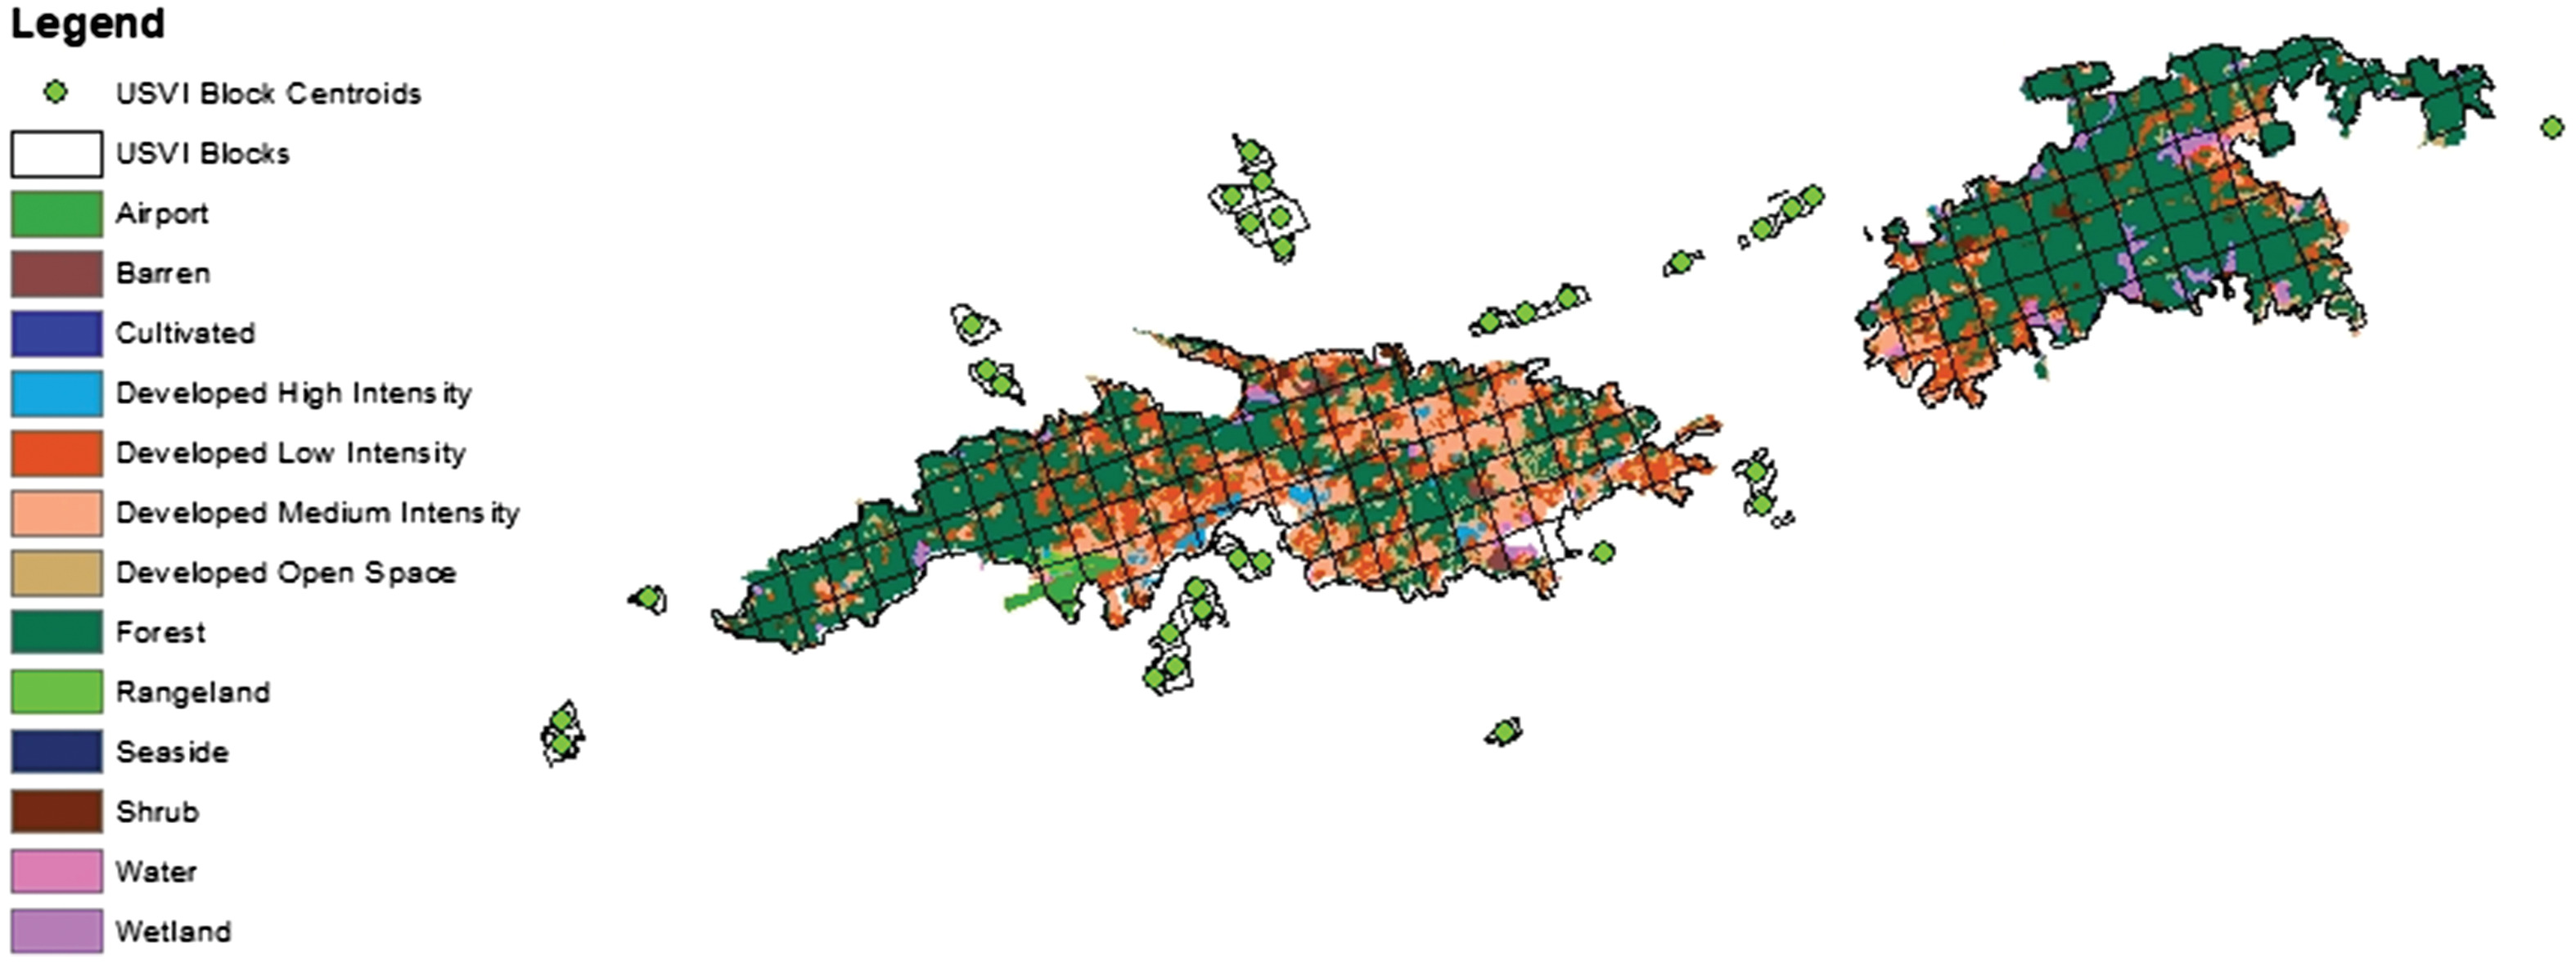
For the USVI, a uniform grid of blocks is used by the Hazus Tsunami Model in place of actual census blocks. For consistency across the hazard models, the same grid of blocks is used by the hurricane model. Unfortunately, LULC data were not available for 32 blocks that intersect several of the smaller islands, as denoted by the filled circles in Fig. 2. Based on overhead imagery, it was observed that these islands were all heavily treed. Therefore, the block surface roughness values () were computed as a weighted average of the original, unbuffered block area and the buffered block area, for which the unbuffered block area was assigned a of 900 mm and the buffered area was assigned a of 3 mm. There was also one entire census tract on St. Thomas (78030082000) for which no LULC data were available. For this tract, the average of the visually derived block values within the tract was used.
Tree Coverage Database
Hazus includes methodologies for estimating the expected volume of tree debris generated by hurricanes and the added damage to SF homes and manufactured housing due to tree fall. To model tree debris volume and tree fall damage, the model requires a predominant tree type (coniferous, deciduous, or mixed), a tree density (stems per acre), a tree height distribution, and a tree debris collection factor for each census tract or block (FEMA 2021a).
Tree Inventory Data by County
The predominant tree type and tree height distributions are assigned by county. Throughout both PR and the USVI, evergreen softwood trees are most common. In fact, all the forested areas in PR are classified as evergreen forest in the 2001 NLCD. In Hazus, evergreen trees are modeled using typical strength and drag characteristics of pine trees and are designated as coniferous. Thus, the predominant tree type for all census tracts and blocks in PR and the USVI was set to coniferous, because this is the best option currently available for tropical evergreens.
The tree height distributions for each county were derived from the US Forest Service (USFS) Forest Inventory Analysis (FIA) database (USFS 2018a, a). In Hazus, only trees greater than 9.1 m (30 ft) in height are considered, because impacts from shorter trees are unlikely to significantly damage homes, and shorter trees do not typically constitute a substantial portion of the overall tree debris weight, or volume after chipping, in most hurricane-prone areas.
The FIA provides tree heights for all trees located within a stratified sampling of plots or subplots in forest land within each county or county-equivalent area. The species, diameter, height, and other characteristics are recorded for each tree that is greater than 25 mm (1 in.) in diameter. The number of trees per acre represented by each sampled tree iswhere = unadjusted trees per acre from XX_TREE table, the number of sampled trees per acre; EXPNS = plot expansion factor from XX_POP_PLOT_STRATUM_ASSGN table, the number of acres that the sampled plot represents; = subplot adjustment factor from XX_POP_STRATUM table, an adjustment factor to account for partially nonsampled plots (access denied or too hazardous); and XX = state or territory (i.e., PR or VI).
(1)
FIA survey data for both live and dead trees were included in the computations. For PR, 2019 inventory data were used, and for the USVI, 2014 inventory data are used. These were the most recently available inventory years for each territory. The results for the USVI are provided in Table 5.
| County code | Island | Tree type | (30 ft) | Stems/ha (stems/acre) | Short (%) | Medium (%) | Tall (%) |
|---|---|---|---|---|---|---|---|
| 78010 | St. Croix | Coniferous | 1,888,991 | 158 (64) | 89 | 11 | 0 |
| 78020 | St. John | Coniferous | 1,401,558 | 353 (143) | 77 | 22 | 1 |
| 78030 | St. Thomas | Coniferous | 653,641 | 215 (87) | 94 | 6 | 0 |
An equivalent set of results was developed for PR using the same approach. However, FIA data were not available for 10 of the 78 municipios in PR. For each of these 10 municipios, the averages of the values from two adjacent municipios were used as substitutes.
Tree Density at Census Block Level
There are four steps to determine the average tree density in each census block (FEMA 2021a). First, the average tree density for forested land was determined using Eq. (1). Second, the NLCD tree canopy percentage layer was used to compute the average tree canopy coverage of forested land or forested wetlands in each county. Third, the tree density corresponding to a tree canopy percentage of 100% was estimated for each county by assuming that the tree density and average canopy over forested areas are proportional. Finally, the average tree canopy percentage in each census block was multiplied by its county’s tree density at 100% tree canopy. In blocks where tree canopy cover data were not available due to obstructions in satellite images such as shadows or clouds, the county average tree canopy percentage was used.
Tree Debris Collection Factors
The methodology for estimating tree debris collection quantities is based on the premise that downed trees lying near streets, buildings, and other developed areas will most likely be cut and moved to the roadside for collection and disposal as outlined by FEMA (2021a). In moderately or densely built areas, virtually all downed trees are likely to be collected. In sparsely built or undeveloped areas, only a fraction of trees downed are likely to be collected.
The parameters required for the Hazus tree debris collection model are the census block area, the block perimeter, the number of buildings per acre in the block, and the total length of any roadways that lie within the block. The areas, perimeters, and building densities for each census block come directly from the census block shapefiles (US Census Bureau 2019) and the Hazus building inventory.
To compute the total length of interior roadways, roadway shapefiles were downloaded from the US Census Bureau (2019). For PR, a negative buffer of 7.6 m (25 ft) was applied to each census block to avoid double counting of roads that are already accounted for in the block perimeter. For the USVI, Hazus uses a uniform rectangular grid of blocks in place of actual census block boundaries. Because the USVI block boundaries are not defined by roads, no negative buffer was applied when computing the total length of all roads within each USVI block.
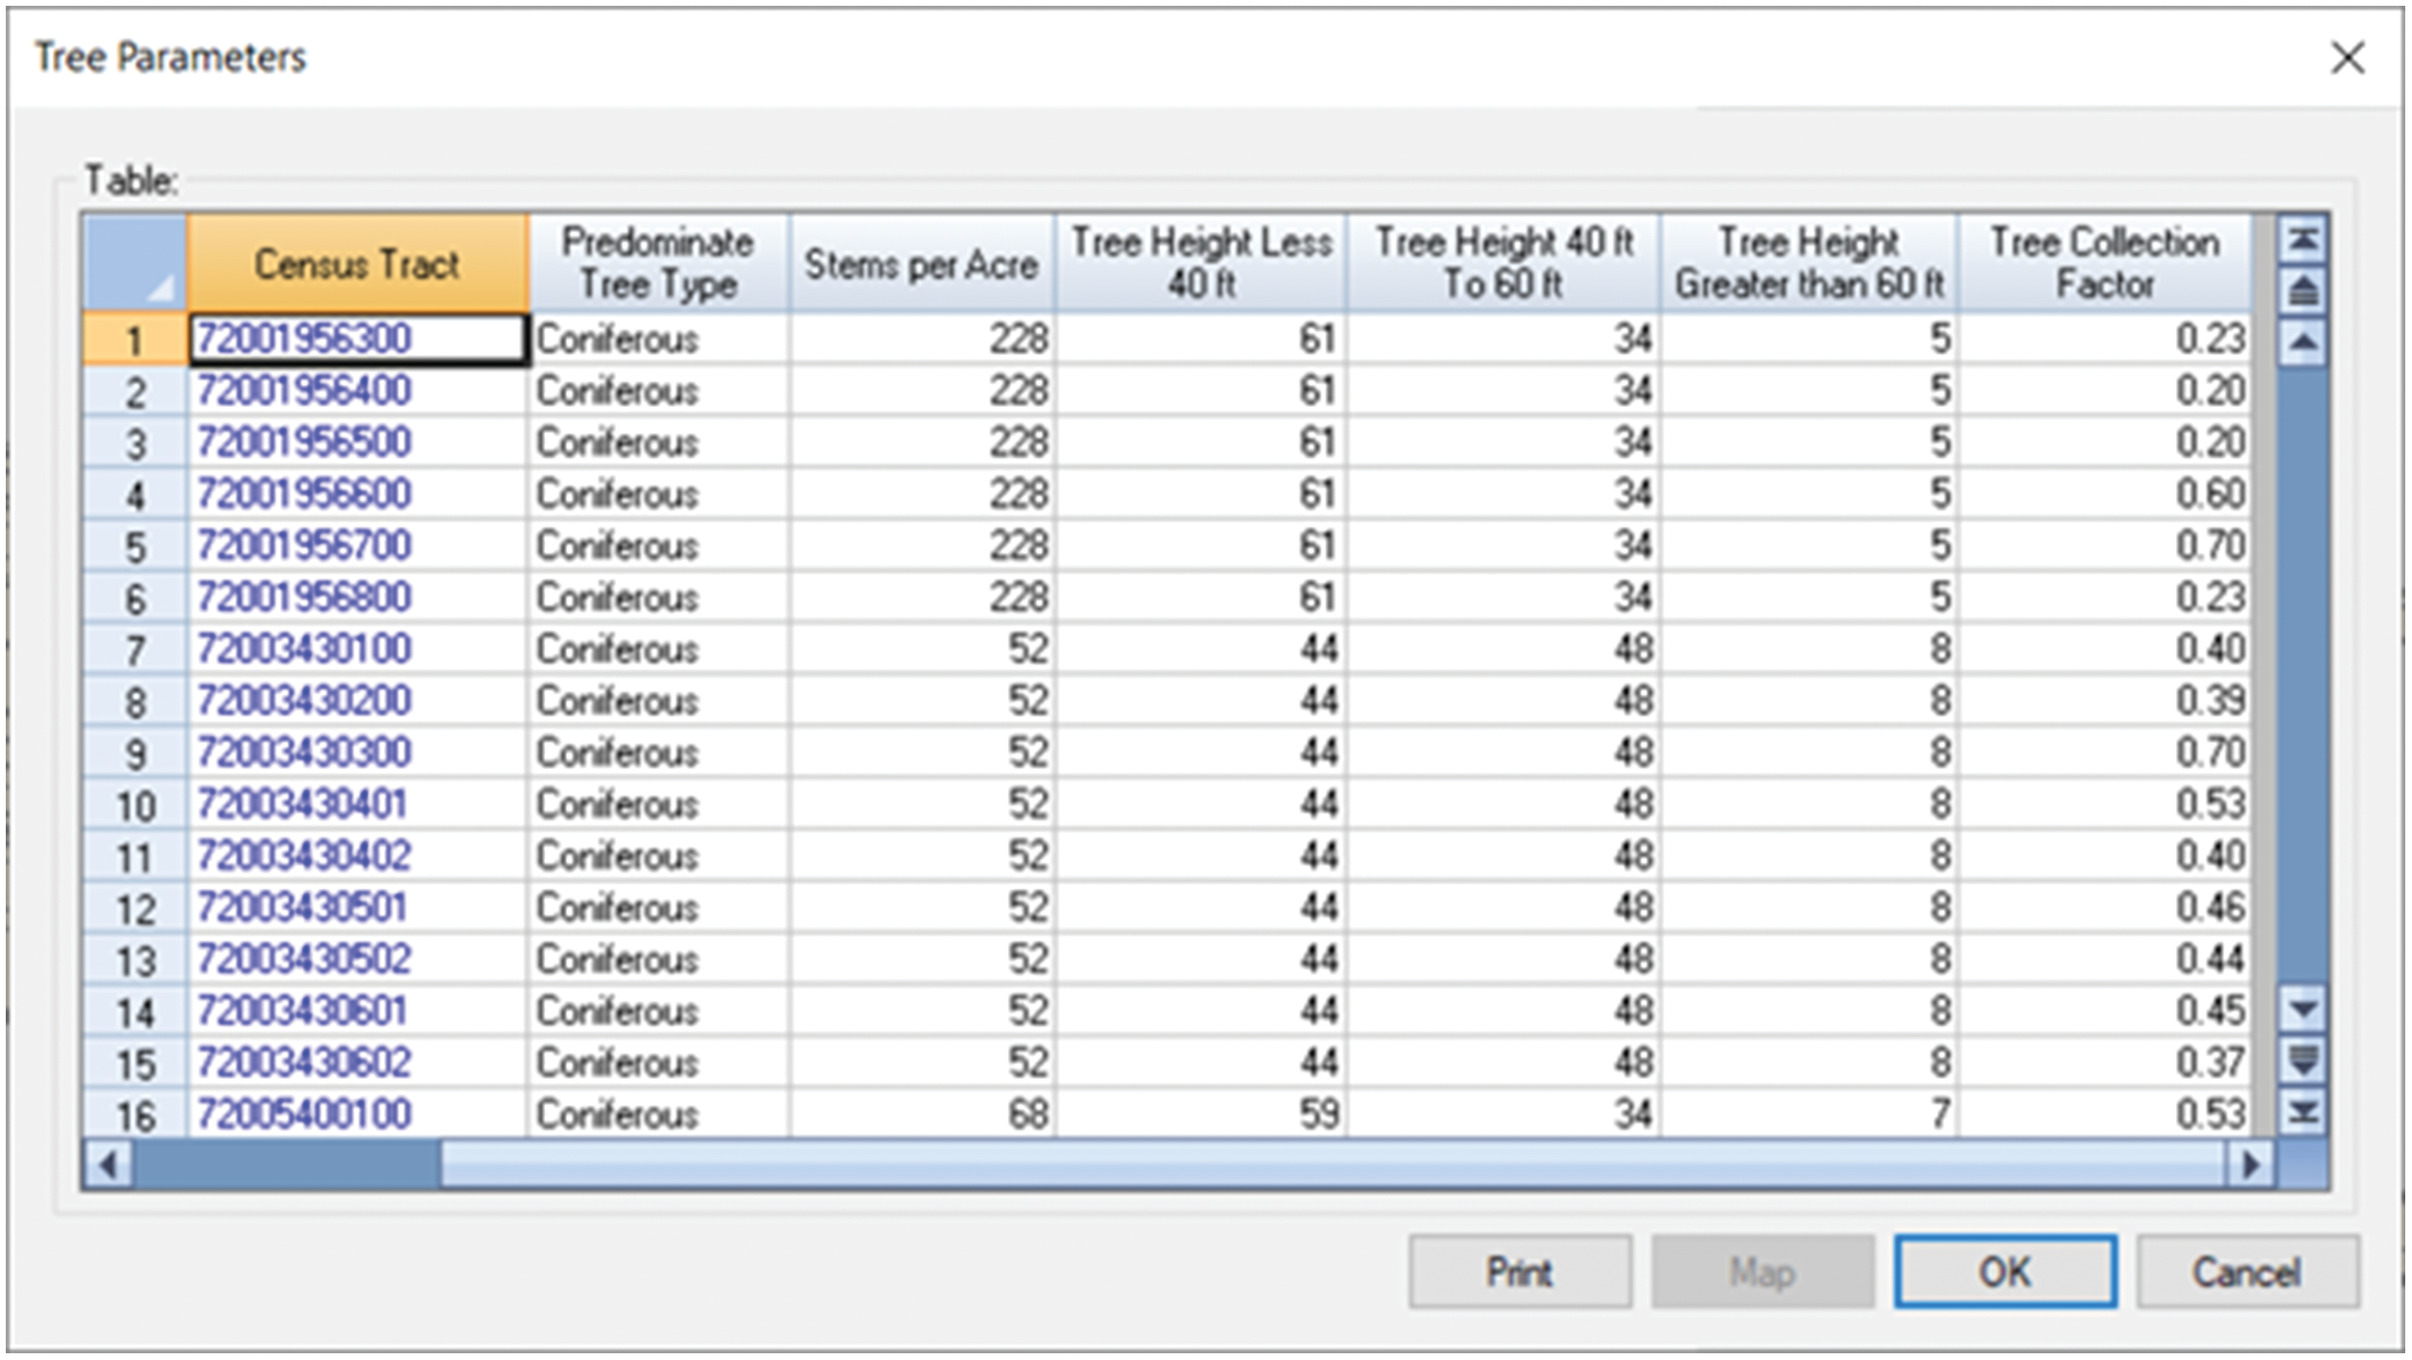
A screenshot showing the final tabulated tree parameters for the first 16 census tracts in PR as they appear in Hazus is shown in Fig. 3. For study regions that include both hurricane and flood hazards, Hazus operates at the census block level of resolution. For such study regions, the rows in the tree parameters table are census blocks instead of census tracts. All of the other column headings remain the same.
Wind Field Data
Hazus includes a capability to model wind speeds at each census tract centroid in a study region given either an imported National Hurricane Center forecast-advisory or a user-defined storm track. In addition to the storm track parameters, the model requires the distance inland from the coastline to each census tract centroid to model the transition of the hurricane boundary layer wind field from marine to overland conditions. Distance inland values are required for each of 36 wind directions in 10° increments (e.g., ). The distances were computed using a coastline from the National Oceanic and Atmospheric Administration (NOAA) Global Self-consistent, Hierarchical, High-resolution Geography Database (GSHHG) (NOAA 2019). The distances were computed using a custom program that projects a two-dimensional ray from a point in a specified direction. The point and a polygon representing the coastline are projected to Cartesian coordinates using an Albers projection. The distance to the coast is the Cartesian length of the ray from its point of origin to the point where the ray first intersects the polygon. Of the 924 census tract centroids for PR and the USVI, 29 were located outside the GSHHG coastline. These centroids were moved on land and kept close to their original locations.
Topography can create speed-up or slowdown surface-level winds depending on the direction of the wind and the contours of the terrain. At present, Hazus accounts for topographic effects in Hawai‘i but not in other areas. To partially consider topographic effects for Hurricane Maria in PR, a simplified approach was developed. Building on the work of Vickery et al. (2019) and Mudd et al. (2019), topographically adjusted, open terrain peak gust wind speeds were computed at each PR building footprint centroid and averaged over each PR census tract, producing a single updated average peak gust wind speed value for each tract (FEMA 2021b).
Model Validation and Calibration
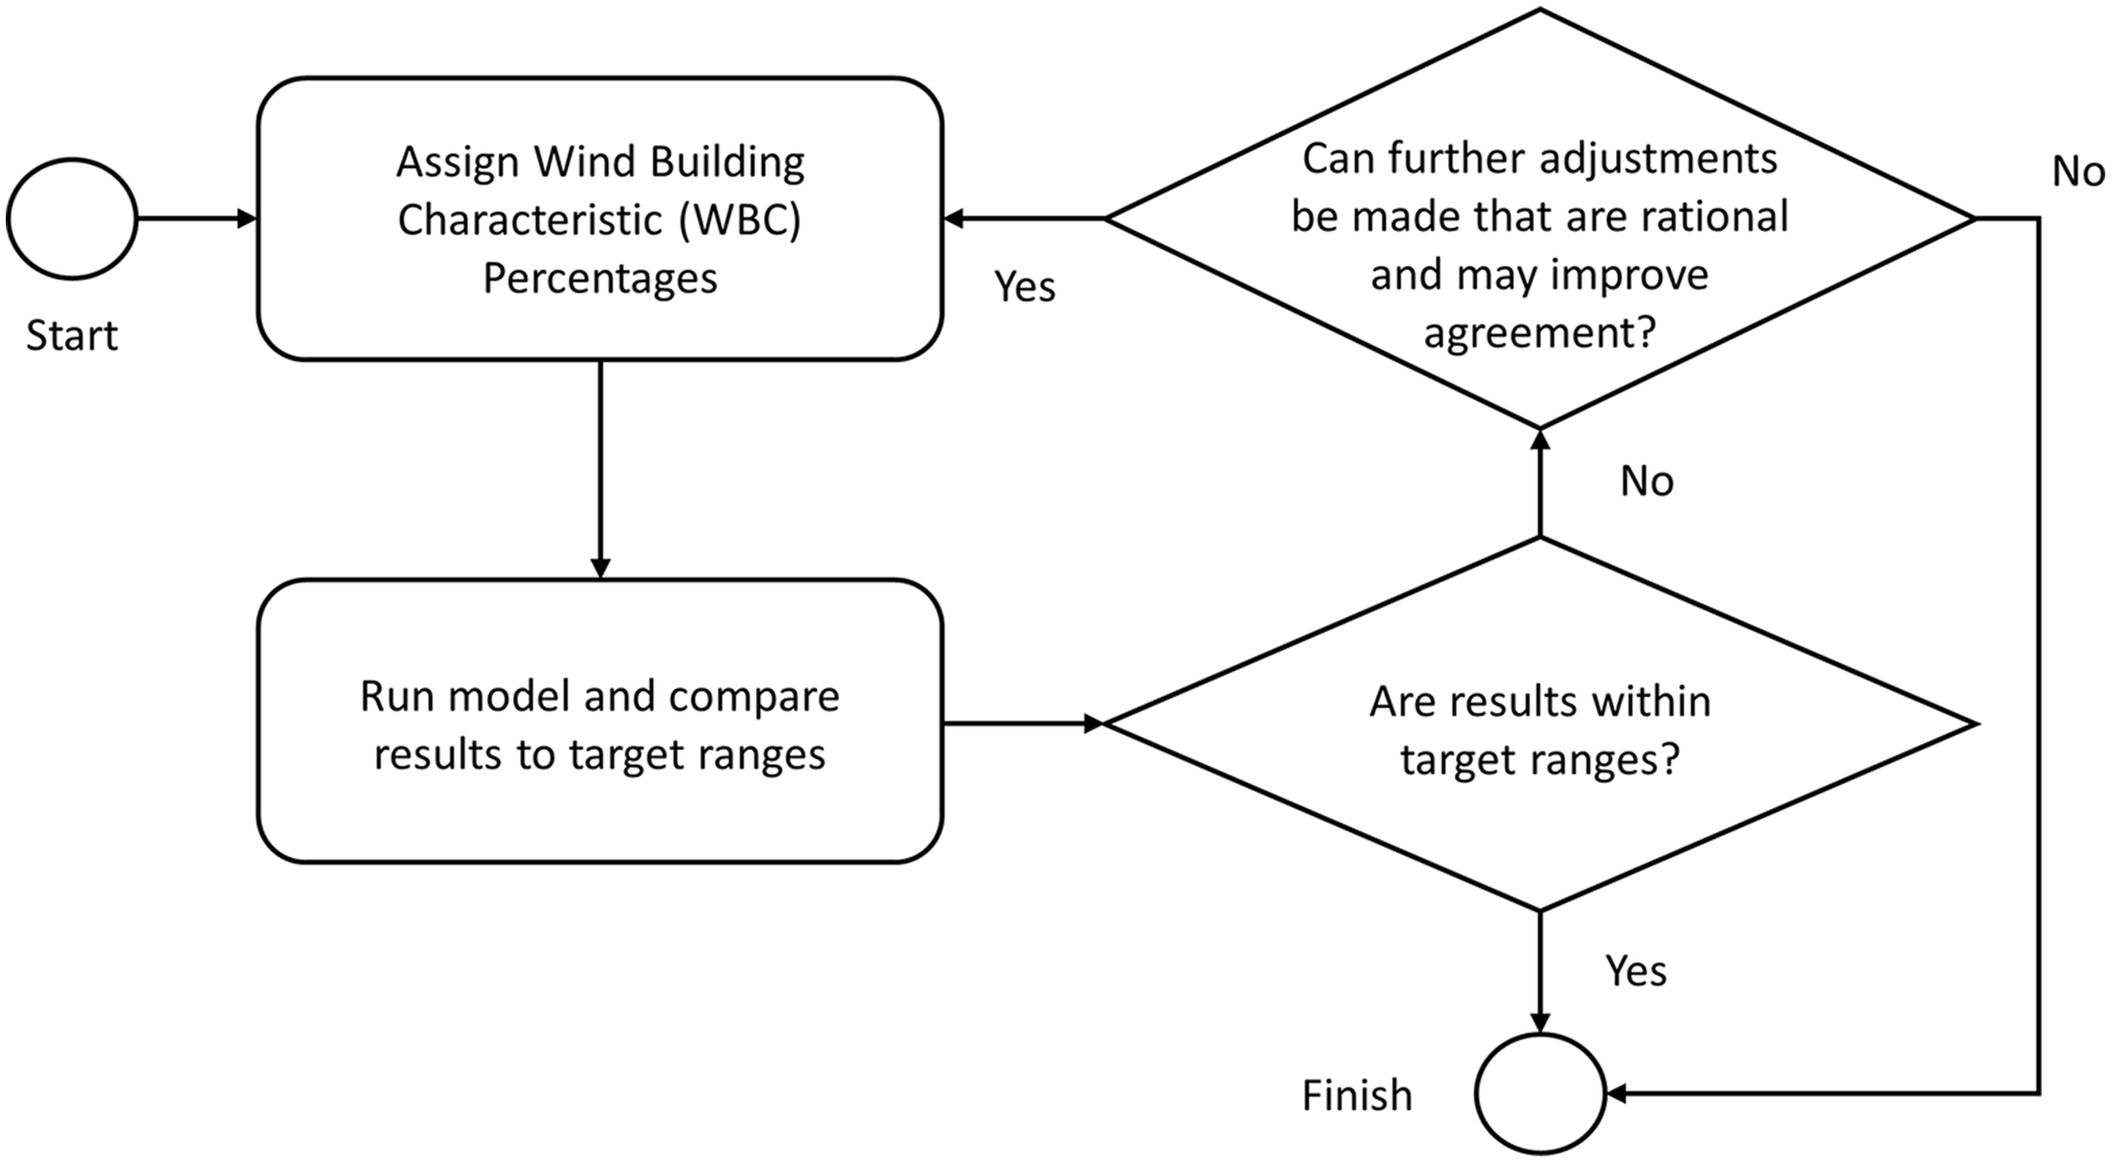
After integrating the new hazard and vulnerability data, the enhanced model was used to develop estimated losses in PR and the USVI for Hurricanes Irma and Maria. The modeled losses were then compared to published data on observed damage and loss in each territory for each event. Due to the magnitude of the impacts and the availability of more extensive postevent data, particular attention was paid to modeling the damages and losses produced by Hurricane Maria in PR. Based on these comparisons, the initial building stock assumptions for building characteristics that could not be objectively quantified were then refined and calibrated to achieve better agreement between the modeled and observed losses. A simplified representation of the validation and calibration process is provided in Fig. 4.
Damage and Loss Metrics for Model Validation and Calibration
For the purposes of this study, the metrics of greatest interest were the number of damaged housing structures and the total losses to housing buildings and their contents. The primary reference is a Homeland Security Operational Analysis Center (HSOAC) report by Fishbach et al. (2020), which documents the impacts of Hurricane Maria in PR in considerable detail. A second source is the National Centers for Environmental Information (NCEI) Billion-Dollar Weather and Climate Disasters database (Smith et al. 2021).
Fishbach et al. (2020) synthesized and extrapolated damage and loss data from several sources, including FEMA (2021c), the Department of Housing and Urban Development (HUD), the USACE, and the Small Business Administration (SBA). Table 6 provides the estimated costs to repair housing in PR damaged by Hurricane Maria. The total cost to repair all damaged housing was estimated to be $33.9 billion, with $28.5 billion, or 84.1%, of the damage occurring outside of mapped 100-year floodplains. Table 6 also provides HSOAC’s estimated breakout of damage to multifamily buildings (19.8%) versus SF homes and duplexes (80.2%).
| Occupancy group | Cost (billions of $) | Percentage of all |
|---|---|---|
| Housing outside the floodplain | 28.5 | 84.1 |
| All housing | 33.9 | 100.0 |
| All multifamily housing (3+ units) | 6.7 | 19.8 |
| All single-family and duplex housing | 27.2 | 80.2 |
Source: Data from Fishbach et al. (2020).
Table 7 summarizes HSOAC’s breakout of damage states as defined by their real property FEMA-verified loss (RPFVL) levels. As of May 2018, damage inspections had been performed on approximately 435,000 housing structures in PR for which individual assistance (IA) applications had been filed by owner-occupants. This group represents approximately 55.3% of the estimated 786,000 owner-occupied housing structures in PR. Approximately 286,000 of the 435,000 inspected owner-occupied structures were verified as having been damaged (65.7%). An additional 120,000 structures had unconfirmed real property damage indicated on their IA applications. This suggests a total of up to 406,000 damaged owner-occupied housing structures (up to 51.7% of the estimated 786,000 total). Approximately 7,000 inspected owner-occupied housing structures were categorized as either structurally damaged or destroyed (1.6% of the 435,000 inspected owner-occupied housing structures, or 0.9% of the total population).
| FEMA IA status | Damage state description | RPFVL | Count | Percentage of inspected | Percentage of IA applications | Percentage of total |
|---|---|---|---|---|---|---|
| No IA application | No application for IA | N/A | 19,000 | N/A | N/A | 2.4 |
| Not inspected | IA application did not indicate real property damage | N/A | 212,000 | N/A | 27.6 | 27.0 |
| IA application indicated real property damage | N/A | 120,000 | N/A | 15.6 | 15.3 | |
| Inspected | No damage | $0 | 149,000 | 34.3 | 19.4 | 19.0 |
| Affected (generally habitable) | $1 to $3,499 | 236,000 | 54.3 | 30.8 | 30.0 | |
| System damage (includes electrical or HVAC) | $3,500 to $16,999 | 43,000 | 9.9 | 5.6 | 5.5 | |
| Structural damage | 3,000 | 0.7 | 0.4 | 0.4 | ||
| Destroyed | Varies | 4,000 | 0.9 | 0.5 | 0.5 | |
| Total | 786,000 | 100.0 | 100.0 | 100.0 | ||
Source: Data from Fishbach et al. (2020).
HSOAC Table 11.7 provides a total estimate of $14.08 billion in full repair costs for owner-occupied housing structures with FEMA inspections. This estimate was developed using SBA-verified losses from approximately 82,000 households. When divided by the 286,000 inspected owner-occupied housing structures with verified damage, the result is an average severity of about $49,200 per damaged structure. This simple check provides a general sense of the significant difference between full repair cost and the RPFVL figures in Table 7, which suggests an average RPFVL severity on the order of $4,000 to $6,000 per damaged structure. As noted in the HSOAC report, however, “FVL does not capture the full cost to repair. Instead, FVL is designed to measure the cost of making a residential structure safe and habitable” (Fishbach et al. 2020). The report further notes that “SBA inspection is akin to that done by an insurance adjuster, with the goal of estimating the full repair cost.” Additional details on how SBA-verified losses are used to scale up the RPSVL to approximate full repair costs can be found in the full HSOAC report; the differing values are presented here to provide context in validating Hazus results.
Loss estimates in the NCEI Billion-Dollar Weather and Climate Disasters database (Smith et al. 2021) are derived from multiple sources, including the National Weather Service, FEMA, US Department of Agriculture, National Interagency Fire Center, USACE, individual state emergency management agencies, state and regional climate centers, media reports, and insurance industry estimates (NCEI 2021).
The total estimated costs of Hurricane Maria in the United States were estimated to be $90 billion in 2017 dollars (95% confidence interval: $60 to $120 billion), making it the third costliest hurricane in US history (Smith et al. 2021). Although specific estimates for PR and the USVI could not be obtained from the NCEI website, the site does report a range of $1 to $2 billion for the USVI (NCEI 2021). Hurricane Maria bypassed the mainland United States and produced only tropical storm–force winds and moderate storm surge along the coasts of North Carolina and Virginia (Pasch et al. 2019). The authors were unable to locate any published estimates of Hurricane Maria’s damage or loss specifically in the mainland United States; therefore, it is presumed for the purposes of this study that essentially all the remaining $88 to $89 billion in estimated US losses occurred in PR.
The total estimated costs of Hurricane Irma in the United States are estimated to be $50 billion in 2017 dollars (95% confidence interval: $35 to $65 billion), making it the fifth costliest hurricane in US history (Smith et al. 2021). However, a majority of the US losses occurred in Florida. Although specific estimates for PR and the USVI could not be obtained from the NCEI website, the site does report a range of $10 to $20 billion for the USVI and a range of $0.5 to $1.0 billion is reported for PR (NCEI 2021).
The model estimates losses to buildings and their contents, but it does not currently estimate losses to other infrastructure (e.g., bridges, transmission lines, communications towers) or crops. Therefore, it was expected that Hazus would produce total direct economic losses that are at the lower end of the NCEI ranges or possibly even less than the lower bound of the NCEI estimates.
Model Results
Based on the identified data sources and the capabilities now available in the model, seven specific metrics were selected to evaluate the accuracy of the model. Target ranges and modeled values for each metric are summarized in Table 8. The target ranges were derived from the information in Table 6, Table 7, or the loss ranges obtained the NCEI website (NCEI 2021). For example, the lower end of the target range for Metric 1 (percentage of single-family and duplex structures affected) is the rounded sum of the last four inspected entries in the “Percentage of total” column in Table 7 (i.e., 30.0% affected system damage structural damage destroyed), while the upper end of the target range includes an additional 15.3% from the “IA application indicated real property damage” row.
| Metric | Territory | Event | Target range | Modeled (initial) | Modeled (revised) |
|---|---|---|---|---|---|
| 1. Percentage of single-family and duplex structures affected | PR | Maria | 36%–52% | 40% | 35% |
| 2. Percentage of single-family and duplex severely damaged or destroyed | PR | Maria | 0.9%–1.3% | 13% | 8% |
| 3. Costs to repair housing structures | PR | Maria | $28.5–$33.9 billion | $34.1 billion | $26.9 billion |
| 4. Total direct economic losses | PR | Maria | $59–$118 billion | $56.3 billion | $44.3 billion |
| 5. Total direct economic losses | USVI | Maria | $1–$2 billion | $5.7 billion | $4.1 billion |
| 6. Total direct economic losses | USVI | Irma | $10–$20 billion | $10.0 billion | $7.6 billion |
| 7. Total direct economic losses | PR | Irma | $0.5–$1.0 billion | $1.0 billion | $0.8 billion |
The initially modeled values for five of the seven selected metrics were within or very near to the target ranges. The two exceptions were Metric 2, the percentage of severely damaged or destroyed homes in PR for Hurricane Maria, and Metric 5, the total direct economic losses in the USVI for Hurricane Maria. The most likely explanations for the overestimate of Metric 2 include (1) overestimates in the initial WBC percentages of weak roof cover attachments, roof deck attachments, and roof-to-wall connections in PR; and (2) differences in damage state definitions assigned to the FEMA RPFVL categories and the damage state definitions used by Hazus (FEMA 2021a). Possible explanations for the overestimate of Metric 5 include (1) overestimates in the initial WBC percentages of weak roof cover attachments, weak roof deck attachments, and weak roof-to-wall connections in the USVI; (2) overestimates in the wind speeds produced by Hurricane Maria on St. Croix; and/or (3) overestimates in the building inventory replacement value on St. Croix.
Based on the initial results, several adjustments to the SF WBC weights were investigated. The primary objective was to improve the agreement in Metrics 2 and 5 without significantly degrading the level of agreement in the remaining five metrics. The adjustment or calibration of WBC weights was limited to WBCs for which objective data were not available, and any modifications to the WBC percentages were restricted to what were judged to be plausible limits. After several iterations, the final adjustments for PR included:
•
Modified the distribution of metal roofs from 100% corrugated metal to 50% corrugated metal and 50% standing seam metal.
•
Modified the distribution of metal roof fasteners from 100% weak to 20% weak.
•
Modified the distribution of roof-to-wall connection from 100% weak (toe-nail) to 20% weak.
•
Modified the distribution of plywood roof deck attachment from 100% weak (6d nails at spacing) to 20% weak.
For the US Virgin Islands, the final adjustments included:
•
Modified the distribution of metal roof fasteners from 100% weak to 0% weak.
•
Modified the distribution of roof-to-wall connection from 100% weak (toe-nail) to 20% weak.
•
Modified the distribution of plywood roof deck attachment from 100% weak (6d nails at spacing) to 20% weak.
After making the WBC adjustments, the model was rerun to produce the final revised metrics summarized in Table 8. As intended, there is some improvement in Metrics 2 and 5; however, it was not possible to completely close the gaps while keeping the WBC percentages within plausible limits. The remaining five metrics are either within their observed range or within what is judged to be a reasonable margin of the lower bound given that the model does not yet include losses to infrastructure or agriculture.
The results in Table 8 illustrate the sensitivity of the modeled results to the WBC weights for which objective data were not available. Although the revised WBC weights produce better overall results within the constraints of the current model and for one specific set of validation metrics, it is possible that the revised weights may be an overly optimistic representation of the true state of SF construction characteristics in PR and the USVI in 2017. If new damage mechanisms and construction characteristics are added to a future update of Hazus, or new validation data sets become available, the model validation and calibration process outlined in Fig. 4 should be repeated. Until then, the revised WBC weights described previously will serve as the default Hazus building stock assumptions for PR and the USVI. These default values can be modified by users if better local information is available or to further evaluate the sensitivity of the damage and loss estimates to the WBC weights.
Conclusion
This paper and a companion paper by Vickery et al. (2023) describe enhancements to FEMA’s Hazus Hurricane Model to support analyses of the US Caribbean territories of PR and the USVI. Previous versions of Hazus addressed 22 hurricane-prone states in the United States but lacked the necessary data sets for use in the Caribbean territories. To remedy this limitation, several new data sets were developed and incorporated into the model, including a comprehensive building inventory, estimates of the relative frequencies of building characteristics relevant to their performance in high winds, estimates of aerodynamic surface roughness, a simplified inventory of characteristics relevant to tree blowdown and debris management, and deterministic wind field footprints. A main driver behind the addition of new building characteristics and associated vulnerability functions for SF homes is the long-standing pattern of informal construction in PR and the USVI.
Many new data sources and methods were used to characterize the building inventories of PR and the USVI, including tax assessor data, lidar-derived building footprints, orthophotography, street view photography, year of construction, building code history, geographic information system (GIS) spatial analysis, and engineering judgment. Machine learning was used to classify residential roof cover materials, wall construction types, and number of stories. More than 8,000 residential structures with known characteristics were used to train and validate the machine learning models.
After calibration, the damage and loss estimates produced by the model for Hurricanes Irma and Maria are in generally good alignment with the damage and loss levels reported by Fishbach et al. (2020) and the NCEI Billion-Dollar Weather and Climate Disasters database (NCEI 2021). For those metrics with less robust levels of agreement, the differences appear to be largely attributable to limitations in our ability to accurately characterize the building stock, limitations in the model’s census tract aggregate level of analysis, and differences between the units of analysis and observation (e.g., differences in damage state definitions).
The following items are noted as limitations of the current analysis and potential future improvements to the model:
•
The existing Hazus building valuation methodology is likely overstating the replacement value of informal construction. Although the standard Hazus methodology for estimating square footage and the replacement cost per square foot of housing is a function of the median household income level in each census block, it does not explicitly account for the high proportions of informal residential construction found in PR.
•
The analysis conducted to date likely understates the impact of topographic speed-ups on losses. The peak wind gusts provided in Hazus for Hurricane Maria are the sped-up winds from Mudd et al. (2019) averaged over the known building locations to produce a single wind speed value for each census tract. However, because losses increase nonlinearly with wind speed, the average losses in census tracts with topographic speed-ups may be larger than the losses produced by the average sped-up winds. A future update to Hazus will model the distribution of speed-up factors over a regular grid of points at 100-m spacing within each census tract. This improvement will provide an opportunity to quantify the impact on modeled losses of using the full distribution of speed-ups instead of just the average speed-up.
•
Finally, the damage state definitions used by FEMA IA and the Hazus Hurricane Model differ, and there is no simple, one-to-one mapping between them. A robust and validated methodology for mapping Hazus damage states to FEMA IA damages states is needed to generate more useful Hazus output reports and to support future model validation efforts. Currently, the Hazus Hurricane Model Quick Assessment Report directly maps the four Hazus damage states (minor, moderate, severe, and complete) to the four FEMA Preliminary Damage Assessment (PDA) categories (affected, minor, major, and destroyed) on a one-to-one basis. A more refined approach would be to develop a matrix that maps some fraction of buildings in each Hazus damage state to each PDA damage category for model output reporting and maps the inverse for model validation. As discussed, the categorization of FEMA IA inspection results from Hurricane Maria into damage states was based on RPFVL, which differed markedly from the SBA full repair costs. It is also not clear whether the damage state descriptions given in Table 7 are intended to align with the FEMA PDA categories.
The addition of the Caribbean territories to Hazus is an important and innovative step forward in FEMA’s damage and loss estimation capabilities. The development of new building inventory databases and wind building characteristics provide a template for future improvements to the model in the mainland United States and support FEMA’s goals of reducing loss of life and damage to property.
Data Availability Statement
Some or all data, models, or code generated or used during the study are available in a repository or online in accordance with funder data retention policies: https://www.fema.gov/flood-maps/tools-resources/flood-map-products/hazus/software.
Acknowledgments
This work was supported by the Federal Emergency Management Agency (FEMA) under Contracts HSFE60-15-D-0003 and HSFE60-15-D-0005. We would also like to acknowledge and thank Eric Coughlin, Bradford Hartley Jr., James Mawby, Richard Passarelli, and Will Talamaivao for their contributions to the data development aspects of this project.
References
FEMA. 2018a. Hazus hurricane model user guidance. Washington, DC: FEMA.
FEMA. 2018b. Hurricanes Irma and Maria in Puerto Rico. FEMA P-2020. Washington, DC: FEMA.
FEMA. 2018c. Hurricanes Irma and Maria in the U.S. Virgin Islands. FEMA P-2021. Washington, DC: FEMA.
FEMA. 2019. Hazus program U.S. territory data updates detailed methodology. Washington, DC: FEMA.
FEMA. 2021a. Hazus hurricane model technical manual. Washington, DC: FEMA.
FEMA. 2021b. Hazus hurricane wind for Puerto Rico and the US Virgin Islands. Washington, DC: FEMA.
FEMA. 2021c. Open FEMA housing assistance for owners and renters, Disaster Numbers 4335 (Irma USVI), 4336 (Irma PR), 4339 (Maria PR), and 4340 (Maria USVI). Washington, DC: FEMA.
Fishbach, J. R., L. W. May, K. Whipkey, S. R. Shelton, C. A. Vaughan, D. Tierney, K. J. Leuschner, L. S. Meredith, and H. J. Peterson. 2020. After Hurricane Maria: Predisaster conditions, hurricane damage, and recovery needs in Puerto Rico. Washington, DC: DHS Homeland Security Operational Analysis Center.
Garcia, I. 2020. “The lack of proof of ownership in Puerto Rico is crippling repairs in the aftermath of Hurricane Maria.” Accessed February 19, 2021. https://www.americanbar.org/groups/crsj/publications/human_rights_magazine_home/vol--44--no-2--housing/the-lack-of-proof-of-ownership-in-puerto-rico-is-crippling-repai/.
MRLC (Multi-Resolution Land Characteristics Consortium). 2003. “NLCD 2001 land cover (Puerto Rico).” Accessed February 14, 2021. https://www.mrlc.gov/data/nlcd-2001-land-cover-puerto-rico.
MRLC (Multi-Resolution Land Characteristics Consortium). 2019. “NLCD 2016 USFS tree canopy cover (Puerto Rico).” Accessed February 14, 2021. https://www.mrlc.gov/data/nlcd-2016-usfs-tree-canopy-cover-puerto-rico.
Mudd, L. A., P. J. Vickery, F. Liu, F. M. Lavelle, and C. Isetts. 2019. “Development of wind speed contours for 2017 Atlantic Basin land falling hurricanes.” Accessed September 12, 2022. https://www.fema.gov/sites/default/files/documents/fema_wind-speed-contours_2017-hurricanes.pdf.
NCEI (National Centers for Environmental Information). 2021. “Billion-dollar weather and climate disasters.” Accessed September 5, 2022. https://www.ncdc.noaa.gov/billions.
NOAA (National Oceanic and Atmospheric Administration). 2019. “Shoreline/coastline resources.” Accessed February 28, 2021. https://www.ngdc.noaa.gov/mgg/shorelines/.
Pasch, R. J., A. B. Penny, and R. Berg. 2019. “Tropical cyclone report: Hurricane Maria (AL152017).” Accessed March 24, 2021. https://www.nhc.noaa.gov/data/tcr/AL152017_Maria.pdf.
Smith, A., N. Lott, T. Houston, K. Shein, J. Crouch, and J. Enloe. 2021. “US billion-dollar weather & climate disasters 1980-2020.” Accessed September 5, 2022. https://www.ncdc.noaa.gov/billions/events.pdf.
US Census Bureau. 2019. “TIGER/line roads.” Accessed February 14, 2021. https://www2.census.gov/geo/tiger/TIGER2019/ROADS/.
USFS (United States Forest Service). 2018a. The forest inventory and analysis database: Database description and user guide for phase 2 (version 8.0). Washington, DC: USFS.
USFS (United States Forest Service). 2018b. The forest inventory and analysis database: Population estimation user guide. Washington, DC: USFS.
USVI (US Virgin Islands) GIS Division Office. 2018. US Virgin Islands parcel data. St. Thomas, VI: GIS Division.
Vickery, P. J., J. Lin, P. F. Skerlj, and L. A. Twisdale Jr. 2006a. “HAZUS-MH hurricane model methodology. I: Hurricane hazard, terrain, and wind load modeling.” Nat. Hazard. Rev. 7 (Mar): 82–93. https://doi.org/10.1061/(ASCE)1527-6988(2006)7:2(82).
Vickery, P. J., F. Liu, F. M. Lavelle, and D. Mizzen. 2019. Development of wind speed-ups and hurricane hazard maps for the United States Virgin Islands. Raleigh, NC: Applied Research Associates.
Vickery, P. J., S. Quayyum, F. Liu, L. A. Mudd, F. M. Lavelle, J. Rozelle, M. E. Kelly, and C. Zuzak. 2023. “Hazus hurricane wind model for the US Caribbean territories: Hazard modeling and development of residential damage functions.” Nat. Hazard. Rev.
Vickery, P. J., P. F. Skerlj, J. Lin, L. A. Twisdale Jr., M. A. Young, and F. M. Lavelle. 2006b. “HAZUS-MH Hurricane model methodology. II: Damage and loss estimation.” Nat. Hazard. Rev. 7 (Aug): 94–103. https://doi.org/10.1061/(ASCE)1527-6988(2006)7:2(94).
Viglucci, A. 2018. “Half of Puerto Rico’s housing was built illegally. Then came Hurricane Maria.” Accessed February 19, 2021. https://www.miamiherald.com/news/nation-world/world/americas/article199948699.html.
Information & Authors
Information
Published In

Natural Hazards Review
Volume 24 • Issue 4 • November 2023
Copyright
This work is made available under the terms of the Creative Commons Attribution 4.0 International license, https://creativecommons.org/licenses/by/4.0/.
History
Received: Mar 3, 2022
Accepted: Apr 28, 2023
Published online: Jul 14, 2023
Published in print: Nov 1, 2023
Discussion open until: Dec 14, 2023
ASCE Technical Topics:
- Architectural engineering
- Building management
- Disaster preparedness
- Disaster risk management
- Disasters and hazards
- Emergency management
- Engineering fundamentals
- Freight transportation
- Geology
- Geotechnical engineering
- Hurricanes, typhoons, and cyclones
- Information management
- Infrastructure
- Inventories
- Islands
- Logistics
- Methodology (by type)
- Natural disasters
- Research methods (by type)
- Structural engineering
- Transportation engineering
- Validation
- Wind engineering
Authors
Metrics & Citations
Metrics
Citations
Download citation
If you have the appropriate software installed, you can download article citation data to the citation manager of your choice. Simply select your manager software from the list below and click Download.