Design Scour Levels for Dune Revetments and Seawalls
This article has a reply.
VIEW THE REPLYThis article has a reply.
VIEW THE REPLYPublication: Journal of Waterway, Port, Coastal, and Ocean Engineering
Volume 149, Issue 3
Abstract
A new method to determine design scour levels for dune revetments and seawalls is presented. The method is based on the thesis that toe scour is a function of the nearshore incident wave energy and was calibrated with results from several moveable bed model studies covering a large range of scales. The method determines scour levels to a still water level datum defined at the incident wave-breaking location. Therefore, the method incorporates many more parameters than those that pertain to existing methods including tidal stage, storm surge, wave setup, wave period, and seabed slope. However, application of the method is not difficult with a methodology being presented. The sensitivity of the method to variations in the values for the input parameters is examined and the limits of their applicability are presented. Recommendations for further research are given.
Practical Applications
Seawalls are prone to collapse during storms if their footings are undermined by breaking waves. When designing seawalls, it is important to determine the level to which such scour can occur. However, existing methods for determining scour are simplistic and do not provide a scour level. This paper presents a new equation to predict scour levels for the design of seawall footings. The equation includes many of the important factors relating to storm scour including storm tide level, wave, and beach conditions. The equation was developed on the results of several scale model studies carried out in various laboratories over several decades with some comparisons with real-world experiences. The paper comprises all of the information used with clear diagrams. A simple application method is presented, the various factors that need to be considered for design are discussed, and recommendations for further studies are made.
Introduction
Particularly important for the design of dune revetments and seawalls subjected to breaking waves is the maximum depth of toe scour, the primary cause of failure of many coastal structures (Sutherland et al. 2006b). A considerable amount of research on wave-induced toe scour has been published but much of it has been under non-breaking waves with subaqueous seabed levels at the seawall/revetment toe. Many dune revetments and seawalls are well landward of the surf zone with their toes being high and dry prior to a storm event occurring. For design, however, it must be assumed that much of the beach berm will have been eroded and, eventually, the structure will become exposed to breaking waves for which this method has been derived.
Previous research has related scour depth at dune revetments and seawalls variously to the deep water offshore significant wave height (Sutherland et al. 2006b), to the minimum depth over the surf zone bar upon which the incident wave breaks (Steetzel 1988; Van Rijn 2018), to the maximum height of an unbroken wave at the toe of the structure (USACE 1984, p. 7-246, 2006, p. VI-5-235), and to the volume of sand behind the seawall that would have been eroded in the absence of the seawall (Dean 1986). None of these methods provides a design scour level for dune revetments or seawalls under breaking waves. The method proposed herein assumes that the work done to excavate a scour hole is a function of the incident wave-breaking energy (Steetzel 1993), rather than wave height alone, and a formula for the toe scour level has been developed for a still water level (SWL) datum at the wave-breaking point. The formula has been calibrated with data derived from published laboratory studies, including applicable data from Steetzel (1985, 1988, 1993), Sutherland et al. (2006b), and others, covering a large range of scales, with that derived from Sutherland et al. (2006b) having been validated with prototype measurements.
Thesis
Maximum toe scour occurs under breaking waves (Sutherland et al. 2006b; Tsai et al. 2009; Salauddin and Pearson 2019). When designing for breaking waves, it is necessary to determine the maximum breaker height to which the structure might reasonably be subjected (USACE 1984, pp. 7–8). The design breaker height, Hb, depends on the depth some distance seaward from the structure toe where the wave first begins to break (USACE 1984, pp. 7–8). The breaking process extends over a distance equal to around half the shallow-water wavelength, which is based on the depth at this seaward position (USACE 1984, p. 7-4).
The scour depth below the SWL, hs, may be defined by the incident breaking wave energy, E, to which Steetzel (1993) attributes sand transport, which is a function of wave height and wavelength (USACE 1984, Page 2-26, equation (2-38)), which can be expressed aswhere Hb = breaking wave height; and L = nearshore wavelength.
(1)
On a scoured beach profile, the pre-existing depth at half the nearshore wavelength in front of the structure, hL/2, has been adopted as a surrogate for the breaking wave height, Hb, assuming for typical surf zone slopes of 1/20 to 1/30, Hb ≈ hb (Battjes 1974; Goda 2000, p. 79, Fig. 3.23) ≈ hL/2, as depicted in Fig. 1.

Fig. 1. Definition schema for parameters used herein.
(Adapted from USACE 1984, Figure 7-1, page 7-5.)
In shallow water, the nearshore wavelength can be approximated by (Battjes 1974; USACE 1984, Page 2-25, equation (2-37))hence, the scour level can be defined aswhere SWL includes the tide level plus storm surge and wave setup at hL/2, with wave period T.
(2)
(3)
Calibration Data
The method proposed herein has been calibrated and verified with published moveable bed-scale model data on revetment and seawall scour under breaking waves. Studies include some large- and medium-scale work done in the Netherlands in the 1980s with some medium- and small-scale work done in the UK in 2006 and 2019 and in Taiwan in 2009. Some medium-scale UK studies have been validated with field data.
Steetzel (1985, 1993)
Having undertaken studies on behalf of the Dutch government, Steetzel (1985, 1993) reported mobile bed model test results for dune erosion and revetment scour undertaken at medium and large scales. The nearshore dune/beach profiles were molded with “Asserzand” of grain size D50 = 90 μm (ws = 0.0083 m/s). Van Rijn (2018, page 10) reported, inter alia, the following findings of these flume tests as documented in Steetzel (1988):
•
the scour depth is strongly related to the incident wave conditions, surge levels, beach slope and depth near the toe;
•
the maximum scour depth, hs, below SWL was found to be hs = (1.7 to 1.8)hb where hb is the minimum depth above the bar deposit.
The value of this result for predicting future scour is limited because there is no pre-existing data for the minimum bar depth, hb, as the bar is formed by the scour process; that is, hb is not known a priori.
Reassessing the results in Steetzel (1985, 1993), the smaller-scale tests (Steetzel 1985) were undertaken with sloping revetments of 1:1.8 and 1:3.6 (M2505-II-series Tests T2 and T3, respectively) with model wave periods of Tp = 3.1 s (Test 2) and 3.4 s (Test 3) giving nearshore wavelengths of L = 4.1 and 4.5 m (respectively) with resulting (hL/2, hs) pairs of (0.176 m, 0.239 m) and (0.180 m, 0.302 m) on a compound nearshore bed slope of around 1:12 for about ½ wavelength and 1:42 further offshore (Fig. 2).
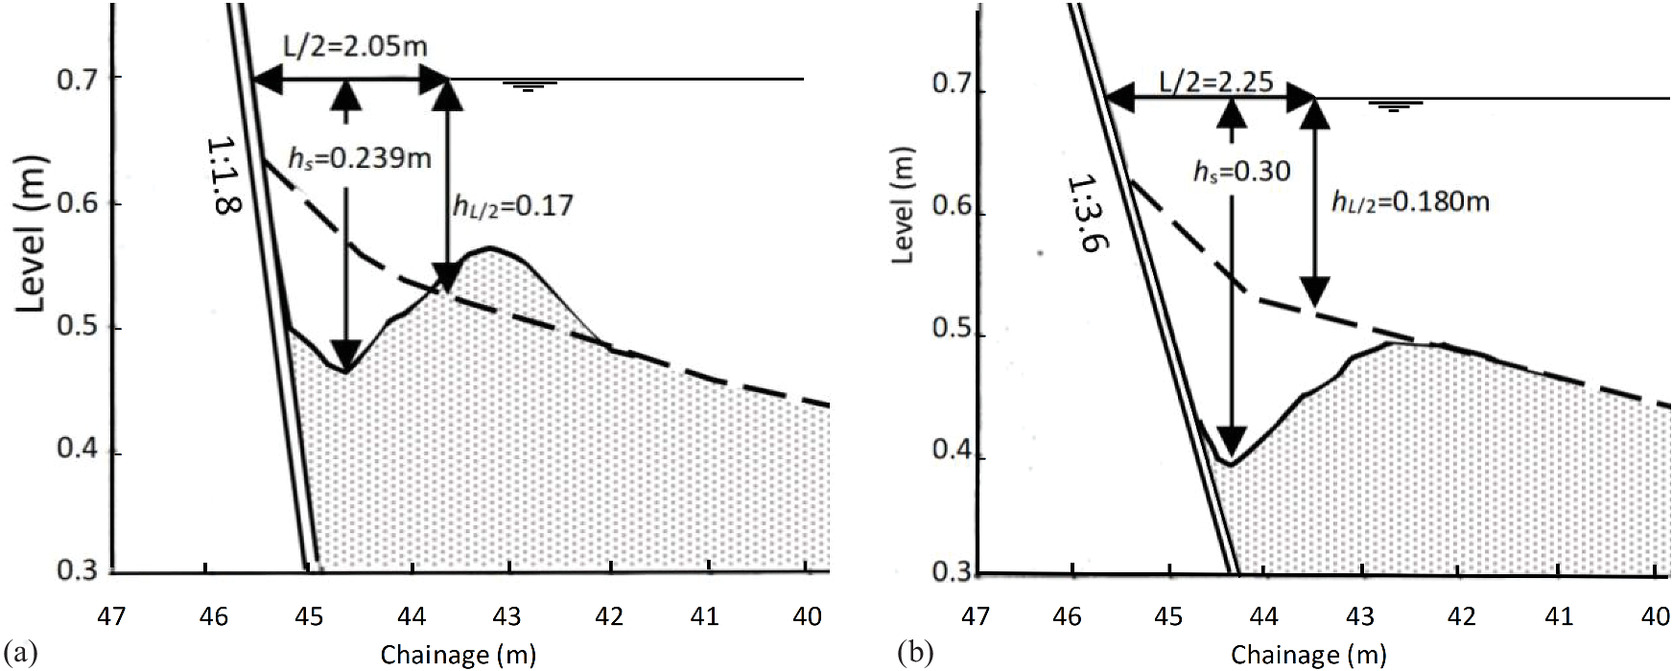
Fig. 2. Small-scale revetment toe scour results (M2505-II-series): (a) Test T2; and (b) Test T3. Note distorted scales.
(Adapted from Steetzel 1985.)
Large-scale tests reported in Steetzel (1993) with medium to high sloping revetments (H298-I-series Tests T1 and T2) were undertaken with a model wave period of Tp = 5.4 s giving a wavelength of L = 17 m over a compound nearshore bed slope, with a pre-existing hL/2 = 1.05 m and resulting hs = 1.50 m in both tests (Fig. 3).
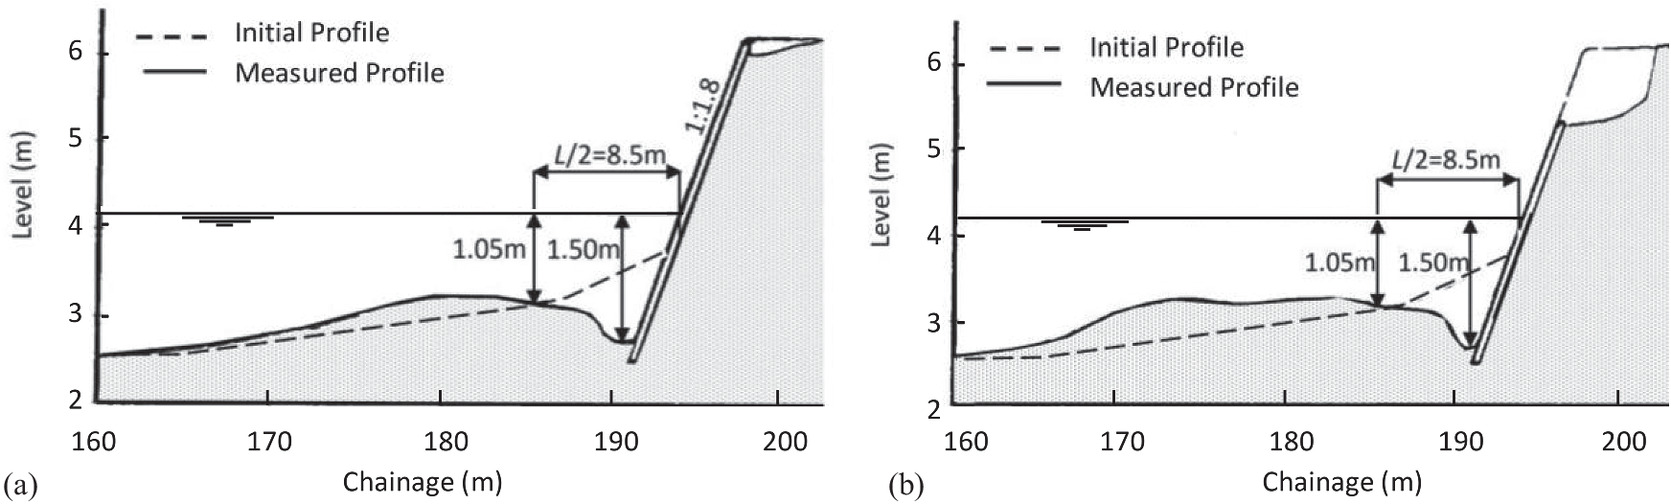
Fig. 3. Large-scale Delta Flume revetment toe scour results (H298-I-series): (a) Test T1; and (b) Test T2.
(Adapted from Steetzel 1993.)
Van der Meer and Pilarczyk (1988)
Van der Meer and Pilarczyk (1988) presented, inter alia, scour results from large-scale (1:7) and small-scale (1:35) moveable bed flume model tests for a berm breakwater at St. George Harbour, Alaska. The initial profile of the rubble mound structure, shown with a dashed line in Fig. 4, was subjected to depth-limited breaking waves on a bed slope m = 1/30. In the Delta Flume, the wave period was Tp = 6.4 s, giving a nearshore wavelength of around 26 m, D50 = 173 μm. The berm was eroded and a scour hole was formed at its toe, as shown by the solid line in Fig. 4. The scour depth below SWL was scaled as 2.0 m and the prescour depth at ½ wavelength was calculated to be hL/2 = 1.67 m [(26/2–1.8)/30 + 1.3]. In the small-scale (1:35) model, Tp = 2.9 s gives a nearshore wavelength of around 5.3 m, D50 = 102 μm. Scour was a little less (relatively), being 0.38 m, which was equivalent to 1.9 m when scaled up to the 1:7 model scale for comparison, as shown by the dot–dash line in Fig. 4, and the pre-scour depth at ½ wavelength was calculated to be hL/2 = 0.334 m.

Fig. 4. Model schema for St George Harbour breakwater. Note natural scale.
(Adapted from van der Meer and Pilarczyk 1988.)
Sutherland et al. (2006b)
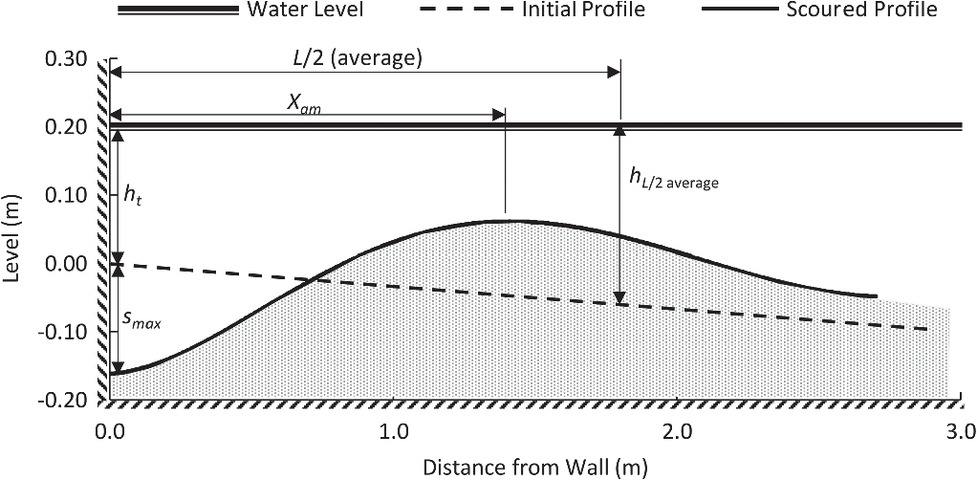
Moveable bed flume tests for both vertical walls and sloping revetments demonstrated conclusively that maximum toe scour at seawalls and revetments occurs where waves are breaking directly onto the structure (Sutherland et al. 2006b). For the vertical wall tests, the bed slope was 1V:30H and for the 1V:2H sloping revetment tests the bed slope was 1V:75H. The moveable bed comprised silica sand of assumed specific gravity 2.65 with D16 = 87, D50 = 111, and D84 = 154 μm. The scour test results used herein are presented in Table 1 with parameters defined in Fig. 5.
| Test no. | V/Sa | His [m]b | Tp [s]c | ht [m]d | Smax [m]e | Xam [m]f | L [m]g | hL/2 [m]h | hs [m]i |
|---|---|---|---|---|---|---|---|---|---|
| 1 | V | 0.193 | 1.55 | 0.2 | 0.057 | 0.66 | 2.4 | 0.2381 | 0.257 |
| 2 | V | 0.193 | 1.87 | 0.2 | 0.065 | 0.68 | 2.9 | 0.2485 | 0.265 |
| 3 | V | 0.198 | 2.29 | 0.2 | 0.13 | 0.95 | 3.7 | 0.2601 | 0.33 |
| 4 | V | 0.194 | 3.24 | 0.2 | 0.158 | 1.369 | 5.5 | 0.2901 | 0.358 |
| 8 | V | 0.197 | 1.87 | 0.1 | 0.111 | 0.731 | 2.1 | 0.1344 | 0.211 |
| 12 | V | 0.197 | 3.24 | 0.1 | 0.114 | 2.106 | 4.2 | 0.1697 | 0.214 |
| 13 | V | 0.295 | 2.29 | 0.15 | 0.125 | 1.925 | 3.2 | 0.2053 | 0.275 |
| 14 | V | 0.28 | 1.87 | 0.3 | 0.052 | 1.005 | 3.5 | 0.3563 | 0.352 |
| 15 | V | 0.196 | 1.87 | 0.2 | 0.048 | 2.085 | 2.9 | 0.2507 | 0.248 |
| 16 | V | 0.197 | 3.24 | 0.2 | 0.102 | 1.342 | 5.5 | 0.2901 | 0.302 |
| 26 | S | 0.19 | 1.87 | 0.2 | 0.068 | 4.59 | 2.7 | 0.2172 | 0.268 |
| 27 | S | 0.192 | 3.24 | 0.2 | 0.105 | 3.729 | 4.9 | 0.2317 | 0.305 |
| 28 | S | 0.194 | 1.55 | 0.2 | 0.072 | 3.565 | 2.2 | 0.2140 | 0.272 |
Note: Columns 1–7 are from Sutherland et al. 2006b, columns 8–10 are derived herein from data in columns 4–7. Parameters heading columns 5 to 9 are defined in Fig. 5.
a
Test type is either V = vertical, or S = sloping (1V:2H).
b
His = measured incident offshore significant wave height (m).
c
Tp = measured spectral peak wave period (s).
d
ht = depth at the structure toe (m).
e
Smax = maximum scour depth below original bed level (m).
f
Xam = distance from the toe of the structure to the location of maximum accretion (m).
g
L = wavelength [(gh)0.5Tp] with h = ht + Xam/30 for vertical wall and h = ht + Xam/75 for sloping revetment (m).
h
hL/2 = pre-existing depth at ½ wavelength in front of the structure (m).
i
hs = (ht + Smax) = scour depth below the SWL (m).
Data used for the analysis herein (columns 8 to 10 in Table 1) were derived from the test results where waves were assumed to have been breaking onto the structures, which were adopted on the basis that the incident significant wave height (His) was larger than 65% of the depth at hL/2.
Tsai et al. (2009)
Tsai et al. (2009) reported experimental results of seawall toe scour under breaking and nonbreaking regular waves of period 1.4 s onto a smooth revetment of slope 1V:1.5H located on a relatively steep seabed of slope 1V:5H. The sand of the bed had a specific gravity of 2.58 and a median grain size of D50 = 250 μm. The results indicated that the depth of toe scour increased with increasing wave steepness but decreased with increasing depth. Maximum scour occurred under plunging breakers. While the results reported scour depths below seabed level, the data could be interrogated to derive scour depths below SWL and the following (L, hL/2, hs) data triplets were derived from runs 5, 10, and 15: (2.45, 0.308, 0.257 m), (2.67, 0.372, 0.330 m), and (2.92, 0.439, 0.373 m) (Fig. 6).
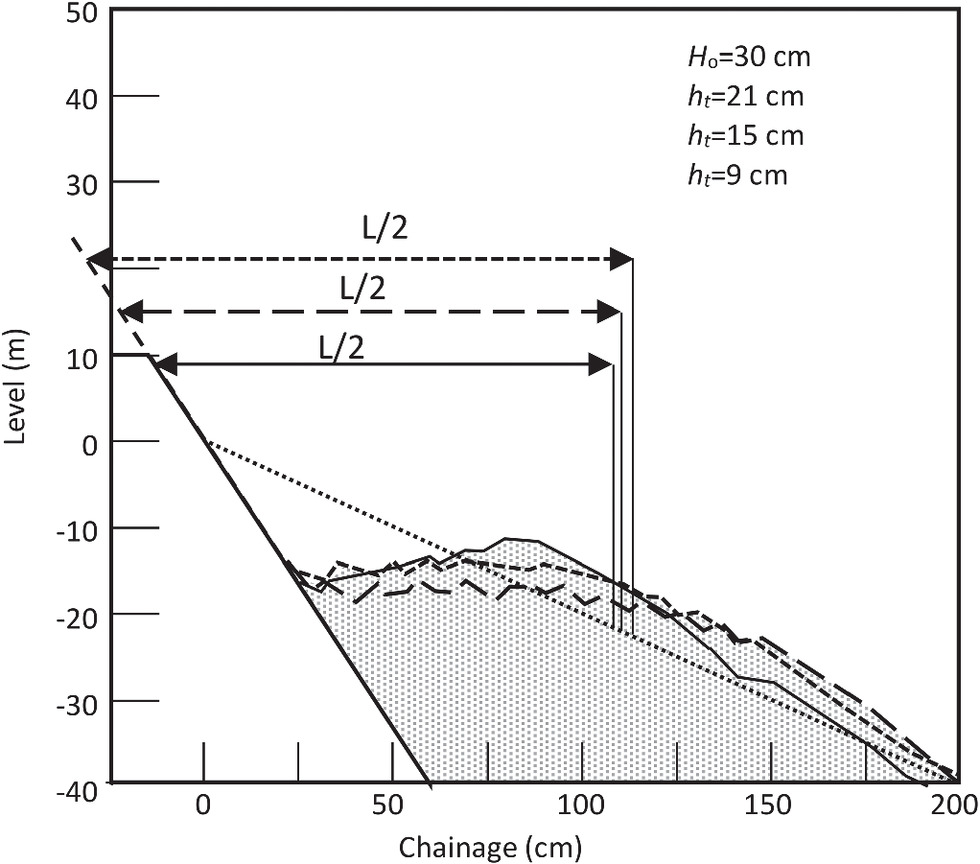
Fig. 6. Equilibrium scour profiles for different initial depths Note distorted scale.
(Adapted from Tsai et al. 2009.).
Boers et al. (2011)
Boers et al. (2011) presented results from very small-scale (1:60) flume and basin moveable bed model tests for scour in sand of D50 = 125 μm in front of a smooth sloping (1V:2H) revetment. The test results presented (hs, hb) pairs of (0.062, 0.045), (0.060, 0.043), and (0.082, 0.067), giving an average ratio of hs/hb = 1.3, which was much lower than 1.7 to 1.8 derived from Steetzel (1988) using the large-scale (1:5) Delta Flume (Van Rijn 2018). Further, the test results showed that the breaker depth increased with time, which is contrary to bar growth and inconsistent with most of the experiments of Steetzel (1988), Sutherland et al. (2006b), and Salauddin and Pearson (2019). The model wavelength was calculated from the model wave period and depth to determine the following (hL/2, hs) pairs: (0.083, 0.082), (0.085, 0.062), and (0.083, 0.060). The data were incongruous with results from other research and were non-conservative, so those results were not included herein.
Salauddin and Pearson (2019)
Moveable bed flume tests under random nonbreaking waves and waves breaking over a 1V:20H bed slope onto a smooth 1V:2H sloping wall confirmed that maximum scour occurs under breaking waves (Fig. 7). The model sediment comprised filtered anthracite coal with a specific gravity of 1.40, used to represent gravel beach materials. Two different model sediment sizes representing the gravel beaches were used; D50 = 2,100 and D50 = 4,200 μm representing the prototype median grain size of D50 = 13 mm and D50 = 24 mm, respectively, at a 1 in 50 scale with a prototype specific gravity of 2.65. From the results of those tests with breaking waves of period Tp = 1.13 s (Fig. 7), the following (L, hL/2, hs,) triplets were derived: (1.00, 0.079, 0.110), (1.12, 0.095, 0.113), and (1.23, 0.121, 0.134).
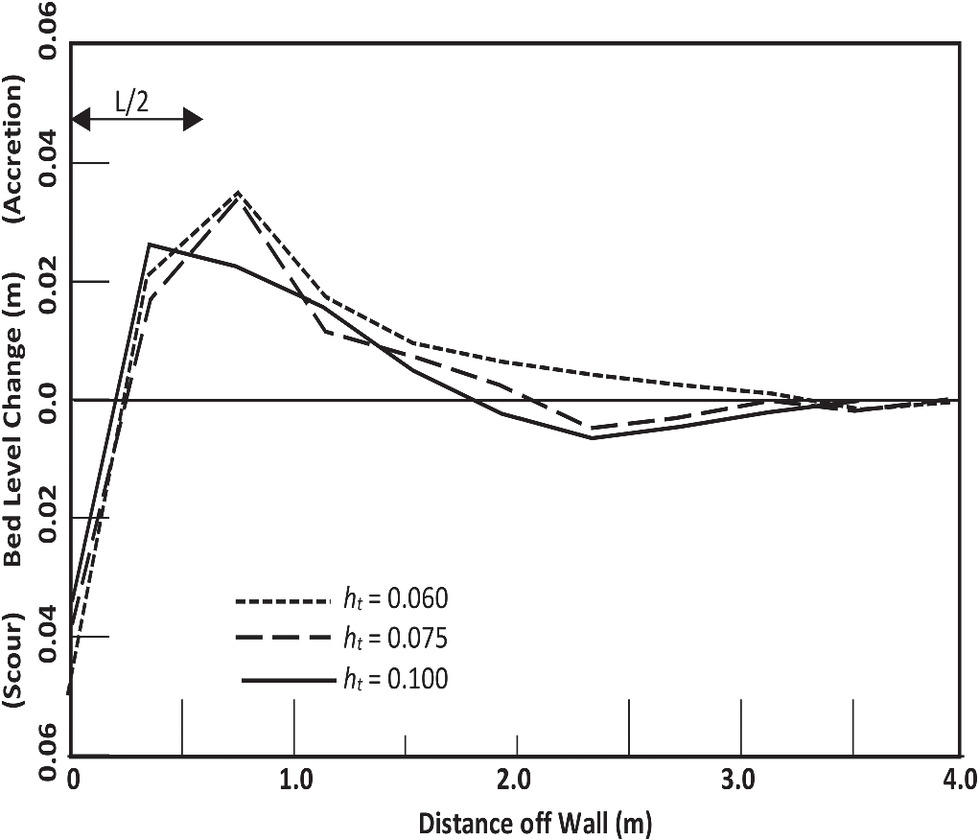
Fig. 7. Breaking wave bed level changes after 1,000 waves for wave steepness Sop = 0.05, Hm0 = 0.10 m, and ht = pre-existing toe depth. Note distorted scale.
(Adapted from Salauddin and Pearson 2019.)
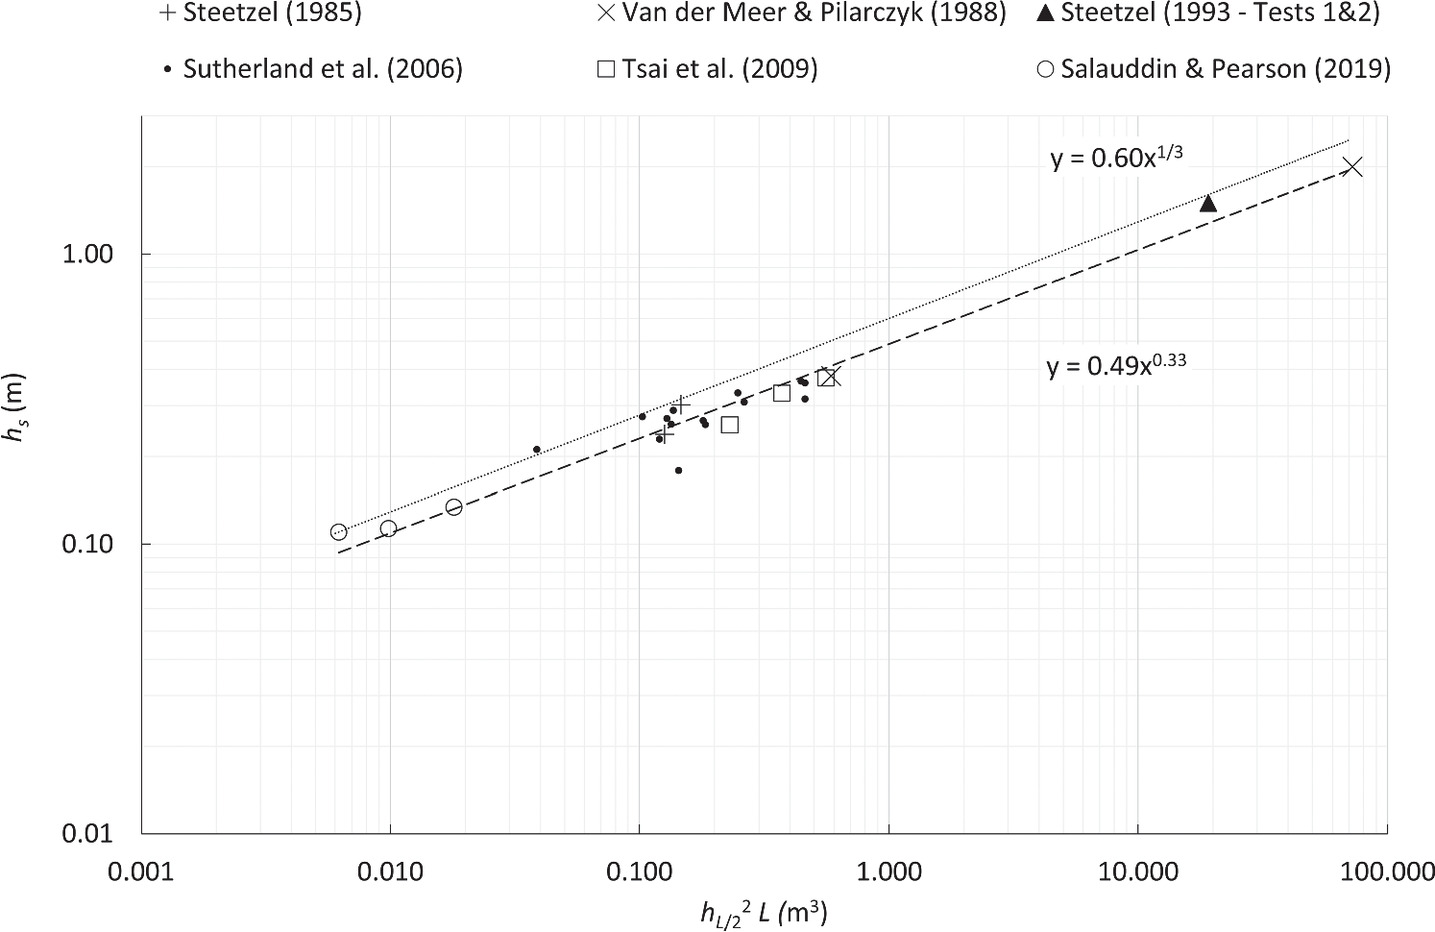
Calibration
The scour depths were plotted as a function of breaking wave energies in Fig. 8.
Application
The following steps may be used in applying the method:
1.
Determine the offshore design storm conditions including wave height, period and direction, the ocean storm SWL (tide plus storm surge), and the wave refraction coefficient for the site to allow for calculating nearshore wave setup and, hence, nearshore SWL.
2.
Obtain or design a nearshore storm scoured beach profile (not necessarily with scour holes), which could be made available from ground survey, photogrammetric survey or lidar survey data. Note the sensitivity of the results to seabed slope as discussed in the next section.
3.
Develop a relationship for wave setup versus nearshore depth for the adopted offshore storm conditions.
4.
Determine the water surface profile along the beach profile from a depth of around, say, 5 to 0 m. This could be an iterative procedure through estimating then calculating the value of wave setup at various locations.
5.
Calculate the wavelength along the seabed profile using the relationship L = (gh)½T.
6.
From steps (4) and (5), determine the depth and SWL situated at ½ L in front of the structure.
7.
Use the result in step (6) to determine the toe scour level using Eq. (4).
8.
Test the sensitivity of the result in step (7) for variations in input parameters, for which guidance is given in the following discussion section.
Discussion
Scour level is determined by a large range of factors including, inter alia, tidal stage, storm surge, wave setup, offshore wave height, wave period, wavelength, and beach slope. Many of these factors are codependent and the method may be sensitive to several factors as follows, it being recommended that sensitive factors be tested for design.
Wave Period
In depth-limited wave-breaking situations, the wave period will have a significant effect on scour depth, with longer periods creating larger wavelengths and, hence, deeper incident-breaking depths and larger breaking wave heights, as depicted in Fig. 9. The data show clearly that over the range of sediment types and beach slopes tested, increasing scour depths were associated with lengthening wave periods.
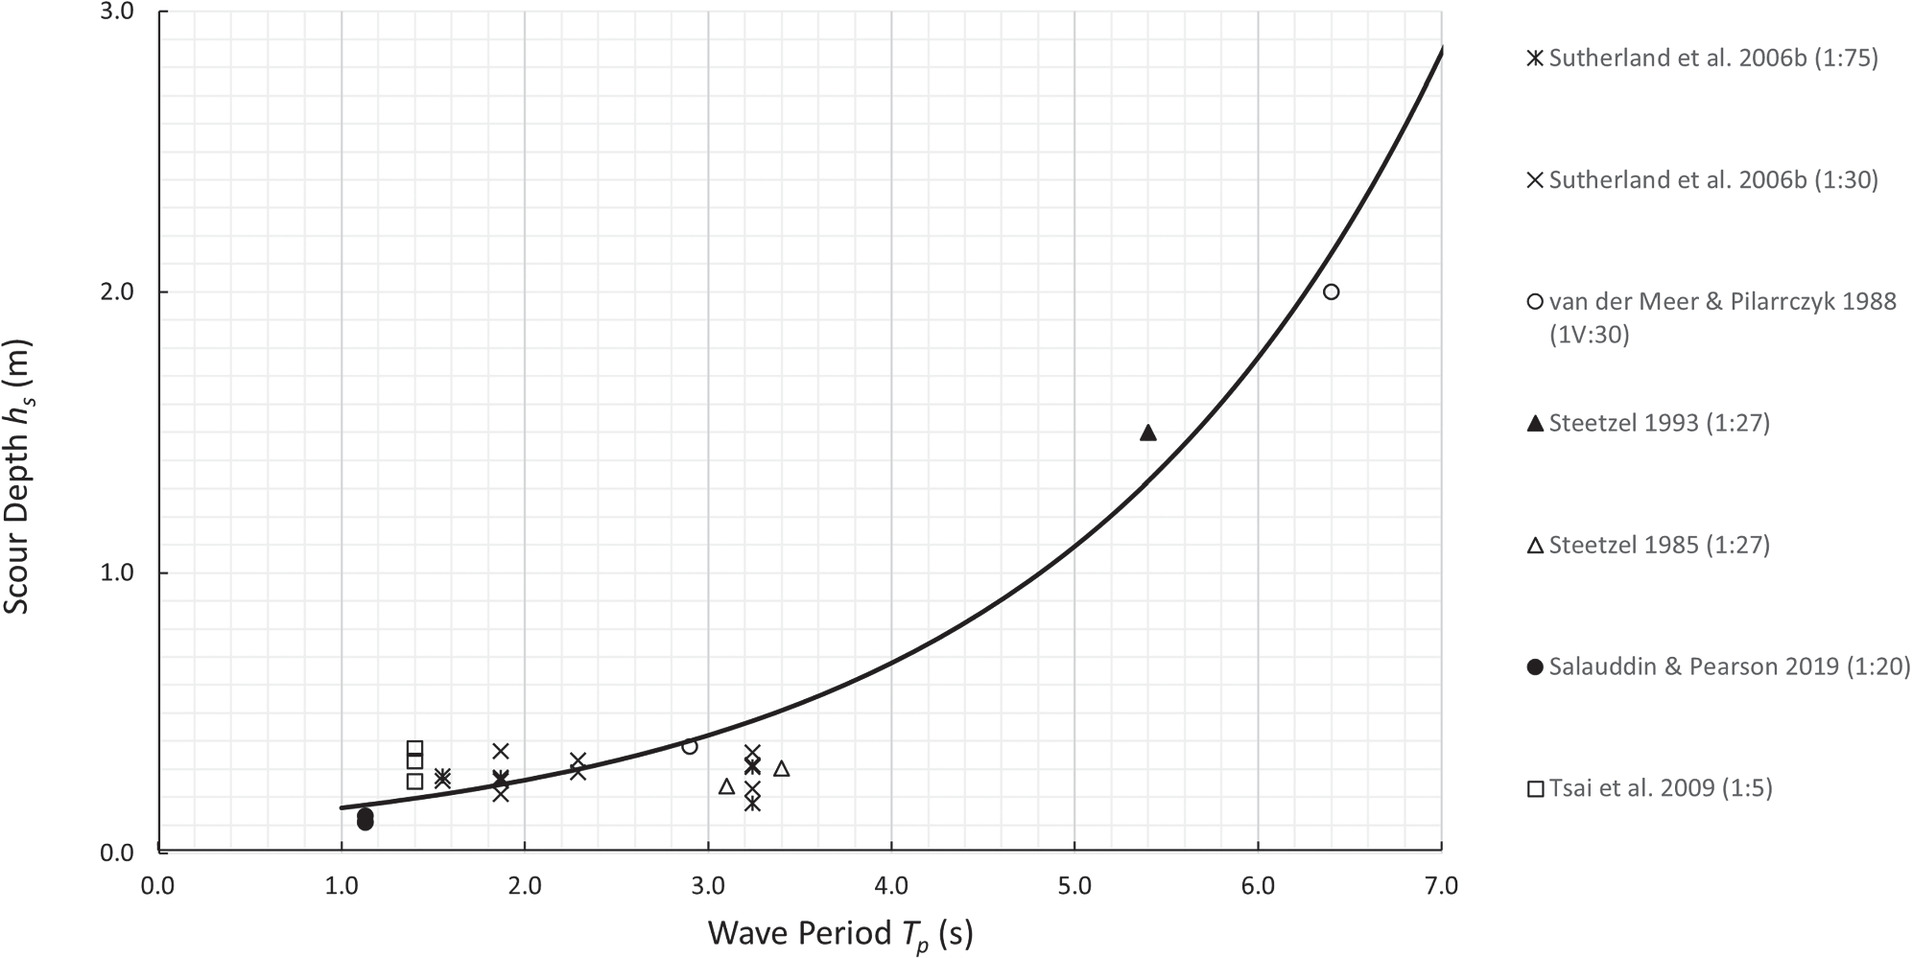
Design values adopted for this parameter could result in varying the nearshore wavelength by tens of meters, which could result in varying the breaker depth, hL/2, by up to ±1 m, having a significant impact on the design scour level, with an even larger impact on requisite armor mass. The period associated with maximum wave energy, Tp, was used for the scale modeling calibration results and is recommended for use in design.
Wavelength
Having been calibrated using Eq. (2), Eq. (4) is valid only if Eq. (2) is used to define the nearshore wavelength. While Eq. (2) is a simple approximation of nearshore wavelength, it is used to determine hL/2, which is a surrogate for Hb and, therefore, is required to be defined consistently with the calibration data, easily but not necessarily precisely. If another formula for wavelength is to be used, then Eq. (4) would need to be recalibrated with that formula.
Deepwater Significant Wave Height
As the design breaking wave is depth-limited, the deep water wave height affects the breaking wave height through wave setup at the nearshore wave-break location. However, wave setup at the nearshore wave-break location would vary by only a few decimeters with little impact on scour level. Nevertheless, variations in wave setup may have a more significant impact on requisite armor mass.
Hb ≈ hb ≈ hL/2
The ratio hb/Hb varies with nearshore slope and incident wave steepness (USACE 1984, p. 7-5). For the model data herein, Hb/gT2 varied from 0.0016 to 0.0100, which, for the range of seabed slopes from 1V:20H to 1V:30H and regular waves, USACE (1984, Fig. 7-2, p. 7-6) and Goda (2000, Fig. 3.23, p. 79) indicated that hb/Hb = 0.9 to 1.1. The relationship between hb and hL/2 is not known but, if assumed to be linear, the constant would be assimilated in the factor calibrated for Eq. (4).
Nearshore Beach Profile
If a dune revetment or seawall is constructed to protect the shoreline from erosion, the design beach profile should reflect an eroded wave-incident condition, the situation for which the structure must be designed. However, such data may not be available. The most scoured beach profiles that may have been surveyed may not have been the extremes. In general, scoured profiles are steeper close inshore, leading to larger nearshore design breaker depths. Sutherland et al. (2006b) found greater scour depths with steeper beach slopes.
Fig. 10 shows the breaking wave Iribarren Numbers for the model data varying from 0.055 to 0.63, indicating mostly spilling with some plunging wave conditions. The diagram intimates that steeper profiles lead to plunging breakers and would result in larger scour depths (USACE 2006, pp. VI-5–234) Such implications are depicted also in Fig. 9, which shows consistently that for a given wave period, the greatest scour depth was indicated by the steepest profile. However, such a trend is not depicted in Fig. 8, which relates scour depth to all of the contributing factors combined, making it almost impossible to isolate trends for specific factors. Manipulating the relationships depicted in Fig. 10 indicates that a relationship between scour depth and wave height may vary also with bed slope, being around 1.25Hb for the flattest slope and 0.85Hb for the steepest, notwithstanding that breaker depths increase also with a steepening profile.

SWL
The SWL is dependent upon assumed values for the tidal level, storm surge and nearshore wave setup. Consideration should be given to possible future sea level changes.
Storm Duration
The maximum scour depth will take time to develop under an accumulation of incident wave energy. Experiments of Tsai et al. (2009) and Salauddin and Pearson (2019) took 1,000 waves to reach maximum scour depth. All experimental results presented herein were undertaken with more than 1,000 waves. As incident breaking waves are depth-limited and subjected to shoaling, the unrefracted deep water wave height required to generate the incident breaking wave may be much smaller than the maximum deep water significant wave height of the design storm. Hence, the incident breaking wave is likely to occur frequently.
Type of Structure
It is a common belief that scour at the toe of sloping revetments would be less than that at vertical walls. This has not been borne out by lab testing (Sutherland et al. 2006b; Salauddin and Pearson 2019).
Structures tested as reported herein comprised smooth-faced revetments and seawalls with only one example of a rubble mound. Structures with greater porosity may experience less wave-induced scour (USACE 2006, pp. VI-5–237). However, the impact of structure porosity could not be determined from this study and this, along with structure slope, needs further research.
Scale Modeling
Moveable bed-scale modeling is fraught with intractable issues regarding scaling (Hughes 1995, Chapter 6, pp. 237–332). Scale effects occur in all physical models that are smaller than the prototype, making it impossible to simulate all relevant variables in their correct relationship to each other. Fundamental modeling axioms include, inter alia, that models should be as large as possible (Noda 1972; Dean 1985) and that the model is only fit for predictive use when it has reproduced past evolution successfully (Sager and Hales 1979). It is a fundamental precept that all models must be verified by reproducing prototype events, which this model has yet to demonstrate.
The simple Eq. (4) for calculating scour levels has been calibrated on two-dimensional scale model test results and cannot be expected to reflect accurately the complex three-dimensional processes occurring under breaking wave impact onto revetments and seawalls. A “best fit” power curve had the factor 0.49 with the exponent 0.33. To ensure nonexceedance of the model predictions for design the factor was increased to 0.60.
Without field data for calibration, the model data are required to be extrapolated by an order of magnitude beyond their tested range when applied to prototype conditions. That the model data appeared consistent over four orders of magnitude of wave energy tested gives some confidence for such an extrapolation. Further, some three years of field data collected in the UK for a vertical seawall at Blackpool and a sloping revetment at Southbourne indicated that maximum scour depths were in accordance with the maximum scour level predictor that was based on the model tests of Sutherland et al. (2006a, b) and (Pearce et al. 2006), of which the data used herein comprised a significant set, in particular those data under breaking waves that caused maximum scour, thereby giving further confidence to prototype application of the scour predictor proposed herein.
Sediment Properties
The experimental data used herein were generated using sediments of various characteristics, being sand with specific gravity of around 2.6 and D50 grain size varying from 90 to 250 μm, and anthracite with specific gravity of 1.4 and D50 grain size varying from 2,100 to 4,200 μm. However, no trends relating to sediment characteristics were seen in the results.
The predictive equation herein does not include any parameters relating to sediment properties, which could be expected to have some influence in the scouring process. However, sediment transport induced by waves breaking against revetments and seawalls will not be very dependent on Shields parameter due to the turbulent nature of the entraining flow, and this would decrease the influence of sediment grain size (Steetzel 1993; USACE 2006, pp. VI-5–236). Nevertheless, it is recommended that this issue be investigated further.
Angle of Wave Attack
The angle of obliquely incident waves on scour around the vertical breakwater heads has been shown to be a factor in scour magnitude, the addition of even small currents moving in the direction of wave propagation may increase scour depth significantly (USACE 2006, pp. VI-5–234). However, no design guidance for this condition has been suggested. Nevertheless, for these conditions comprising shallow water depth-limited breaking waves onto dune revetments and seawalls, wave approach would be very nearly shore-normal, and incident wave obliquity would not occur. However, on beaches there may be longshore rip feeder currents that could exacerbate toe scour. It is noted that the data herein were derived mostly from flume experiments with shore-normal wave attack, with no extraneous currents that may exacerbate toe scour.
Limits of Application
Most of the test results documented herein were two-dimensional, undertaken with smooth-faced revetments and seawalls, albeit with one structure being a rubble mound tested at a large scale. The calibration data for the dune revetment/seawall scour predictor proposed herein had the following limitations:
•
Wave period: 1.1 < Tp < 6.4.
•
Breaking wave height to deep water wavelength ratio: 0.010 < Hb/Lo < 0.065.
•
Breaking wave Iribarren Number: 0.055 < m/(hL/2/L0)0.5 < 0.63.
•
Sand grain size: 90 μm < D50 < 250 μm.
•
Seabed slope: 1/5 < m < 1/75.
•
Foreshore structure slope: 1:3.6 < V:H < 1:0.
•
Three-dimensional beach face processes have not been included.
Some prototype conditions may lie beyond some of these limits and extrapolating results from the scour predictor proposed herein should consider possible scale effects and processes not included in the base data.
Conclusions and Recommendations
A rational method for determining design toe scour levels for dune revetments and seawalls subjected to breaking waves has been presented. The method assumed that the scour level was a function of the incident wave energy and was calibrated and verified with results from several various moveable bed model studies undertaken over a large range of scales. The method yielded scour levels to a SWL datum at the wave-breaking location comprising tide, storm surge, and wave setup. Scour depth was based on wave period, hence, estimates of nearshore wavelength, with the pre-existing depth at a distance of ½ nearshore wavelength in front of the structure assumed to be a surrogate for the breaking wave height. The results from applying the method are sensitive to variations in values assumed for some of the input parameters that, along with their applicable limits and other limitations, should be considered carefully for design.
Some outcomes gleaned from the research included the very important effect of wave period on scour depth and that seabed slope has a significant effect on the relationship between scour depth and wave height, which is not just one simple factor.
Further research is warranted, particularly for scour under variations in sediment characteristics as well as on the effects of revetment shoreface slope and porosity on scour, preferably in flumes at large scales, along with field measurements of prototype experience under severe storms.
Data Availability Statement
All data, models, and code generated or used during the study appear in the published article.
Acknowledgments
Dr. Benjamin Williams, University of Western Australia, assisted with research and suggested exploring the relationship between scour and the Iribarren Number. Anonymous reviewers made several valuable suggestions. This work was presented to the ASCE International Conference on Coastal Engineering with results presented in a three-page extended abstract (Nielsen 2022).
References
Battjes, J. A. 1974. “Surf similarity.” Coastal Eng. Proc. 1 (14): 466–480. https://doi.org/10.9753/icce.v14.26.
Boers, M., P. F. C. van Geer, and M. R. A. van Gent. 2011. “Dike and dune revetment impact on dune erosion.” In Proc., Coastal Sediments, edited by J. D. Rosati, P. Wang, and T. M. Roberts, 810–823. Singapore: World Scientific.
Dean, R. G. 1985. “Physical modelling of littoral processes.” In Physical modelling in coastal engineering, edited by R. A. Dalrymple, 119–139. Boca Raton, FL: CRC Press.
Dean, R. G. 1986. “Coastal armouring: Effects, principles and mitigation.” In Proc., 20th Int. Conf. on Coastal Engineering, edited by B. L. Edge, 1843–1857. Reston, VA: ASCE.
Goda, Y. 2000. Random seas and design of maritime structures. Singapore: World Scientific.
Hughes, S. A. 1995. Physical models and laboratory techniques in coastal engineering. Singapore: World Scientific.
Nielsen, A. F. 2022. “Design toe scour levels for dune revetments and seawalls.” In Proc., 37th Int. Conf. on Coastal Engineering. Extended Abstract. Reston, VA: ASCE.
Noda, E. K. 1972. “Equilibrium beach profile scale model relationship.” J. Waterw. Harbor Coastal Eng. Div. 98 (WW4): 511–528. https://doi.org/10.1061/AWHCAR.0000165.
Pearce, A. M. C., J. S. Sutherland, C. Obhrai, G. Müller, D. Rycroft, and R. J. S. Whitehouse. 2006. “Scour at a seawall - field measurements and physical modelling.” In Proc., 30th Int. Conf. on Coastal Engineering, 3–8. San Diego, CA: Coastal Engineering.
Sager, R. A., and L. Z. Hales. 1979. “VII inlets.” Coastal Hydraulic Models. CERC Special Report No 5, US Army Corps of Eng.
Salauddin, M., and J. M. Pearson. 2019. “Experimental study on toe scouring at sloping walls with gravel foreshores.” J. Mar. Sci. Eng. 7: 198. https://doi.org/10.3390/jmse7070198.
Steetzel, H. J. 1985. “Systematic research into the functioning of dune toe structures–model study into scour near the dune revetment toe.” [In Dutch.]. Delft Hydraulics Technical Report.
Steetzel, H. J. 1988. “Scour holes – analysis of the factors that determine the shape of a scour hole based on available literature of physical model tests.” [In Dutch.]. Delft Hydraulics Technical Report. Delft, Netherlands: Waterloopkundig Laboratorium.
Steetzel, H. J. 1993. “Cross-shore transport during storm surges.” Thesis. Tech. Univ. Delft, Published also as Delft Hydraulics Communication No. 476. Delft, Netherlands: Waterloopkundig Laboratorium.
Sutherland, J., A. Brampton, and R. J. S. Whitehouse. 2006a. “Toe scour at seawalls: Monitoring, prediction and mitigation.” In Proc., 41st Defra Flood and Coastal Management Conf. York, UK: University of York.
Sutherland, J., C. Obhrai, R. J. S. Whitehouse, and A. M. C. Pearce. 2006b. “Laboratory tests of scour at a seawall.” In Proc., 3rd Int. Conf. on Scour and Erosion. Gouda, The Netherlands: CUR.
Tsai, C.-P., H.-B. Chen, and S.-S. You. 2009. “Toe scour of seawall on a steep seabed by breaking waves.” J. Waterw. Port Coastal Ocean Eng. 135 (2): 61–68. https://doi.org/10.1061/(ASCE)0733-950X(2009)135:2(61).
USACE (US Army Corps of Engineers). 1984. Shore protection manual. Vol. 2. Washington, DC: USACE. Coastal Engineering Research Centre, Waterways Experiment Station.
USACE (US Army Corps of Engineers). 2006. Coastal engineering manual. Vol. 6. Washington, DC: USACE. Coastal Engineering Research Centre, Waterways Experiment Station, US Army Corps of Engineers, EM 1110-2-1100.
Van der Meer, J. W., and K. W. Pilarczyk. 1988. “Large verification tests on rock slope stability.” In Coastal Engineering, edited by B. L. Edge, 2116–2128. Reston, VA: ASCE.
Van Rijn, L. C. 2018. “Local scour near structures.” www.leovanrijn-sediment.com.
Information & Authors
Information
Published In

Journal of Waterway, Port, Coastal, and Ocean Engineering
Volume 149 • Issue 3 • May 2023
Copyright
This work is made available under the terms of the Creative Commons Attribution 4.0 International license, https://creativecommons.org/licenses/by/4.0/.
History
Received: Aug 30, 2022
Accepted: Dec 16, 2022
Published online: Mar 2, 2023
Published in print: May 1, 2023
Discussion open until: Aug 2, 2023
ASCE Technical Topics:
- Coastal engineering
- Coastal protection structures
- Coasts, oceans, ports, and waterways engineering
- Dunes
- Energy engineering
- Energy sources (by type)
- Engineering fundamentals
- Hydraulic engineering
- Hydraulics
- Mathematics
- Models (by type)
- Movable bed models
- Parameters (statistics)
- Renewable energy
- Revetments
- Riprap
- Scour
- Sea walls
- Shores
- Statistics
- Structural engineering
- Structures (by type)
- Water and water resources
Authors
Metrics & Citations
Metrics
Citations
Download citation
If you have the appropriate software installed, you can download article citation data to the citation manager of your choice. Simply select your manager software from the list below and click Download.
Cited by
- Sarinya Sanitwong-Na-Ayutthaya, Cherdvong Saengsupavanich, Effi Helmy Ariffin, Amila Sandaruwan Ratnayake, Lee Shin Yun, Environmental impacts of shore revetment, Heliyon, 10.1016/j.heliyon.2023.e19646, 9, 9, (e19646), (2023).