Quantifying the Impact of Subgrade Stiffness on Track Quality and the Development of Geometry Defects
Publication: Journal of Transportation Engineering, Part A: Systems
Volume 143, Issue 7
Abstract
This paper presents the quantification of the impact of subgrade stiffness on the prevalence of track geometry defects and degradation of track quality indices (TQIs). The data included in this study come from two high-traffic subdivisions [ million gross tonnes (MGT)/year] in Canada with a total length of 800 km and consist of vertical track deflection (VTD) measurements and 3 years of track geometry measurements. The VTD measurements were used to derive two indices that represent the magnitude and variability of the subgrade stiffness. An analysis of the data shows that the locations at which defects occur correspond to locations with low modulus (higher VTD) and high variability of track modulus. A similar correlation is shown with track roughness represented by a TQI. However, the correlation with the spectrum of TQI calculated was found to be poor. This was attributed to maintenance activities carried out to improve track conditions. The correlation with the TQI greatly improved when arbitrary thresholds were applied and TQI values above this were treated as geometry defects. These results show that the locations that have a low modulus and high variability in the modulus are those that are the most difficult to maintain and at which maintenance is not always able to keep up with the degradation of track geometry. Thus, VTD measurements evaluate the underlying causes that result in the degradation of track conditions and allow for the identification of sections where poor track conditions are most likely to develop.
Introduction
Low track modulus and large changes in track modulus have been identified as causes of an increased rate of degradation of track geometry and the subsequent development of track geometry defects (Ebersöhn et al. 1993; Read et al. 1994; Cai et al. 1994; Sussmann et al. 2001; Esveld 2001; Zarembski and Palese 2003; Davis et al. 2003). The rate of development of irregularities in track geometry is important because track geometry defects are the second leading cause of derailments in both the United States and Canada (Liu et al. 2012; TSB 2013). The influence of subgrade on track performance has been identified through localized field measurements, observations, and extensive experience within the industry. However, it is difficult to make the case to increase track stiffness when there has not been a means to estimate the improvement in performance or the reduction of the probability of developing unsafe track conditions. To date, there has been only a limited quantification of the impact of the track modulus because there has been no practical means to measure the modulus or associated vertical track deflection (VTD) under heavy axle loads over long distances until recently.
The authors have completed extensive trials (over 12,000 km of measurements) with a VTD measurement system that has become commercially available (Roghani and Hendry 2016). The VTD measurements were found to be highly impacted by variations in the track surface condition; however, filtering out wavelengths less than 20 m resulted in , which is a measure of the stiffness of the subgrade and the embankment construction (Roghani and Hendry 2016). Obtaining over extensive lengths of track has presented the opportunity to further investigate the impact of the track modulus and its variation on the performance of track geometry. This paper presents an analysis of and track geometry records to quantify the impact of VTD and changes in VTD, and thus track modulus and variations in track modulus, on the degradation of geometry and the development of geometry defects. The 800 km of data used in this analysis come from two high-traffic subdivisions separated by thousands of kilometers in different physiographic regions of Canada and with different subgrade types. The track structure on both subdivisions predominantly consists of continuously welded rail (CWR) and concrete ties. The first subdivision is located within the interior plains (a.k.a. the Prairies) and the second subdivision within the Canadian Shield. This results in a large database with wide range of track quality and conditions for the purpose of this analysis.
Measured Data Sets
Vertical Track Deflection Measurements
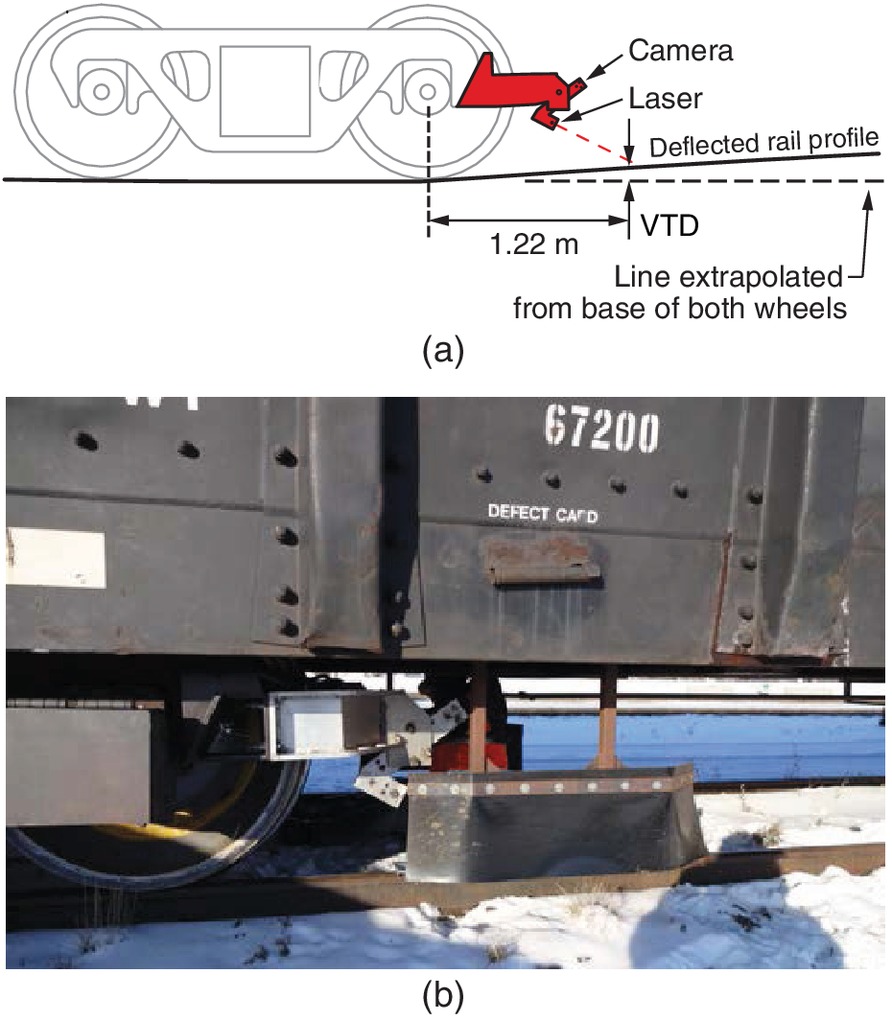
The VTD measurements were recorded using an MRail rolling deflection measurement system that was developed at the University of Nebraska at Lincoln in collaboration with the Federal Railroad Administration (FRA) (Norman 2004; Norman et al. 2004; McVey et al. 2005; Farritor 2006; McVey 2006; Arnold et al. 2006, Lu 2008; Greisen 2010; Farritor and Fateh 2013). The system consists of a laser and camera that measure the deflection of track at a distance of 1.22 m toward the center of the car from an inboard wheel, relative to a datum at the base of that wheel (Fig. 1). VTD measurements were taken every 0.305 m (1 ft) along the track on both rails. This VTD system was used over the two subdivisions between May and July of 2015. The collected VTD measurements were processed to calculate using the methodology presented in Roghani and Hendry (2016). In both measurement runs, the MRail system was installed on a ballast car loaded to 117.7 t and axle load of . The measurement system was operated within revenue service and, as a result, the weight of the axles of the adjacent car or locomotive could not be specified, only measured. The variations in loading of the car or locomotive adjacent to the measurement system may change VTD measurements and the resulting (Roghani and Hendry 2016). For the Prairie subdivision, the instrumented car was adjacent to a six-axle locomotive with axle loads of , and for the Shield subdivision, it was adjacent to a freight car with axle loads of .
Track Geometry Measurements
Track geometry measurements are used by the railway industry to ensure that the shape of the rail allows for the safe passage of trains at the designated maximum speed of the track (AREMA 2012). The ability to maintain operable track geometry is the primary function of the infrastructure beneath the track; thus, the ability of these structures to maintain this geometry is the metric by which the subsequent analyses defines performance.
Track Geometry Measurements
The geometry measurements used in this analysis included gauge, alignment, and the surface parameters, including profile, crosslevel, and warp. These geometry measurements are standardized and regulated (AREMA 2012; FRA 2007; TC 2011). The gauge is the distance between two rails measured 16 mm below the top of rail with a standard gauge equal to 1,435.1 mm (56.5 in.), the alignment is the horizontal deviation of the gauge side (inside) of the rail from a line subtended from two points 18.9 m apart on this surface measured at the midpoint of that line (a.k.a. a midchord offset), the profile is the midchord offset measured vertically on the surface of the rail, the crosslevel is the elevation difference between both rails on a tangent track, and the warp is the difference in crosslevel values between two points located 18.9 m (62 ft) or 9.5 m (31 ft) apart along the track. Geometry measurements were also taken every 0.305 m (1 ft) along the track.
Track Geometry Defects
A track geometry defect exists when the measured values of track geometry exceed threshold values set within regulations (FRA 2007; TC 2011; Table 1). These threshold values are defined based on an assigned class of track, where the class of track is defined to limit the speed of trains to match the condition of the track. According to both Transport Canada and the FRA, Class 1 has the lowest maximum track speed of (10 mph) and the highest geometry thresholds, and Class 5 has the highest of (80 mph) and the lowest geometry thresholds. A section of track is maintained to meet the requirements of its assigned class and thus the maximum allowable speed. Both subdivisions included within this study consisted primarily of Class 3 and 4 tracks. Short sections of Class 2 track exist within these subdivisions, but were excluded from this study.
| Track classification | Maximum allowable speed [ (mph)] | Gauge not less than [mm (in.)] | Gauge not more than [mm (in.)] | Profile (surface) [mm (in.)] | Crosslevel (tangents and curves) [mm (in.)] | Warp [over 18.9 m (62 ft) distance] [mm (in.)] | Alignment (tangent) [mm (in.)] |
|---|---|---|---|---|---|---|---|
| Class 1 | 16 (10) | 1,416.1 (55.75) | 1,473.2 (58) | 76.2 (3) | 76.2 (3) | 76.2 (3) | 127.0 (5.0) |
| Class 2 | 40 (25) | 1,416.1 (55.75) | 1,466.9 (57.75) | 69.9 (2.75) | 50.8 (2) | 57.2 (2.25) | 76.2 (3) |
| Class 3 | 64 (40) | 1,422.4 (56) | 1,466.9 (57.75) | 57.2 (2.25) | 44.5 (1.75) | 50.8 (2.0) | 44.5 (1.75) |
| Class 4 | 97 (60) | 1,422.4 (56) | 1,460.5 (57.5) | 50.8 (2) | 31.8 (1.25) | 44.5 (1.75) | 38.1 (1.5) |
| Class 5 | 129 (80) | 1,422.4 (56) | 1,460.5 (57.5) | 31.8 (1.25) | 25.4 (1) | 38.1 (1.5) | 19.1 (0.75) |
Note: The regulations provide these values in imperial units (mph, in., and ft).
Railway operators often refer to regulated defects as urgent defects. Priority defects are a second category, with stringent thresholds defined by the operator. The threshold values used for priority defects in this study are presented in Table 2. The list of defects provided from the track geometry measurements consisted of 3 years of both priority and urgent defects from 15 different runs of a track geometry car for each study subdivision. The data set for urgent defects was too sparse (few and far between) for the analyses presented within this paper; thus, the priority defects and urgent defects were combined into a single data set and are subsequently referred to collectively as defects.
| Track classification | Maximum allowable speed [ (mph)] | Gauge not less than [mm (in.)] | Gauge not more than [mm (in.)] | Profile (surface) [mm (in.)] | Crosslevel (tangents and curves) [mm (in.)] | Warp [over 18.9 m (62 ft) distance] [mm (in.)] | Alignment (tangent) [mm (in.)] |
|---|---|---|---|---|---|---|---|
| Class 1 | 16 (10) | 1,416.1 (55.75) | 1,463.7 (57.625) | 50.8 (2) | 25.4 (1) | 57.2 (2.25) | 95.3 (3.75) |
| Class 2 | 40 (25) | 1,416.1 (55.75) | 1,454.2 (57.25) | 38.1 (1.5) | 25.4 (1) | 44.5 (1.75) | 57.2 (2.25) |
| Class 3 | 64 (40) | 1,422.4 (56) | 1,454.2 (57.25) | 32.7 (1.25) | 25.4 (1) | 38.1 (1.5) | 34.9 (1.375) |
| Class 4 | 97 (60) | 1,422.4 (56) | 1,454.2 (57.25) | 25.4 (1) | 25.4 (1) | 34.9 (1.375) | 28.6 (1.125) |
| Class 5 | 129 (80) | 1,422.4 (56) | 1,454.2 (57.25) | 19.1 (0.75) | 17.5 (0.6875) | 28.6 (1.125) | 9.5 (0.375) |
Note: The thresholds are defined by the operators in imperial units (mph, in., and ft).
A major focus of maintenance activities is to maintain the geometry of the tracks such that defects do not develop. Thus, the development of defects is a result of both the track conditions and the maintenance of the site. The locations of defects are locations at which the maintenance was not sufficient to maintain the track conditions to the standards of the railway operator.
Track Quality Index
Track quality indices (TQIs) are a common metric for track quality, and they are used to describe the variance, or roughness, of the available measures of geometry (Hyslip 2002; El-Sibaie and Zhang 2004; FRA 2005; Berawi et al. 2010; Sadeghi and Askarinejad 2010). These indices are useful in that they can be evaluated along the length of the track and provide a range of values, as opposed to defects that occur at discrete locations. TQI is not regulated within the North American railway industry, but it has been suggested that it should be limited to reduce dynamic forces and thus the rate at which track components and rolling stock deteriorate (Zarembaski and Bonaventura 2010). It is used within the following analysis to provide a representation of the roughness and conditions along the length of the track.
The standard deviation of the geometric measures evaluated for a section of track provides a simple TQI that is as representative of track roughness as more complex formulations for TQI (ORE 1981). A running standard deviation was used to calculate the TQI for the track profile (), gauge (), crosslevel (), and alignment () [Eq. (1)], where a higher TQI (standard deviation) shows the track to be rougher and implies that it is in poorer condition. These TQIs were evaluated over 20 m running lengths of track to match the filter of the measured VTD data to which they will be compared (Roghani and Hendry 2016)where = deviation of geometry parameter measured at point ; = number of sequential measurement datum; and = average of the data within the sample.
(1)
The assessment of performance based on the TQI is complex because the geometry of the track at any time is as much of a result of maintenance activities as it is of the performance of the infrastructure. Poorly performing structures that have undergone recent maintenance may have close to optimal geometry conditions, whereas very competent track that has not required recent maintenance may have higher variations in geometry. The impact of maintenance is thus expected to obscure the trends in geometry that develop due to poorer-performing infrastructure.
Evaluation of VTD-Based Measurements
Development of Threshold Values for from AREMA Standards
The published works and research regarding soft subgrades have quantified the condition of track using a track modulus (), not VTD, where is defined as the ratio of VTD and the pressure between base of the rail and the underlying ties and foundation and is a measure of the stiffness of the structure (Cai et al. 1994). Parametric studies have shown to be primarily influenced by the subgrade conditions (Stewart and Selig 1982; Stewart 1985; Selig and Li 1994; Shahu et al. 1999; Shahin and Indraratna 2006; Rose and Konduri 2006). The numerical analysis conducted by Selig and Li (1994) concluded that changes in track modulus, where the modulus is (4,000 psi), results in substantial increase in track deflection, rail and tie bending stress, and subgrade stresses. Hay (1982) and the American Railway Engineering and Maintenance of Way Association (AREMA 2012) manual suggested that 14 MPa (2,000 psi) is the minimum value of required for satisfactory performance of the track. Similarly, Ahlf (1975) found through field observations that a track modulus resulted in track that required an exceptional amount of maintenance to maintain, a track modulus between 14 and 28 MPa was average, and a track modulus greater than 28 MPa was good. The terms satisfactory, poor, average, and good used by AREMA (2012) and Ahlf (1975) are qualitative and describe the amount of maintenance that is required to maintain the track in an operational condition. Poorer performance requires more maintenance and monitoring to ensure operational conditions.
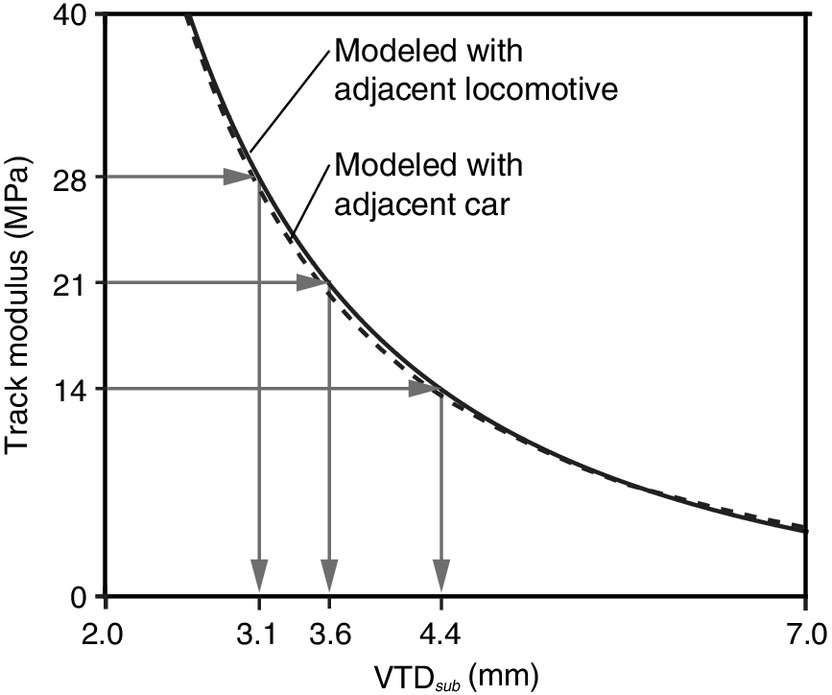
The analyses presented within this paper are conducted with VTD measurements, and the thresholds for are converted to because can be measured and evaluated. This conversion was based on Fallah et al. (2016), which showed that the average over a 20-m section of track with continuously welded rail (CWR) could be determined with the Winkler model and the measurement from the MRail system and axle loads. Thus, conversions for to were developed for both loading conditions (adjacent car or locomotive) using the Winkler model; these modeled relationships between and are compared in Fig. 2. It is evident from Fig. 2 that there is very little difference () between the values obtained when a locomotive is adjacent to the instrumented car as opposed to when a loaded rail car is adjacent. Thus, a single equation was developed to provide a conversion between and for both of these loading conditions [Eq. (2)]where = track modulus (MPa) and (mm). From Fig. 2 and Eq. (2), is equivalent to the lower threshold of 14 MPa, and is equivalent to upper threshold of .
(2)
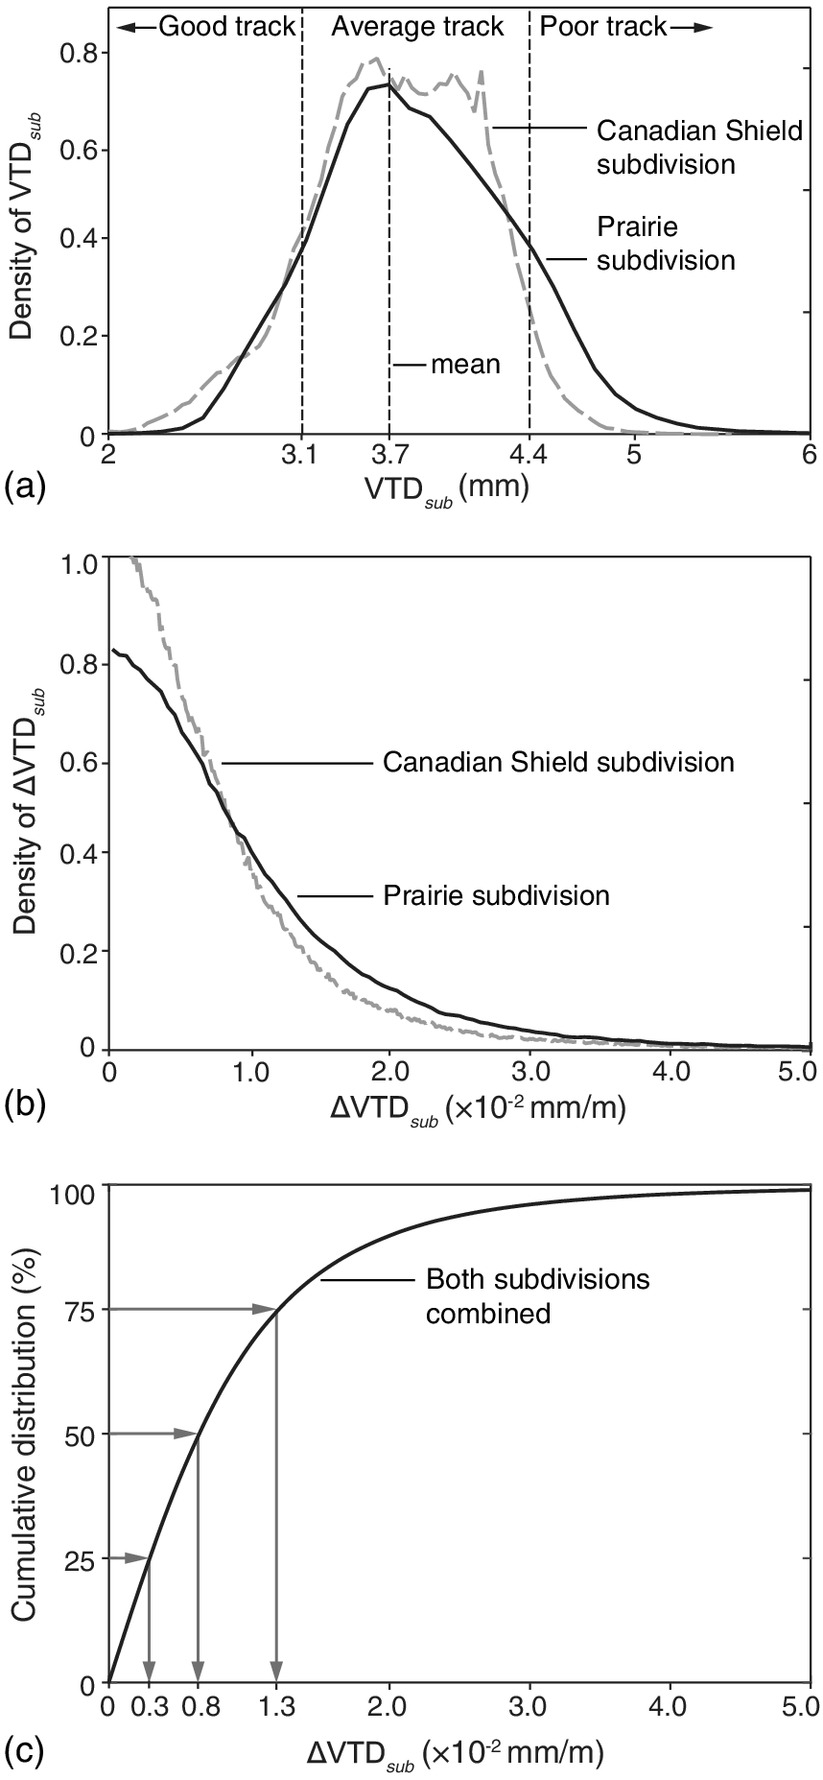
The distribution of from both study subdivisions is presented in Fig. 3(a), along with the threshold values for derived from the AREMA thresholds for . Overall, has a normal distribution, where the mean (and median) of is 3.7 mm, and the standard deviation () is 0.5 mm. From Fig. 3(a), the AREMA thresholds provide a reasonable agreement with the measured distributions, with 12% of the track classified as good and the threshold below the mean, 78% as average, and 10% as poor, with the threshold above the mean. The Prairie subdivision shows a higher prevalence of poor track than the Canadian Shield subdivision, and thus softer subgrade conditions. The average range was subdivided at the mean to result in four categories and increased resolution.
Quantifying the Change of
There is no precedent for the quantifying the change in modulus or the corresponding change in VTD; thus, a metric was devised for this study. The slope of versus distance plot was adopted as a simple and transparent metric to quantify change of track deflection () over a distance, where is calculated as the absolute value of secant slope of , and distance () is the length of track over which this slope is evaluated [Eq. (3)]. For this analysis, was set equal to 20 m to be consistent with the other metrics and filtering used for the analysis of VTD measurements
(3)
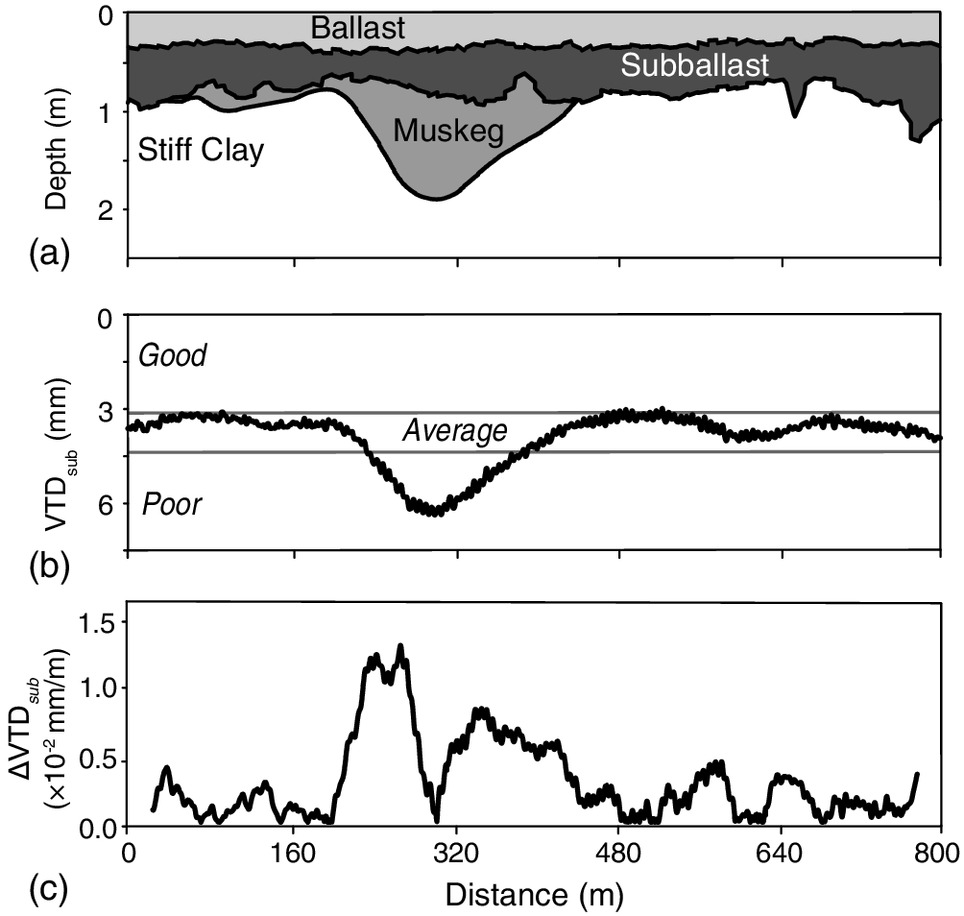
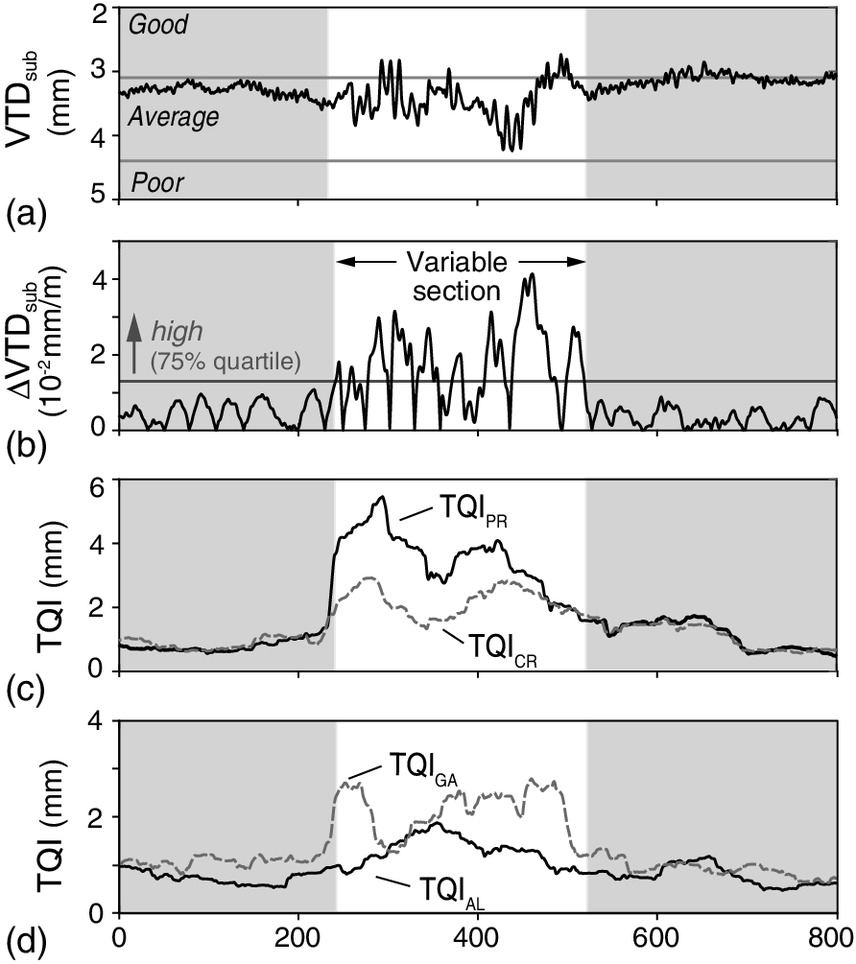
The meaning of is demonstrated in Fig. 4, which shows the stratigraphy of an 800-m section of track. Fig. 4(b) plots the measured over this track, and Fig. 4(c) plots the calculated from the . An increase in is the result of an increase in slope in the plot and corresponds to a higher spatial change of and thus .
The distribution of from both study subdivisions is presented in Fig. 3(b). Fig. 3(b) shows that the 99% of values vary between 0 and within the two subdivisions evaluated. The folded-normal distribution of is a result of the use of an absolute value within Eq. (3), and results in a mode of 0 and a mean value of . The Prairie subdivision shows a higher prevalence of high . There are no thresholds that can be adopted to quantify the track conditions based on ; thus, arbitrary values are imposed that divide the track into four sections that comprise equal lengths of track (quartiles). This division is based on the cumulative distribution of presented in Fig. 3(c), where the 25, 50, and 75% quartile thresholds correspond to values of 0.003, 0.008, and .
Impact of VTD on Track Geometry
This section presents the quantification of the impact of the track deflection parameters and on the prevalence of defects and high values of the TQI that imply poor-performing track with an increased probability of developing unsafe track conditions.
, , and the Development of Geometry Defects
The defect data are composed of discrete locations at which priority and urgent threshold values were exceeded. The comparison of the location of defects and the VTD measurements was based on the coordinates from the global positioning systems (GPS) used for the measurements. Both the GPS used for the track geometry and the VTD measurements had a specified R95 (the radius of a circle centered at the true position, containing the position estimate with probability of 95%) of 3.7 m. Thus, the and evaluated at the location of each identified defect were the average of the values measured within 7.4 m of the defect. These results were found to be insensitive to the variation of this 7.4-m window from 1 to 10 m; this insensitivity is attributed to the 20-m filtering applied to generate the .
This defect data were analyzed to determine the prevalence of defects per kilometer of track within the different categories defined by the divisions of and . Thus, the combined defects from both subdivisions were sorted into one of 16 categories based on the four divisions of and . The number of defects within each of these categories was divided by the number of kilometers of track within each category to allow for a comparison of the intensity of the occurrence of defects generated by each classification of track. The results of this categorization are presented in Fig. 5 for Class 4 track and Fig. 6 for Class 3 track. There were too few alignment defects to include in this analysis, with no Class 4 alignment defects and only 50 Class 3 alignment defects (or 3% of total number of defects).
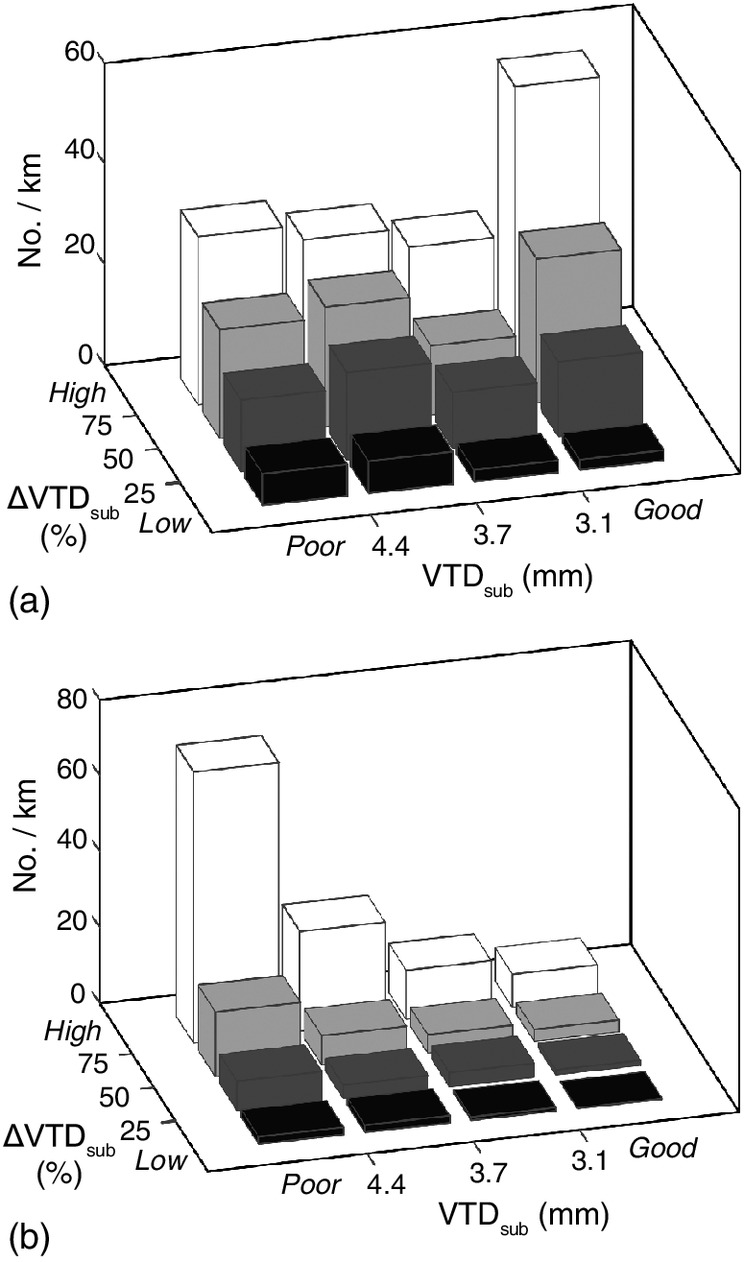
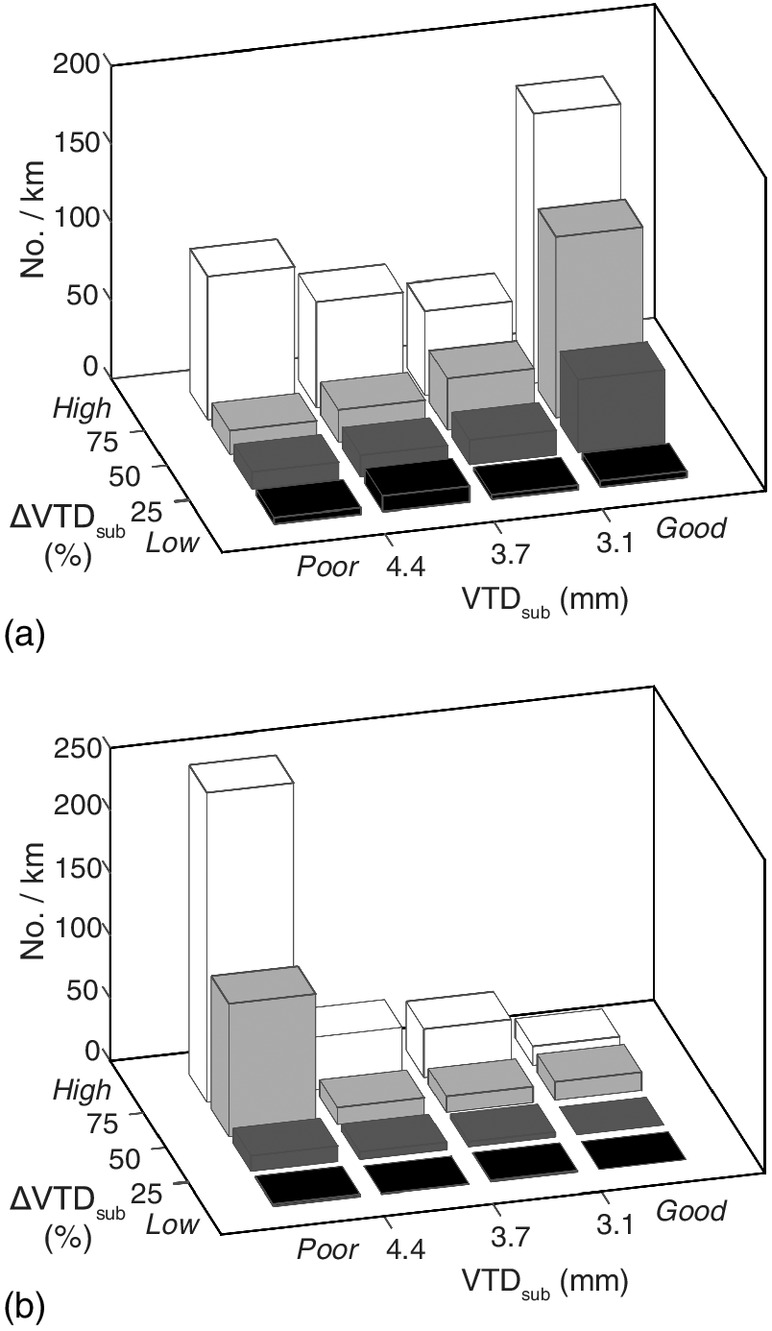
Surface defects and gauge defects make up 30 and 70% of the total number of Class 4 defects, respectively. Figs. 5(a) and 6(a) show a strong relationship between gauge defects and , but not with , with the highest number of defects occurring with high and over the stiffest track (good ). The authors hypothesize this is the result of higher dynamic loads that occur at transitions between differing track moduli, a mechanism suggested in Li et al. (2015), with the stiffest track providing less attenuation for impacts. The number of defects over the track with the most consistent (low ) suggests that there is only a very small contribution by factors not represented within this comparison. Figs. 5(b) and 6(b) show a strong relationship between surface defects and both and , with the highest number of defects occurring with high and poor . These surface defects appear to be the result of both high deflections (low stiffness) and dynamic loads resulting from the changes in stiffness. The very small number of defects occurring where there are good and low suggests that these two metrics describe the primary conditions that result in surface defects. These trends between gauge, surface defects, , and were found to be consistent between the two subdivisions, with only slight variations in the magnitudes.
The surface defects [Fig. 5(b)] can be further divided into warp [Fig. 7(a)], crosslevel [Fig. 7(b)], and profile [Fig. 7(c)] defects, each with a distribution within the and classifications. These plots show that the highest frequency of warp, crosslevel, and profile defects occur with poor and high . Both and contribute to the generation of defects, though warp and profile defects show a greater impact of [Figs. 7(a and c)]. Similar correlations were found between Class 3 warp, crosslevel, profile defects, and and from both subdivisions (Fig. S1 ).
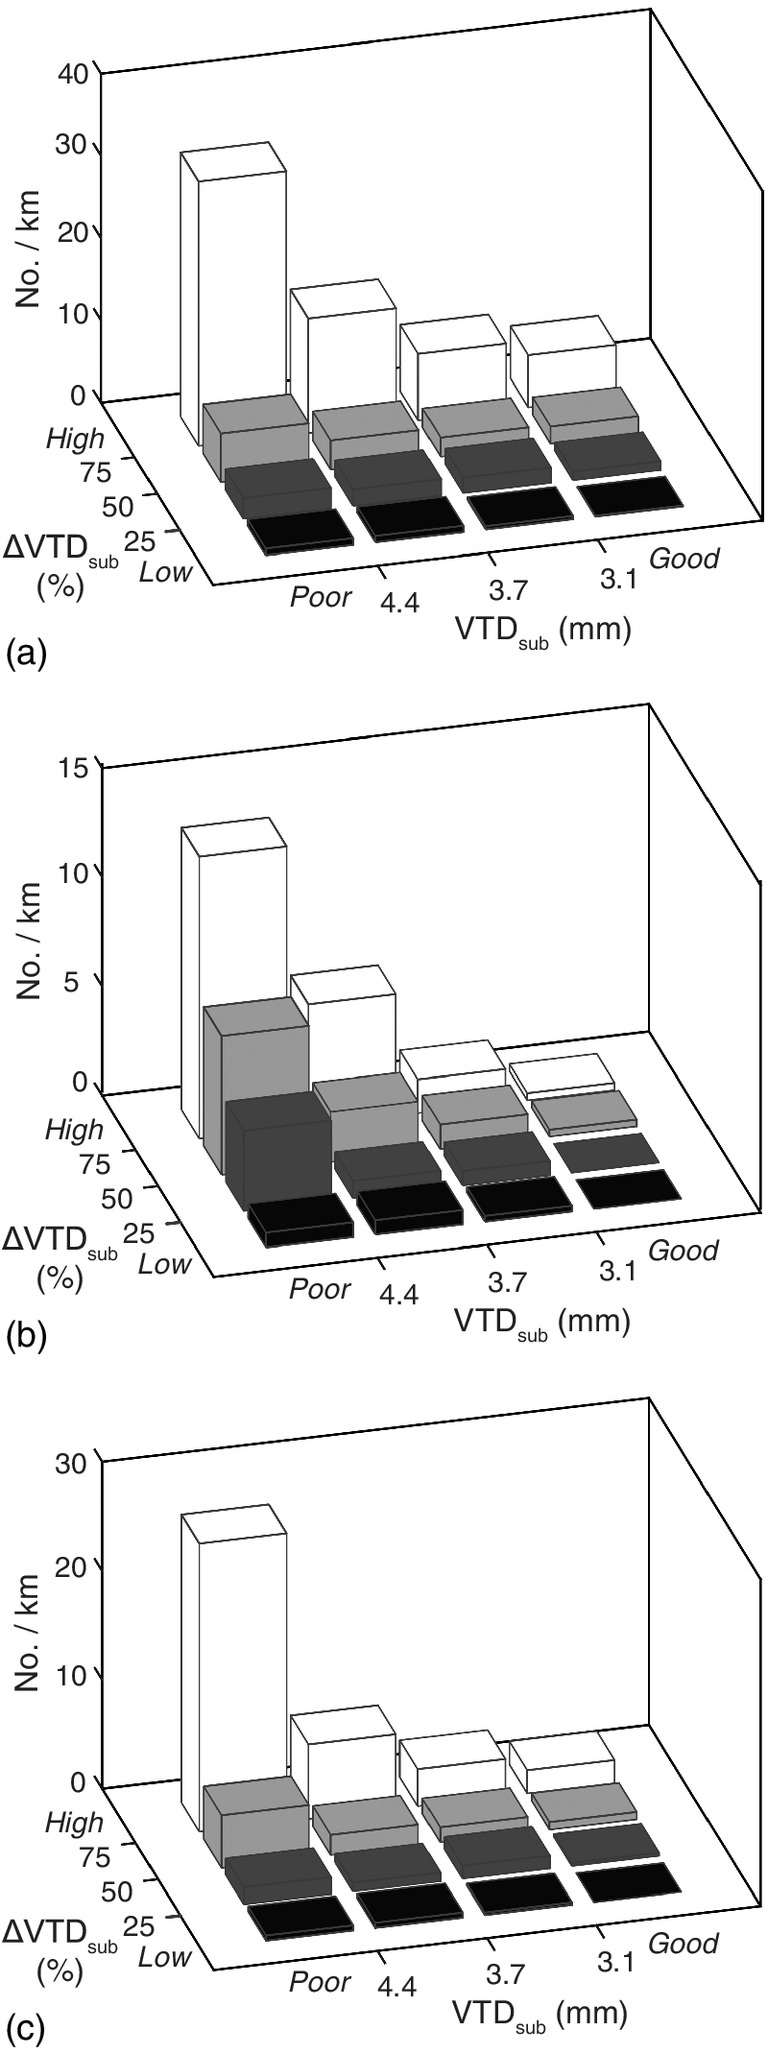
The significance of poor and high on the development of surface defects is evident from all the plots presented in Fig. 7. The number of Class 4 warp, crosslevel, and profile defects per km generated at locations with from the highest 25% was 2.6, 1.2, and 2.8 times that from the remaining 75% of the track, respectively [Figs. 7(a–c)]. Similarly, the number of Class 4 warp, crosslevel, and profile defects per km generated at locations with poor was 1.0, 1.7, and 1.7 times that from the remaining 82% of the track [Figs. 7(a–c)].
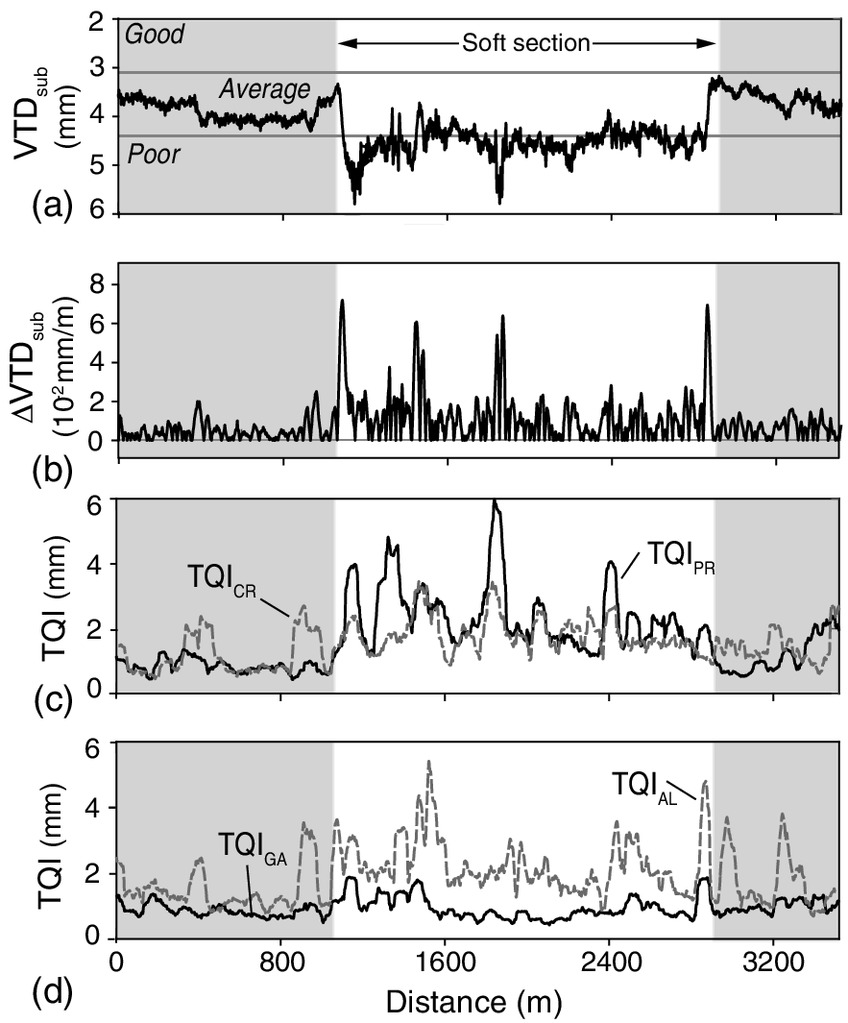
, , and Track Geometry Roughness
An examination of the VTD and TQI data was conducted to observe whether locations with higher and correspond to higher local TQI values obtained from one measurement of track geometry. This examination showed that elevated TQI coincided with two cases of VTD: the first are locations with elevated and , and the second are locations with elevated but lower . An example of the first condition is presented in Fig. 8, which shows a 2-km section of track of poor track conditions () with more competent track on both ends [Fig. 8(a)], with high at transitions and variations of stiffness [Fig. 8(b)]. TQI measures, excluding , increase within the section of poor [Figs. 8(c and d)]. Local peaks in TQI, including , are coincident with peaks in [Figs. 8(c and d)]. An example of the second condition is presented in Fig. 9, which shows an 800-m section of track of average to good track conditions based on [Fig. 9(a)], with a 270-m section of track with high [Fig. 9(b)]. TQI measures increase within the section of high [Figs. 9(c and d)], though the alone would suggest this to be a relatively competent structure.
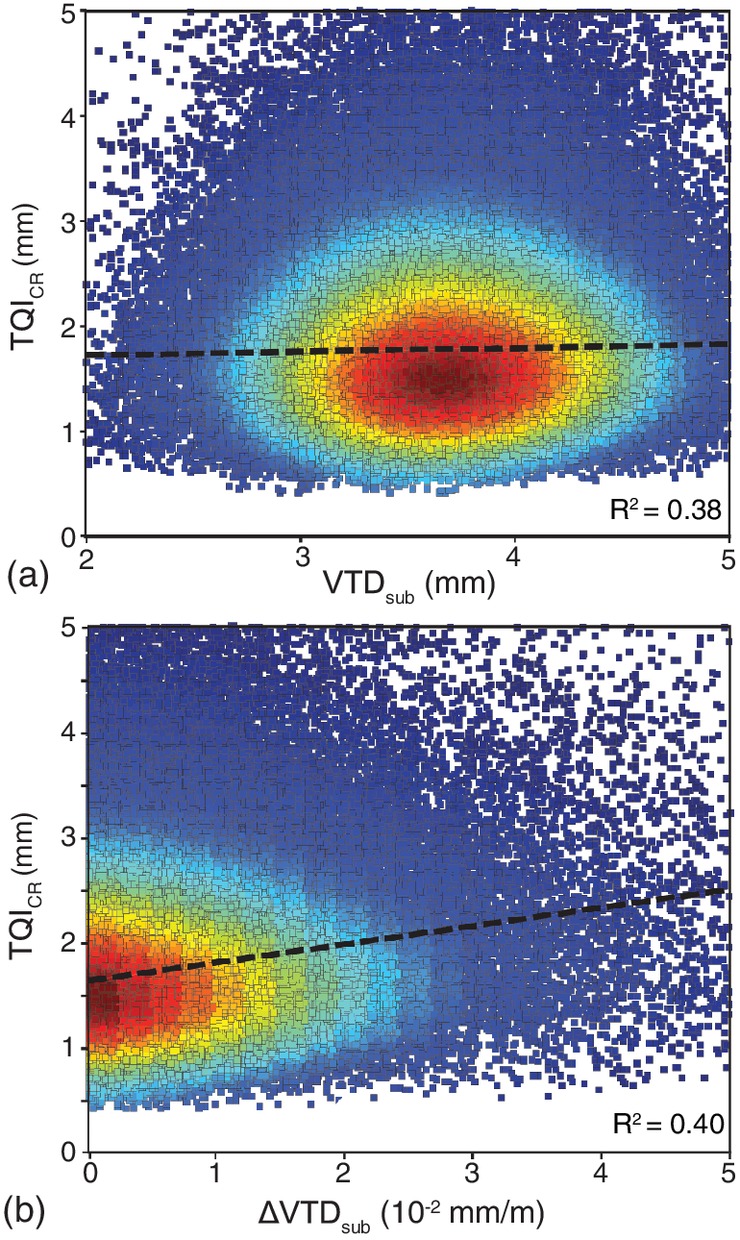
Plots of versus are presented in Fig. 10(a) and versus in Fig. 10(b). The plots in Fig. 10 show that at any given or , there is a spectrum of values that result in a poor correlation, with a coefficient of determination () of 0.38 and 0.40 from the linear regression. Plots for , , and show very similar plots, with values ranging from 0.35 to 0.56. Because these regressions are developed from 2,235,328 data points, there is a probability that an underlying correlation between increasing TQI, , and exists (Smith 2015). Nonlinear correlations and further data processing to match the peaks of TQI and that are offset from one another (Fig. 8) to account for the accuracy of the GPS locations and selection of TQI from differing track geometry measurements did not result in a stronger relationship between TQI, , and . This relationship is obscured by the impact of maintenance. The authors have not included the equations so they are not used to predict track conditions.
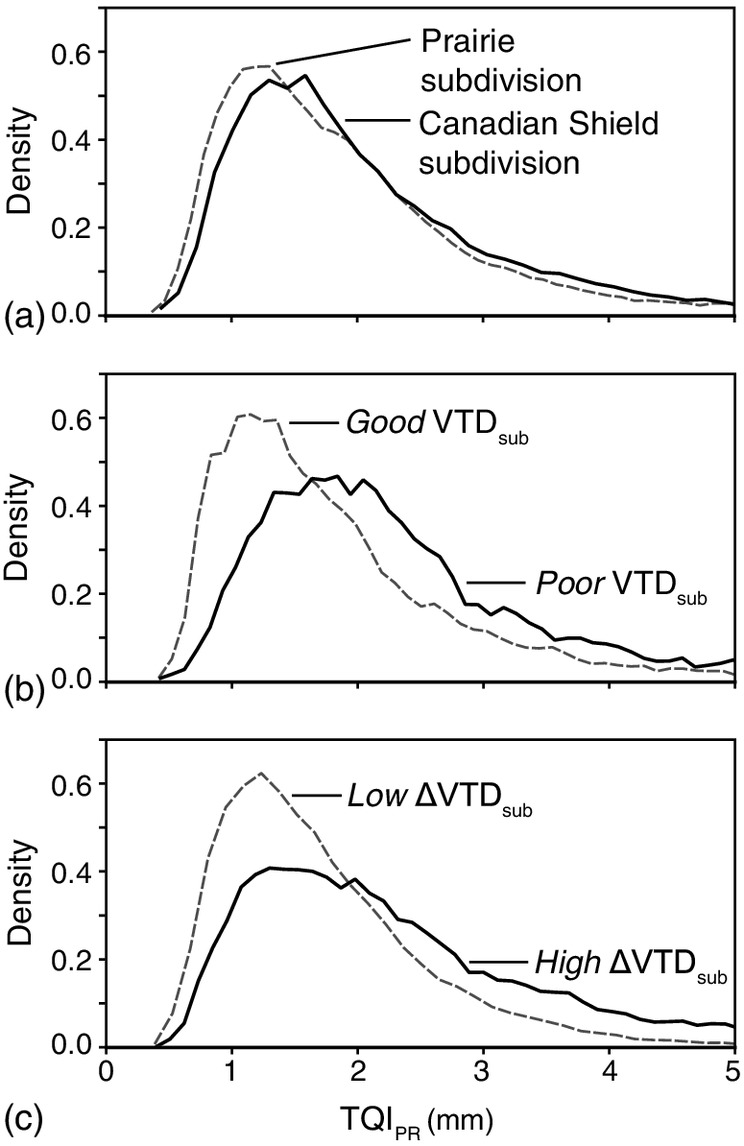
A simpler comparison between TQI, , and can be shown with the distribution of TQI values within the differing catagories of and (Fig. 11). Fig. 11(a) presents the skewed, but similar, distributions of values from both the Prairies and Canadian Shield subdivisions from a single measurement of track geometry; similar plots of the distributions of , , and are presented in Fig. S2 . The range of values for the TQI is between 0.5 and 5.0 mm, with the exception of , which has a narrower range of 0.5 and 3.0 mm. Fig. 11(b) presents the distributions of the for track divided into subsets of good and poor , and Fig. 11(c) presents the distributions of the for track divided into subsets of high and low . It is clear from the distributions presented in Figs. 11(b and c) that the trend of higher VTD metrics resulting in higher values does exist within the data. There is a significant amount of overlap in the distributions of for the different catagories of and ; this was also evident in this data as plotted in Fig. 8, and again shows the inability to predict from and . The poor and high categories show a wider distribution [Figs. 11(b and c)], whereas the good and low categories show a more concentrated distribution. From Figs. 11(b and c), the categories of are a slightly better discriminator of expected than the categories of because the difference between the peaks (modes) in Fig. 11(b) is greater than those in Fig. 11(c). However, the categories of appear to be better indicators of high because they show very similar densities for the differing categories of for [Fig. 11(b)], in contrast to the large difference between the densities between the differing categories [Fig. 11(c)]. Similar observations can be made for the distributions of , , and , which are presented in Fig. S3 . The exceptions are the relationship between the alignment and crosslevel with the , for which the distributions for good and poor were nearly identical, suggesting that does not impact the roughness of the alignment and crosslevel.
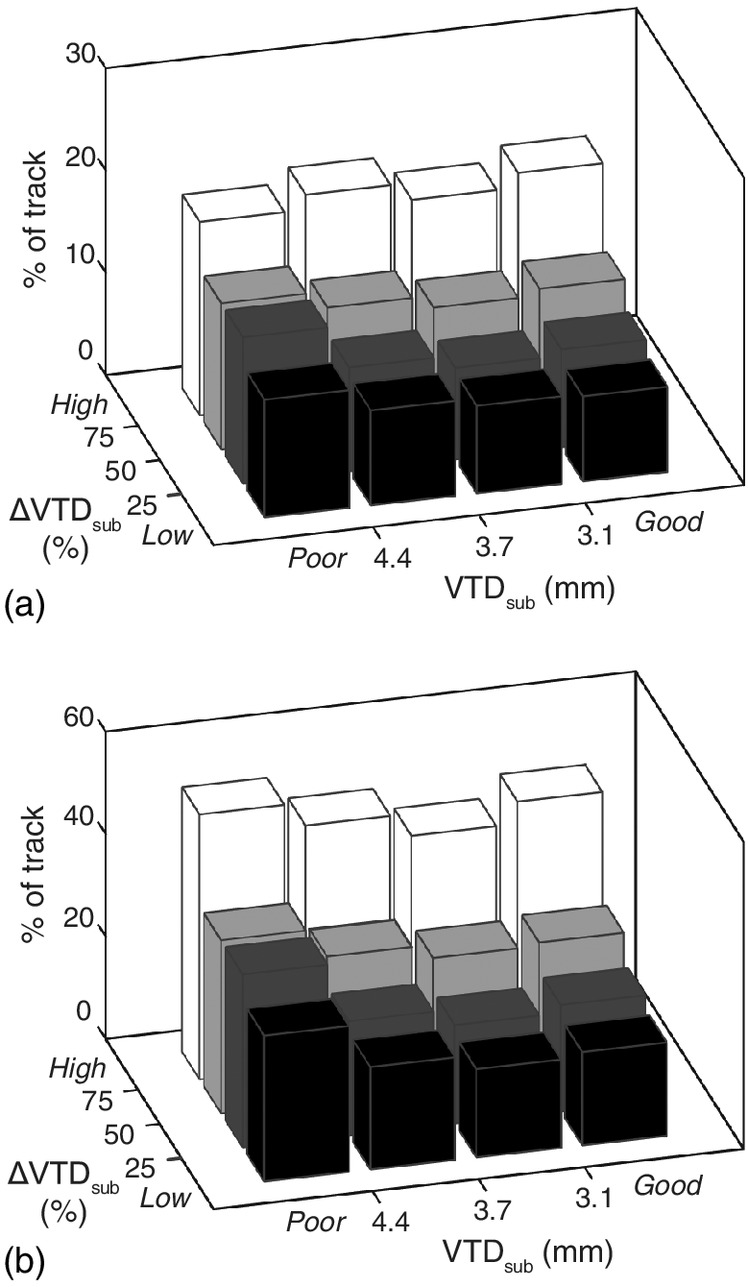
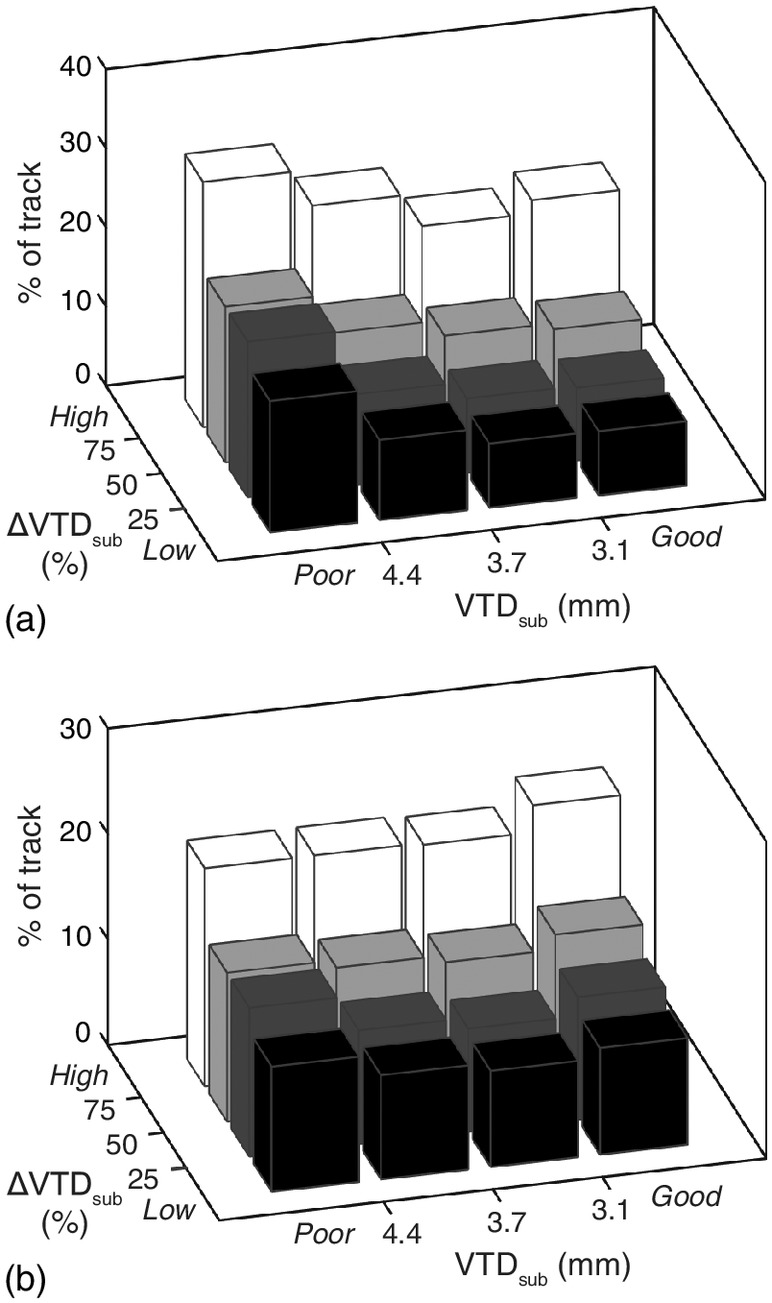
The contrast between the strength of the relationship between defects and VTD but not between TQI and VTD led to further examination of the TQI distributions to determine why this difference exists. The authors suggest that this difference is a result of the use of threshold values for geometry in the evaluation of defects versus analyses of the full spectrum of possible TQI values. Additionally, poor and high have a much higher representation at higher values of TQI (Fig. 11). Thus, an arbitrary threshold of 3.0 mm was applied to the TQI, and the locations that exceeded this value were given the same treatment as the geometry defects. The sections of track from both subdivisions were divided into 16 categories based on and . Figs. 12(a and b) show the percentage of total amount of track with and surface-related TQI ( and ) that exceed the 3.0-mm threshold. The correlation between and surface-related TQI was strong with and showed no correlation with . This shows the significance of in development of poor track roughness, with the average percentage of track with increasing from 9.4 to 19.6% when changes from low () to high (). This impact is even more pronounced for the surface-related TQIs, where a change in from low to high increases the average percentage of track with from 21.0 to 47.2%.
The surface-related TQIs [Fig. 12(b)] could be further divided into [Fig. 13(a)] and [Fig. 13(b)]. shows a strong correlation with , whereas for , both and contribute. A sensitivity analysis was also conducted on the threshold value for TQI. It was found that these trends become obscure if the threshold is reduced below 2.5 mm, and remain strong with increasing thresholds until the data set above the threshold becomes too small to trend.
Conclusions
More than 800 km of VTD and track geometry measurements from two subdivisions from different physiographic regions of Canada were processed to evaluate the impact of substructure condition on track performance. The substructure condition was quantified by both VTD and track geometry measurements. The VTD measurements were filtered for a that is representative of the subgrade conditions and was put into context with AREMA suggested track modulus values. The slope of the versus distance, , was used to quantify changes in track stiffness as they appear within VTD measurements. The geometry measurement data consisted of 3 years and 15 measurements of priority and urgent defects and track quality indices from the two subdivisions.
From the analysis of and , and the comparison to generation of priority and urgent defects and TQI, the following conclusions were developed. The geometry of the track, represented as the geometry measurements or as TQI, does have an underlying relationship with the subgrade conditions, more so with changes in VTD (), and thus variation of modulus, than the magnitude of . This relationship is obscured in the data due to the effects of maintenance that is regularly carried out to minimize the development of poor track conditions. The use of threshold values for both the track geometry measurements to obtain defects and for the TQI shows a strong correlation with and . These results show that the locations that have a low modulus (higher VTD) and a high variability in the modulus are those that are difficult to maintain and at which maintenance is not always able to keep up with the degradation of the track geometry. These VTD measurements evaluate the dominant causes of degradation of track conditions and allow for the identification of sections where it is most likely that maintenance will not always be able to keep up with degradation even if maintenance has done so recently.
The two subdivisions showed similar distributions of , , TQI, and defects per kilometer despite being in different physiographic regions. This similarity provides some confidence that these results and relationships are more widely applicable.
All the threshold values, with the exception of those in regulations, should be optimized for the specific conditions and goals of a railway operator and the class of track before adopting them for the assessment of track.
Supplemental Data
Supplemental Materials
File (supplemental_data_jtepbs.0000043_roghani.pdf)
- Download
- 188.99 KB
Acknowledgments
The authors would like to thank the Canadian National Railway for its support and facilitation of this project, specifically Tom Edwards for facilitating the collection of these data sets. This research was made possible through the Canadian Rail Research Laboratory (CaRRL; www.carrl.ca), which is funded by the Natural Sciences and Engineering Research Council of Canada (NSERC), Canadian Pacific Railway, Canadian National Railway, the Association of American Railways–Transportation Technology Centre, Inc., the National Research Council of Canada, Transport Canada, and Alberta Innovates–Technology Futures.
References
Ahlf, R. E. (1975). “M/W costs: How they are affected by car weight and the track structure.” Railway Track Struct., 71(3), 34–37.
AREMA (American Railway Engineering and Maintenance of Way Association). (2012). Manual for railway engineering, Lanham, MD.
Arnold, R., Lu, S., Hogan, C., Farritor, S., Fateh, M., and El-Sibaie, M. (2006). “Measurement of vertical track modulus from a moving railcar.” Proc., American Railway Engineering and Maintenance of Way Association (AREMA) Conf., AREMA, Lanham, MD.
Berawi, A. R. B, Delgado, R., Calçada, R., and Vale, C. (2010). “Evaluating track geometrical quality through different methodologies.” Int. J. Technol., 1(1), 38–47.
Cai, Z., Raymond, G. P., and Bathurst, R. J. (1994). “Estimate of static track modulus using elastic foundation models.” Transp. Res. Rec., 1470, 65–72.
Davis, D. D., Otter, D., Li, D., and Singh, S. (2003). “Bridge approach performance in revenue service.” Railway Track Struct., 99(12), 18–20.
Ebersöhn, W., Trevizo, M. C., and Selig, E. T. (1993). “Effect of low track modulus on track performance.” Proc., 5th Int. Heavy Haul Conf., International Heavy Haul Association, Virginia Beach, VA.
El-Sibaie, M., and Zhang, Y. J. (2004). “Objective track quality indices.” Transp. Res. Rec., 1863, 81–87.
Esveld, C. (2001). Modern railway track, 2nd Ed., MRT-Productions, Zaltbommel, Netherlands.
Fallah Nafari, S., Gul, M., Roghani, A., Hendry, M., and Cheng, R. (2016). “Evaluating the potential of a rolling deflection measurement system to estimate track modulus.” J. Rail Rapid Transit, in press.
Farritor, S. (2006). “Real-time measurement of track modulus from a moving car.” U.S. Dept. of Transportation, Washington, DC.
Farritor, S., and Fateh, M. (2013). “Measurement of vertical track deflection from a moving rail car.” U.S. Dept. of Transportation, Washington, DC.
FRA (Federal Railroad Administration). (2005). “Development of objective track quality indices.” U.S. Dept. of Transportation, Washington, DC.
FRA (Federal Railroad Administration). (2007). “Track safety standard compliance manual.” U.S. Dept. of Transportation, Washington, DC.
Greisen, C. J. (2010). “Measurement, simulation, and analysis of the mechanical response of railroad track.” M.Sc. dissertation, Dept. of Mechanical Engineering, Univ. of Nebraska, Lincoln, NE.
Hay, W. W. (1982). Railroad engineering, 2nd Ed., Wiley, New York.
Hyslip, J. P. (2002). “Fractal analysis of geometry data for railway track condition assessment.” Ph.D. dissertation, Dept. of Civil Engineering, Univ. of Massachusetts, Amherst, MA.
Li, D., Hyslip, J., Sussmann, T., and Chrismer, S. (2015). Railway geotechnics, CRC Press, New York.
Liu, X., Saat, M. R., and Barkan, C. P. L. (2012). “Analysis of causes of major train derailment and their effect on accident rates.” Transp. Res. Rec., 2289, 154–163.
Lu, S. (2008). “Real-time vertical track deflection measurement system.” Ph.D. dissertation, Dept. of Mechanical Engineering, Univ. of Nebraska, Lincoln, NE.
McVey, B., et al. (2005). “Track modulus measurement from a moving railcar.” Proc., American Railway Engineering and Maintenance of Way Association (AREMA) Conf., AREMA, Lanham, MD.
McVey, B. (2006). “A nonlinear approach to measurement of vertical track deflection from a moving railcar.” M.Sc. dissertation, Dept. of Mechanical Engineering, Univ. of Nebraska, Lincoln, NE.
Norman, C. (2004). “Measurement of track modulus from a moving railcar.” M.Sc. dissertation, Dept. of Mechanical Engineering, Univ. of Nebraska, Lincoln, NE.
Norman, C., Farritor, S., Arnold, R., Elias, S. E. G., Fateh, M., and Sibaie, M. E. (2004). “Design of a system to measure track modulus from a moving railcar.” Proc., Railway Engineering, London, Engineering Technics Press, Edinburgh, U.K.
ORE. (1981). “Quantitative evaluation of geometry track parameters determining vehicle behavior: Introductory study to the problem of assessing track geometry on the basis of vehicle response.”, Office for Research and Experiments of the International Union of Railways, Utrecht, Netherlands.
Read, D., Chrismer, S., Ebersöhn, W., and Selig, E. T. (1994). “Track modulus measurements at the Pueblo soft subgrade site.” Transp. Res. Rec., 1470, 55–64.
Roghani, A., and Hendry, M. (2016). “Continuous vertical track deflection measurements to map subgrade condition along a railway line: Methodology and case studies.” J. Transp. Eng., .
Rose, J., and Konduri, K. (2006). “KENTRACK—A railway trackbed structural design program.” Proc., 2006 AREMA Annual Conf., AREMA, Lanham, MD.
Sadeghi, J., and Askarinejad, H. (2010). “Development of improved railway track degradation models.” Struct. Infrastruct. Eng., 6(6), 675–688.
Selig, E. T., and Li, D. (1994). “Track modulus: Its meaning and factors influencing it.” Transp. Res. Rec., 1470, 47–54.
Shahin, M., and Indraratna, B. (2006). “Parametric study on the resilient response of ballasted railway track substructure using numerical modeling.” GeoCongress 2006, ASCE, Reston, VA.
Shahu, J. T., Rao, N. S. V. K., and Yudhbir (1999). “Parametric study of resilient response of tracks with a sub-ballast layer.” Can. Geotech. J., 36(6), 1137–1150.
Smith, M. J. (2015). Statistical analysis handbook—A web-based statistics resource, Winchelsea Press, Winchelsea, U.K.
Stewart, H. E. (1985). “Measurement and prediction of vertical track modulus.” Transp Res. Rec., 1022, 65–71.
Stewart, H. E., and Selig, E. T. (1982). “Predicted and measured resilient response of track.” J. Geotech. Eng. Div., 108(11), 1423–1442.
Sussmann, T. R., Ebersöhn, W., and Selig, E. T. (2001). “Fundamental nonlinear track load-deflection behavior for condition evaluation.” Transp. Res. Rec., 1742, 61–67.
Transport Canada. (2011). “Rules respecting track safety.” Ottawa.
TSB (Transportation Safety Board of Canada). (2013). “Statistical summary railway occurrences.”, Gatineau, Canada.
Zarembaski, A. M., and Bonaventura, C. S. (2010). “Dynamic effects of track surface condition on vertical wheel/rail forces and energy consumption.” Proc., Joint Rail Conf., ASME, Urbana, IL.
Zarembski, A. M., and Palese, J. (2003). “Transitions eliminate impact at crossings.” Railway Track Struct., 99(8), 28–30.
Information & Authors
Information
Published In

Journal of Transportation Engineering, Part A: Systems
Volume 143 • Issue 7 • July 2017
Copyright
This work is made available under the terms of the Creative Commons Attribution 4.0 International license, http://creativecommons.org/licenses/by/4.0/.
History
Received: Aug 31, 2016
Accepted: Nov 10, 2016
Published online: Mar 21, 2017
Published in print: Jul 1, 2017
Discussion open until: Aug 21, 2017
Authors
Metrics & Citations
Metrics
Citations
Download citation
If you have the appropriate software installed, you can download article citation data to the citation manager of your choice. Simply select your manager software from the list below and click Download.