Valuing the Multiple Benefits of Blue-Green Infrastructure for a Swedish Case Study: Contrasting the Economic Assessment Tools B£ST and TEEB
Publication: Journal of Sustainable Water in the Built Environment
Volume 6, Issue 4
Abstract
In addition to flooding and water quality management, blue-green infrastructure (BGI) provides multiple benefits to humans and ecosystems, including health and biodiversity. Various tools are available for assessing these benefits but few evaluate economic benefits. Two tools that monetize the benefits, the Benefits Estimation Tool (B£ST) (UK) and The Economics of Ecosystems and Biodiversity (TEEB) (Netherlands), have been used to estimate value for a case study in Luleå, Sweden. Three options for a newly developed area were assessed in comparison with two different baselines. The main economic benefits of the newly developed area were related to amenities, home values, health, and social cohesion rather than to stormwater. However, as a result of the proposed development, negative economic benefits (i.e., costs) were attributed to carbon sequestration and biodiversity when considering the value of the existing area due to a loss of green spaces and trees. B£ST gave higher negative impacts than TEEB. Direct comparison of each category used in each tool was not possible since these categories and the way in which the monetized values are determined in each case differ. While the overall approach used in both tools is applicable in Sweden, calculations and data used need to be adapted to local circumstances and valuation.
Introduction
The use of traditional piped drainage systems is increasingly being complemented, and in places replaced, by sustainable drainage systems (SuDS). SuDS include the implementation of blue-green infrastructure (BGI) or nature-based solutions, as well as appropriate proprietary systems (Woods Ballard et al. 2015). However, the pace of uptake of BGI remains slow owing to inadequate supportive contexts, including unclear and complex responsibilities, especially for maintenance, nonsupportive and conflicting legislation, organizational inadequacies, lack of political support, or lack of knowledge (in Sweden: Wihlborg et al. 2019). As a consequence, decision makers often prefer traditional approaches, which means that more robust justification must given for BGI than for “we-know-it-works” piped systems (Cettner et al. 2014; Morgan and Fenner 2017).
The main objective of using BGI in the context of this paper is for stormwater management, aiming to reduce discharge volumes or peak flows as well as improve runoff water quality so as to minimize negative impacts on receiving waters and also reduce flood risks from a new development (e.g., Fletcher et al. 2015). BGI can provide multiple additional benefits not directly linked to the technical, stormwater-related function; examples include amenities, recreational values and health benefits, carbon sequestration, and air quality improvements (e.g., Abdalla et al. 2014; Jose et al. 2015; Ossa-Moreno et al. 2017; Woods Ballard et al. 2015). Thus, in contrast to traditional methods (e.g., underground storage tanks), BGI offers a wide range of benefits not only to (storm)water managers but also to society as a whole. There is a perception that the implementation of BGI is more expensive, so an important question arises: Who should invest, and how much, in the implementation and maintenance of BGI (Ashley et al. 2018b)? Tools for assessing the various benefits of BGI are therefore necessary to evaluate the impacts of water management schemes and identify the beneficiaries. A variety of tools and procedures can be used to assess both stormwater-related and non-stormwater-related benefits, but many of these do not provide economic or financial value (e.g., Ashley et al. 2018a; Hoang et al. 2018; Lawson et al. 2015; Read et al. 2016; Ecosystems Knowledge Network 2019). The value of BGI can be expressed in economic terms, which facilitates a cost-benefit comparison (services provided versus implementation and maintenance costs) (Ozdemiroglu et al. 2013). The study presented here utilizes two alternative tools, each of which values and monetizes the benefits of BGI: (1) the Dutch urban tool The Economics of Ecosystems and Biodiversity (TEEB) (Van Dijk et al. 2013); and (2) the UK Benefits Estimation Tool (B£ST) (CIRIA 2019). Both tools offer a structured approach to the evaluation of multiple long-term economic benefits of BGI.
B£ST and TEEB originate from the UK and the Netherlands, respectively, and have been used extensively for the evaluation of the long-term benefits of BGI as well as for long-term scenario planning, providing decision support for proposed BGI schemes. Applications include Ashley et al. (2018a), who presented the results from two case studies in the UK and one in the Netherlands using B£ST, whereas Ashley et al. (2018c) provide information about the uncertainties in valuations using tools such as B£ST. In addition to site-specific objectives (e.g., improved habitats, urban regeneration), these studies were aimed at reducing flood risks or making water quality improvements by implementing SuDS, and several retrofitting BGI options were assessed for their additional benefits. The benefits of BGI in new developments were not addressed in these studies. Gomez (2016) created a model based on B£ST and TEEB adapted for an Australian context in order to value the BGI for a retrofit scheme in the city of Elwood. This is the only study that evaluated whether the tools could be used outside of a UK or Netherlands context; however, Gomez (2016) used local values instead of the original UK/Dutch values. No study has yet addressed the general transferability of these tools to different conditions outside their country of origin.
Both B£ST and TEEB were developed for national applications. For example, B£ST uses peer-reviewed scientific publications regarding the physical performance of individual BGI measures, but then mainly utilizes UK government standardized information for monetization of the benefits. For example, the value of carbon sequestration by, e.g., trees is based on both the traded price of carbon and the nontraded price as set by the UK government (CIRIA 2019). TEEB similarly uses national standardized values. Despite this, both tools are being used in case studies in other countries, currently in five case studies (not UK or Netherlands) for the European Union Interreg VB North Sea Region Programme funded Blue Green Infrastructures through Social Innovation (BEGIN) project (BEGIN 2019).
The study presented here was carried out for a case study in northern Sweden to compare the results from using B£ST and TEEB. The case study site considered BGI options for a newly developed area. The aims of the study were to review the different approaches and similarities used in each of the tools, as well as to assess whether the tools can be readily transferred to different conditions, which would enable the wider application of the tools, e.g., in countries or regions where no such tools are available, and to look at the value of BGI for a new development, rather than retrofit and to compare no development with developing the site. Findings are presented from a comparison in which each tool was applied to the Swedish case, using the original input data for evaluation provided in the tools (i.e., UK or Dutch data for monetization). The results have been used to assess the overall balance of benefits from the use of BGI and for the general applicability of the tools outside any specific national context. Challenges associated with the data input required and the interpretation of the results are highlighted, and recommendations regarding the further applicability and adaptation of B£ST and TEEB for widespread use are discussed.
Materials and Methods
A comparison of the application of B£ST and TEEB was made using proposals for a new neighborhood called Kronandalen in the city of Luleå, northern Sweden (65°35′51″N, 22°11′08″E). Three options were assessed with both B£ST and TEEB to evaluate the benefits of BGI. The predevelopment Kronandalen site also has a use value (e.g., provision of environmental and recreational services to local communities) which has been determined for comparison.
Case Study Kronandalen
Kronan is located some 3 km northeast of the city center of Luleå in northern Sweden and will comprise several distinct residential areas, of which Kronandalen is one. Kronandalen is situated close to green areas (mainly forest) where the main recreational area of the city and two large lakes are situated. Direct access to these areas from Kronandalen is provided by bicycle and foot paths. Kronandalen was once a military area used by the Swedish armed forces until 1992. It was then taken over by the municipality and used for local activities (including the municipal recycling station, a film studio, a youth hostel, and several offices). These occupied the former army barracks and buildings. The development plans aim to make Kronandalen a dense urban area (2,000 apartments on ca. 25 ha) but with a number of parks and green spaces.
An assessment was made of the value of the current situation (baseline) as well as the value of three different options for the developed urban area (Table 1). The existing stormwater infrastructure comprises a rudimentary sewer network for drainage of parts of the impervious areas. No detailed design documentation exists, and only incomplete drawings were available. The first development option, Option 1, considered includes a separate sewer network based on current Swedish design guidelines, for design rainfall with a 20-year return interval. All of the proposed development options have floor levels of the buildings set above street level for flood protection. For Option 2, the municipality proposal, stormwater management relies on swales and a central pond, combined with new traditional sewer networks in the residential districts where no space for swales was considered to be available. In Option 3, in addition to Option 2, additional green roofs and bioretention facilities were considered for residential streets (Table 1). The USEPA’s Storm Water Management Model (SWMM) was used to assess the hydrologic and hydraulic performance of each option.
| Short name | Brief description | Main characteristics |
|---|---|---|
| Baseline: former military site | The area before the start of development. | No residents, but ca. 150 people working in the area. High percentage of pervious areas. |
| Option 1: traditional drainage | The developed urban area with a traditional (piped) drainage system for stormwater. | Around 2,200 new homes are to be built and 5,000 inhabitants expected. The parks established will comprise mainly of managed grassland and some trees. Stormwater is discharged through conventional storm sewers (separate sewer system). |
| Option 2: proposed plan | The developed urban area following the plan proposed for Kronandalen. | In addition to option 1, the parks include open stormwater ponds and swales. The quality of the parks is improved (additional planting of trees etc.). |
| Option 3: extended BGI | The developed urban area including the implementation of various BGI. | In addition to option 2, green roofs are implemented and some of the runoff from impervious areas will go through bioretention facilities before entering the stormwater sewers. |
| Alternative baseline: forest | Assuming the area is covered by forest which would be the typical case for Swedish areas before development. | There are no residents or workplaces at the site. The area is covered by a mainly coniferous forest that may be used for recreational activities. |
The former military area baseline represents a land use that is specific to Kronandalen. An alternative baseline (pristine forest) was considered (Table 1) as a benchmark. This alternative baseline represents a typical situation in Sweden when it comes to the development of new urban areas where forest regularly is present prior to construction.
Both baselines and the three options are summarized in Table 1.
Valuation Tools
B£ST
The valuation of the BGI in each option and baselines was conducted with the CIRIA UK B£ST tool version R3.01 [now superseded by Version 4_1_1 (March 2019)]. The tool included 15 categories (Supplementary Table S1 ) with which the benefits of BGI can be monetized based on an impact pathway approach. This is used to define the way in which physical impacts are valued (Ashley et al. 2018a). Four more categories (Supplementary Table S2 ) were used for qualitative assessment. An initial screening of all categories was undertaken to identify the relevant benefits that were then included in the subsequent, more detailed, assessment. The Excel-based tool provides options for self-defined input (e.g., results of local studies and assessments) as well as the use of a simplified approach to the evaluation of benefits. Physical performance data are required as inputs (e.g., flood risk reduction), and the veracity of the results depends on the availability and certainty of the inputs (Ashley et al. 2018c). B£ST requires a user-specified timescale as well as a discount rate, making it possible to match the value of future benefits to today’s prices [present value (PV), see also HM Treasury (2018)]. User-defined confidence scores for the quantification of the input and the monetized values are required to allow for uncertainties to be taken into account (see also Ashley et al. 2018c). The associated costs of the different options (e.g., construction, maintenance, and operation of the BGI) have to be specified by the user in order to calculate the net present value (NPV) of a scheme.
B£ST initially uses screening questions to indicate which benefits are likely to be important. From these, four benefit categories were identified for the former military site baseline. These were (with, in parentheses, the hypotheses that motivated the inclusion of each category):
•
Groundwater recharge (low amount of impermeable surface area)
•
Carbon reduction and sequestration (existing trees)
•
Health (green surroundings at regular workplaces)
•
Biodiversity and ecology (green spaces offer natural habitats)
The same categories were assessed for the forest baseline except that recreation (recreational visits in the forest) was presumed to replace health. Users should avoid double counting as there are overlaps between these benefits in B£ST, so usually one or the other category should be used, but not both.
For the three development options, a maximum of 10 categories were assessed (again with the hypotheses that motivated the inclusion of each category in parentheses):
•
Groundwater recharge (expected negative impact due to a higher fraction of impervious areas);
•
Building temperature (only in the extended BGI scheme; energy savings made through the installation of green roofs);
•
Carbon reduction and sequestration (expected negative impact due to fewer trees in the area);
•
Flooding (likely to occur due to urbanization);
•
Water quality (positive impact of BGI due to quality management of stormwater);
•
Amenity (large impact expected due to the number of new homes and local green spaces);
•
Education (educational visits by schools and universities);
•
Health (large impact expected due to the higher number of inhabitants and local green spaces);
•
Recreation (only in comparison with the forest baseline); and
•
Biodiversity and ecology (urban structures replacing natural green spaces).
Confidence scores were assigned based on expert judgment and B£ST recommendations (CIRIA 2016).
TEEB
The TEEB urban tool was developed in the Netherlands by Platform31, a knowledge and network organization funded by the Dutch government (Van Zoest and Hopman 2014). TEEB is based on the Economics of Ecosystems and Biodiversity study initiated by the United Nations (TEEB 2010). It aims to make expert knowledge about estimating the value of BGI more user-friendly and, thus, accessible to a wider audience (Van Dijk et al. 2013). Similarly to B£ST, TEEB analyzes and monetizes several benefits based on generic indicators. The version used included six categories of benefits with a number of subcategories (Supplementary Table S3 ). This online tool requires data input in the form of site-specific information and, in contrast to B£ST, supports only predefined calculations and monetized values. Unlike B£ST, where the timescale and discount rate can be user specified, TEEB always specifies a timescale of 30 years and a discount rate of 3%.
TEEB uses fewer categories compared with B£ST. With TEEB only the health category (improved air quality through green spaces) could be assessed in the case of the former military site baseline. For the forest baseline, recreation (recreational visits) was also assessed. For the three development options, four categories were taken into account:
•
Health (health benefits of a greener environment and improved air quality);
•
Energy (energy savings brought about through wind shelter from trees and green roofs);
•
Value of homes (higher real estate values of new construction homes due to the proximity of parks and ponds); and
•
Social cohesion (social cohesion due to the number and type of inhabitants and green spaces).
The same timescale (30 years) and discount rate (3%) were used in both tools to compare the B£ST and TEEB results. TEEB does not support a direct comparison of a baseline and an option. The data input for TEEB is related to measures undertaken, but it does not support negative values. Accordingly, the results of assessment of the options must be manually compared with the baseline to determine the actual benefits (and disbenefits). The NPV is also calculated using the user-specified costs of each scheme.
Results and Discussion
Both tools were used for the valuation of the baselines and options. The main objective of each of the options is the creation of new housing. This study focused on evaluating the benefits of developing new urban areas in comparison with the original situation, with a view to understanding the added benefits of using BGI. The results have been used for a comparison of the options and of the two tools.
Baselines: Former Military Site and Forest
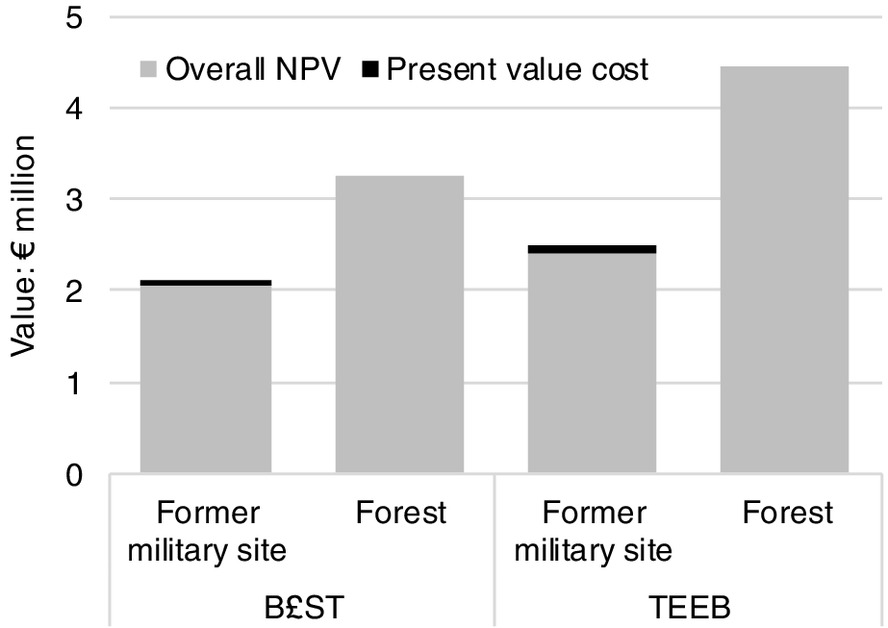
The assessment of the two baselines over a period of 30 years showed considerable financial benefits (Table 2). Based on information from the municipal water department, maintenance and operational costs of the existing sewer system (present in the former military baseline) over this time were estimated to be around €80,000 (present value).
| Benefit category | Value (former military site baseline) | Value (forest baseline) | ||
|---|---|---|---|---|
| € | Proportion of the total benefits or disbenefits (%) | € | Proportion of the total benefits or disbenefits (%) | |
| B£ST | ||||
| Groundwater recharge | 5,000 | (0.2) | 9,000 | (0.3) |
| Carbon sequestration | 1,575,000 | (74.3) | 2,610,000 | (80.0) |
| Health | 253,000 | (11.9) | 0 | (0) |
| Recreation | 0 | (0) | 21,000 | (0.6) |
| Biodiversity and ecology | 287,000 | (13.6) | 623,000 | (19.1) |
| Total | 2,120,000 | (100.0) | 3,263,000 | (100.0) |
| TEEB | ||||
| Health | 2,485,000 | (100.0) | 4,247,000 | (95.4) |
| Recreation | 0 | (0) | 206,000 | (4.6) |
| Total | 2,485,000 | (100.0) | 4,453,000 | (100.0) |
The predominant benefits under the baseline were assessed from carbon sequestration using B£ST and from capturing airborne particulate matter from TEEB. TEEB treats the latter as a health benefit due to improved air quality. The main benefits derive from the services provided by the large number of existing trees and green areas. In addition to carbon sequestration, B£ST also provided an evaluation of other benefits (Table 2), whereas TEEB valued only the health benefits in the case of the former military site baseline. With both tools, recreation was taken into account, but only in the forest baseline.
The overall results (Fig. 1) showed that, according to both tools, the forest baseline offered greater benefits and a higher NPV than the former military site baseline. This is due to the greater number of trees and the natural characteristics of the area (e.g., green pervious surfaces, existing habitats). Even though B£ST showed benefits from more benefit categories than TEEB, the TEEB results showed a higher NPV. This may be because TEEB does not use confidence scores or sensitivity testing, which in B£ST can lead to lower benefit values by explicitly allowing for uncertainties (Ashley et al. 2018c). Users of TEEB are expected to already have modified any input data to include uncertainties.
Comparison of Baseline Benefits with Kronandalen Options
The two baselines were compared with the three options for the new development scheme at Kronandalen. Similar benefit categories were assessed for all options and baselines. However, recreation was taken into account only in comparison with the forest baseline (see subsequent discussion). In this section the results for the different options are presented in comparison with the former military site baseline. Similarities and differences resulting from comparison with the forest baseline are then presented and discussed.
B£ST results show a rather high NPV over the 30-year timescale for all options [Fig. 2(a)], with increasing benefits across the options. The construction, maintenance, and operational costs of the sewer system, as well as the BGI measures, were taken into account. As hypothesized, implementation of BGI results in a higher NPV for the benefits in comparison with the traditional (piped) approach. Although the extended BGI (Option 3) gave the greatest benefits and NPV, the proposed plan (Option 2) has the best benefit-to-cost ratio since the additional costs of the extended BGI implementation exceeded the benefits (Table 4).

TEEB valuation [Fig. 2(b)] shows a higher NPV than that determined using B£ST. For TEEB, there are only slight differences in value between the three options. In contrast with the B£ST results, in TEEB the proposed plan (option 2) has the highest NPV (Table 4).
B£ST shows that the main benefits relate to health and amenities, and the main disbenefit relates to carbon reduction and sequestration (Table 3 and Fig. 3). This is because the character of the site changes from being relatively green to becoming an urban area. The increase in the numbers of properties and inhabitants leads to major benefits (since the green areas are used by more people), while the reduction in the number of trees brings a disbenefit (less carbon sequestration). Across the options there is a considerable increase in the value to human health, resulting in an increase in overall NPV.
| Benefit category | Value (traditional drainage) | Value (proposed plan) | Value (extended BGI) | |||
|---|---|---|---|---|---|---|
| € | Proportion of the total benefit (%) | € | Proportion of the total benefits or disbenefits (%) | € | Proportion of the total benefits or disbenefits (%) | |
| B£ST | ||||||
| Groundwater recharge | () | () | () | |||
| Building temperature | 0 | (0) | 0 | (0) | 99,000 | (0.6) |
| Carbon sequestration | () | () | () | |||
| Flooding | () | () | 0 | (0) | ||
| Water quality | 136,000 | (1.5) | 167,000 | (1.0) | 167,000 | (0.9) |
| Amenity | 3,596,000 | (40.0) | 4,574,000 | (28.2) | 4,583,000 | (25.3) |
| Education | 0 | (0) | 3,000 | () | 3,000 | () |
| Health | 6,670,000 | (74.3) | 12,884,000 | (79.2) | 14,564,000 | (80.5) |
| Biodiversity and ecology | () | () | () | |||
| Total | 8,975,000 | (100.0) | 16,265,000 | (100.0) | 18,097,000 | (100.0) |
| TEEB | ||||||
| Energy | 27,000 | (0.1) | 63,000 | (0.3) | 204,000 | (0.8) |
| Value of homes | 20,690,000 | (89.0) | 21,192,000 | (85.6) | 21,192,000 | (83.8) |
| Health | () | 53,000 | (0.1) | 423,000 | (1.7) | |
| Social cohesion | 2,733,000 | (11.8) | 3,462,000 | (14.0) | 3,462,000 | (13.7) |
| Total | 23,231,000 | (100.0) | 24,770,000 | (100.0) | 25,281,000 | (100.0) |
Note: Former military site as reference baseline.

In TEEB the major benefit was found to be related to the home values (ca. 85 % of the total benefits) (Table 3 and Fig. 4). The BGI for Options 2 and 3 only affected the benefits marginally. Social cohesion (ca. 14 % of the total benefits) was found to be the next greatest benefit using TEEB. Both of these categories contributed to approximately the same NPV for both BGI Options 2 and 3. As with B£ST, these benefits occur due to development of the urban area. The categories in which the implementation of BGI gave the main relative benefit (i.e., where BGI generated the most relative additional value in comparison with the traditional drainage option) were health and energy. However, compared with the total NPV, this was relatively minor. The health category in TEEB showed disbenefits for the traditional drainage option, but the implementation of BGI (proposed plan and extended BGI) resulted in an increase in benefit value. This is due to the subcategory improved air quality, which, compared with the baselines, showed disbenefits. The implementation of BGI resulted in greater benefits in the health subcategory a greener environment and, thus, compensated for the disbenefits, so that the overall health benefits were positive. The energy category showed an increase in value across the options, but this was marginal () to the total benefits. In summary, the higher costs of BGI implementation and maintenance resulted in a positive NPV for all three options, although the benefit values increased when increasing BGI implementation.

Comparing the three options with the forest baseline rather than the former military (existing) site baseline resulted in lower NPVs because the value of the forest baseline was greater [Figs. 5(a and b)]. Because an entirely new sewer system had to be installed, the associated higher costs led to lower benefit-to-cost ratios (Table 4). The estimation of the benefits and costs showed that, although the benefits could be maximized when choosing the extended BGI option, more economically beneficial results could be obtained with the other options [proposed municipal plan for B£ST (Option 2) and traditional drainage option (Option 1) for TEEB].

| Valuation tool | Reference baseline | Traditional drainage | Proposed plan | Extended BGI |
|---|---|---|---|---|
| B£ST | Former military site | 8.7 | 14.3 | 9.5 |
| Forest | 5.7 | 10.1 | 7.5 | |
| TEEB | Former military site | 22.5 | 21.8 | 13.2 |
| Forest | 15.2 | 15.1 | 10.2 |
In comparison to the forest baseline, the three options showed an especially high negative impact (disbenefits) in reduced carbon sequestration when using B£ST and reductions to improved air quality (included in health) in TEEB (Supplementary Table S4 ) caused by the removal of a large number of trees. In addition, recreation (which was assessed as a category only in comparison with the forest baseline) also adds negative impacts, although being nearly negligible () compared with the overall NPVs. Otherwise, the general distribution of the benefits is similar to the results for the former military baseline, and there are similar differences between the benefits found using the two tools (Supplementary Figs. S1 and S2 ).
Comparison between B£ST and TEEB Use and Results for Kronan
Both B£ST and TEEB follow a similar approach in which first an impact created by using BGI is determined, and then this impact is monetized using standard values. B£ST offers more categories for assessment than TEEB, and the calculations and monetary values used, mostly based respectively on UK data [see see values library in the B£ST in CIRIA (2019)] or Dutch (Buck Consultants International 2016) studies, differ.
Some categories or subcategories assess similar benefit values in both B£ST and TEEB but do not lead to similar overall results (Table 5). This is because of the different monetary values and specific calculations and, thus, differences in the required data input in B£ST and TEEB (CIRIA 2016, 2019; TEEB 2010; Buck Consultants International 2016).
| Category/Subcategory | Tool | Effecta | Value € |
|---|---|---|---|
| Health/A greener environment | B£ST | Emotional health improvement | 11,755,000 |
| TEEB | Fewer patients registered | 1,807,000 | |
| Air quality/Improved air quality | B£ST | Pollutant removal | Not assessed |
| TEEB | Particulate matter uptake | ||
| Property price increase/Value of homes | B£ST | Local area valued more highly | 4,201,000 |
| TEEB | Property price increase | 21,024,000 | |
| Building temperature/Green roofs | B£ST | Reduced energy use | 99,000 |
| TEEB | Reduced energy use | 141,000 | |
| Recreation/Recreation | B£ST | New recreation opportunities | |
| TEEB | More leisure use of new or improved green areas | ||
| Flood risk/Protection against flooding | B£ST | Reduced flood risk | |
| TEEB | Reduced flood risk | Not assessed |
An important (advantageous) aspect of B£ST are the screening questions. These support the user in making decisions about relevant, and therefore subsequently monetized, impacts and benefits prior to expending resources inefficiently on obtaining data for categories that have only marginal overall benefits. The TEEB web tool does not include this, so there is a danger of blind input, so to speak, leading to a risk that the user simply fills in the requested data input fields without first carrying out a review of what are likely to be the most significant potential impacts.
Another important aspect are the confidence scores applied in B£ST, which can have a large impact on the monetized results. A high level of uncertainty was expected for the data input in the Kronandalen case study because this was for a new development scheme for a whole area, including housing and urban infrastructures as well as water and stormwater management measures. The precise details of the BGI and associated plans were not available at the time, so suppositions were required as to what the details of the options entailed. A further limitation was that the database of monetary values provided in B£ST and TEEB was used for the estimations (instead of specifically adapted Swedish data). The original intention was to use national or regional monetary values. However, although at least some Swedish data would have been available on benefits like those used in the tools, the format was found to differ substantially from the Dutch and UK data, which are used for the tools, and for some categories no suitable data were available at all. Thus, the goal of using local information was not fulfilled and would have necessitated redevelopment of (parts of) the tools. This is the main limitation of using the tools in the Swedish context.
The risks from the double counting of benefits are highlighted for B£ST users. The technical guidance for the tool (CIRIA 2016) offers a lot of information and decision support providing recommendations as to how best to avoid double counting. In TEEB, double counting is also a risk and is not highlighted in the way in which it is in B£ST. During the valuation process in this study, in TEEB a high risk of double counting in the value of homes subcategory was detected. It includes six subquestions that either value a more general change of the area (e.g., improvement in parks) or a more specific feature (e.g., construction of ponds, improvement to green spaces). If the overall improvement of the area already takes such features into account, there is no extra benefit expected for the same beneficiaries and the more specific subquestions are not assessed. Therefore, only two out of six subquestions were included in this study. There is always a subjective aspect to evaluation (Spangenberg and Settele 2010). In this case, for instance, the decision about the (most) relevant benefit or impact was initially made subjectively, and an important question arose when applying the tools: how many of the features available in B£ST (e.g., preliminary screening questions, double counting) should be included when applying the TEEB tool? For example, owing to the initial screening of the relevant categories, air quality was not assessed in B£ST because for that specific case no significant impact from the development, under any of the three options, was expected according to the environmental impact assessment of the area made by Luleå Municipality (2016). In contrast, TEEB always includes (since no initial screening is intended) the similar subcategory improved air quality in the health benefits. It is therefore important for the user to decide what kind of impact or benefit is actually achieved by the chosen BGI scheme. It could be argued that for this study, either the air quality category in B£ST should have been valued or the air quality subcategory in TEEB should not have been valued. According to the B£ST screening questions and impact pathway, the BGI to be implemented (e.g., trees, swales) would contribute to particulate filtering; however, no significant impact on air quality was expected from these measures in the context of the application. TEEB does not include such preassessments and requires only a quantitative input of the measure implemented; it calculates the benefits without including the initial conditions or context. For this study, both tools were applied using their respective approaches and implemented features (i.e., in TEEB there was no possibility of discarding assessed air quality, in contrast to B£ST). This emphasizes the value of having the screening questions in B£ST support initial considerations and deliberations as to what benefits need to be looked at in detail. In contrast, TEEB tends to support simple and unquestioning data input and so may yield unrealistic results.
Differences between Kronandalen Case Study and Previous Studies
Other studies have shown that the results obtained with B£ST and TEEB indicate broad similarities in the distribution of benefits (e.g., Ashley et al. 2018a). In contrast, the results from the Kronandalen case study do not show this. B£ST showed a number of negative impacts, whereas with TEEB only one negative impact, in the health category, was apparent for the traditional drainage option. Furthermore, the main benefits differ (health in contrast to home values in B£ST and TEEB, respectively) and similar categories (e.g., property price increase–home values, health–a greener environment) show significantly different values (Table 5).
The Kronandalen case study in general was different from other studies: the main objective of previous studies evaluating the multiple benefits of BGI was often the assessment of flood risk reduction managed by the implementation of BGI (e.g., Hoang et al. 2018; Lawson et al. 2015; O’Donnell et al. 2017) or the improvement of existing urban areas in terms of recreational sites and a greener environment] e.g., urban regeneration (Ashley et al. 2018a)]. In these studies, the main benefits would be expected to lie in the corresponding categories (e.g., flooding, amenities, recreation). In Kronandalen, the creation of housing space is the main objective, and this results in large benefits in the related categories (e.g., value of homes, amenity, health, social cohesion), while the otherwise targeted stormwater-related benefits are less highly valued. The more environmentally related categories (e.g., carbon sequestration, biodiversity, and ecology) show negative impacts due to the comparison with baselines that reflect a near natural (forest) or relatively green (former military site) area. There is a contrasting outcome when BGI is retrofitted in existing urban areas that have mostly traditional piped drainage systems (e.g., Ashley et al. 2018a; Gomez 2016).
The water management–related benefits expected from the implementation of BGI (e.g., reduced flood risk, water quality) are less important in Kronandalen because of the predominant conditions in the area (e.g., sewer system of sufficient capacity) and therefore result in only small beneficial impacts. Furthermore, the height levels of the ground floors of buildings in the proposed development (all options) have been chosen such that any risk of flood damage to houses/properties is minimized, and this reduces the value of BGI with respect to flood protection, which is significantly different from evaluating retrofitting schemes. Moreover, the results indicate that TEEB focuses more on urban benefits (e.g., property price increase and benefits received by the inhabitants such as health), whereas B£ST also addresses the importance of environmental impacts (e.g., carbon reduction and sequestration, biodiversity, and ecology).
The low additional benefits due to BGI on reduced flood risk in this case show that, in general, there are differences between an assessment of a new development scheme (Kronandalen case study) in a predominantly green field site and assessments of retrofitting schemes in existing urban areas (previous studies). In an existing area with a sewer system, retrofitting BGI may target specifically the reduction of flood risk, which can lead to corresponding benefits. In the Kronandalen case, flood risks are already reduced in Option 1 given the higher ground floor levels of all buildings. Thus, the drivers and main objectives of implementing BGI differ, leading to different outcomes. Further, in contrast to a retrofitting scheme where one knows detailed parameters (e.g., number of inhabitants, number and type of houses), for a new development, there are greater uncertainties in the reliability of the data used because of, at least in the early planning stages, uncertainties in the proposed development. For instance, estimation of the number of beneficiaries is crucial for assessment with B£ST and TEEB. This number is based on the presumed numbers of people living and working in an area and therefore is subject to significant uncertainties because of the need to predict the dweller and visitor populations and their behaviors. In contrast, in a retrofitting case, the number of inhabitants in the area is usually known and much more certain, although, again, future numbers can only be estimated. Numbers and extents of existing and newly planted trees and green areas are also known more reliably for an existing area than one being designed as part of a development scheme.
While most earlier B£ST and TEEB studies evaluated retrofitting of BGI in existing areas (e.g., Ashley et al. 2018c; Gomez 2016), comparing the three options with the forest baseline involving assessing the new development of a natural environment. This assessment using both B£ST and TEEB was found to be especially difficult owing to the contrast in land use between the forest baseline and all three options. Numerous estimated values for input data were necessary, and as a result there were high levels of associated uncertainties. In general, none of the tools seems to be as well designed for assessing new developments in natural environments as for retrofit schemes. Both tools require estimates of the numbers of inhabitants or local users in the existing area before new development can be analyzed. However, it was found possible to utilize the tools for the forest baseline case. This was easier using B£ST versus TEEB.
Assessment of B£ST and TEEB for Kronandalen Case
For both tools, the data required posed a challenge when it came to estimating the beneficiaries and values of the benefits assessed. In particular, the importance of local green infrastructure for recreation, biodiversity, and ecology is difficult to assess in Kronandalen since there are many natural, green surroundings in the immediate vicinity of the proposed development. Also the apparent benefits of the effects on health and amenities (or home values) may also be questioned. For example, accessibility to a park or a permanent water body is usually already good or available in Swedish residential areas similar to Kronandalen (relatively green development, medium-sized city, relatively low population density, close proximity to natural areas), so that local schemes with new BGI do not necessarily add extra benefits, or these benefits may be lower compared with those in more densely populated areas. Nevertheless, this case study revealed considerable benefits in these categories because of the increased numbers of inhabitants and, thus, potential beneficiaries. This shows that, although the approach used in B£ST and TEEB is generally applicable when assessing the wider benefits of BGI, the input data have to be critically reviewed and adapted to the local situation, as demonstrated by Hoang et al. (2018), who stress the need to consider benefit proximity and intensity, which are parameters that relate to the physical adjacency of BGI and beneficiaries.
The effects of implementing BGI in specific contexts can differ from the original UK or Netherlands context in which the valuation tools were developed. A similar BGI scheme, but in a different location or developed in a different context, may not lead to the same benefits as in a UK, Dutch, or northern Swedish context, especially in categories such as recreation, health, and amenities, which are dependent on the nature of the society and the general availability of urban and countryside green spaces. Local impact assessments and studies should therefore be taken into consideration when valuing benefits. Hoang et al. (2018) use the concepts of benefit proximity and intensity in assessing the relative value of the benefits of BGI: proximity to populations and already existing BGI features and the diminishment of benefits based on the distance of the BGI from potential users. This is partially accounted for in B£ST and TEEB in certain categories of benefit (importance of local urban green spaces), as the distance to green spaces is included in assessing health benefits (e.g., Grahn and Stigsdotter 2003). Hence, in this case, the impact being evaluated is considered valid in a Swedish context, so the tools are applicable.
The main focus of this study was a general comparison of the use of the B£ST and TEEB tools in a Swedish context. The calculation of the monetized benefits was not expected to be directly applicable because local monetary values (which would be necessary for estimation in the Swedish context) were not used. Carbon prices, for example, differ in different countries, but it was not part of the study’s aims to define equivalent Swedish values. The quantitative output of financial value should therefore not be considered as absolute but, rather, only indicative of the relative potential value of the options.
Owing to the nature (new development) of the Kronandalen area and the challenges arising (described earlier), B£ST was found to be more suitable for the case study and would therefore be a preferred tool for similar future evaluations. However, assessment with B£ST is complex, and multiple aspects need to be considered (e.g., screening questions, double counting, confidence scores). This is important for adequate assessment and valuation of the benefits, but it is also dependent on the data available. Some important data may not be available with an appropriate level of confidence, so not all possibilities and potentials can be assessed. Depending on the objective of the assessment, TEEB could therefore also be appropriate as an assessment tool. For instance, when a first, more general, assessment of the possible monetized benefits is needed, TEEB offers a fairly straightforward and simple-to-use valuation method. In this case, it is important to keep in mind that, before monetizing benefits, an initial qualitative assessment (e.g., following the B£ST screening questions) should be carried out to determine possible benefits and disbenefits in order to reduce unwarranted analytical effort. Another advantage of B£ST is that the tool allows for user-defined inputs of monetary values, facilitating adaptation to non-UK cases (assuming the values are available). In contrast, the structure of the TEEB tool cannot be changed, meaning the categories and calculations need to be copied, e.g., into a spreadsheet, to come up with new monetary values.
Appropriate monetary values would be necessary to use either tool further in a Swedish context. Nearly all the same values are needed to calculate benefits in B£ST and TEEB (e.g., carbon prices, insurance, and health costs). However, B£ST monetizes more categories, so more values must be defined.
As a recommendation for further case studies, the possible benefits of a BGI scheme should first be assessed qualitatively (e.g., with the B£ST screening questions). Next, an initial quantitative evaluation could be carried out with TEEB to determine the most relevant solutions for a development or retrofitting scheme. The final evaluation of the favored schemes should then be carried out with B£ST. Such a procedure would make it possible to exploit the overall advantages of both tools.
The results of this study have implications for decision makers. The decision maker or funder, who in general and in this specific case of Kronandalen is the municipal water authority, is likely not to be the main beneficiary of a BGI scheme (Ashley et al. 2018b). The categories generating the largest NPV (amenities, health, home values, social cohesion) are not directly related to the core duty of the water authority. The question arises as to who pays and who benefits—the main beneficiaries are not the funder (the water authority). This raises the further question of whether this constitutes a significant obstacle to BGI implementation; however, such a question is beyond the scope of this paper. Furthermore, at least in Sweden, (storm)water management is financed by a water fee, which is to be used only in connection with issues directly related to water management. A strict interpretation of this rule would raise doubts about whether in the Kronandalen case the water authority would even be allowed to invest in BGI, given that most stormwater-related benefits can be obtained with a more traditional sewer solution. Tools such as B£ST or TEEB can be helpful to water authorities in highlighting additional benefits in discussion with other decision makers and funders (e.g., other departments in a municipal administration).
Conclusions
A comparison of the use of the BGI valuation tools B£ST and TEEB was carried out for a case study in Luleå in northern Sweden. Both tools can be used to value a wide range of the long-term benefits of BGI. B£ST offers more benefit categories and includes confidence scores for the physical performance and valuation data used. In contrast, TEEB presumes users have adjusted input data to take uncertainties into account, allowing for differences in the way benefit monetization is applied. In this case example, TEEB estimated higher benefit values compared with B£ST. In general, a direct comparison of B£ST and TEEB is not possible. Although both are based on ecosystem service valuation, the individual tools value different impacts and effects and estimate benefits based on separate nationally specific monetized values. Only a few of the categories available in each tool value a similar benefit (e.g., reduced energy use due to green roofs, health benefits from a greener environment).
The case study shows that the main benefits of the Kronandalen options lie in categories related to the main objective (development of a new urban area): amenities, home values, health, and social cohesion. Compared with the baselines, current undeveloped conditions, and existing forest, the disbenefits were found to impact the environmentally related categories (e.g., carbon sequestration, biodiversity, and ecology). B£ST’s estimates showed greater negative impacts than TEEB. Calculating the benefit-to-cost ratios showed the importance of taking the associated costs fully into account. Even in cases where implementation of a higher number of BGI measures results in more benefits, the increased costs can lead to lower NPVs.
Site-specific conditions necessitate adaptations of the tools. The approach used in B£ST and TEEB is applicable in northern Sweden, but the calculations and data used need to be carefully reviewed and adjusted as necessary. Further studies should focus on applying local monetized values as well as using local studies to determine the beneficiaries and estimate the impact of a BGI scheme.
Supplemental Materials
File (supplemental_materials_jswbay.0000919_hamann.pdf)
- Download
- 478.92 KB
Data Availability Statement
All data, models, or code that support the findings of this study are available from the corresponding author upon reasonable request. Some data used during the study (parts of the municipal infrastructure plans) are confidential in nature and may only be provided with restrictions.
Acknowledgments
The authors thank the Verket för innovationssystem (Innovation Systems Agency) (Vinnova) for its financial support of the GrönNano 3 projects and the competence center DRIZZLE–Centre for Stormwater Management. They also thank the INTERREG IV project BEGIN, which has supported Professor Ashley. The support of Luleå municipality within the research cluster Dag&Nät is gratefully acknowledged. The authors thank Berry Gersonius and the Atlas team, especially Roy Remme, for helpful discussion and support with the TEEB urban tool. Finally, all the staff at Sweco Environment, Luleå, who helped in accessing data in the Kronandalen database are gratefully acknowledged.
References
Abdalla, Y. A., A. K. Siti-Nabiha, and A. S. Md Shahbudin. 2014. “Social and environmental accounting research: The way forward.” Int. J. Econ. Manage. 8 (2): 365–383. https://doi.org/10.1053/j.jvca.2010.06.032.
Ashley, R. M., C. J. Digman, B. Horton, B. Gersonius, B. Smith, P. Shaffer, and A. Baylis. 2018a. “Evaluating the longer term benefits of sustainable drainage.” Proc. Inst. Civ. Eng. Water Manage. 171 (2): 57–66. https://doi.org/10.1109/SECPRI.1996.502675.
Ashley, R. M., B. Gersonius, C. Digman, B. Horton, T. Bacchin, B. Smith, P. Shaffer, and A. Baylis. 2018b. “Demonstrating and monetizing the multiple benefits from using SuDS.” J. Sustainable Water Built Environ. 4 (2): 05017008. https://doi.org/10.1061/JSWBAY.0000848.
Ashley, R. M., B. Gersonius, C. Digman, B. Horton, B. Smith, and P. Shaffer. 2018c. “Including uncertainty in valuing blue and green infrastructure for stormwater management.” Ecosyst. Serv. 33 (Oct): 237–246. https://doi.org/10.1016/j.ecoser.2018.08.011.
BEGIN (Blue Green Infrastructures through Social Innovation). 2019. “BEGIN—Blue green infrastructures through social innovation.” Accessed May 28, 2019. https://northsearegion.eu/begin.
Buck Consultants International. 2016. “Bronvermelding Kengetallen [source reference key figures].” Accessed May 28, 2019. https://www.teebstad.nl/document/bronvermelding-kengetallen.
Cettner, A., R. Ashley, A. Hedström, and M. Viklander. 2014. “Sustainable development and urban stormwater practice.” Urban Water J. 11 (3): 185–197. https://doi.org/10.1080/1573062X.2013.768683.
CIRIA (Construction Industry Research and Information Association). 2016. “BeST (benefits of SuDs tool) technical guidance release version 3.” Accessed May 28, 2019. https://www.susdrain.org/resources/best.html.
CIRIA (Construction Industry Research and Information Association). 2019. “B£ST (benefits of SuDS tool).” Accessed May 28, 2019. https://www.susdrain.org/resources/best.html.
Ecosystems Knowledge Network. 2019. “Tool assessor.” Accessed May 28, 2019. https://ecosystemsknowledge.net/resources/guidance-and-tools/tools/tool-assessor.
Fletcher, T. D., et al. 2015. “SUDS, LID, BMPs, WSUD and more—The evolution and application of terminology surrounding urban drainage.” Urban Water J. 12 (7): 525–542. https://doi.org/10.1080/1573062X.2014.916314.
Gomez, N. N. E. 2016. “Multi-benefit assessment of Blue- Green infrastructure using multiple tools: A small scale approach case study: Elwood, Port Phillip. Australia.” M.Sc. thesis, IHE Delft Institute for Water Education, Unesco-IHE.
Grahn, P., and U. A. Stigsdotter. 2003. “Landscape planning and stress.” Urban For. Urban Greening 2 (1): 1–18. https://doi.org/10.1078/1618-8667-00019.
HM Treasury. 2018. The green book: Central government guidance on appraisal and evaluation. London: HM Treasury.
Hoang, L., R. A. Fenner, and M. Skenderian. 2018. “A conceptual approach for evaluating the multiple benefits of urban flood management practices.” J. Flood Risk Manage. 11 (S2): S943–S959. https://doi.org/10.1111/jfr3.12267.
Jose, R., R. Wade, and C. Jefferies. 2015. “Smart SUDS: Recognising the multiple-benefit potential of sustainable surface water management systems.” Water Sci. Technol. 71 (2): 245–251. https://doi.org/10.2166/wst.2014.484.
Lawson, E., et al. 2015. “Evaluating the multiple benefits of a blue-green vision for urban surface water management.” In Proc., UDG Autumn Conf. and Exhibition. London: Chartered Institution of Water and Environmental Management Urban Drainage Group.
Luleå Municipality. 2016. “Miljökonsekvensbeskrivning Av Detaljplan För Kronandalen [Environmental Impact Assessment of the Detailed Plan for Kronandalen].” Accessed May 28, 2019. https://www.lulea.se/download/18.fa12e32157628c61e48798/1475688216452/MKB+Kronandalen+samrådshandling+161004.pdf.
Morgan, M., and R. Fenner. 2017. “Spatial evaluation of the multiple benefits of sustainable drainage systems.” In Proc., Institution of Civil Engineers—Water Management, 1–14. London: Thomas Telford Ltd.
O’Donnell, E. C., R. Woodhouse, and C. R. Thorne. 2017. “Evaluating the multiple benefits of a sustainable drainage scheme in Newcastle, UK.” In Proc., Institution of Civil Engineers—Water Management, 1–12. London: Thomas Telford Ltd.
Ossa-Moreno, J., K. M. Smith, and A. Mijic. 2017. “Economic analysis of wider benefits to facilitate SuDS uptake in London, UK.” Sustainable Cities Soc. 28 (Jan): 411–419. https://doi.org/10.1016/j.scs.2016.10.002.
Ozdemiroglu, E., D. Corbelli, N. Grieve, E. Gianferrara, and Z. Phang. 2013. “Green infrastructure—Valuation tools assessment.” Accessed May 28, 2019. http://publications.naturalengland.org.uk/publication/6264318517575680.
Read, K. E., M. Karras, J. Sörensen, and A. Cedergren. 2016. “Cost-benefit analysis of sustainable drainage system as flood risk reduction measure in urban areas—Focusing on monetary valuation of ecosystem services.” Accessed May 28, 2019. https://lup.lub.lu.se/student-papers/search/publication/8890616.
Spangenberg, J. H., and J. Settele. 2010. “Precisely incorrect? Monetising the value of ecosystem services.” Ecol. Complexity 7 (3): 327–337. https://doi.org/10.1016/j.ecocom.2010.04.007.
TEEB (The Economics of Ecosystems and Biodiversity). 2010. “The economics of ecosystems and biodiversity: Mainstreaming the economics of nature: A synthesis of the approach, conclusions and recommendations of TEEB.” Accessed May 28, 2019. http://www.teebweb.org/publication/mainstreaming-the-economics-of-nature-a-synthesis-of-the-approach-conclusions-and-recommendations-of-teeb/.
Van Dijk, R., L. Jansen, L. Merkx, and J. van Wetten. 2013. “Van TEEB-Stad Naar TEEB-Stad Tool: Inzicht in de Waarde van Groen in de Stad [From TEEB-urban to TEEB-urban tool: Understanding the Value of Green in the City].” Accessed May 28, 2019. https://www.platform31.nl/publicaties/van-teeb-stad-naar-teeb-stad-tool.
Van Zoest, J., and M. Hopman. 2014. “Taking the economic benefits of green space into account: The story of the Dutch TEEB for Cities project.” Urban Clim. 7 (Mar): 107–114. https://doi.org/10.1016/j.uclim.2014.01.005.
Wihlborg, M., J. Sorensen, and J. A. Olsson. 2019. “Assessment of the barriers and drivers for implementation of blue-green solutions in Swedish municipalities.” J. Environ. Manage. 233 (Mar): 706–718. https://doi.org/10.1016/j.jenvman.2018.12.018.
Woods Ballard, B., S. Wilson, H. Udale-Clarke, S. Illman, T. Scott, R. M. Ashley, and R. Kellagher. 2015. “The SuDS manual.” Accessed May 28, 2019. https://www.ciria.org/Resources/Free_publications/SuDS_manual_C753.aspx.
Information & Authors
Information
Published In
Journal of Sustainable Water in the Built Environment
Volume 6 • Issue 4 • November 2020
Copyright
This work is made available under the terms of the Creative Commons Attribution 4.0 International license, https://creativecommons.org/licenses/by/4.0/.
History
Received: May 28, 2019
Accepted: Mar 23, 2020
Published online: Jun 17, 2020
Published in print: Nov 1, 2020
Discussion open until: Nov 17, 2020
Authors
Metrics & Citations
Metrics
Citations
Download citation
If you have the appropriate software installed, you can download article citation data to the citation manager of your choice. Simply select your manager software from the list below and click Download.