Abstract
The capability of a commercial off-the-shelf amphibious bottom crawling robot is explored for surveying seamless topography and bathymetry across the beachface, surfzone, and very nearshore. A real-time-kinematic (RTK) antenna on a mast was added to the robotic platform, a Bayonet-350 (previously the C2i SeaOx). Data collected from the robot were compared with those collected by the Coastal Research Amphibious Buggy (CRAB) and the Lighter Amphibious Resupply Cargo (LARC), unique amphibious vessels capable of collecting seamless topography and bathymetry in use for decades at the US Army Engineer Research and Development Center’s Field Research Facility (FRF). Data were compared on five different days in a range of wave conditions ( in 8-m depth) resulting in a root-mean square difference of 8.7 cm and bias of 2 cm for 24 different cross-shore profile comparisons. Additionally, a repeatability test was performed to asses measurement uncertainty. The repeatability test indicated a total vertical uncertainty (TVU) of 5.8 cm, with the highest spatial error at the shoreline.
Introduction
Nearshore bathymetry is an important measurement for coastal scientists and engineers. Bathymetry data are used to quantify nearshore sediment volumes relevant for coastal protection, and are required as a bottom boundary input to coastal numerical models, influencing wave, current, and sediment transport dynamics in the nearshore and surfzone environments. Bathymetric evolution in this region is often dynamic, with changes on the order of meters occurring on timescales of hours to days during energetic conditions (Brodie et al. 2018) as sandbars change morphologies. During storm events, sandbars typically move offshore and shorelines retreat toward the land. Subsequently, the rebuilding of the dry beach during quiescent periods happens slowly. This natural morphologic evolution is still poorly understood and predicted in numerical models today (Sherwood et al. 2022), motivating the need for high-quality, frequent measurements of bathymetry to drive model testing and development. In addition, up-to-date bathymetry surveys may be important for accurately predicting hotspots of beach erosion during storm events (Cohn et al. 2021) and are required for accurate quantification of storm impacts.
Whereas hydrodynamic forcing conditions are typically measured on hourly times scales, morphological response data are typically measured more coarsely in time (months to years). Recent applications of lidar as a continuous monitoring tool have enabled collection of subaerial beach data at hourly timescales (O’Dea et al. 2019; Phillips et al. 2019; Vos et al. 2017). However, the richest surfzone bathymetry data sets monitor subaqueous morphology on monthly timescales (at best), leaving a major gap in morphologic response to hydrodynamic forcing. To supplement the lack of spatiotemporal measurement in the subaqueous portion of the profile, others have investigated measuring bottom change information using fixed installations of acoustic single-beam measurements (Brodie et al. 2018; Moulton et al. 2014; Gallagher et al. 1998), which provide high temporal resolution data but can be sparse in space (a few instruments spaced tens to hundreds of meters apart).
In the surfzone, collecting these bathymetric data is challenging because breaking waves and shallow water offer dangerous conditions for traditional vessels. Amphibious vehicles, which are designed to either float or drive, present a safer solution to capturing the transition between topography and bathymetry and do not require the same agility near the shoreline. The US Army Engineer Research and Development Center’s Field Research Facility, which has maintained a monthly bathymetry survey record for over 40 years, uses two unique amphibious vessels to accomplish this task. The 10-m-tall, three-wheeled Coastal Research Amphibious Buggy (CRAB) set the standard for high-accuracy nearshore surveys (Birkemeier and Mason 1984). Historically, it was surveyed with a rod and level and now uses a real-time kinematic (RTK) Global Navigation Satellite System (GNSS). Additionally, the Lighter Amphibious Resupply Cargo (LARC) vessel is an amphibious boat equipped with a single beam sonar and an RTK GNSS (Forte et al. 2017). These vehicles are highly specialized, and therefore impractical for general usage by coastal practitioners.
To meet the demands of coastal science and practitioner, traditional nearshore survey techniques for the surfzone frequently use a boat with a single-beam acoustic sonar (Work et al. 1998) coupled with a person walking the beach and wading into the water to capture the transition from land to sea (Ludka et al. 2019). MacMahan (2001) mounted a single-beam echo-sounder and GNSS to a personal water craft (PWC), paving the way for a lower cost system capable of surfzone operation. This has become a popular method today because of its accessibility and data quality; however, the technique still puts personnel in a dangerous breaking-wave environment.
Uncrewed robotic systems offer opportunity to remove the danger for personnel operating in this environment. Autonomous surface vehicles (ASVs) are nimble and can move quickly through the water, but remain susceptible to the breaking action of waves in the surfzone. Francis and Traykovski (2021) developed a self-righting planing hull platform with a single-beam sonar, which shows promise at improving viability for surfzone operation.
The concept of using robotic platforms to crawl on the seafloor has been ongoing for decades with varying levels of success. The first of such documented efforts used a small construction tractor powered by an electric motor with the mission of collecting nearshore bathymetry using odometery, pitch and roll measurements, and a 450-m umbilical cord (Seymour et al. 1978). Since that time, numerous vehicles have been developed, tested, and run (Dally et al. 1994; Zeziulin et al. 2016; and citations within), which have had challenges ranging from electrical, logistical, and mechanical, with each providing a lesson learned for continued incremental technology maturity.
The objective of this effort is to build on those works, using a new commercially available robotic platform to survey the ever-changing bathymetry of the surfzone environment. We start by describing the vehicle platform, design, enhancements, and how the data are processed to produce bathymetry estimates. We then present the data set used for this effort, and compare the collected data with established survey techniques to asses skill in varying wave conditions and perform repeatability tests of the system. We then discuss the sources of error, practicality of operation, design improvements, and future work before concluding.
Methods
Robotic Platform
The platform used for this effort, the Bayonet-350 (previously C2i SeaOx) (referred to herein as the crawler), is commercially available from Bayonet Ocean Vehicles. The crawler is 0.9 m wide by 1.5 m long and 0.3 m tall and weighs a total of 250 kg, unballasted [traversing the surf in Fig. 1(c)]. During this effort, the vehicle was loaded with 54 kg of lead ballast along the chassis for only the multiday data comparison (“Multiday Comparison Data Set” section). The vehicle is powered by two electric motors from Allied Motion (QB034) and draws from four lithium iron phosphate (LiFO) batteries (2 kWh each), enabling an advertised range of 16 km. The motors have encoders used for odometery when GNSS information is unavailable. A Keller 9LX pressure sensor is also onboard and can be used for depth estimates, but was not investigated in this effort. The inertial navigation system (INS) is composed of a KVH Industries 1,750 Fiber Optic Gyro (FOG), providing accelerations and vehicle attitude, and a Sparton M9 attitude heading reference system (AHRS) for heading. The physical layout of the crawler vehicle is shown in Fig. 1(b).
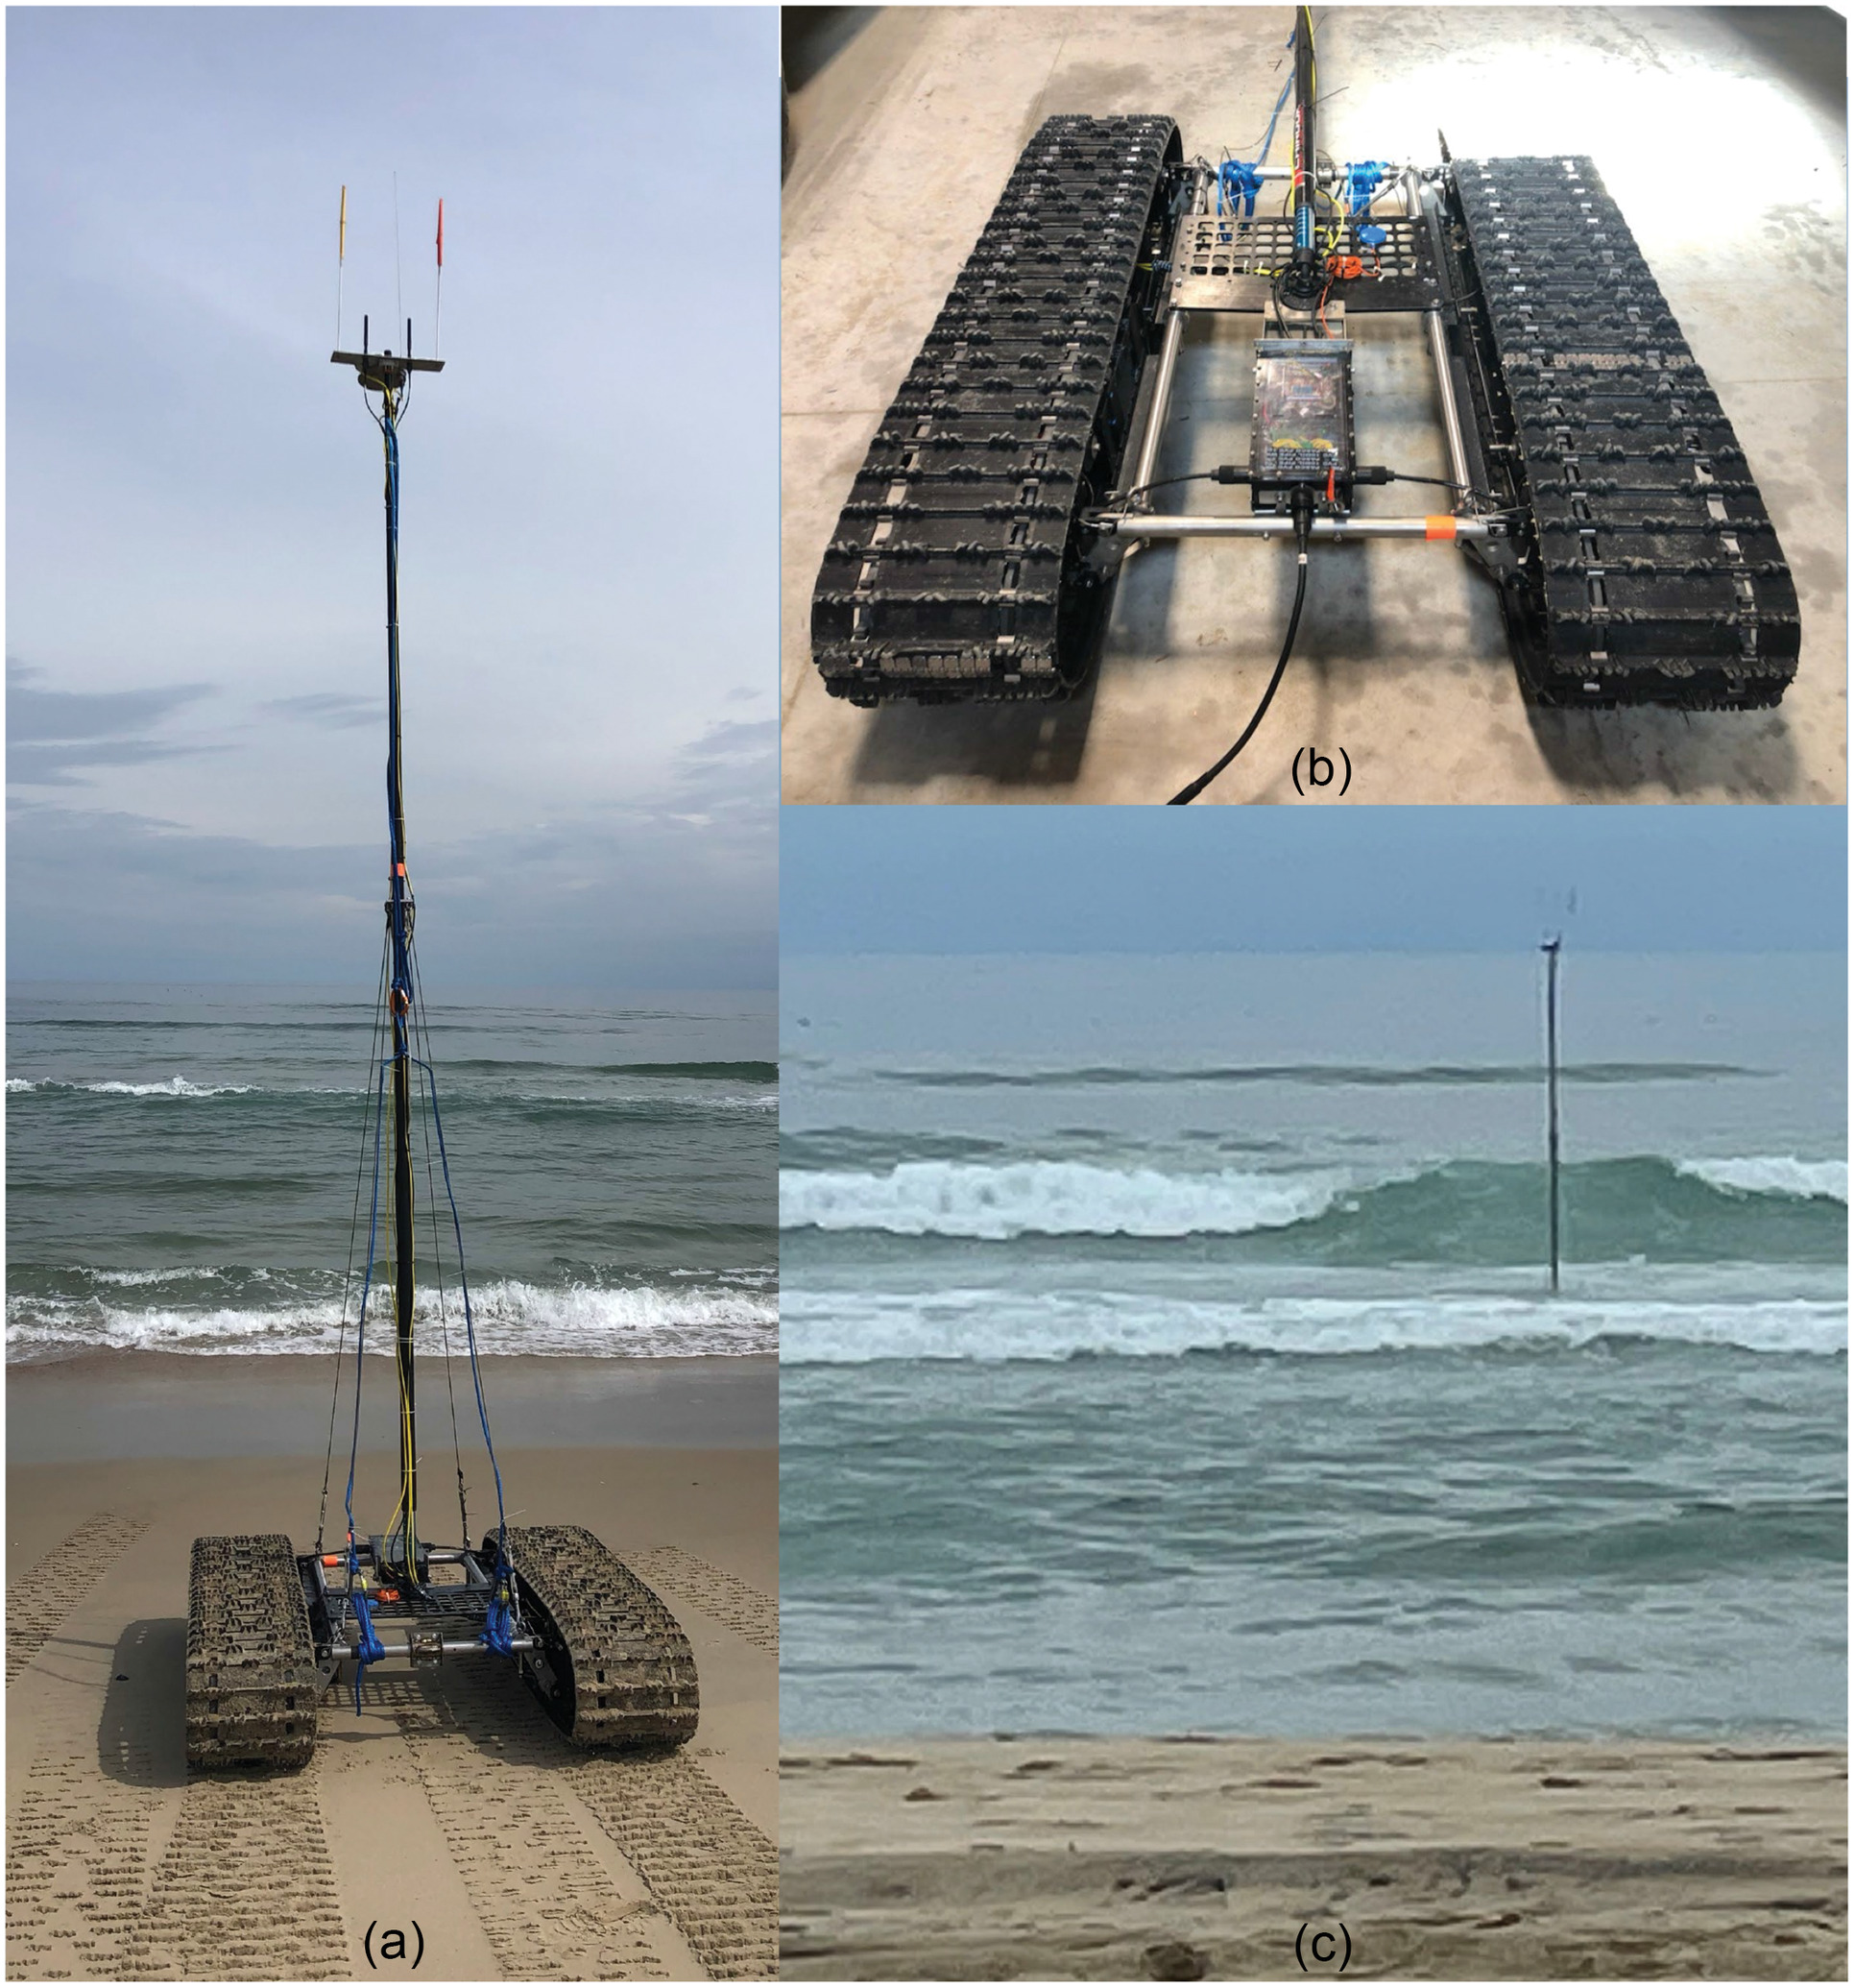
A 5-m carbon fiber wind-surfing mast supports a RTK GNSS antenna and radio correction antenna, which is guyed to the vehicle at the four corners of the chassis inside of the vehicle tracks. The Zephyr 2 GNSS antenna is cabled down the mast to an onboard Trimble R7 (ref 2) receiver collecting multi-constellation data and a Raveon very high frequency (VHF) data radio housed in a waterproof housing in the vehicle track body. The receiver tracks the global positioning system (GPS) and Globalnaya Navigatsionnaya Sputnikovaya Sistema in Russian (GLONASS) constellations and outputs National Marine Electronics Association (NMEA) GGA strings to the onboard collection computer (Technologix TS4900), which is responsible for the navigation calculations, and a custom interface board developed by GreenSea Systems is responsible for the sensor input/output to the TS4900. The system has basic autonomy, simply following way-point navigation and has no on-board perception for near-field obstacle avoidance. The Balefire Graphical User Interface (GUI) provided by GreenSea allows for real-time user feedback and mission planing. This GUI runs on a shoreside base station, allowing for remote data logging capability through radio communications (Silvus Streamcaster 4200). The crawler radio is housed in a waterproof buoy cabled to the electronics box and mechanically attached to the vehicle’s mast, removing the need to tend to the buoy as the vehicle travels through the surf.
Data Collection
Comparison survey data were collected at the US Army Engineer Research and Development Center (ERDC) Field Research Facility (FRF) in Duck, North Carolina. The FRF is a coastal observatory that has been collecting surfzone bathymetry since 1978. The FRF’s primary survey vessels are the CRAB (Birkemeier and Mason 1984) and LARC (Forte et al. 2017) with total vertical uncertainty (TVU) of and depending on where in the profile respectively (each at the 95% confidence interval). The CRAB and LARC were used to collect the ground-truth verification data in this effort.
The main data collection effort discussed in this paper was part of the During Nearshore Extreme-Event Experiment (DUNEX) in which nearshore bathymetric surveys were collected by the CRAB and LARC every 2 days for the months of September and October of 2021 along the outer banks coast of North Carolina with most work focused in Duck, North Carolina. As part of this experiment, the crawler was run in overlapping space and time with the LARC or CRAB, depending on day (Fig. 2). The LARC and CRAB collections resulted in 24 comparison profiles collected on five different days and are discussed in “Multiday Comparison Data Set” section.
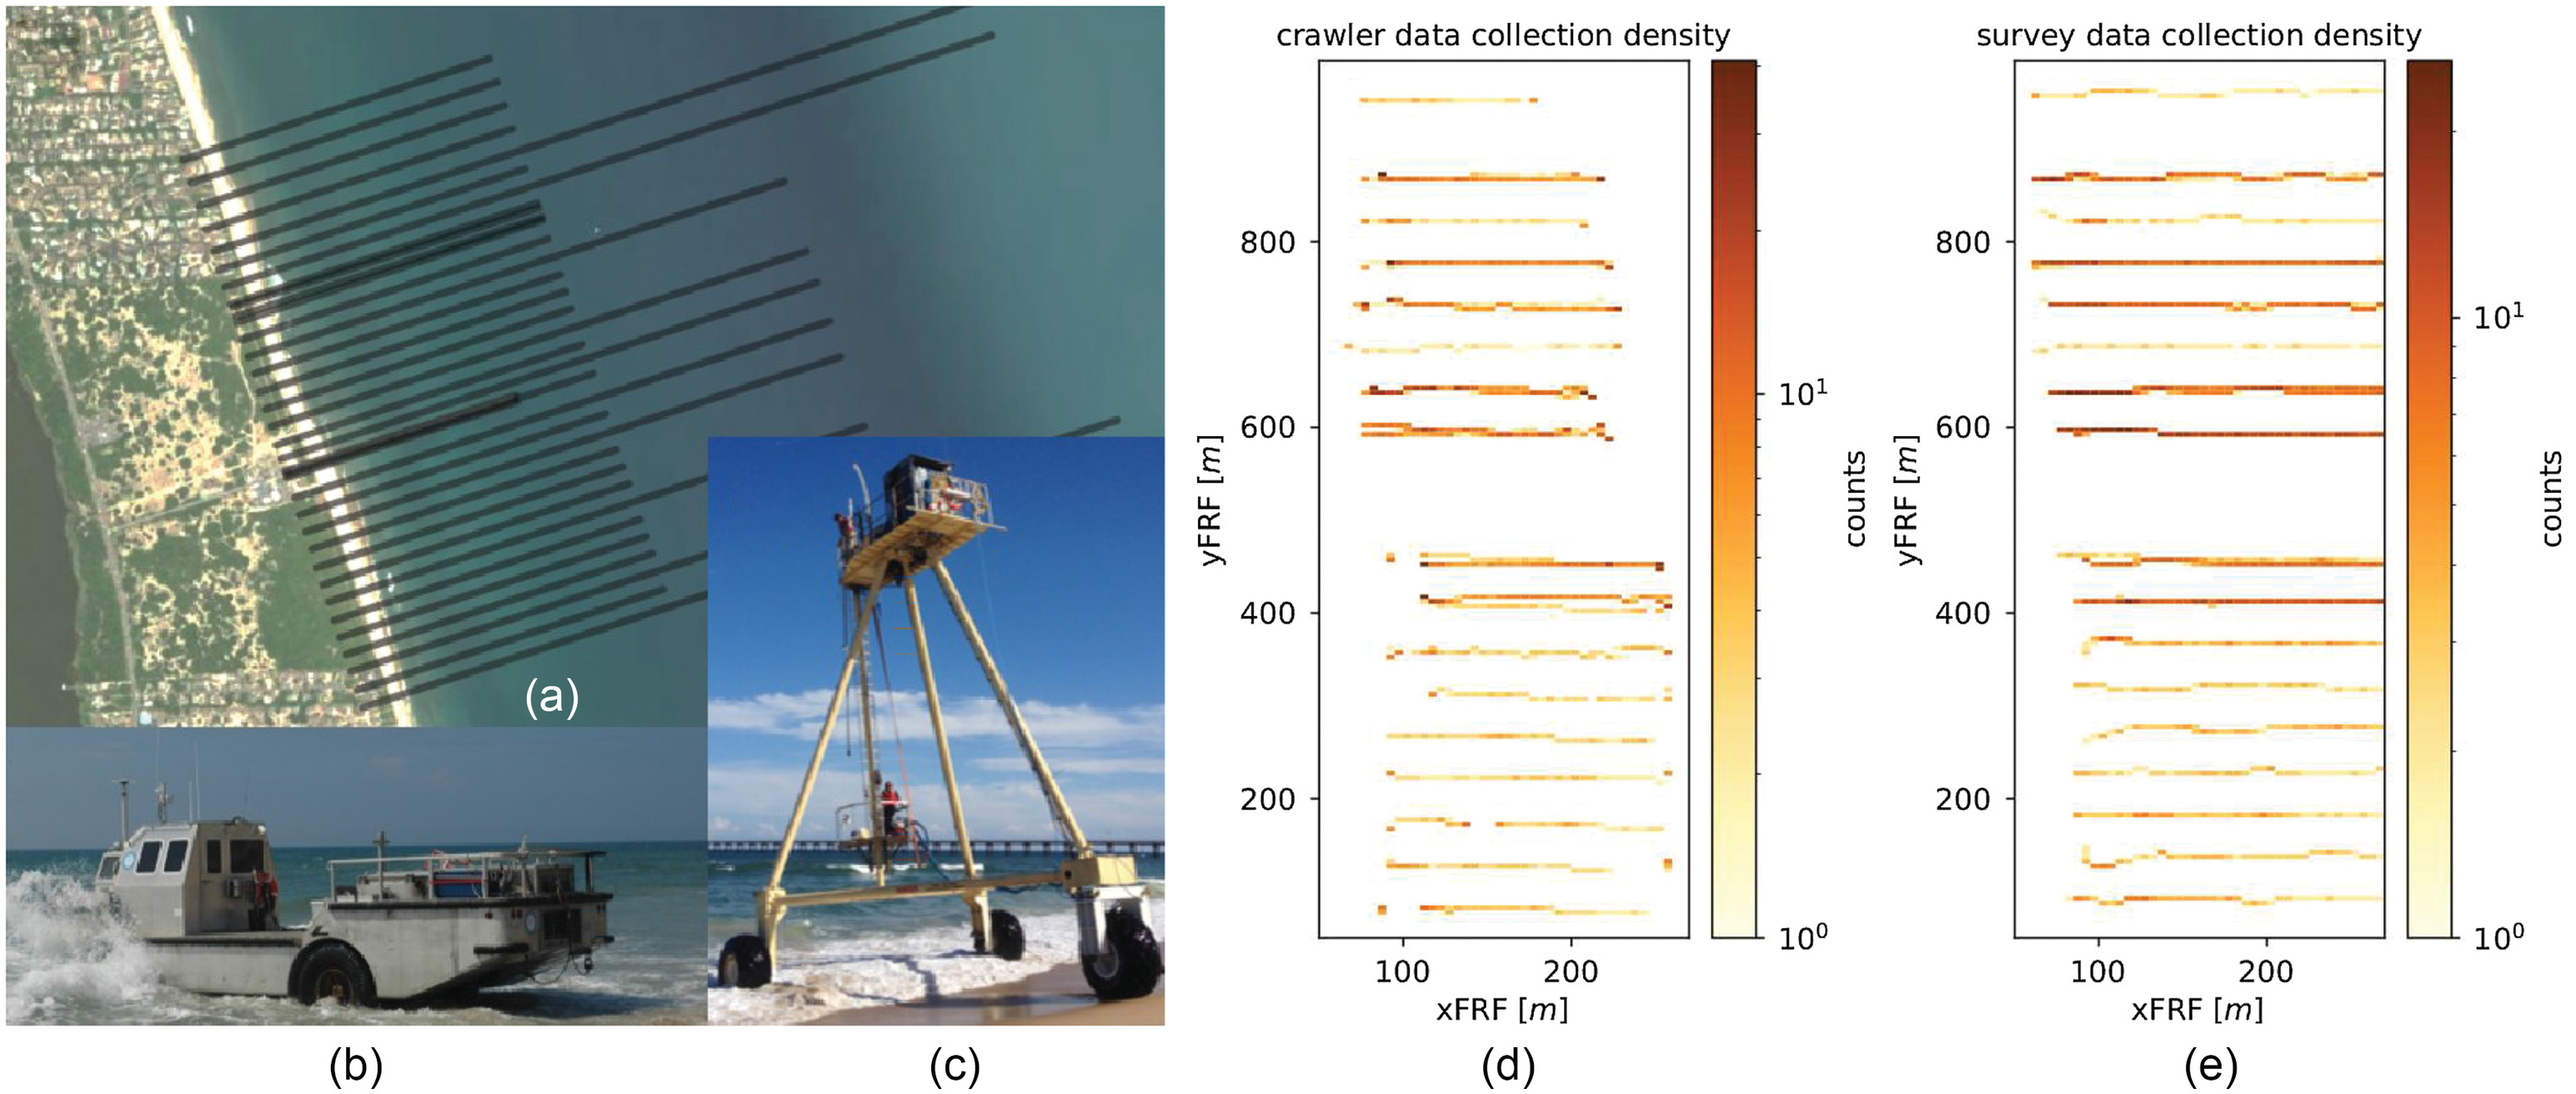
During the experiment, crawler profiles were collected with roughly 50-m alongshore spacing, and out to approximately 3 m water depth. An additional repeatability experiment was conducted on March 22, 2022, in which the crawler was programmed to run the same mission 10 times using the same start and end way-points (20 total profiles = ), as described in the “Repeatability” section. Relevant CRAB/LARC survey data were not available for this comparison. Wave conditions [including significant wave height (), wave peak period (), and wave mean direction ()] observed by the FRF’s 8-m array of pressure gauges, number of lines per day, and compared survey date for each data set are presented in Table 1.
| Crawl date | (m) | (s) | (degrees true north) | Profile count | Survey vehicle | Survey date |
|---|---|---|---|---|---|---|
| October 5, 2021 | 0.51 | 11.6 | 84.8 | 3 | CRAB | October 5, 2021 |
| October 18, 2021 | 0.54 | 5.9 | 35.3 | 2 | CRAB | October 5, 2021 |
| October 19, 2021 | 0.73 | 5.3 | 38.4 | 4 | CRAB | October 19, 2021 |
| October 20, 2021 | 0.23 | 7.3 | 81.8 | 9 | LARC | October 21, 2021 |
| October 25, 2021 | 0.61 | 5.6 | 100.3 | 6 | LARC | October 24, 2021 |
| March 22, 2022a | 0.30 | 10.2 | 92.1 | 20 | LARC | January 13, 2022 |
a
Data were only used for repeatability test.
The base station [Trimble Alloy (ref 1) coupled with a TRM11500 GNSS antenna] was configured as a single-baseline RTK base, and it tracks GPS and GLONASS constellations for surveys conducted at the FRF. All data utilized in this effort were collected within 500 m of the base station. RTK corrections [Compact Measurement Record (CMR)+ protocol] were transmitted at 1 Hz by a Raveon data radio at 164.8625 MHz. The R7 receiver, packaged in the crawler body, was configured as a rover to receive the base station corrections at 1 Hz through an onboard Raveon data radio and output NMEA 0183 GGA/GGK strings at 1 Hz. Project data were projected in the State Plane Coordinate System of 1983 (SPCS 83), North Carolina Zone, with units of meters.
A local coordinate system was defined for the FRF property with the positive -axis oriented in the cross-shore (), at 69.97° east of north in the stateplane coordinate system, and the -axis oriented in the alongshore () direction. The local coordinate system was calculated as a translation and rotation of the North Carolina stateplane system [European Petroleum Survey Group (EPSG): 32119], having an origin at easting = 901,951.68 m, northing = 274,093.15 m. For the remainder of this work, all horizontal data will be presented in local coordinates, and elevation data will be presented as orthometric heights relative to the North American Vertical Datum of 1988 (NAVD 88), using GEOID 12B.
The crawler was driven over a temporary benchmark, established in the FRF parking lot, to measure the GNSS antenna height (repeatability test only). Tread heights (2 cm) were subtracted from the average offset values before and after a collection to determine the height of the antenna on the mast, . The temporary benchmark was created with the National Geodetic Survey online processing service (OPUS) using the static routine and has a reported error less than 1 cm in horizontal and vertical position.
Data Processing
The logged NMEA GGA string output elevations in mean sea level (MSL), which needed to be converted to NAVD88 orthometric heights to enable comparison with the LARC/CRAB. Raw ellipsoid values were back-calculated using the geoid and orthometric values provided in the NMEA GGA string, and then converted to NAD83 (2011) epoch 2,010.0 using the National Geodetic Survey (NGS) GEOID12B geoid model. Although GEOID12B has been superseded by GEOID18, in this effort GEOID12B was used for consistency with the CRAB and LARC survey data. Only data with a GGA quality of 4 (RTK only) were used.
A three-dimensaional (3D) conformal transformation, consisting of a rotation and translation of the origin (no scale change) was then applied to the SPCS 83 NC coordinates, to convert the GNSS antenna’s location to the local FRF coordinate system. A second rotation/translation was then applied using the vehicles pitch, roll, yaw from the crawler’s inertial navigation system (INS) and the height of the GNSS antenna from the ground, , to calculate the ground elevation (NAVD 88).
The vertical offset, , was measured two ways during this study. For the multiday comparison, was manually measured with a tape measure (used for comparisons in the “Multiday Comparison Data Set” section). During the research and development process, we realized that manual measurement of the mast height with a long tape provided an additional source of uncertainty to our analysis. For the repeatability test (“Repeatability” section and moving forward, general practice), was determined by surveying a benchmark (described in the “Data Collection” section). For both methods of determining , the vehicle tread height was subtracted. This resulted in of 5.05 and 5.1 m, respectively, between the two test sets, illustrating the importance of measuring the offset each time you survey with the vehicle, particularly if the antenna or mast has been removed in between surveys, because tension in the guy wires may change.
Survey Data Accuracy and Repeatability Processing
To quantify survey accuracy, crawler and LARC/CRAB data were linearly interpolated to a common cross-shore coordinate () in phase with the FRF’s -coordinate. LARC and crawler data were then compared when the median location for each crawler profile was within a 10-m window of the median of each survey line. Biases and root-mean squared differences were calculated for individual profiles and all overlapping points and presented in the “Multiday Comparison Data Set” section.
Statistical assessments of hydrographic survey performance are typically determined by comparing multiple independent sets of elevation data collected over the same area. The resultant statistical comparison between the two data sets (crossing intersections, or repeatability) and variance in those measurements are used to asses uncertainty in the measurements. The International Hydrographic Organization (IHO) defines standards in the shallow/nearshore environment to require independent characterization of errors in the system as depth-dependent and depth-independent uncertainties (International Hydrographic Organization 2020). In shallow waters, the depth-dependent component approaches zero. The USACE requires 9-cm repeatability () with a total vertical uncertainty at the 95% confidence interval for coastal projects (USACE 2013). In this effort, we followed the approaches outlined by the IHO and USACE to quantify survey TVU at the 95% confidence interval from the crawler repeatability tests. TVU was calculated as 1.96 times the standard deviation at each cross-shore location of the gridded data (1-m resolution).
Results
Multiday Comparison Data Set
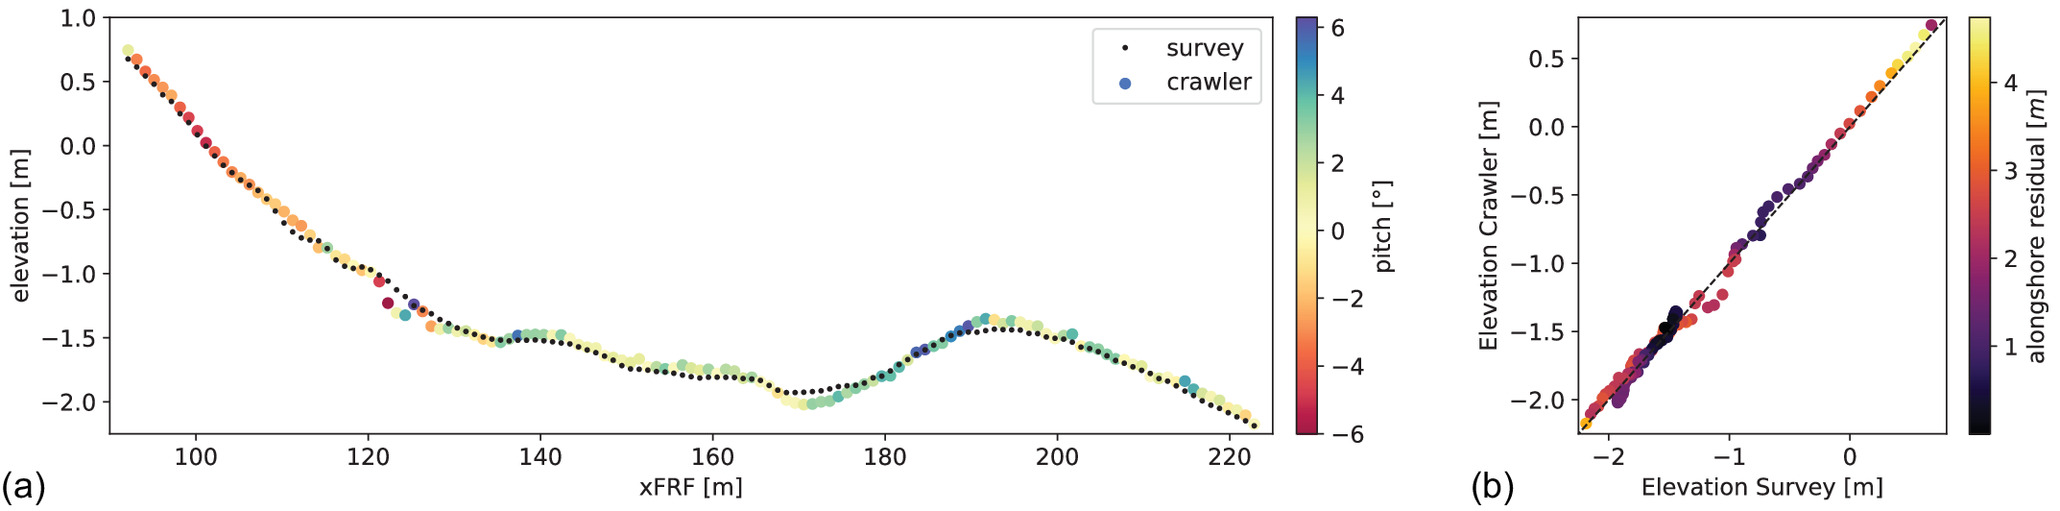
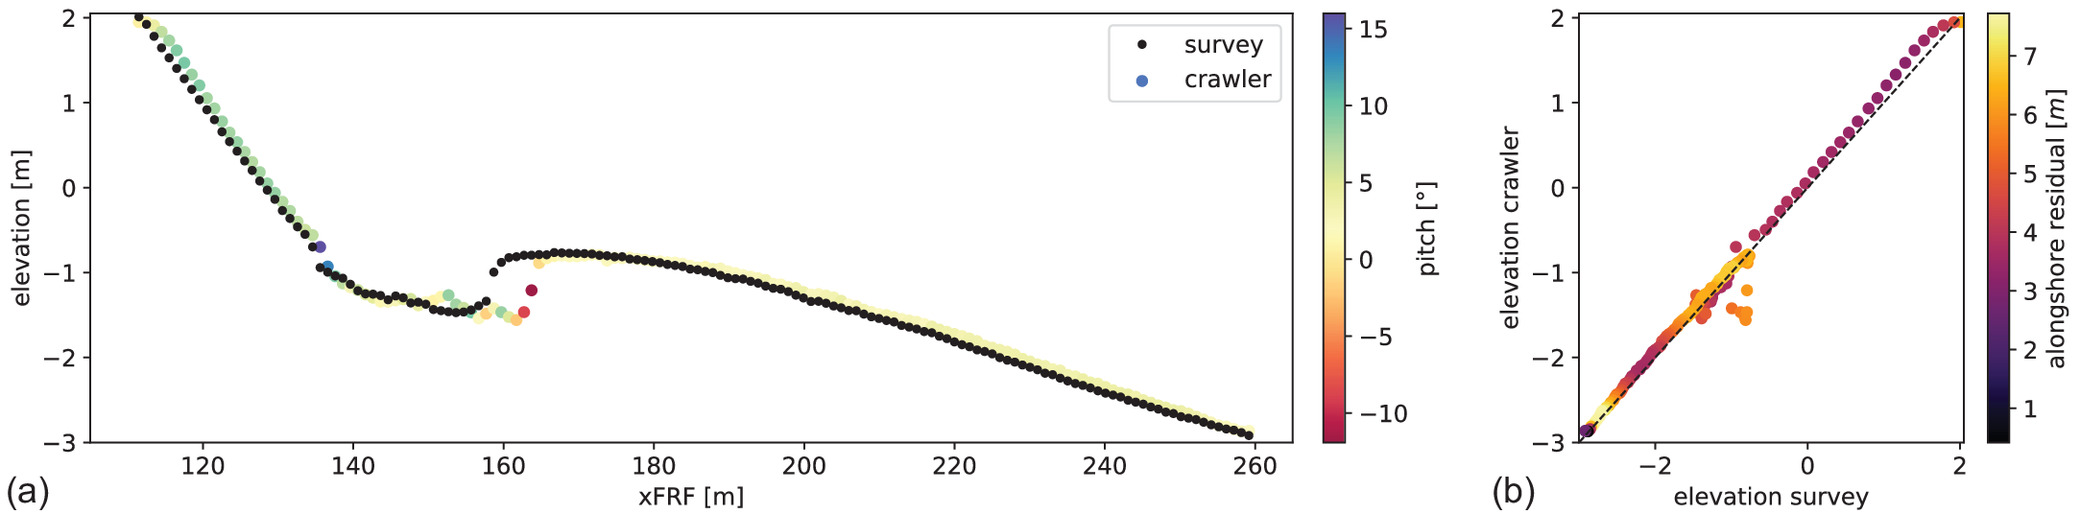
The crawler and CRAB/LARC survey were compared over multiple days, with multiple wave conditions (Table 1) to asses the ability of the platform to survey in a range of conditions. An example profile [Fig. 3(a)] located at from October 19, 2021, shows the crawler’s data relative to elevation data collected by the CRAB. This example shows good overall agreement between the two platforms, with the crawler having slightly increased elevation variance in a small section of the profile (, and 160 m) and a discrepancy on the sandbar crest (). The root-mean square difference (RMSD) between the crawler and CRAB was 5 cm, with the crawler measurements biased high by 1 cm for this example profile. A comparison plot of elevation values produced by the crawler and the CRAB are shown in Fig. 3(b). Minor differences in elevation can seen between and NAVD88.
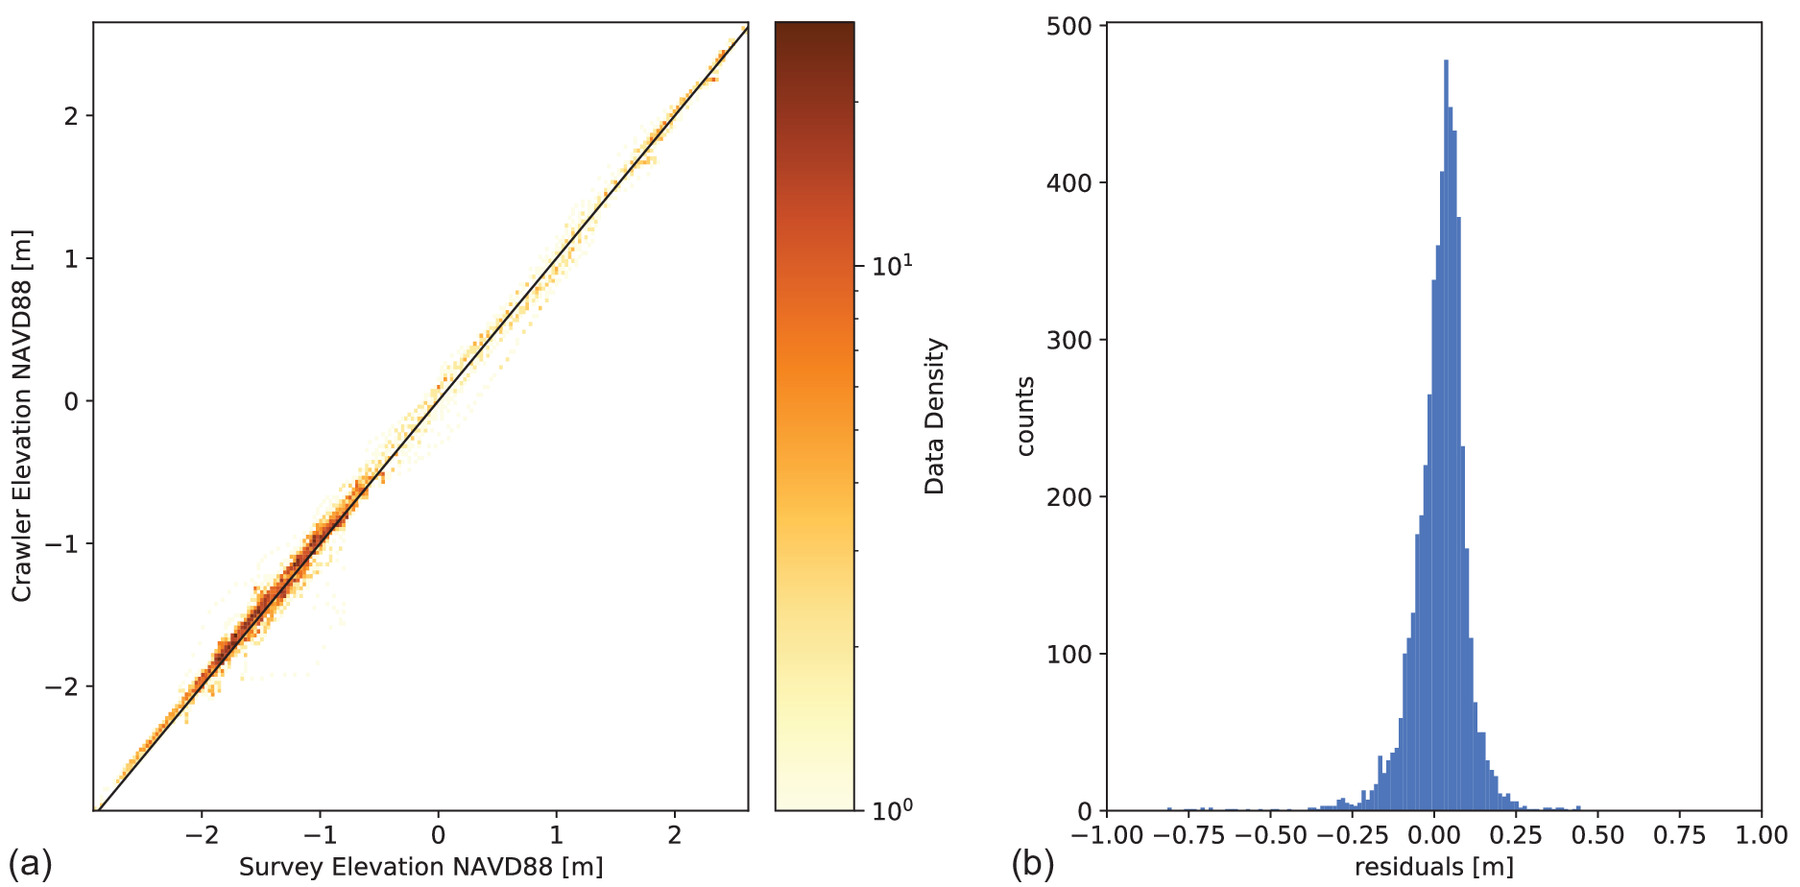
A comparison of all elevation values produced by the crawler and the CRAB/LARC for the entire 24-profile data set are presented in Fig. 4. The distribution of the elevation residuals has few outliers with a narrow population skewed slightly positive, representative of a RMSD of 8.7cm, bias of 1.9 cm, and of 0.99 for the entire population. The highest scatter was observed to occur in the subaqueous portion of the profile (below mean sea level, NAVD88), where the majority of data is concentrated (darker colors, Fig. 4) due to the geometry of the profile lines.
Repeatability
Repeatability tests showed good agreement in profile elevation across 20 different profiles (10 out and 10 back) [Fig. 5(a)]. Not only were the elevations reproduced well, but the positions were also well reproduced (typically within a meter) [Fig. 5(b)]. Slightly more alongshore variation was apparent on the northern (out) line. This may be due to how the missions were programmed, in which an individual out-and-back loop was run, then the mission was repeated, creating slightly different start positions. Profile elevation residuals were calculated relative to the median elevation at each cross-shore location [Fig. 5(c)] and can be used to highlight areas where profile members do not agree (while excluding extremes).

The elevation variance between samples was highest just offshore of the shoreline () and slightly elevated near the primary sandbar ( to 180 m). The residual values relative to the computed median on the sandbar crest were tightly clustered relative to their transect direction {warm and cool clusters [Fig. 5(c)] }, but substantially differed from each other, suggesting there is true alongshore variability in the shape of the sandbar between the two transects. The high variability and resultant 95% confidence intervals near the shoreline [Figs. 5(c and d)] occurred near a vertical step at the base of the foreshore. The magnitude of uncertainty was slightly reduced (particularly at the shoreline) when traveling shoreward, potentially due to a better spatial agreement between line members [Fig. 5(d)]. The overall TVU for the entire data set is .
Discussion
Quality of Data
The data presented here indicate that the crawler platform with an RTK GNSS mast provides highly accurate topography and bathymetry measurements of the intertidal and very shallow nearshore (to 3m depth), with the highest uncertainty at the shoreline. The higher uncertainty at the shoreline likely occurred due to a very steep soft-sand step at the base of the foreshore (Masselink and Puleo 2006), which led to whipping of the carbon fiber antenna as the vehicle tipped over this step and reset on the new slope. In addition, during the tests, there were collapsing breakers at the shoreline, which likely introduced additional movement of the platform, and is a challenge for any amphibious vessel (Forte et al. 2017).
Despite the overall excellent agreement between the crawler and CRAB/LARC data, there were some profiles with relatively higher errors. Fig. 6 shows an example of profile comparison with crawler data collected on October 5, 2021, and the CRAB survey from October 6, 2021, which has an RMSD of 15 cm and the crawler biased high by 3 cm. In this example, the measured profile between the two platforms showed good agreement except near the shoreward edge of the sandbar. In this instance, the CRAB’s survey shows a sandbar crest 5 m shoreward of that from the crawler. Additionally the crawler showed small features in the trough minimum, not observable by the CRAB ( to 160 m).
These spatial differences could be due to a number of reasons. First, the profiles were measured in slightly different locations in the alongshore [Fig. 6(b), where warm colors indicate differences of ]. Additionally, although the temporal latency between the profile measurements was only 1 day, it is still quite possible for the morphology to change on this spatiotemporal scale (Brodie et al. 2018). There were three obvious profiles with high RMSD values () that had similar differences to that pictured in Fig. 6 (i.e., good agreement except cross-shore position of sandbar). With those three profiles removed from the overall population, the RMSD reduced only minorly (), suggesting that this was not a major contributor to the statistical differences between collection platforms (CRAB/LARC and crawler).
Sources of Measurement Difference
Regarding the general sources of difference between the survey and crawler, there are several other possibilities, which range from systematic errors to explainable differences. The determination assumes that the vehicle does not stand on tread ends (rather, they set into the soft ground). This could be a source of error on hard substrates. The mast is a repurposed windsurfing mast made from carbon fiber and has the ability to flex. When the mast is impacted by a wave or the crawler slams/resets on the seafloor after going over a bed form, the GNSS antenna will vibrate with the mast. Although this movement is small in the overall scale of errors, it is not entirely insignificant. Additionally, the mast is guyed to the vehicle for stabilization, but we have found that the guys may loosen over a long day of effort, increasing the mast height during that duration, implicitly adding error through the course of a day.
Additionally, although the rotation/translation of the GNSS measurements assumes a rigid and perpendicular orientation of the mast to the vehicle, the only assurance of that perpendicular orientation assumption is purely visual, which could lead to bias in the measurements. Future work will focus on creating a easy-to-implement method to account and address mast tilt. Both the CRAB and the LARC have a larger wheel base (and wheel diameter) than that of the crawler ( and ), which means that the crawler is inherently measuring different (smaller) length scales of bottom elevations. Fig. 3 ( to 160 m) and Fig. 6 ( to 160 m) show an example of the small variance in the bar-trough measured by the crawler, but not by the CRAB or LARC.
Impact of Waves
To asses the impact of waves on the movement of the crawler, the crawler’s navigation solution speed over ground was compared with the measured speed over ground calculated using positional information from the RTK GNSS mast (Fig. 7). The navigation speed over ground uses only the speed derived from the odometery, which inherently assumes a no-slip condition between the vehicle and the seafloor; therefore, any deviation in measured speeds from these suggest the vehicle is being affected by environmental forcing (e.g., waves and currents).
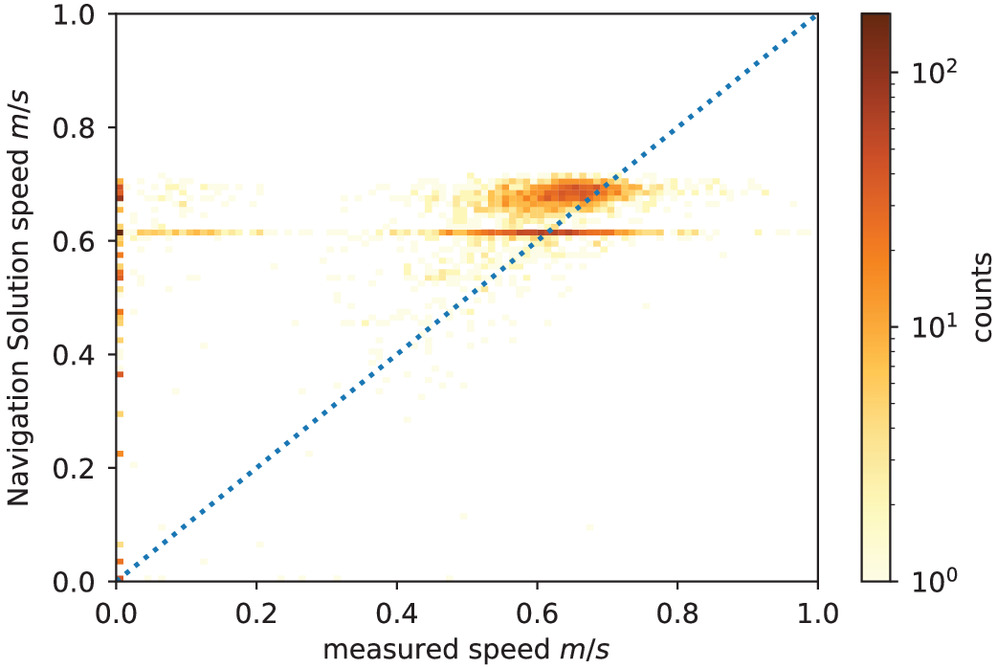
The vehicle’s navigation system speed showed two populations of speed ( and to ), whereas the measured speed derived from the GNSS ranged from 0.4 to with no clear subpopulations. The comparison skill between the two showed a RMSD of with a bias of and 0.19, demonstrating a statistically insignificant relationship between the measured and navigation speeds. These differences could add up if the crawler was relying on only its odometry speed for underwater navigation, instead of the GNSS information. For example, if we expand to calculate navigation error using the measure bias () assuming a 10-min profile, the crawler would (on average) complete its mission 78 m past the point it was intending to finish. These differences in speed between the odometry and GNSS were surprisingly large for the relatively small () conditions tested in this study.
Developing robust vehicle position estimates without GNSS will become important if the crawler is to be used in larger wave conditions and deeper waters, where a mast will eventually become impractical. That is, if robust surveys could be conducted using the pressure signal and navigation solution, the mast could be removed, and the crawler could collect data in larger waves and extend into deeper waters. Future work will explore this approach.
Lessons Learned and Future Applications
After operating the crawler for well over a year, a few vehicle improvements have been made to simplify operations and increase probability of mission success. Specifically the communications system was hardened with heavier duty cables between the control box and the communications buoy to alleviate stress from breaking waves. Eventually, the radio communications (back to a base station on the beach) were relocated to the mast top to remove need for a communications buoy all together when operating with a mast (Fig. 1) to reduce failure points and simplify deployment. Experience thus far has focused on operating in wave heights less than 1 m, and performance has not been characterized as a function of wave height and currents. Future work will focus on expanding the operating conditions (and usage of increased ballast) to help define operating conditions and examine performance as a function of environmental conditions.
Additional work will be focused on addressing the odometery based no-slip assumptions for times when a GNSS signal is not available (e.g., deeper water or submerged under a wave crest). Furthermore, work will continue toward hardening the system for operation in the harsh surf-zone environment. The mast top will be waterproofed for submersion, allowing us to explore varying the mast height (ensuring submersion), and weighing positional lock loss (and subsequent error) against vehicle survivability in bigger waves.
In its current configuration, the vehicle is well-suited for practical applications surveying shallow nearshore bathymetry. The narrow width of the vehicle allows the system to be driven across typical beach walk-over, and the total weight of the system allows for a two-person break down and carry in three main pieces for beach access without ramps (e.g., stairs). Presently, the vehicle travels around , which is less than one-third the speed of surface vessels in the studies by Francis and Traykovski (2021) and MacMahan (2001) and is slightly slower than a typical walking speed. This can be time-consuming for long transects, but conversely provides stability through breaking waves. Future work could investigate increasing vehicle speed or coupling the system with other autonomous surface vessels to increase survey efficiency.
Although initial work has focused on sandy coasts, experience suggests the vehicle should perform similarly in hard-bottomed environments (e.g., rocky and reefs); however, the destructive nature of the tracks may not be well-suited for sensitive marine environments (e.g., reefs). In addition, the vehicle is likely to be successful in muddy environments because the wide track width distributes vehicle weight into manageable bottom stress, preventing sinkage, but more work is required to assess operability and survey accuracies in these environments.
Conclusion
A bottom-crawling amphibious ground vehicle was evaluated as a survey platform using data collected at the FRF in Duck, North Carolina. The vehicle data was evaluated against 24 different survey profiles collected by the FRF’s CRAB and LARC amphibious survey platforms. The 24 profiles were collected over five different days with varying wave heights ranging from 0.47 to 0.8 m. The crawler performed well against measured bathymetry comparisons in repeatability tests, all while keeping the human operator out of the dangerous breaking surf. Overall system accuracy comparisons showed a RMSD of 8.7 cm and a bias of 1.9 cm with of 0.99. The largest discrepancies were found in a small population (three) of profiles, which show good agreement across the profile, with a shift in the sandbar crest, leading to a more significant RMSD () of the individual profile comparisons. It was found that these profiles all were collected on different days or had longer alongshore distances between measurement locations.
Repeatability tests were completed to assess measurement uncertainty. Generally the vehicle performed well over the majority of the profile with a (95% confidence) TVU over the entire profile. The highest uncertainty occurred at the shoreline and was likely due to a near-vertical step at the base of the foreshore during testing conditions. Interestingly, comparison of the vehicle’s odometery-based speed and masted GNSS-derived speed showed poor agreement, suggesting that the vehicle is violating its no-slip assumption due to lift, likely from waves, even during relatively low-power waves. Future work will focus on expanding operating conditions, spatial coverage, and hardening the current design for broader applicability.
Data Availability Statement
All data, models, and code that support the findings of this study are available from the corresponding author upon reasonable request.
Acknowledgments
This effort was funded by the USACE Civil Works Coastal Ocean Data Systems Program. The authors would like to thank the Jason Pipes, Chris Thoburn of the USACE Field Research Facility, as well as Mike Farinella and Arnis Mangolds of C2i/Bayonet Ocean Vehicles for their technical support in this effort. Additionally, the authors would like to thank the anonymous reviewers for their contributions to make this a better paper.
References
Birkemeier, W. A., and C. Mason. 1984. “The CRAB: A unique nearshore surveying vehicle.” J. Surv. Eng. 110 (1): 1–7. https://doi.org/10.1061/(ASCE)0733-9453(1984)110:1(1).
Brodie, K. L., M. L. Palmsten, T. J. Hesser, P. J. Dickhudt, B. Raubenheimer, H. Ladner, and S. Elgar. 2018. “Evaluation of video-based linear depth inversion performance and applications using altimeters and hydrographic surveys in a wide range of environmental conditions.” Coastal Eng. 136 (Jun): 147–160. https://doi.org/10.1016/j.coastaleng.2018.01.003.
Cohn, N., K. L. Brodie, B. Johnson, and M. L. Palmsten. 2021. “Hotspot dune erosion on an intermediate beach.” Coastal Eng. 170 (Dec): 103998. https://doi.org/10.1016/j.coastaleng.2021.103998.
Dally, W. R., M. A. Johnson, and D. A. Osiecki. 1994. “Initial development of an amphibious rov for use in big surf.” Mar. Technol. Soc. J. 28 (1): 3–10.
Forte, M. F., W. A. Birkemeier, and J. R. Mitchell. 2017. Nearshore survey system evaluation. Vicksburg, MS: US Army Engineer Research and Development Center.
Francis, H., and P. Traykovski. 2021. “Development of a highly portable unmanned surface vehicle for surf zone bathymetric surveying.” J. Coastal Res. 37 (5): 933–945. https://doi.org/10.2112/JCOASTRES-D-20-00143.1.
Gallagher, E. L., S. Elgar, and R. Guza. 1998. “Observations of sand bar evolution on a natural beach.” J. Geophys. Res. Oceans 103 (C2): 3203–3215. https://doi.org/10.1029/97JC02765.
IHO (International Hydrographic Organization). 2020. International hydrographic organization standards for hydrographic survey. Number 44 in 6.0.0. Monaco: IHO.
Ludka, B. C., et al. 2019. “Sixteen years of bathymetry and waves at San Diego beaches.” Sci. Data 6 (1): 1–13. https://doi.org/10.1038/s41597-019-0167-6.
MacMahan, J. 2001. “Hydrographic surveying from personal watercraft.” J. Surv. Eng. 127 (1): 12–24. https://doi.org/10.1061/(ASCE)0733-9453(2001)127:1(12).
Masselink, G., and J. A. Puleo. 2006. “Swash-zone morphodynamics.” Cont. Shelf Res. 26 (5): 661–680. https://doi.org/10.1016/j.csr.2006.01.015.
Moulton, M., S. Elgar, and B. Raubenheimer. 2014. “Improving the time resolution of surfzone bathymetry using in situ altimeters.” Ocean Dyn. 64 (5): 755–770. https://doi.org/10.1007/s10236-014-0715-8.
O’Dea, A., K. L. Brodie, and P. Hartzell. 2019. “Continuous coastal monitoring with an automated terrestrial lidar scanner.” J. Mar. Sci. Eng. 7 (2): 37. https://doi.org/10.3390/jmse7020037.
Phillips, M., C. Blenkinsopp, K. Splinter, M. Harley, and I. Turner. 2019. “Modes of berm and beachface recovery following storm reset: Observations using a continuously scanning lidar.” J. Geophys. Res. Earth Surf. 124 (3): 720–736. https://doi.org/10.1029/2018JF004895.
Seymour, R. J., A. L. Higgins, and D. P. Botham. 1978. “Tracked vehicle for continuous nearshore profiles.” Coastal Eng. 1978 (May): 1542–1554. https://doi.org/10.1061/9780872621909.093.
Sherwood, C. R., et al. 2022. “Modeling the morphodynamics of coastal responses to extreme events: What shape are we in?” Annu. Rev. Mar. Sci. 14 (Jan): 457–492. https://doi.org/10.1146/annurev-marine-032221-090215.
USACE. 2013. Engineering and design: Hydrographic surveying. Rep. No. EM 1110-2-1003. Washington, DC: USACE.
Vos, S., R. Lindenbergh, S. de Vries, T. Aagaard, R. Deigaard, and D. Fuhrman. 2017. “Coastscan: Continuous monitoring of coastal change using terrestrial laser scanning.” In Vol. 2017 of Proc., Coastal Dynamics, 115. Helsingor, Denmark: Kulturværftet.
Work, P. A., M. Hansen, and W. E. Rogers. 1998. “Bathymetric surveying with gps and heave, pitch, and roll compensation.” J. Surv. Eng. 124 (2): 73–90. https://doi.org/10.1061/(ASCE)0733-9453(1998)124:2(73).
Zeziulin, D., V. Makarov, A. Belyaev, P. Beresnev, and A. Kurkin. 2016. “Use of modular amphibious vehicles for conducting research in coastal zone.” In Proc., EGU General Assembly Conference Abstracts, EPSC2016–3131. Vienna, Austria: European Geosciences Union General Assembly.
Information & Authors
Information
Published In

Journal of Surveying Engineering
Volume 149 • Issue 4 • November 2023
Copyright
This work is made available under the terms of the Creative Commons Attribution 4.0 International license, https://creativecommons.org/licenses/by/4.0/.
History
Received: May 28, 2022
Accepted: Apr 28, 2023
Published online: Jul 5, 2023
Published in print: Nov 1, 2023
Discussion open until: Dec 5, 2023
ASCE Technical Topics:
- Antennas
- Automation and robotics
- Bathymetry
- Business management
- Coastal engineering
- Coasts, oceans, ports, and waterways engineering
- Communication systems
- Continuum mechanics
- Dynamics (solid mechanics)
- Engineering fundamentals
- Engineering mechanics
- Geomatic surveys
- Geomatics
- Highway transportation
- Infrastructure
- Land surveys
- Lifeline systems
- Motion (dynamics)
- Nearshore
- Ocean engineering
- Oceanography
- Practice and Profession
- Research and development
- Shores
- Solid mechanics
- Systems engineering
- Topographic surveys
- Transportation engineering
- Uncertainty principles
- Vehicles
Authors
Metrics & Citations
Metrics
Citations
Download citation
If you have the appropriate software installed, you can download article citation data to the citation manager of your choice. Simply select your manager software from the list below and click Download.