Dynamic Response Effect and Role of Mass-Stiffness Eccentricity
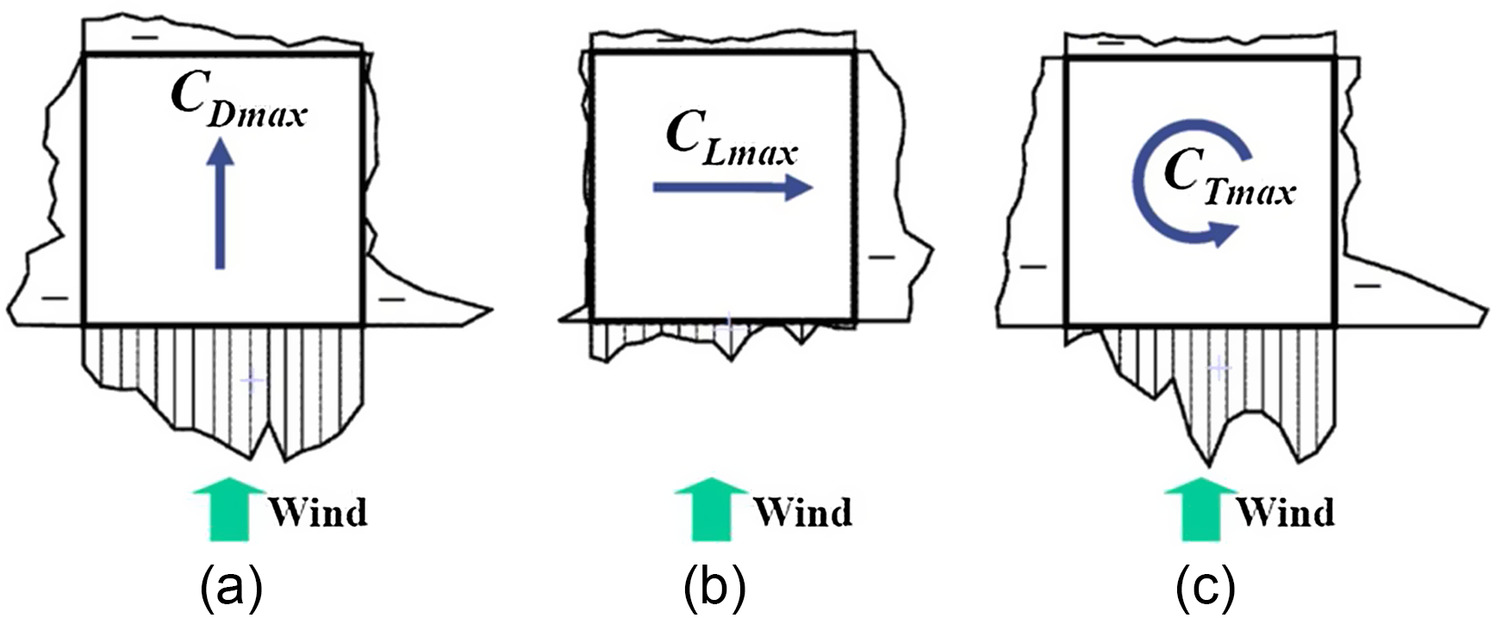
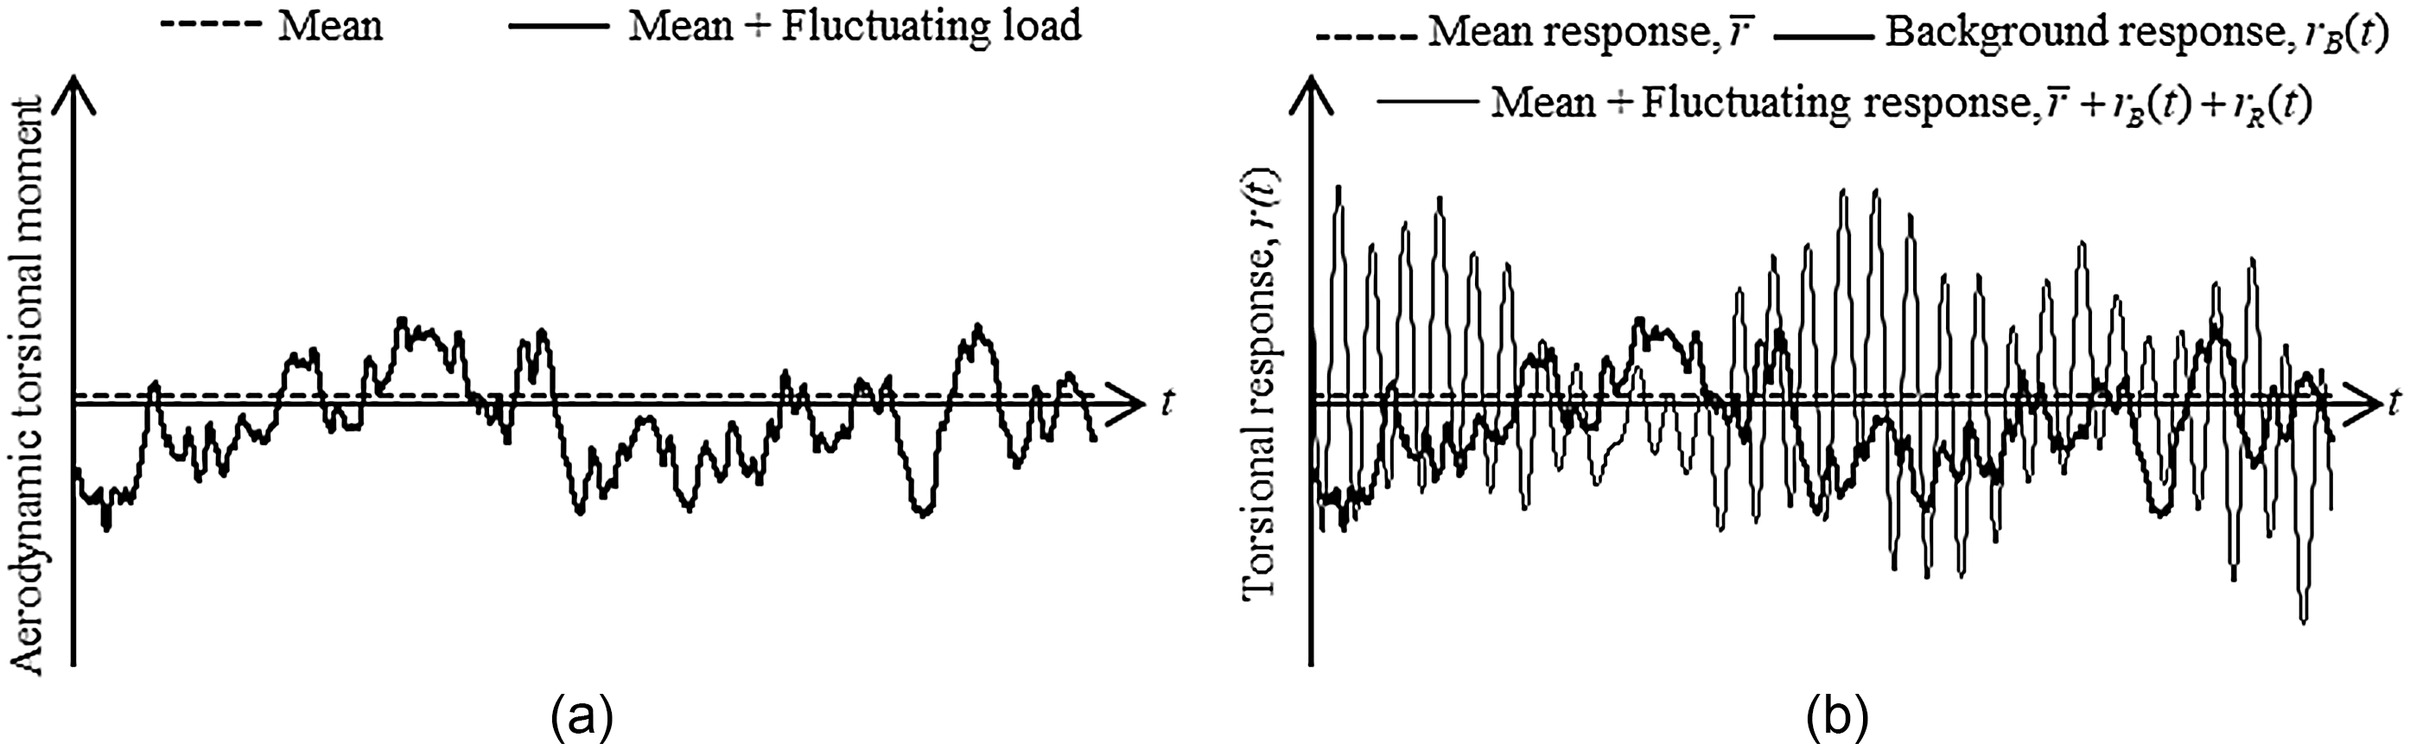
If the natural frequency of torsional mode is close to the high-energy frequency content of the aerodynamic load, the response can be significantly intensified due to inertial moment. The effect of dynamic response is introduced by resonant component in wind load. Fig.
2 illustrates the aerodynamic torsional moment and torsional response of the structure (e.g., rotation and base or story torsional moment) in the time domain. Aerodynamic torsional moment is composed of mean and background components. The total response is composed of mean (static response to mean load) and fluctuating components, where the fluctuating component is composed of background component (static response to fluctuating load) and resonant component (dynamic response to fluctuating load).
The mean and background component of torsional-wind load is the summation of the torsional moment of pressure on the building surface with respect to a reference point (RP). The point can be considered at any arbitrary point of the floor plan, but is usually chosen at mass center (), geometric center () (geometrical centroid of plan area), or elastic stiffness center (). Regardless of the point selected, resonant components of along- and across-wind loads always form at mass center.
If
,
, and
are not the same, additional components are induced. Where
and
are not the same (i.e., mass-stiffness eccentricity), lateral and torsional modes of vibration are coupled. Although other cases of internal eccentricity (i.e., between
and
, or between
and
) do not result in coupling of lateral and torsional vibrations, their effect can also be significant for tall buildings. Study results by Tallin and Ellingwood (
1985b), Kareem (
1985), Saiful Islam et al. (
1992), and Chen and Kareem (
2005) showed that mass-stiffness eccentricity can change the overall load substantially.
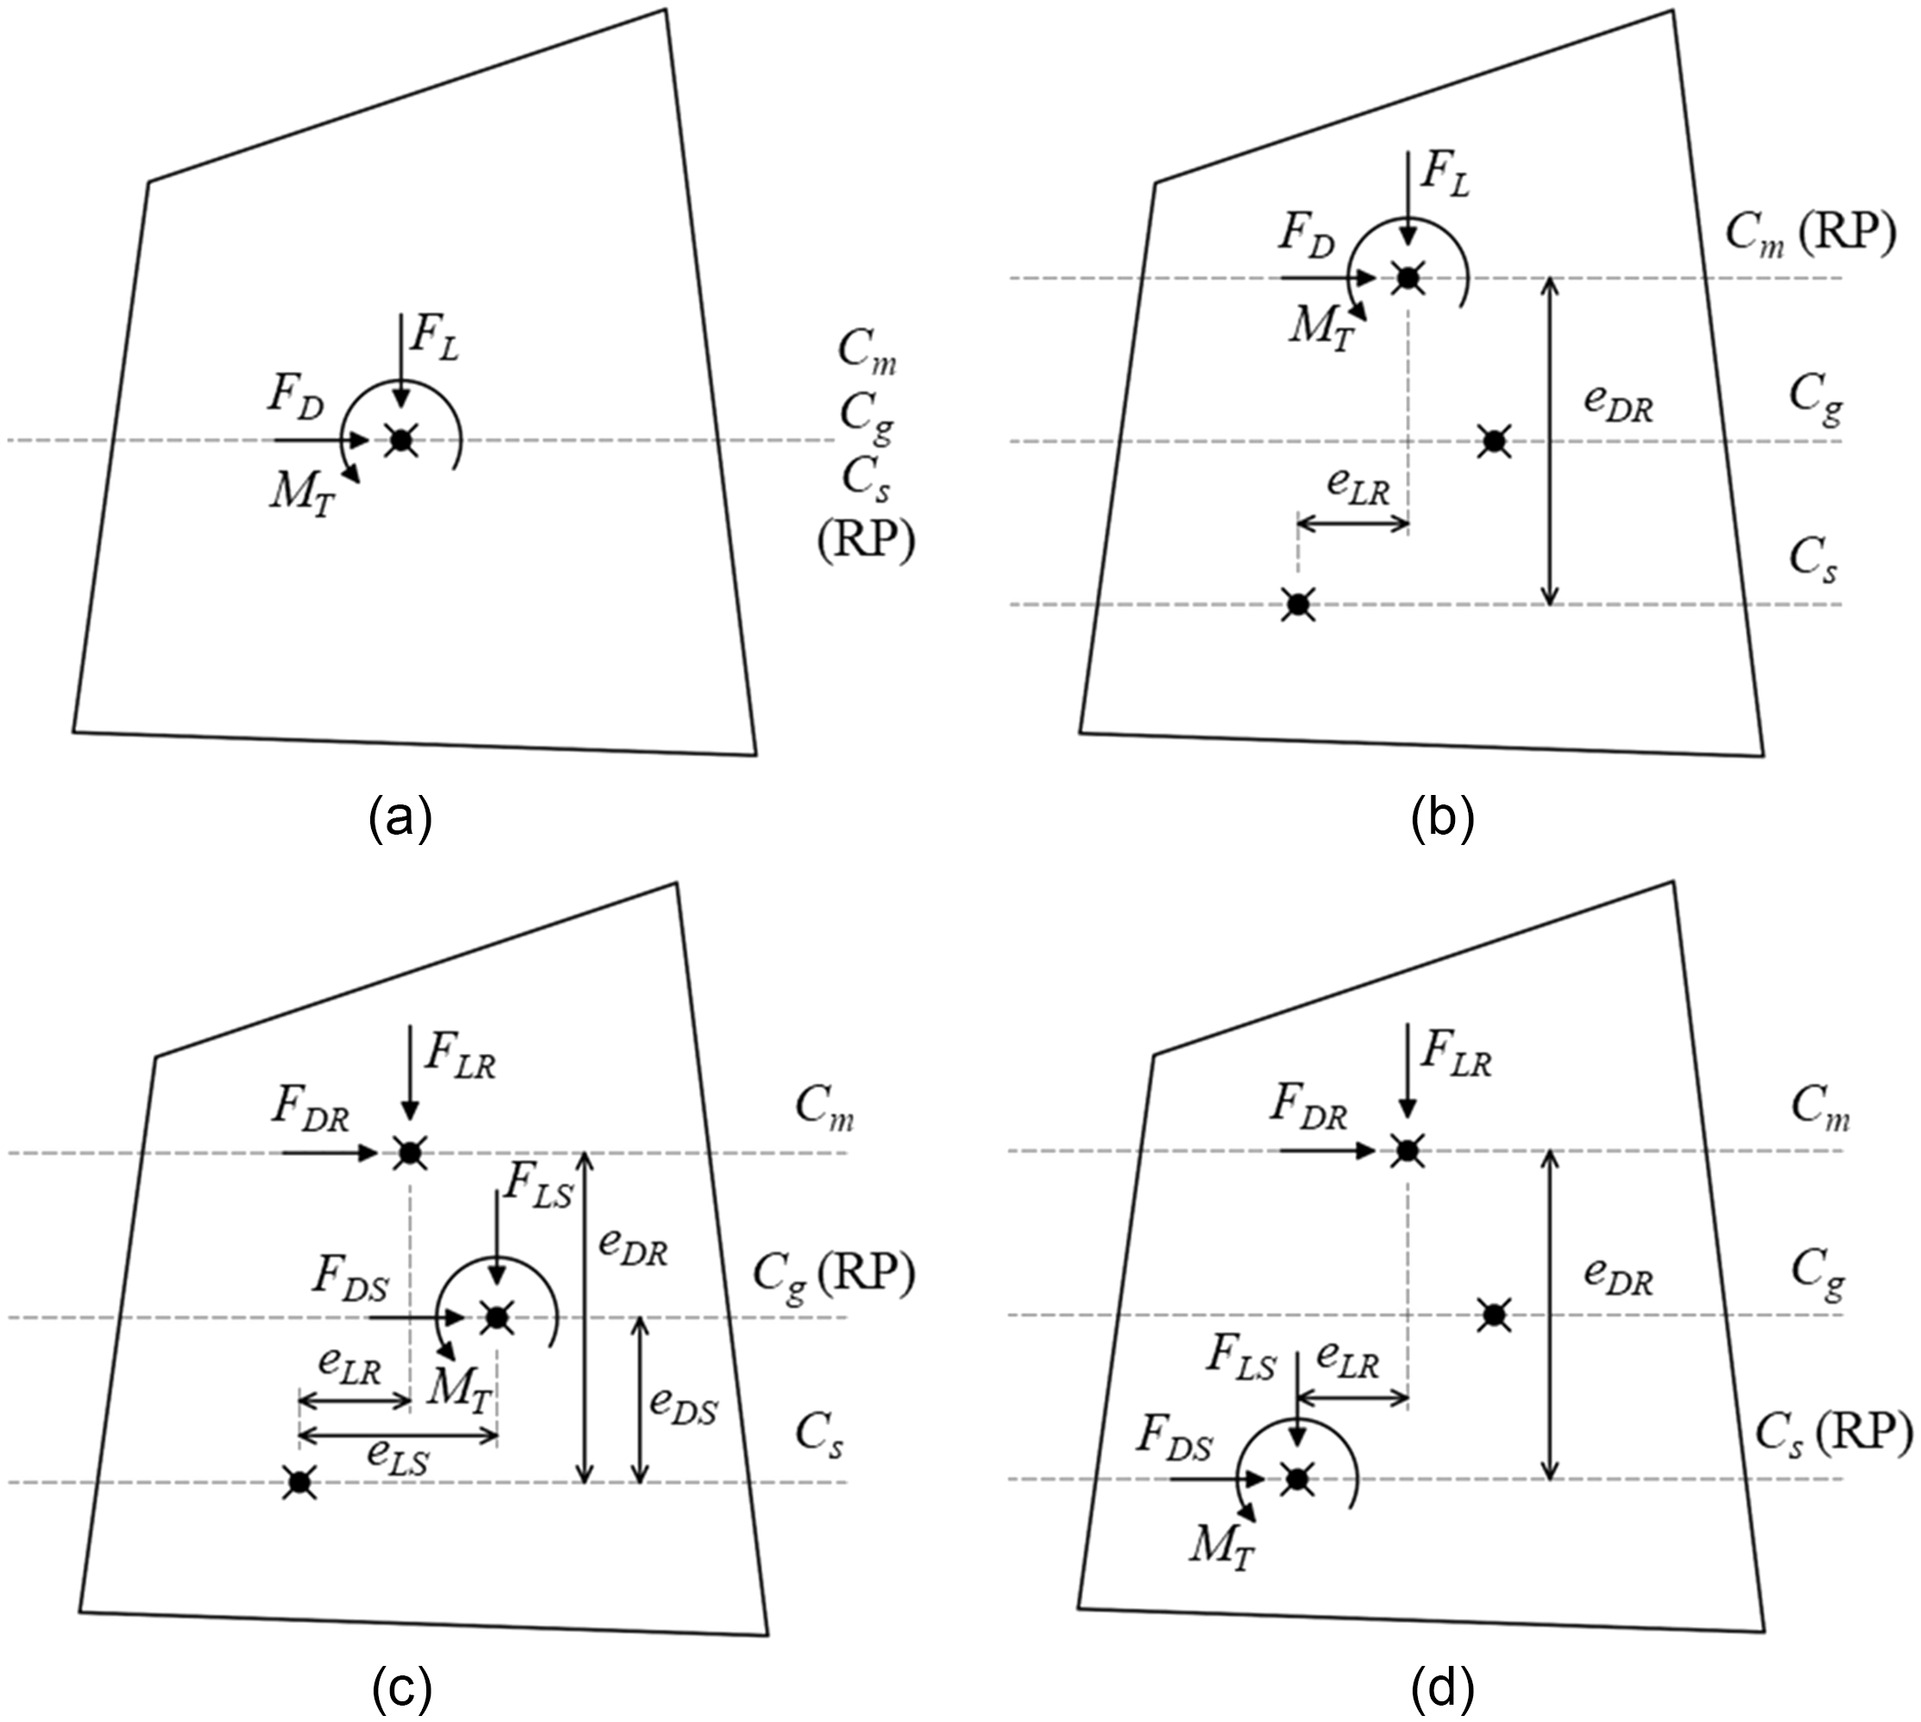
To illustrate possible eccentricities, four cases shown schematically in Fig.
3 for an arbitrary plan shape are considered. Here, total torsional-wind load (
) acts at the center of stiffness and includes
(the summation of aerodynamic and dynamic torsional-wind moments) and the product of components
and
and their corresponding eccentricity. For the forces, the first subscripts
and
refer to along- and across-wind loads, respectively, and second subscripts
and
refer to resonant and the summation of mean and background (
and
), respectively. Eccentricities between centers of mass and stiffness are denoted by
and
, and eccentricities between centers of stiffness and geometry are denoted by
and
.
A summary of the terms that should be considered in each case for calculation of
is reported in Table
1. It is worth mentioning that floor behavior can be considered as a rigid diaphragm, which is common in analytical models of tall buildings. Hence, although the resonant component of
is also formed at the mass center, it is not necessary to decompose it into resonant component (
) and aerodynamic component (
).
Mass-stiffness eccentricity may be inherent and accidental. In practice, even when a building is designed to have zero inherent eccentricity (zero eccentricity between centers of mass and stiffness), accidental eccentricity exists due to the nonuniform arrangement of mechanical, electrical and architectural components, construction error, etc. For this reason, consideration of accidental eccentricity in seismic design is recommended by codes and standards (e.g., 5% based on ASCE 7-22) where the load is essentially inertial force.
With regard to wind design, the resonant component (which is inertial force) in the case of short and medium-rise buildings is relatively small, and noninclusion of accidental eccentricity is reasonable. For tall buildings, the resonant component is generally large, especially for across-wind load, and even a small eccentricity can amplify the torsional-wind load. Hence, consideration of accidental eccentricity, as a minimum value for mass-stiffness eccentricity if inherent mass-stiffness is zero, for tall buildings can result in a safer design (
Alinejad and Kang 2020b).
Evaluation of Torsional-Wind Load by Wind Tunnel Tests
Current wind tunnel tests can be divided into two categories: aeroelastic and aerodynamic. Aeroelastic wind tunnel tests are based on scaling of flow characteristics, geometry, and structural system; it is considered the most accurate available technique for the calculation of wind load, since all components including mean, background, and resonant are measured directly, and possible aeroelastic effects can be observed within the test. However, this test is expensive and preparation of the model is difficult and complex.
Aerodynamic wind tunnel tests are typically used in practice if the flow is not considerably affected by the building deformation and aeroelastic effects are not significant. Aerodynamic wind tunnel tests are based on scaling of flow characteristics and geometry, but structural properties are not included, and a rigid model is used. In the test, only aerodynamic components (mean and background) of the loads are measured, using high-frequency force balance or pressure integration techniques, and resonant component and contribution of mass-stiffness eccentricity should be obtained by performing numerical analysis.
For the calculation of torsional-wind load based on the result of aerodynamic wind tunnel tests, two approaches are considered.
In case of short and medium-rise buildings, across-wind load and resonant component of torsional-wind load are negligible. The mean and background components of along- and torsional-wind loads (
and
, respectively) are measured from the wind tunnel test as base shear and torsional moment with respect to center of geometry. Then, equivalent eccentricity (
) is representative of aerodynamic source of torsional-wind load and calculated as the ratio of
, where
is projected width of building in the direction normal to wind direction, and
and
are the maximum values of
and
, respectively (
Boggs et al. 2000;
Isyumov and Case 2000;
Elsharawy et al. 2012). If mass-stiffness eccentricity (
) is not zero, it should be considered for
as an added term for torsional-wind load. To view the correlation between along- and torsional-wind loads, the load ratio is calculated as
, where
is the value of
at the moment where
. This method is implemented in ASCE 7-22. Although the general procedure to obtain equivalent eccentricity is the same, sometimes slightly different assumptions are used (e.g., using
instead of
for calculation of equivalent eccentricity).
For tall buildings, the condition is more complicated and both translational vibration in across-wind direction and torsional vibration are significant. In this condition, the procedure based on equivalent eccentricity is not suitable. Equivalent static torsional-wind load, comprising mean, background, and resonant components, can be a more realistic representation of wind-induced torsional effects. Because of the complexity associated with distribution of forces and torsional moment along with height, base forces and moments, in general, are measured and distributed based on fundamental mode shapes. Some models do not explicitly include turbulence intensity of ABL (
Tamura et al. 1996;
Li et al. 2014), while others include it (
Liang et al. 2004;
Katsumura et al. 2014).
Despite differences in the derivation of the equivalent static torsional-wind load, the load should be representative of aerodynamic load (mean and background loads) and dynamic response. The equivalent static load for the dynamic response (resonant load) is typically obtained based on either peak deformation or acceleration (
Ryu et al. 2020). In current practice, with assumptions of negligible mean value and linear mode shape, equivalent static torsional-wind load based on measured torsional moment in wind tunnel tests is defined based on Eq. (
1) (
Tamura et al. 1996;
Ha 2017;
ISO 2009;
AIJ 2015;
KDS 2019)
where
= elevation of
th story;
= peak factor;
= velocity pressure at building height,
;
= width of building normal to wind direction;
is the projected area normal to wind direction;
= height of
th story;
is the normalized
, standard deviation of measured base torsional moment in wind tunnel;
is the normalized
, standard deviation of resonant response; and
is the mode shape. Also,
is the mode correction factor for nonlinear mode shape and is usually defined as the ratio of the standard deviation or PSD of generalized load based on different mode shapes (
Tallin and Ellingwood 1985a;
Holmes 1987;
Kijewski and Kareem 1998;
Zhou and Kareem 2000;
Zhou et al. 2002); and
is the mode correction factor for generalized base torsion and is applied to
. This is used because measured base torsional moment in wind tunnel test is based on uniform mode shape (
), while the load is based on linear mode shape (
). In common practice, a value between 0.6 and 0.7 is used for
in Marukawa et al. (
1992), ASCE 49-21 (
ASCE 2021), AIJ (
2015), ISO (
2009), and KDS (
2019).
To calculate
,
can be obtained by time-history analysis or by applying mechanical transfer function to the PSD of the base moment. In a case where a smooth PSD is available and the assumptions that the external load can be considered as white noise,
can be estimated by
, where
and
are the frequency and damping of the first torsional mode, respectively, and
is the value of PSD of base torsional moment at frequency of
(
Lin 1967;
Tallin and Ellingwood 1985b;
Boggs and Dragovich 2006). The general procedure for obtaining equivalent static torsional-wind load based on wind tunnel test results is reported in Appendix
I.
In the above procedure, it is assumed that there is no coupling between lateral and torsional mode shapes, and thus mass-stiffness eccentricity is zero. Several models were proposed to consider coupled mode shapes and the contribution of mass-stiffness eccentricity to torsional-wind load. Cui and Caracoglia (
2018) proposed a universal formula based on a novel generalized aerodynamic formulation for calculating the coupled dynamic response of a tall building with consideration of aerodynamic damping and stiffness.
Comparison with Results of Wind Tunnel Tests
Tokyo Polytechnic University (TPU) provides an open-access aerodynamic database for high-rise buildings (
Tamura 2012), which includes results of pressure integration tests on 1/400 scaled rigid rectangular prism models with different heights, side ratios (
), exposure types, and angles of attack. Sampling frequency and duration of all tests are 1,000 Hz and 32.768 s, respectively. For the purpose of this study, wind pressure data were extracted for buildings with aspect ratio (
) of
,
,
, and
(which correspond to buildings with width of 40 m and height of 80, 120, 160, and 200 m in real scale); the sample included urban and suburban areas with wind speed profile power (exposure factor),
, of 1/4 and 1/6, respectively, and 0° to 45° angle of attack. Information regarding dimensions of specimens and wind speeds in the wind tunnel test is summarized in Table
11.
Below, wind tunnel results are compared with ASCE 7-22, AIJ, and ISO (which is similar to KDS).
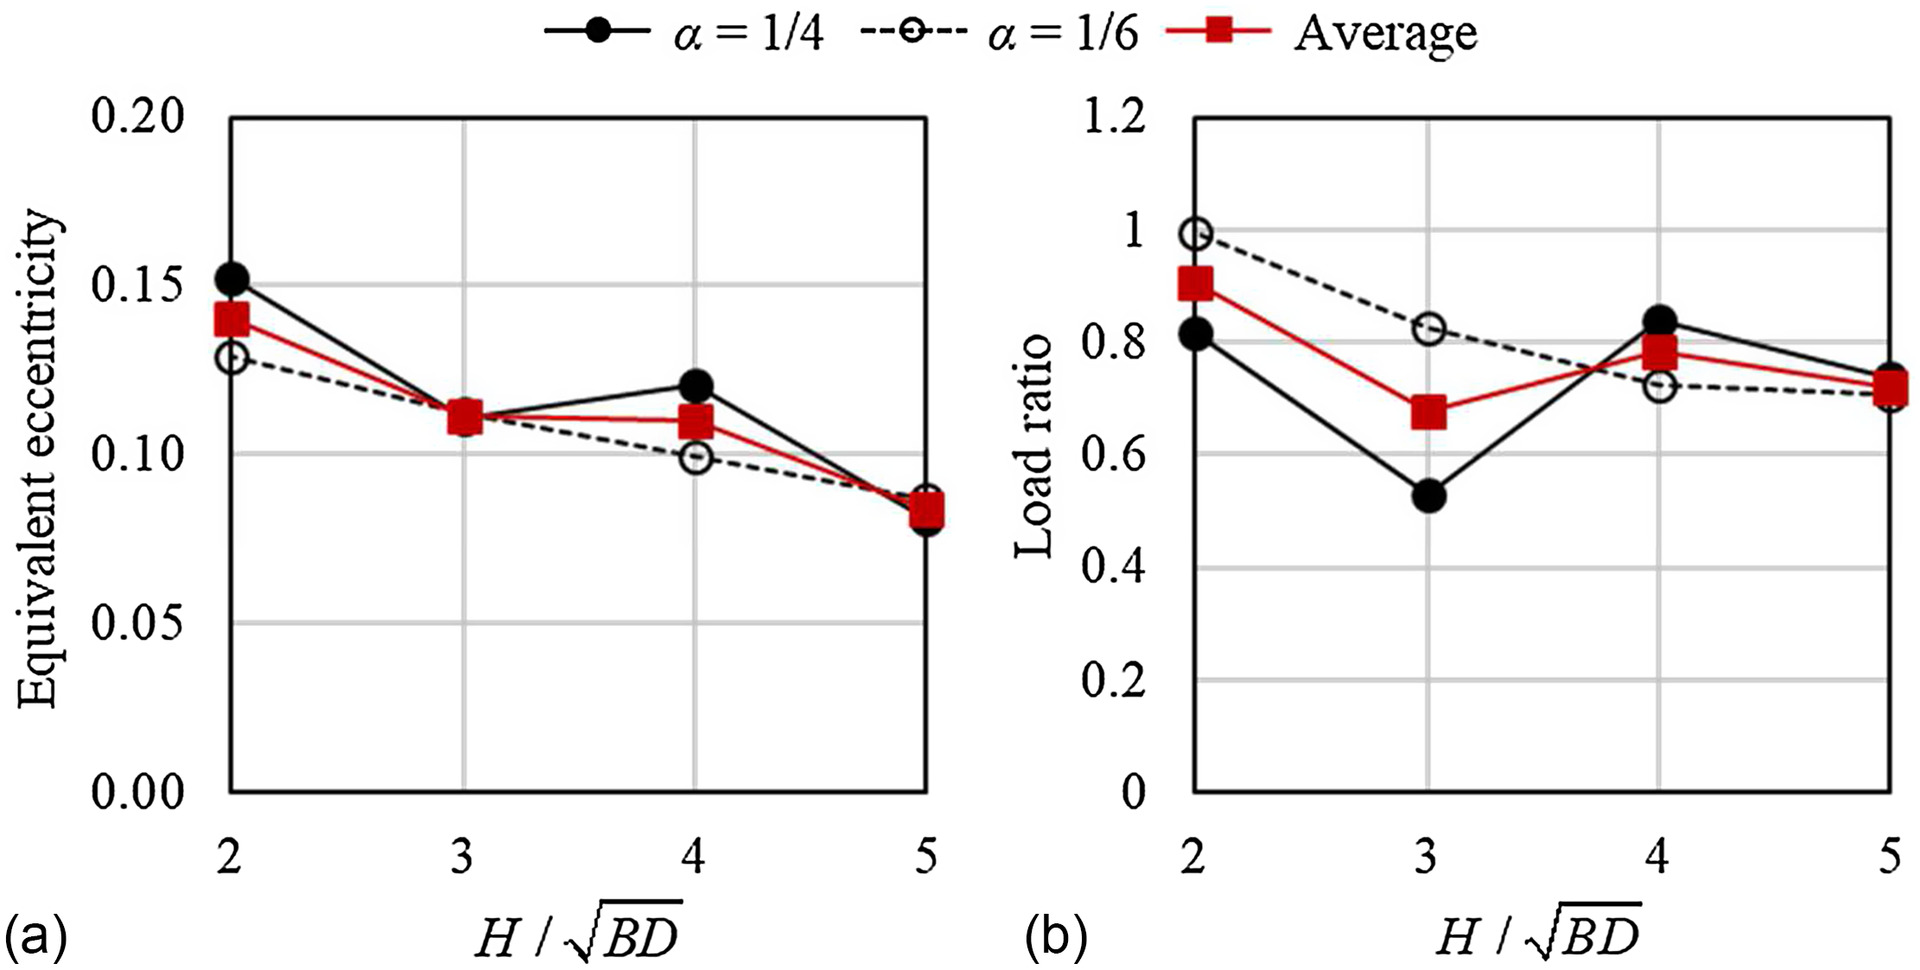
To compare the results based on wind tunnel tests with ASCE 7-22, equivalent eccentricity and load ratio were calculated for buildings with different aspect ratios and for angles of attack of 0°, as shown in Fig.
6. The results show that both equivalent eccentricity and load ratio decrease with increasing building aspect ratio. In general, the value of equivalent eccentricity for
is considerably larger than that which can be attributed to the higher turbulence in comparison with
, but the load ratio for
is less than
. Overall, the average value of equivalent eccentricity is between 0.1 and 0.15, which is comparable to the value of
in ASCE. For load ratio, the average value is between 0.7 and 0.9, which is generally compatible with the load ratio of 0.75 in ASCE.
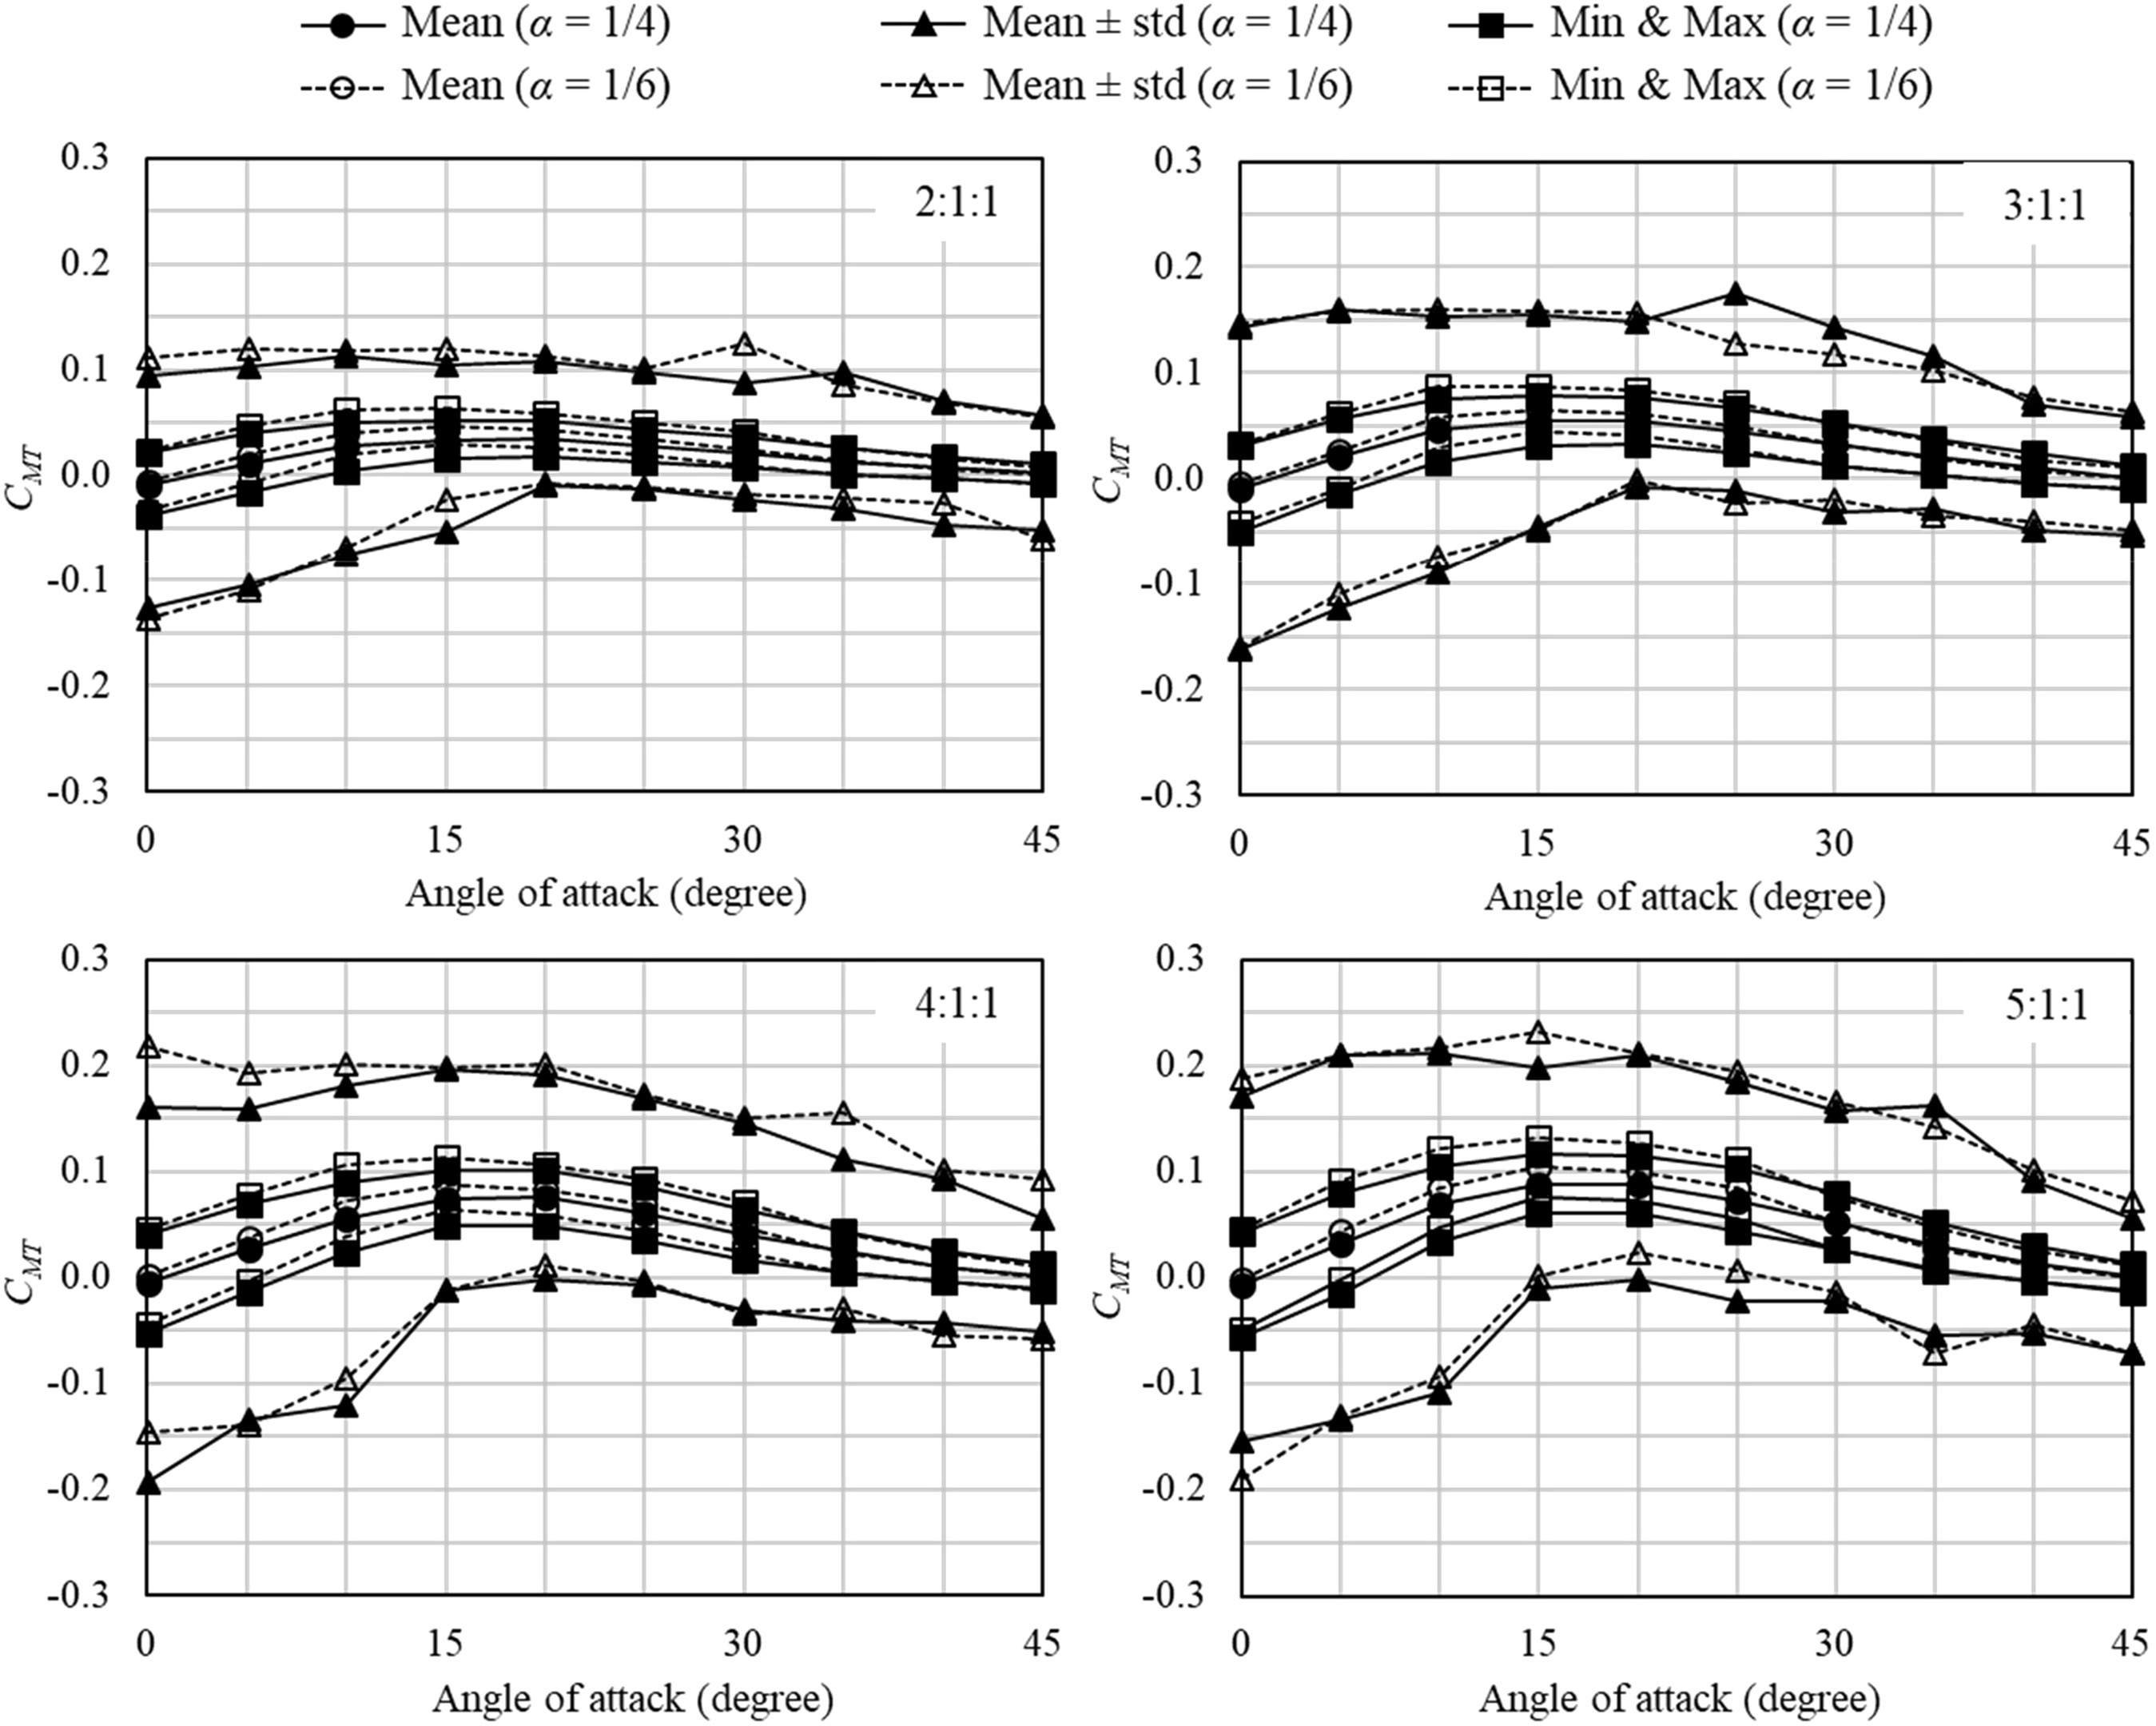
Normalized coefficient of base torsional moment,
(obtained by dividing the component by
), of buildings with different aspect ratio and exposure factor is shown in Fig.
7. According to the figure, the effect of exposure type is not considerable on the values of
, especially for mean and standard deviation. In addition, the mean value is relatively small in comparison with standard deviation and maximum value, and is almost zero in the 0° angle of attack.
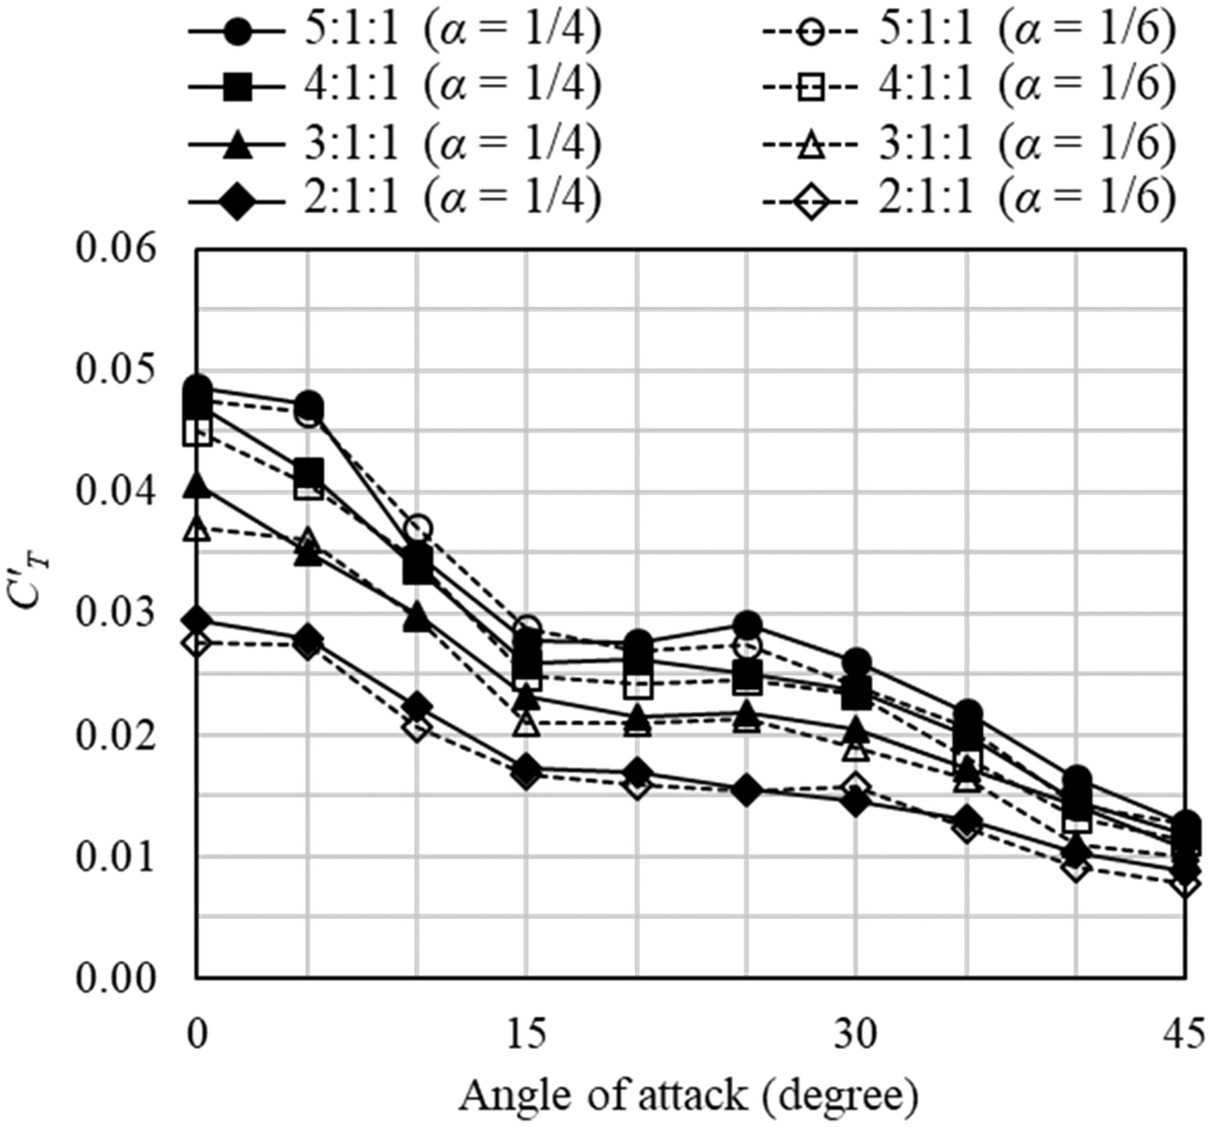
Fig.
8 shows the value of
[
] for the buildings to compare with the listed standards. It can be seen that the value of
for all buildings is maximum at the angle of attack of 0°, and its value decreases by increasing angle of attack. The effect of exposure type is also negligible.
The observations, including negligible value of the mean component and the largest value of at an angle of attack of 0°, and recalling the fact that maximum along- and across-wind loads usually occur at the angle of attack of 0° for square-shape plan, confirm the consistency of the standards with the wind tunnel test results.
According to Fig.
8, the value of
at 0° angle of attack is between 0.03 and 0.05 for buildings with different aspect ratios, whereby increasing the aspect ratio, the difference between the values of
becomes smaller. Note that buildings with an aspect ratio of
are not in the covered range of the listed standards (Table
3). Based on test results, the values of
at 0° angle of attack for buildings with aspect ratios of
,
, and
are 0.037, 0.045, and 0.048, respectively.
The listed standards provide
as a function of plan aspect ratio (
) and independent of building aspect ratio. The value
for the building with
, based on AIJ, is equal to 0.06 and, based on KDS and ISO, is equal to 0.05 (Table
7). Note that the value of ISO is multiplied by 0.6 (the mode shape correction) to be comparable with KDS and AIJ. The value from ISO almost fits with the value from wind tunnel tests for buildings with an aspect ratio of
, while the value from AIJ is about 20% larger.
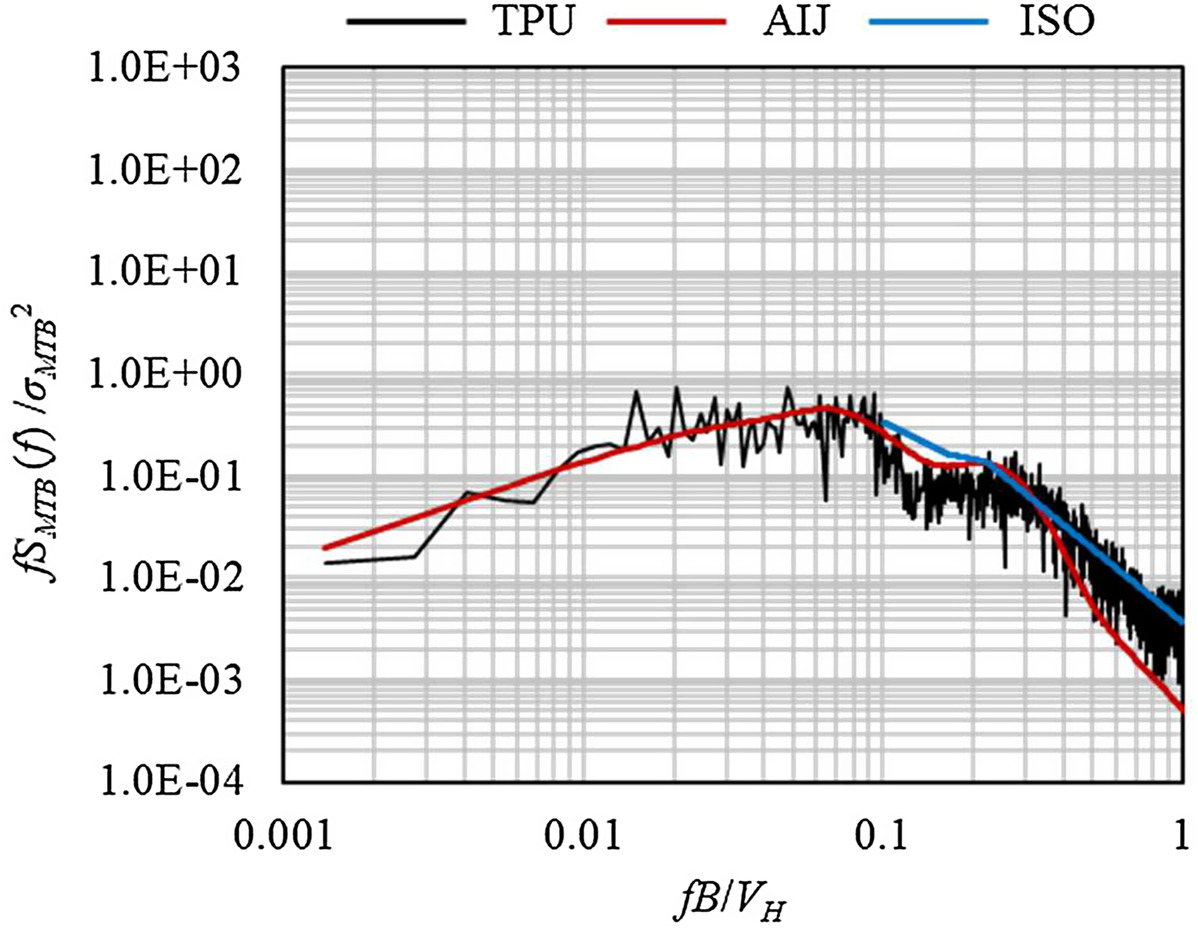
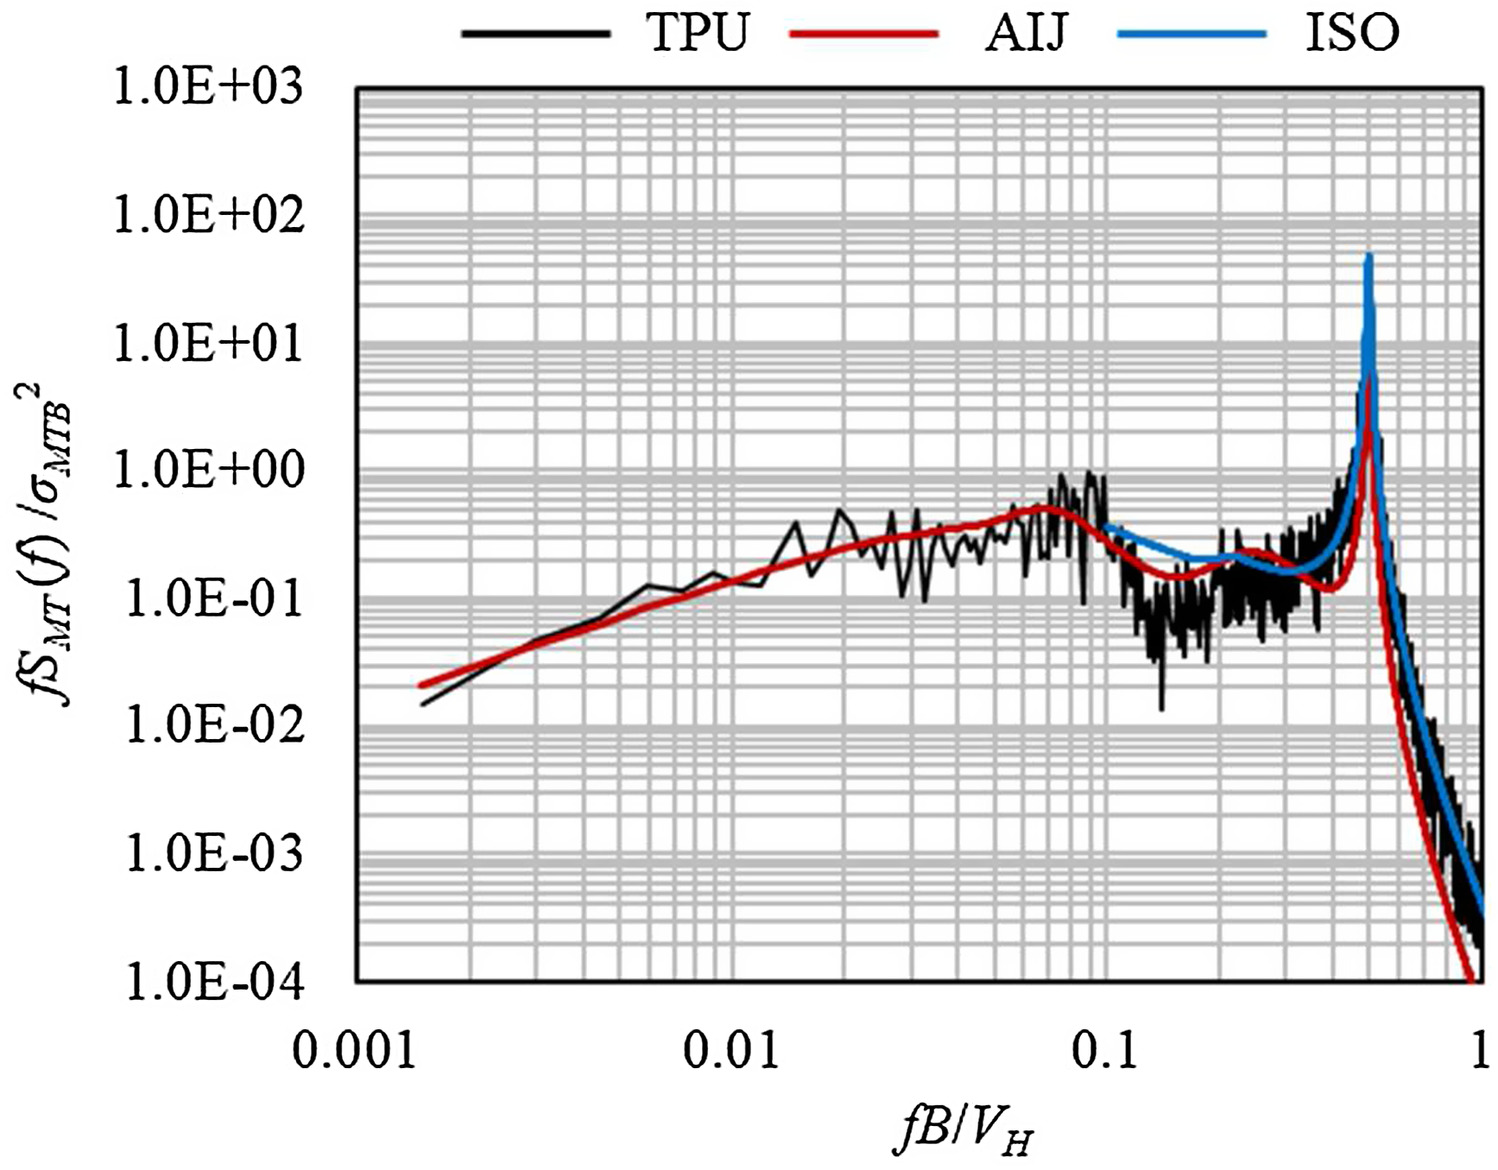
Normalized PSD of base torsional moment,
, of buildings with an aspect ratio of
was calculated based on TPU results and compared with AIJ and ISO, as shown in Fig.
9. Note that the formulation in ISO does not cover the normalized frequency of less than 0.1. The results illustrate a good agreement between the standards and wind tunnel results. However, the model by AIJ can reproduce the step part of the PSD (in the range of normalized frequency between about 0.1 and 0.2) better than ISO. Although it is not depicted here, the results for other buildings show similar consistency.
To compare equivalent static torsional-wind load, the first PSD of torsional response was calculated for buildings 200-m high, exposure C (
), and angle of attack of 0°. Damping ratio,
, and wind speed at building height,
, were assumed to be equal to 1% and
, respectively. The response was calculated for normalized natural frequency of structure,
, in the range of 0.1 to 0.5. Corresponding value of
was calculated and the PSD of torsional response based on wind tunnel results, AIJ, and ISO were obtained as the product of corresponding PSD and mechanical admittance function (Fig.
10). As shown in the figure, the PSD of the response based on the wind tunnel test results is in a good agreement with AIJ and ISO.
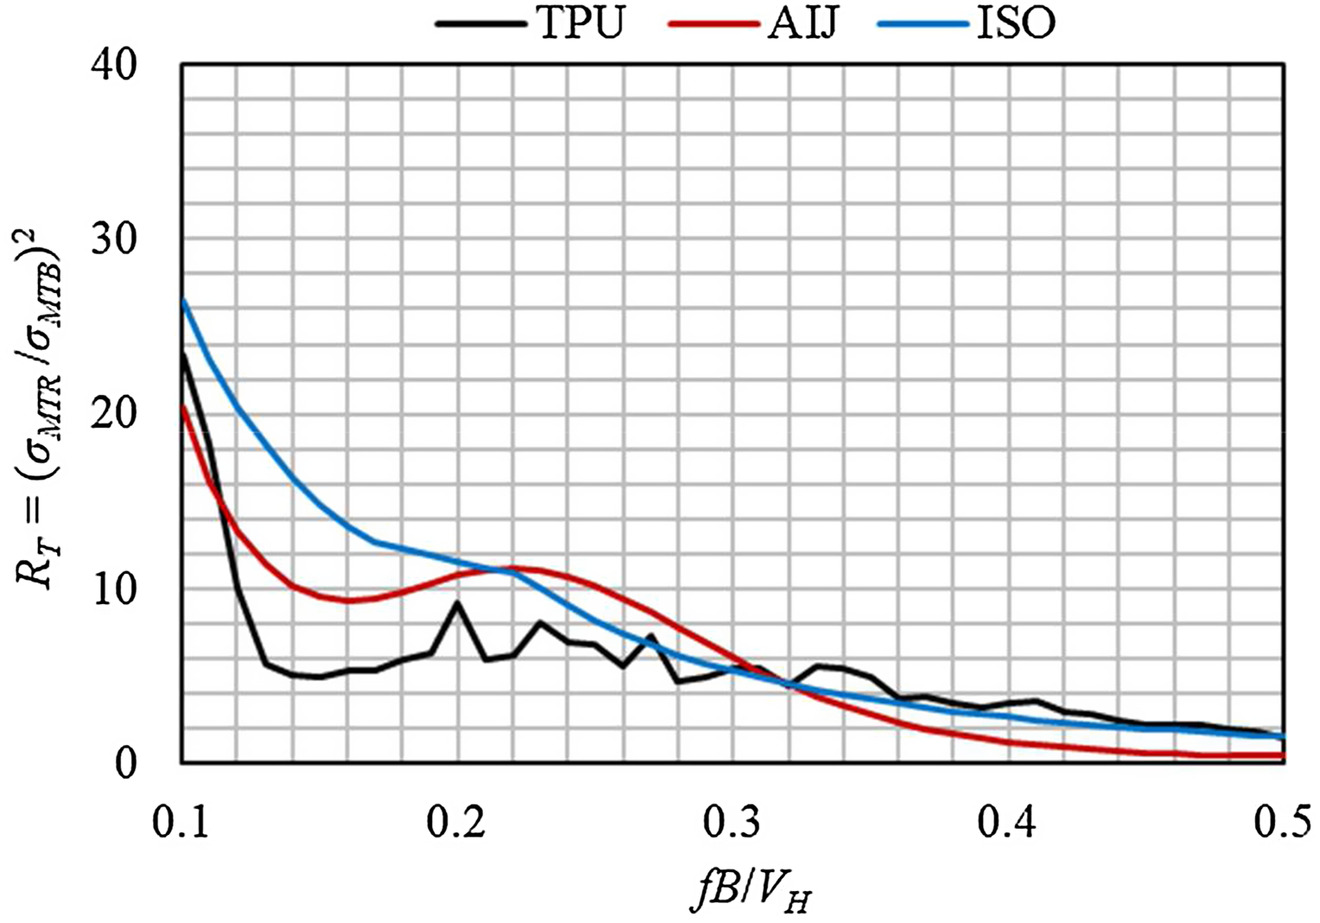
In the next step, the standard deviation of the total response,
, was obtained by integration of the area below the PSD of the response. The standard deviation of resonant response,
, was calculated by extracting background components,
(which is equal to the standard deviation of the base torsional moment obtained from wind tunnel test) from the standard deviation of total response
. Then,
[
] was calculated and compared with the values of AIJ and ISO (refer to Tables
4–6), as shown in Fig.
11. It can be seen that the results from AIJ, ISO, and wind tunnel tests are comparable in most ranges. Values of
based on ISO for normalized frequency of 0.3 and larger match well with wind tunnel test results, and for normalized frequency less than 0.2 are more conservative than TPU. However, the results based on AIJ fit more closely with the trend based on wind tunnel test results, especially for normalized frequencies of 0.3 and less.
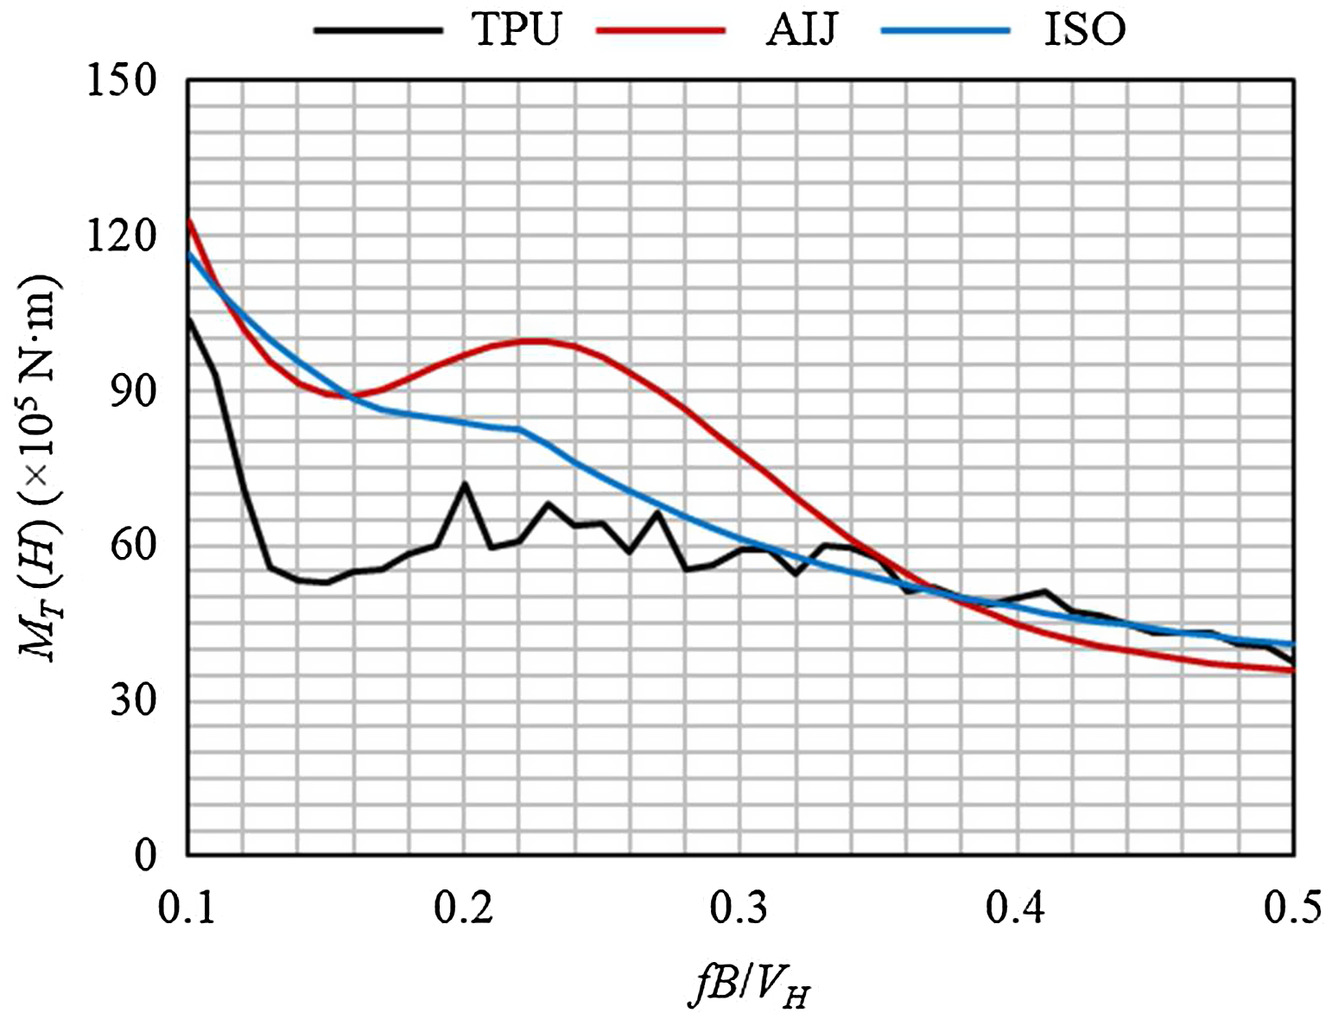
The equivalent static load is a function of both
and
. Therefore, the equivalent static torsional-wind load at building height,
(
), was calculated based on AIJ, ISO, and wind tunnel tests, as shown in Fig.
12.
(
) based on wind tunnel test results was calculated based on Eqs. (
1) and (
4), and
was used to be compatible with AIJ and ISO. Based on the results, for normalized frequencies of about 0.3 and larger, the load calculated from the wind tunnel test is comparable with AIJ and ISO. In addition, the values of AIJ and ISO are very close for normalized frequencies of less than about 0.2. The main reason for differences of AIJ and ISO for the range of 0.2 to 0.3 the different modeling for the step-shape part of the PSD. Overall, the value of both AIJ and ISO is larger than that based on the wind tunnel test for normalized frequencies of less than 0.3 (AIJ is between 20% and 70%, with an average of 50% larger, and ISO is between 2% and 80%, with an average of 34% larger). In addition to general conservatism in estimation of the load in comparison with wind tunnel test results, one reason can be that, based on AIJ, the provision is applicable to the structure with mass-stiffness eccentricity smaller than 0.15.
To evaluate the load case factors, a series of linear time-history analyses have been performed using a single degree of freedom (SDOF) system. For simplification, evaluation was done only for a building with an aspect ratio of . Also, 0° angle of attack was chosen to be consistent with the listed standards. Properties of the SDOF system were defined using generalized mass and mass moment of inertia, stiffness, and damping with assumption of linear mode shape. Damping ratio, , of 1% and 2% were examined as representative values for wind design.
Time-histories were made by dividing the full length of extracted data into five parts (with duration of 600 s in scaled-up time-histories), and ensemble averages were reported. To examine the results for different normalized frequencies (), two approaches can be taken: (1) fix and change , or (2) fix and change . With the change of , time scale and length of time-histories vary. Because the correlation between the applied loads themselves is also important, particularly in higher values of normalized frequency where resonant components are small, it is crucial to avoid overlapping between the parts. For this reason, was fixed to preserve the inherent correlation between the applied loads themselves. Recalling the values of length scale and duration of measurement, a value of was chosen for , at which the total time of five time series is almost equal to the total length of available data.
In addition to the values of natural frequencies, the studies by Somekawa et al. (
2014) and Jeong and Kang (
2021) showed that the ratio of frequencies is also important to calculate load case factors. They examined different cases of ratio of frequencies (in the range of 1 to 1.5), and found that if the frequencies are not equal (even for ratio of frequencies equal to 1.1), the load case factors can be significantly smaller than the case with equal frequencies. In contrast to ISO, the combination factors for directional load in AIJ are provided based on the frequency ratio (refer to Tables
9 and
10). SDOF systems were investigated with respect to natural frequencies, including natural frequency ratios of (
) and (
) as representative of cases with equal and nonequal frequencies.
Normalized frequencies were set in the range of 0.1 to 0.5 with an increment of 0.01, and for each value a set of five analyses for along-, across-, and torsional-wind directions were performed for two natural frequency ratios and two damping ratios. Because the values of () and (40 m) were constant, natural frequency was defined by manipulating corresponding normalized frequency and associated stiffness and damping coefficient of the SDOF system.
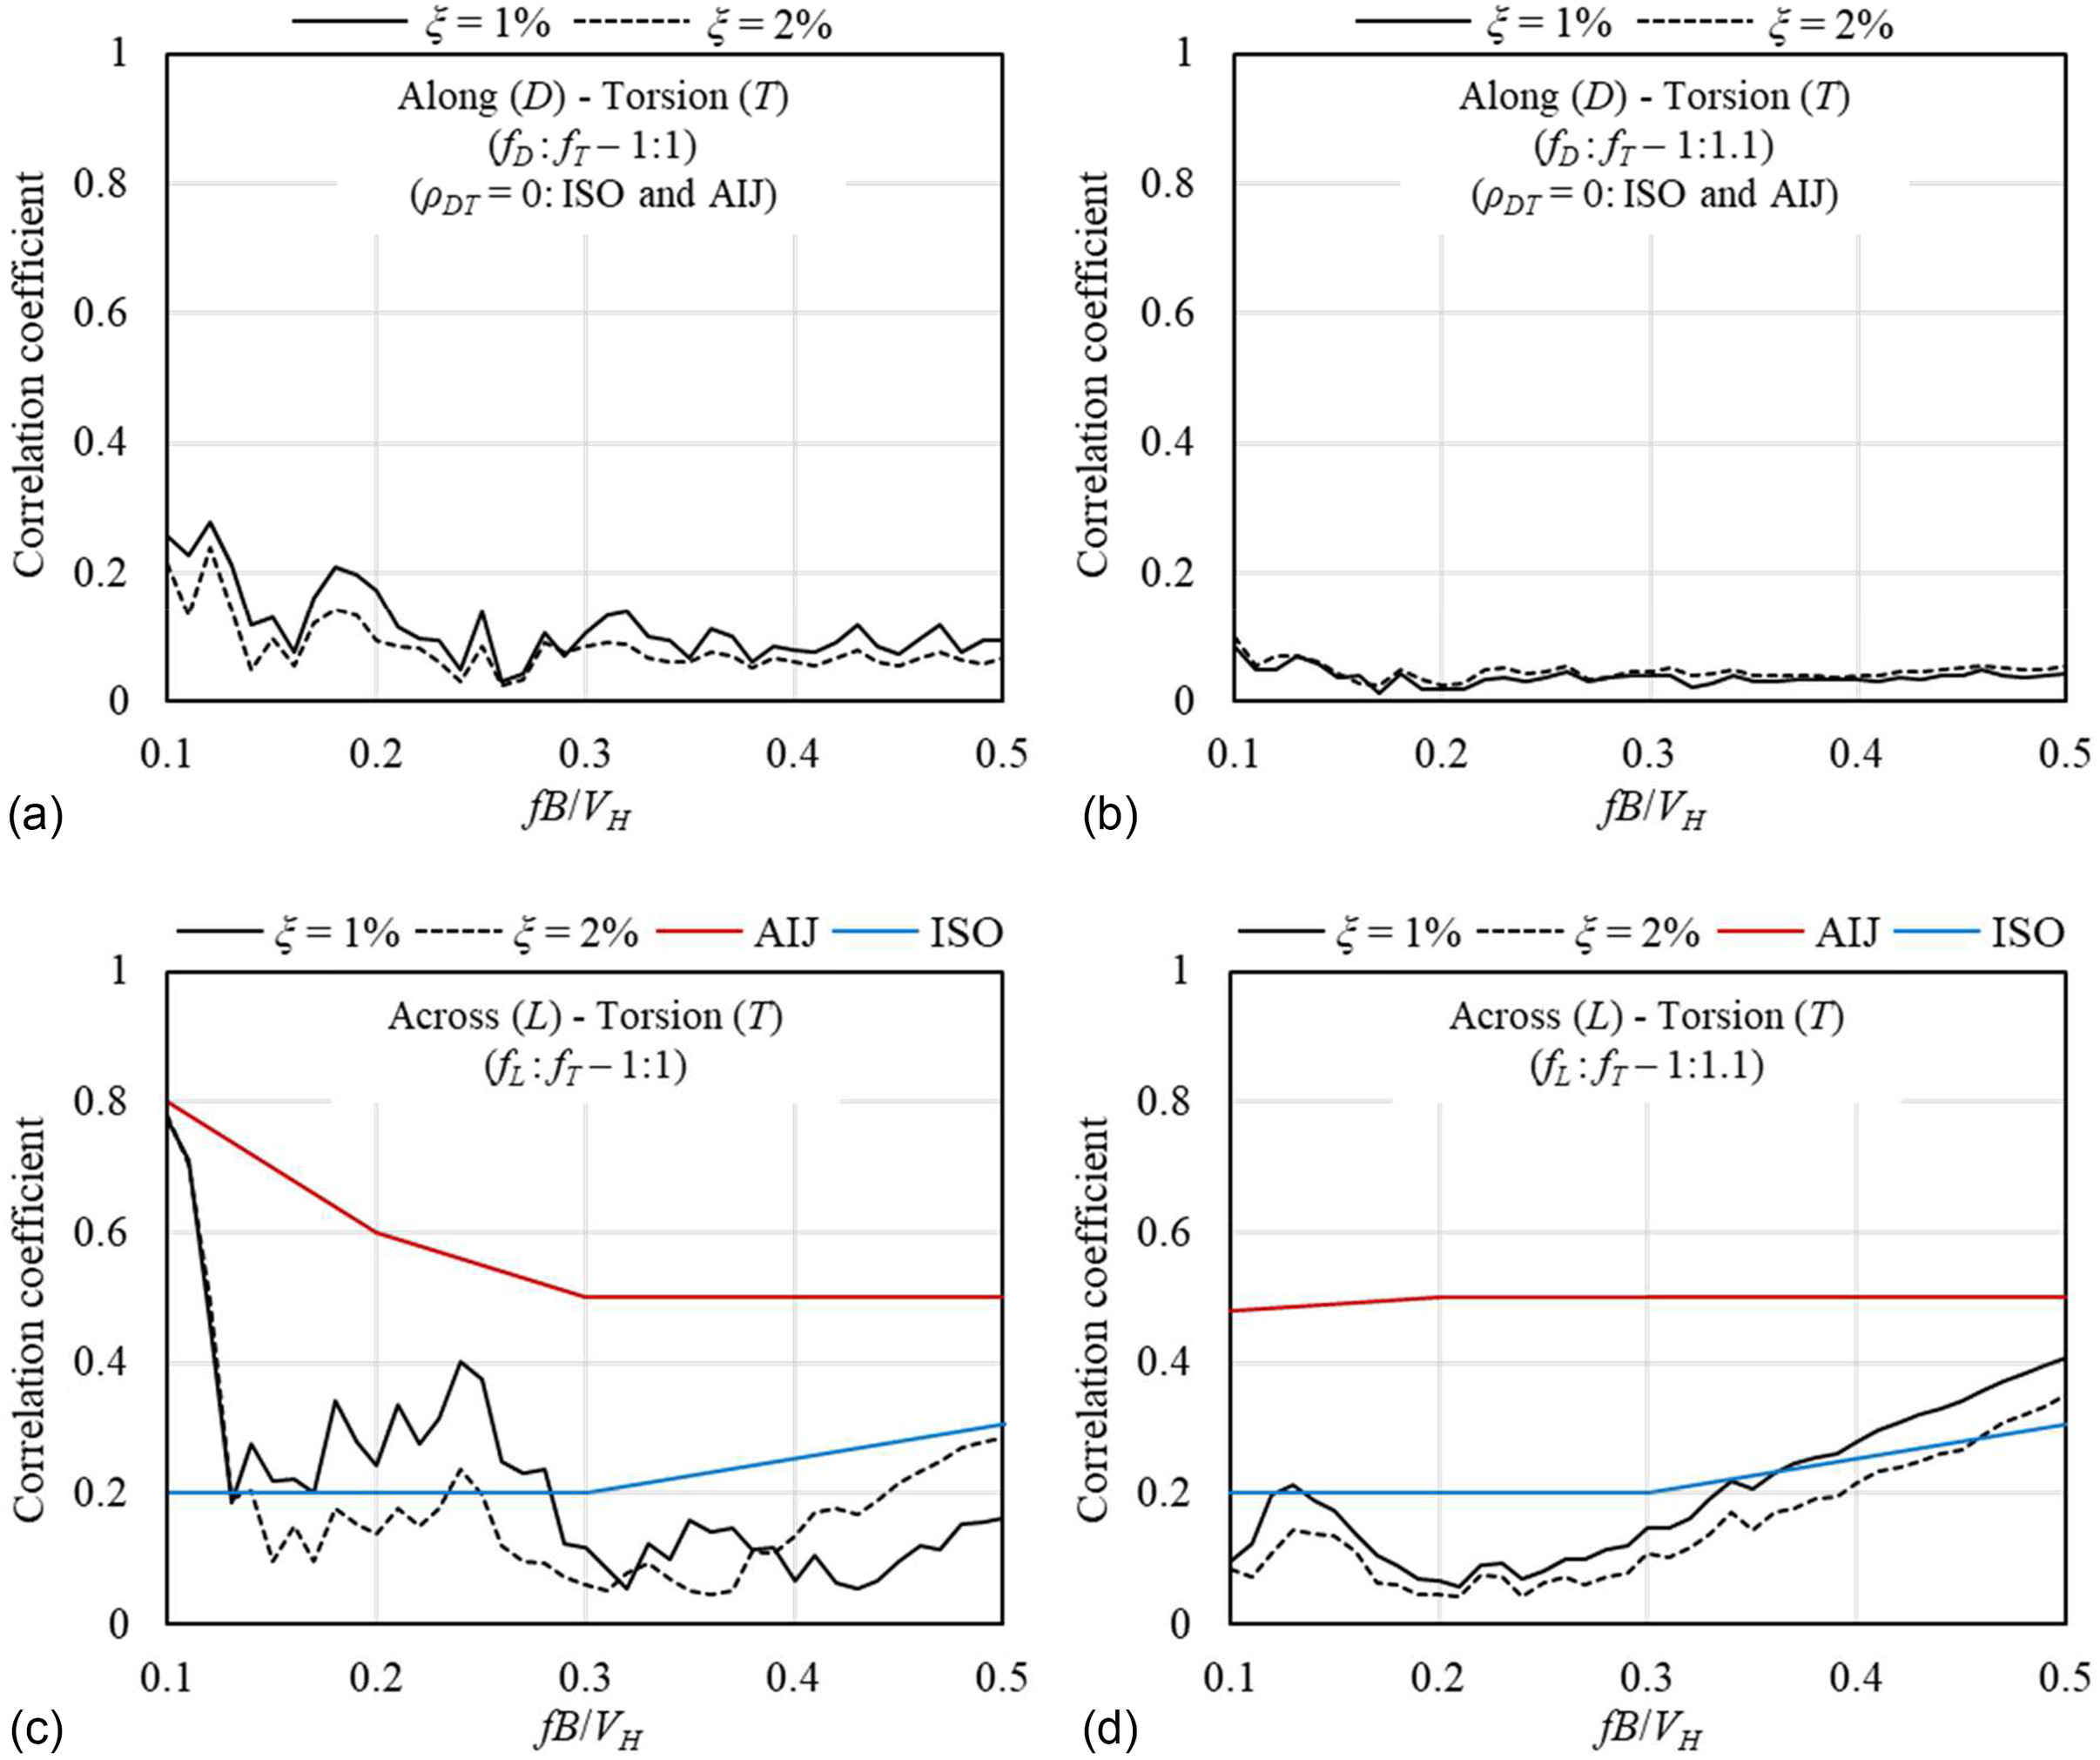
Absolute values of correlation coefficient between the fluctuation components of responses for along- and torsional-wind directions and across- and torsional-wind directions are shown in Fig.
13. It can be seen that the correlation coefficient between along- and torsional-wind responses,
, is very small in all ranges of normalized frequencies and for both cases of (
) and (
). Therefore, it is logical to assume that along- and torsional-wind responses are uncorrelated.
For the case of (), the correlation coefficient between across- and torsional-wind responses, , is very large at a small normalized frequency around 0.1, and decreases by increasing the normalized frequency. For the case of (), there is no large correlation at small normalized frequencies. At higher normalized frequency of about 0.3 or larger, increases for both cases of () and (). Because the resonant component of responses is smaller at higher normalized frequency, large values of are due to the correlation between across- and torsional-wind loads itself rather than the responses. According to the results, the values provided by ISO are close to the average value of correlation coefficients in the examined range of normalized frequency, and the values provided by AIJ are based on an envelope to the analysis results with some degree of conservatism. For the case of () at smaller values of normalized frequency, the correlation coefficients provided by AIJ fit better with the analysis results than those provided by ISO. For the case of (), large values of at small normalized frequency are not observed. These observations imply that, with a little difference between the natural frequencies, the correlation coefficient is very small for small normalized frequency.
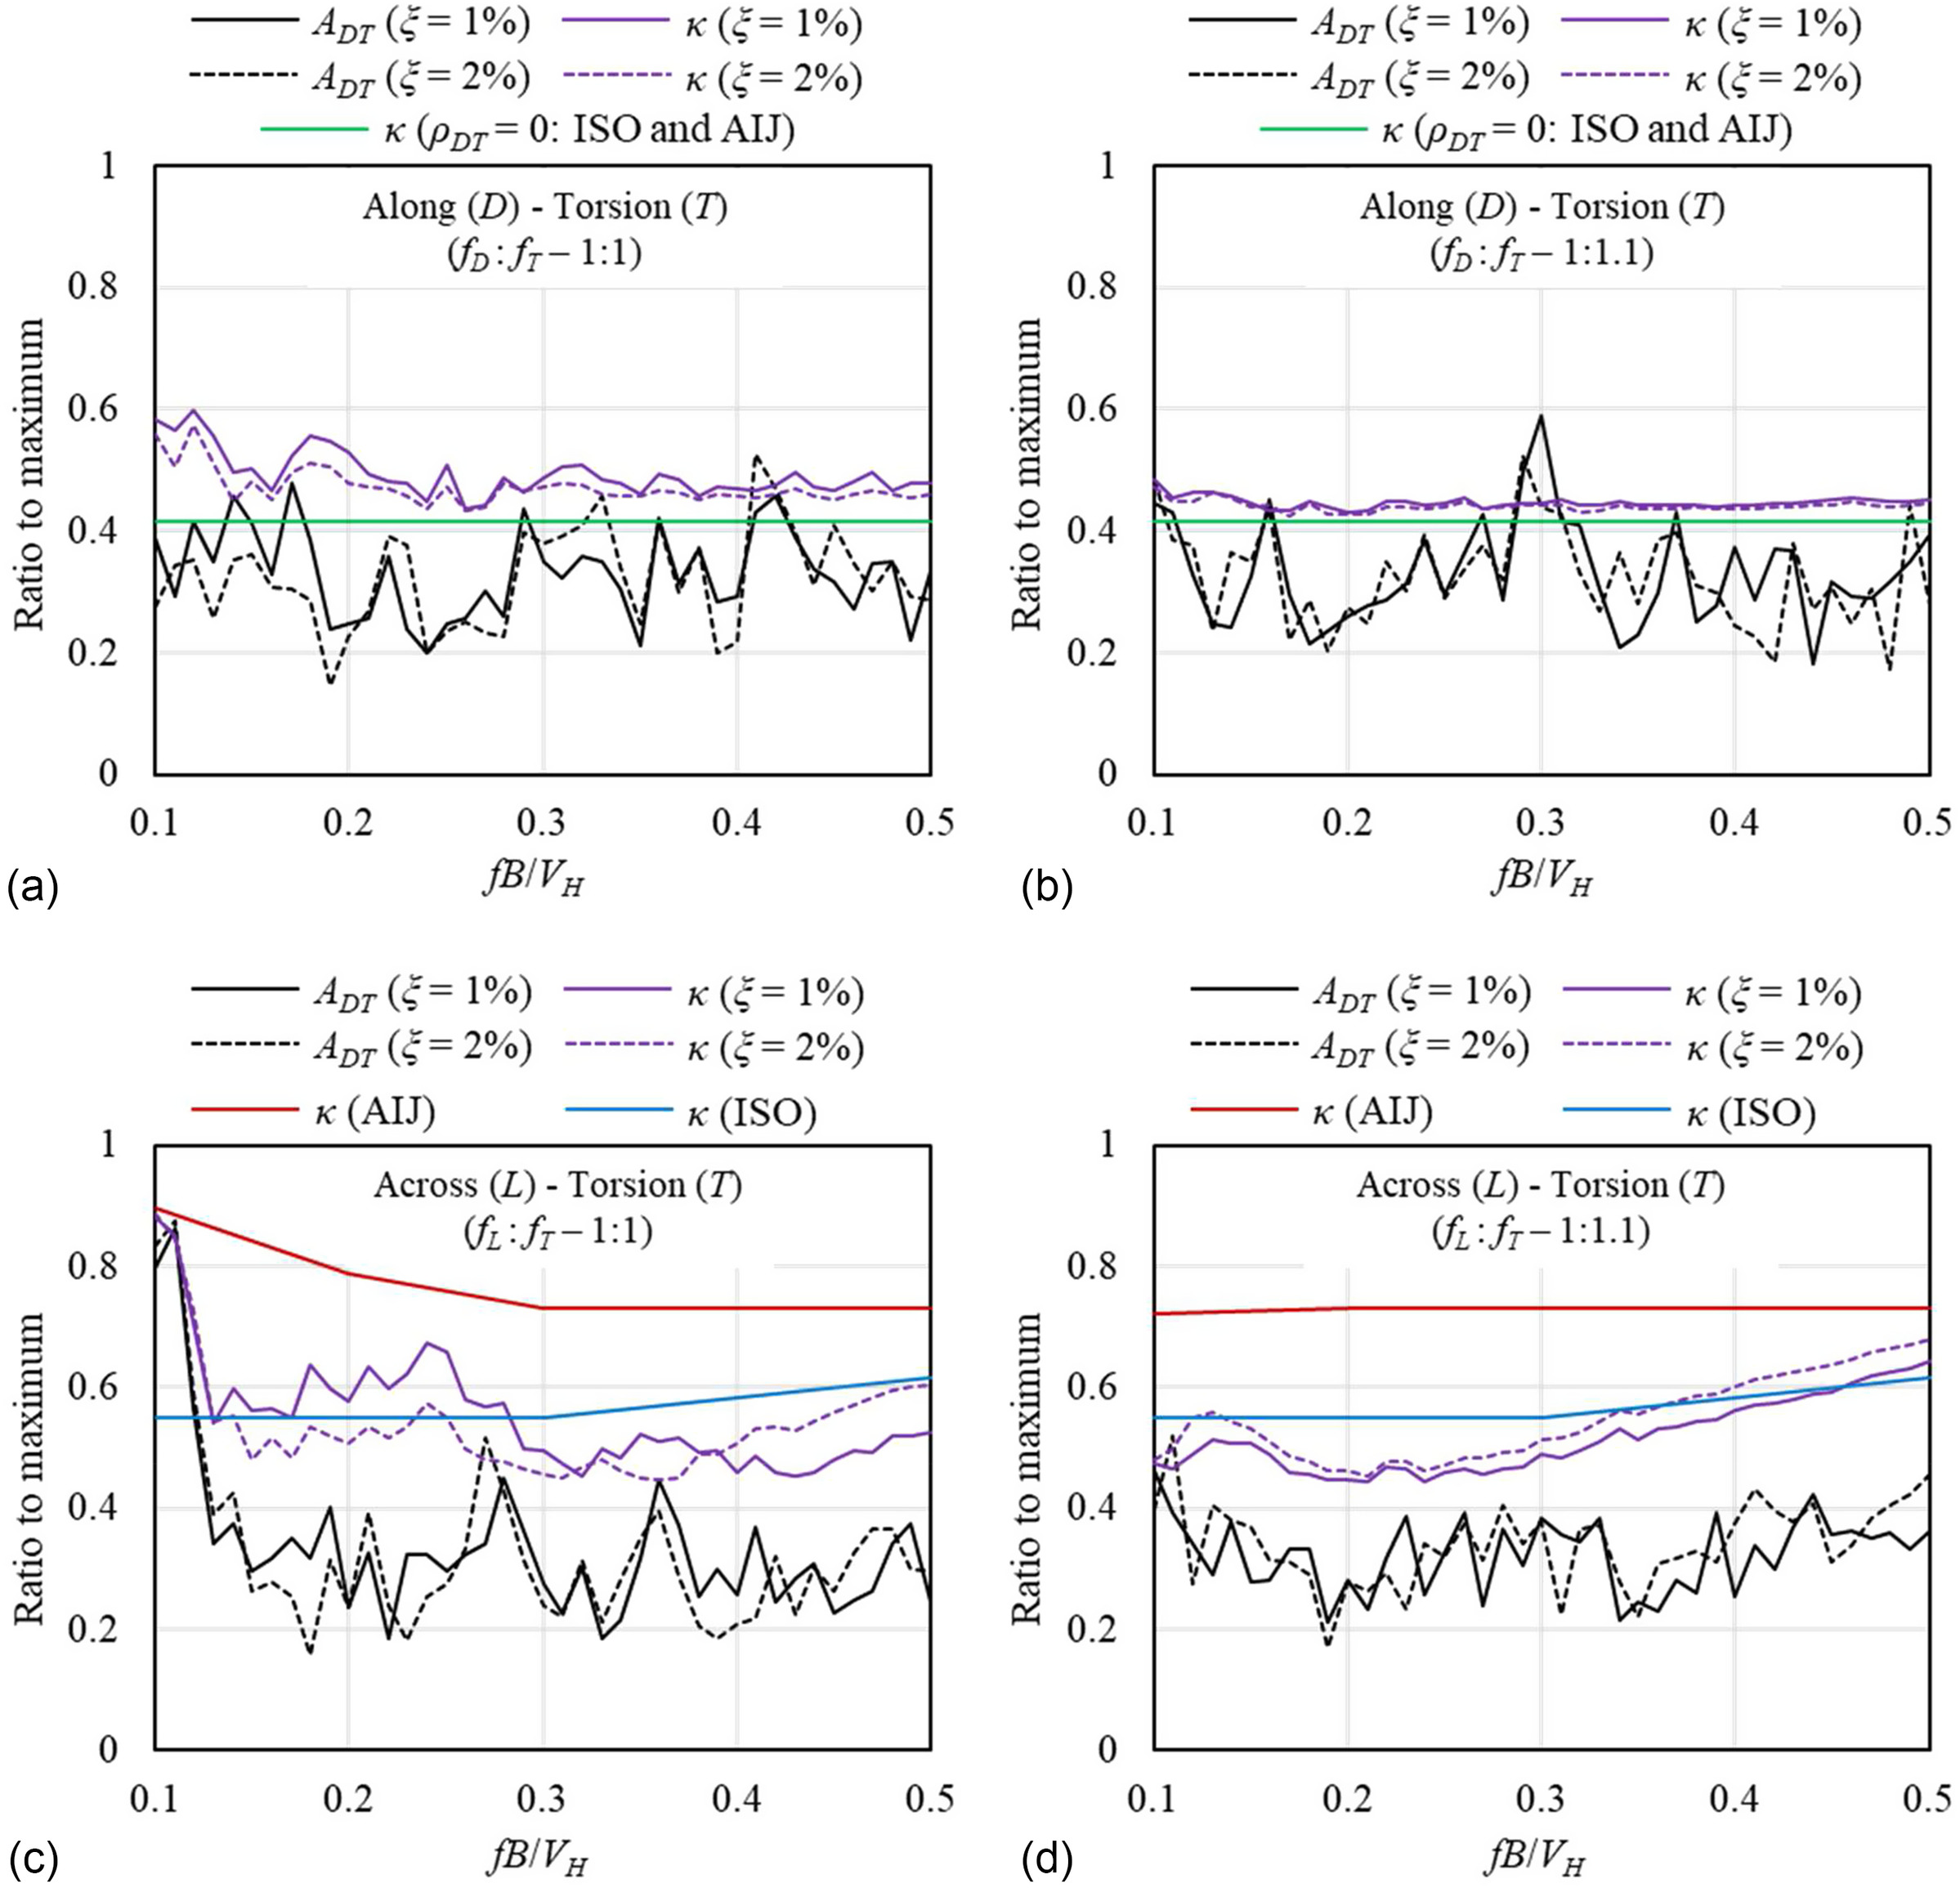
In the next step, the value of a component when the other component is the maximum was extracted from the results of time-history analysis, and scaled by the maximum value of that time-history (i.e.,
). Ensemble average of these ratios was calculated for each set of five time-histories, and is denoted by
(ratio to the maximum). Here,
and
are
for along-wind,
for across-wind, and
for torsional-wind (for instance,
is equal to
). It is worth mentioning that for every two components, two cases including
and
can be calculated, and the maximum of two is shown in Fig.
14. Additionally, values of
based on correlation coefficients shown in Fig.
13, uncorrelated cases for along-wind and torsional-wind (
, similar to the assumption of ISO and AIJ), and the provided values of ISO and AIJ for across-wind and torsional-wind are calculated and shown in Fig.
14.
It can be seen that values of for the exact value of and for are very close, especially for (). The values of and are well matched in all the ranges of normalized frequencies. Thus, the value of 0.4 for in AIJ and ISO, with the assumption that along-wind and torsional-wind responses are uncorrelated, seems logical.
As shown in Fig.
14, the value of
based on wind tunnel tests is matched with that based on AIJ and ISO, except for the small normalized frequency around 0.1 where the underestimation by ISO is quite large. However, for the case with (
), the accuracy is higher and the values are closer. It is worth mentioning that natural frequency of tall buildings in translational and torsional modes are usually different in practice, and thus the application of the case with (
) is limited.