Utah Is Not the Second-Driest State: A Lesson in Questioning Persistent Assumptions about Hydrology
Publication: Journal of Hydrologic Engineering
Volume 29, Issue 1
Abstract
Forum papers are thought-provoking opinion pieces or essays founded in fact, sometimes containing speculation, on a civil engineering topic of general interest and relevance to the readership of the journal. The views expressed in this Forum article do not necessarily reflect the views of ASCE or the Editorial Board of the journal.
Introduction
Ever since I entered the water profession and began practicing in Utah about 15 years ago, I have repeatedly heard that “Utah is the second-driest state in the country.” The statement is arresting and plausible given how little precipitation we get, and it has been long propagated by state agencies, water managers, researchers, and the media to advocate prudent water management among the state’s 3.3 million residents.
Although I agree with the intent of the statement, I take issue with it for two reasons. The first is minor: as I will show, Utah is actually the third-driest state in terms of precipitation (which still makes it very dry and very much in need of prudent water management). The second is far more important: why has a readily verifiable hydrologic fact persisted in error, especially among its own stakeholders, and what else that we think we know about hydrology is wrong?
Is It an Unfounded Assumption?
Despite diligent research into published material and conversations with state water experts, I am not sure where the second-driest phenomenon started or why Utahns have latched on to it so firmly. I would almost call it suspicious, save for all the good it has done in raising awareness about our precious water resources, especially against the backdrop of an exceptional regional drought (Wheeler et al. 2022; Abbott et al. 2023) and the fastest urban growth in the country (Associated Press 2021). Table 1 presents a sample of such language from various groups, appearing in everything from websites to master’s theses to the title of one community’s water conservation plan. These organizations have done great work for Utah’s water community, so my purpose is not to criticize them but to demonstrate just how common the phrase has become as a starting point for water research, management, and policy.
| Statement | References |
|---|---|
| “Utah is the second driest state and any development in the state divides the already limited water supply.” | Utah Division of Emergency Management (2019) |
| “As many Utahns know, we live in the second driest of the fifty United States, receiving only 19.5 average inches [49.5 cm] of precipitation state-wide per year.” | Weber Basin Water Conservancy District (n.d.) |
| “Water is one of the most important resources we have in the State of Utah, and also one of the most limited. Utah is the second driest state in the country.” | City of Saratoga Springs (n.d.) |
| “Utah is the second driest state in the nation and is one of the fastest growing. … The need to conserve water and reduce our per capita water use will be imperative in meeting the state’s future water needs.” | City of Bluffdale (n.d.) |
| “Utah Water Conservation: A Guide to Mindful Water Use in the Nation’s Second Driest State” | City of Millcreek (2021) |
| “Within Utah, the second driest state in the US, the declining trend of groundwater levels exacerbated by rapid growth of urban population and associated water withdrawal is already a concern for water managers and users.” | Hakala (2014) |
| “Utah is the second driest state in the nation, while per capita water use is near the highest in the nation.” | Null (2018) |
| “Utah is the second driest state in the US and also one of the fastest growing …. As a result, balancing water supply with population growth has been a critical, intensifying challenge.” | Stock et al. (2019) |
| “Utah is the second driest state in the United States, with average yearly precipitation of 33.9 cm (13.34 in.)” | Drugova et al. (2021) |
| “Utah is the second driest state in the nation, and over the past few years, our temperatures continue to warm.” | Poulson (2021) |
| “Utah is the second most arid state in the nation, and as temperatures increase, we can expect less snow at the end of each winter, with runoff occurring at a faster pace.” | Utah Rivers Council (n.d.) |
Given the consistency with which I and other Utah colleagues have encountered “second driest” in our careers, I figure that the saying has been circulating for decades. The statements never cite any source or data set or method; apparently Utah’s second-place position is so obvious it needs no citation. If it had any basis to begin with, it has been lost and is now nothing more than an assumption, and a long-held one at that. Perhaps it is one of those things that, if repeated enough, people will eventually believe.
A couple personal examples will illustrate how inveterate the phrase is. In 2019, I was part of a team consulting the Utah Division of Water Resources (2019) on new water conservation goals. Discussion about Utah’s position as the second-driest state frequently came up, but try as we might, we could not find any supporting data. As a project team, we agreed to stop saying it and to strike any such language from our report. In 2020, the phrase surfaced in a proposed bill amending the state water policy and, had it not been for a comment I submitted about it during the legislative session, I think the erroneous ranking would have been immortalized in statute. It now reads “Utah is one of the most arid states,” and the correction appears in Line 36 of the official record (Utah State Legislature 2020).
So Where Does Utah Rank?
Now, to settle the matter of the driest states (at least for the time being, until the changing climate says otherwise), let us consider the data.
As the comments in Table 1 suggest, rankings about driest states might be based on long-term average precipitation within the state boundaries, which is easy to both understand and verify. Short-term measures like annual precipitation do not adequately describe long-term climate, per-capita water supply is not consistently reported among states, streamflow is a tangible but data-intensive indicator, and more complex measures like the Palmer Drought Severity Index are not readily grasped by the public. Precipitation, like groundwater and streams, does not respect political boundaries, and a purist might argue that a watershed-based characterization of dryness, such as streamflow trends, is more accurate than a state-by-state comparison. So for communicating climate to the public, which is the intention driving the statements in Table 1 in the first place, precipitation within state lines will have to do.
The National Oceanic and Atmospheric Administration (NOAA) serves up statewide precipitation averages in its Climate at a Glance tool (NOAA 2022). The data originate in the US Climate Divisional Database (NClimDiv) (Vose et al. 2014a, b), which consists of observations taken from individual weather stations, interpolated and bias-corrected into a 5-km grid, and aggregated to various regions, including states. In climatology, the standard is 30-year normals, computed in decadal installments (Arguez and Vose 2011; Arguez et al. 2012).
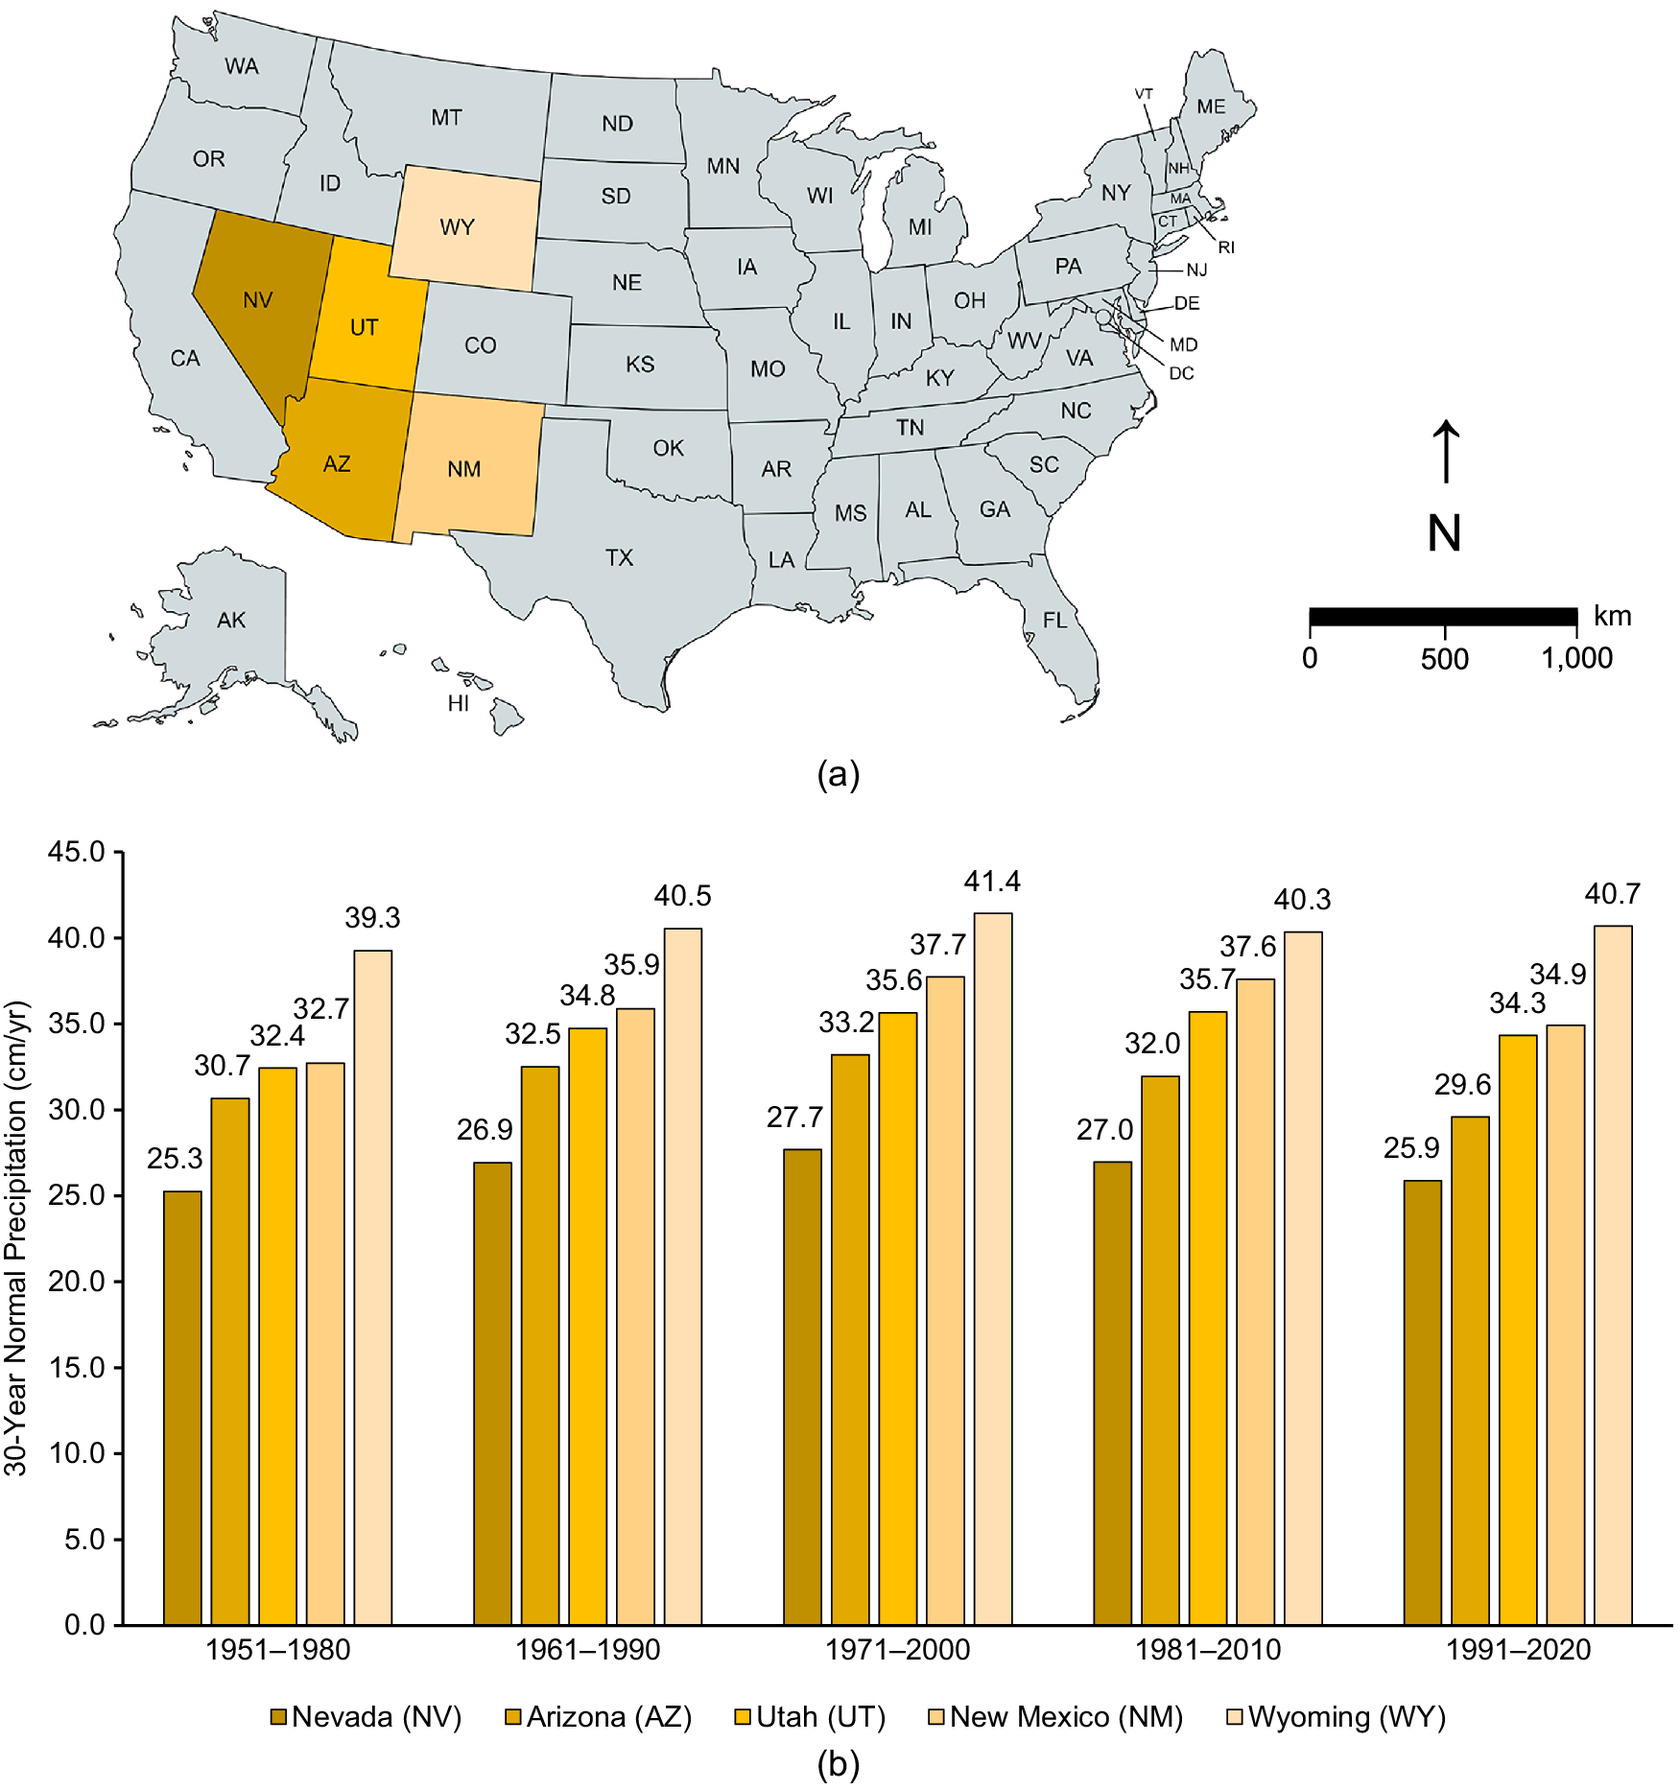
From this data set, 30-year average precipitation for the last five periods consistently shows the driest states to be Nevada (NV), Arizona (AZ), Utah (UT), New Mexico (NM), and Wyoming (WY), in that order [Fig. 1(a)]. Gridded 30-year precipitation normals from Oregon State University’s PRISM Climate Group (2021) confirm the rankings for 1991–2020. By this measure, Utah is the third-driest state and has been for a while.
Using the same NOAA data and expanding the analysis to consider annual precipitation in all 50 states in each of the 30 years from 1991 to 2020 offers some nuance for the recent rankings. Table 2 presents data from the five states in question. The driest state was most frequently Nevada (21 years); second driest was Arizona (17 years); third driest was Utah (10 years); fourth driest was also Utah (14 years); and the fifth driest was Wyoming (16 years). Stated differently, Utah’s most common rank was fourth driest (14 years), then third driest (10 years), then second and fifth driest (3 years each). The average rankings during this time were Nevada, 1.4; Arizona, 2.3; Utah, 3.6; New Mexico, 3.9; and Wyoming, 5.1. By this analysis, Utah is again third (or fourth!), but rarely second.
| Rank | Nevada | Arizona | Utah | New Mexico | Wyoming |
|---|---|---|---|---|---|
| Driest | 21 | 5 | 0 | 4 | 0 |
| Second driest | 7 | 17 | 3 | 2 | 0 |
| Third driest | 2 | 6 | 10 | 7 | 2 |
| Fourth driest | 0 | 1 | 14 | 6 | 4 |
| Fifth driest | 0 | 0 | 3 | 5 | 16 |
| Average rank | 1.4 | 2.3 | 3.6 | 3.9 | 5.1 |
Note: Only 5 of 50 states shown; years may not add up to 30.
To be fair, I did find one alternative data set suggesting Utah is the second-driest state. It was posted by the Western Regional Climate Center (n.d.) and refers to the Historical Climatology Series, a now apparently retired NOAA program whose original precipitation report I could not locate. Without being able to verify its origins, I stand by the data in Fig. 1(b).
Hydrology always has some uncertainty. Examining Fig. 1(b), I concede that in some periods the second and third places are close. Still, given the data, I think we may comfortably conclude that Utah is not the second-driest state after all. I suppose it could be the second-driest state by some alternative precipitation data set or by some other long-term metric besides average precipitation that everyone has meant all along. If so, then by all means, show me the source—and then please cite it when you make your claim to others.
What Else Have We Missed?
Regardless of Utah’s exact rank among the driest US states, my point is that an erroneous hydrologic “fact” seems for decades to have been perpetuated—and widely accepted—by its own stakeholders, with little basis and few questions. Whether Utah is second or third driest makes little difference in water messaging or water management, so in this case the consequences are probably benign.
But the thought should make us pause. What else that we think we know about hydrology is actually wrong? What facts are we not verifying because we have used them for so long? What are we assuming without questioning and leading the public to believe? What unintended consequences are we overlooking (Sowby and Hotchkiss 2022)?
In the interest of advancing the field, we should occasionally reexamine “the many hypotheses that have become standard and have not been sufficiently challenged” (Di Baldassarre et al. 2016). Questioning assumptions and seeking authoritative evidence are still fundamental scientific practices for any research or engineering activity, even when the facts seem obvious. Conditions change, new information arises, and people make mistakes, so we must always be seeking new knowledge.
Data Availability Statement
All data, models, or code generated or used during the study are available from the corresponding author by request.
References
Abbott, B. W., B. K. Baxter, K. Busche, L. de Freitas, R. Frei, R. T. Gomez, and M. A. Karren. 2023. Emergency measures needed to rescue Great Salt Lake from ongoing collapse. Provo, UT: Brigham Young Univ.
Arguez, A., I. Durre, S. Applequist, R. S. Vose, M. F. Squires, X. Yin, R. R. T. W. HeimOwen Jr., and T. W. Owen. 2012. “NOAA’s 1981–2010 US climate normals: An overview.” Bull. Am. Met. Soc. 93 (11): 1687–1697. https://doi.org/10.1175/BAMS-D-11-00197.1.
Arguez, A., and R. S. Vose. 2011. “The definition of the standard WMO climate normal: The key to deriving alternative climate normal.” Bull. Am. Met. Soc. 92 (6): 699–704. https://doi.org/10.1175/2010BAMS2955.1.
Associated Press. 2021. “Utah has fastest-growing population, 2020 census shows.” Accessed August 9, 2022. https://apnews.com/article/560c4f5406724b83a81efe56b1011616.
City of Bluffdale. n.d. “Water conservation.” Accessed August 18, 2022. https://www.bluffdale.com/326/Water-Conservation.
City of Millcreek. 2021. “Utah water conservation: A guide to mindful water use in the nation’s second driest state.” Accessed August 18, 2022. https://millcreek.us/DocumentCenter/View/2331/Water-Conservation-Guide.
City of Saratoga Springs. n.d. “Water conservation.” Accessed August 18, 2022. https://www.saratogaspringscity.com/369/Water-Conservation.
Di Baldassarre, G., L. Brandimarte, and K. Beven. 2016. “The seventh facet of uncertainty: Wrong assumptions, unknowns and surprises in the dynamics of human–water systems.” Hyd. Sci. J. 61 (9): 1748–1758. https://doi.org/10.1080/02626667.2015.1091460.
Drugova, T., K. Curtis, and M.-K. Kim. 2021. “Economic impacts of drought in Utah: Uintah and Ouray reservation.” Accessed August 18, 2022. https://extension.usu.edu/drought/research/economic-impacts-of-drought-in-utah-uintah-and-ouray-reservation.
Hakala, K. A. 2014. Climate forcings on groundwater variations in Utah and the Great Basin. Logan, UT: Utah State Univ.
NOAA (National Oceanic and Atmospheric Administration). 2022. “Climate at a glance: Statewide time series.” Accessed August 18, 2022. https://www.ncei.noaa.gov/cag/statewide/time-series/42/pcp/12/12/1991-2020?base_prd=true&begbaseyear=1991&endbaseyear=2020.
Null, S. E. 2018. Economic water demand functions to value urban water scarcity along Utah’s Wasatch front. Logan, UT: Utah State Univ.
Poulson, S. 2021. “Preserving water: How Utah will combat the drought.” Accessed August 18, 2022. https://kutv.com/news/local/preserving-water-how-utah-will-combat-the-drought.
PRISM Climate Group. 2021. “30-Year normal.” Accessed August 16, 2022. https://prism.oregonstate.edu/normals/.
Sowby, R. B., and R. H. Hotchkiss. 2022. “Minimizing unintended consequences of water resources decisions.” J. Water Resour. Plann. Manage. 148 (11): 02522007. https://doi.org/10.1061/(ASCE)WR.1943-5452.0001623.
Stock, M., L. N. Allen, S. B. Jones, and S. Pyakurel. 2019. “Balancing irrigator demand with conservation through physics and extension.” In Proc., AGU Fall Meeting Abstracts H34H-01. Washington, DC: American Geophysical Union.
Utah Division of Emergency Management. 2019. “Drought.” Chap. 6 in 2019 Utah State Hazard Mitigation Plan. Salt Lake City, UT: Utah Division of Emergency Management.
Utah Division of Water Resources. 2019. “Regional water conservation goals.” Accessed August 24, 2022. https://conservewater.utah.gov/regional-water-conservation-goals/.
Utah Rivers Council. n.d. “Climate change: Rising temperatures threaten Utah’s people, rivers & wildlife.” Accessed August 18, 2022. https://utahrivers.org/climate-change.
Utah State Legislature. 2020. “State water policy amendments.” Accessed August 24, 2022. https://le.utah.gov/∼2020/bills/hbillamd/HB0041.htm.
Vose, R. S., S. Applequist, M. Squires, I. Durre, M. J. Menne, C. N. Williams Jr., C. Fenimore, K. Gleason, and D. Arndt. 2014a. NOAA Monthly U.S. Climate Divisional Database (NClimDiv). Asheville, NC: NOAA National Climatic Data Center. https://doi.org/10.7289/V5M32STR.
Vose, R. S., S. Applequist, M. Squires, I. Durre, M. J. Menne, C. N. Williams Jr., C. Fenimore, K. Gleason, and D. Arndt. 2014b. “Improved historical temperature and precipitation time series for US climate divisions.” J. Appl. Met. Clim. 53 (5): 1232–1251. https://doi.org/10.1175/JAMC-D-13-0248.1.
Weber Basin Water Conservancy District. n.d. “Why water conservation.” Accessed August 18, 2022. https://www.weberbasin.com/Conservation/about.
Western Regional Climate Center. n.d. “Average statewide precipitation for Western U.S. States.” Accessed August 18, 2022. https://wrcc.dri.edu/Climate/comp_table_show.php?stype=ppt_avg.
Wheeler, K. G., B. Udall, J. Wang, E. Kuhn, H. Salehabadi, and J. C. Schmidt. 2022. “What will it take to stabilize the Colorado River?” Science 377 (6604): 373–375. https://doi.org/10.1126/science.abo4452.
Information & Authors
Information
Published In

Journal of Hydrologic Engineering
Volume 29 • Issue 1 • February 2024
Copyright
This work is made available under the terms of the Creative Commons Attribution 4.0 International license, https://creativecommons.org/licenses/by/4.0/.
History
Received: May 17, 2023
Accepted: Oct 4, 2023
Published online: Nov 29, 2023
Published in print: Feb 1, 2024
Discussion open until: Apr 29, 2024
Authors
Metrics & Citations
Metrics
Citations
Download citation
If you have the appropriate software installed, you can download article citation data to the citation manager of your choice. Simply select your manager software from the list below and click Download.