Friction Factors for Flow through Cracks in Concrete Hydraulic Structures
Publication: Journal of Hydraulic Engineering
Volume 151, Issue 1
Abstract
Flow through cracks in a variety of concrete structures can be problematic for water resources infrastructure. Design of drainage systems to collect and remove such flow requires estimating flow rates through cracks. When the crack is wide or the flow path is relatively short, entrance losses dominate, and discharge may be estimated using orifice equations that neglect friction losses. However, for relatively narrow and long cracks with rough interior surfaces, friction losses can significantly affect discharge. This article reanalyzes data previously collected from tests of flow through a cracked concrete beam to obtain Darcy-Weisbach friction factors and presents them relative to the Reynolds number of the flow through the crack, similar to the Moody diagram commonly used to estimate friction factors in pipe flow. The data are also used to develop an empirical equation for predicting friction factors and to determine the effective roughness of the cracked concrete surfaces. Observations are made regarding unexpected behavior of friction factors for the combination of low Reynolds number and extremely large relative roughness, which is outside the bounds of most previous research on flow resistance.
Introduction
Flow through cracks in a variety of concrete structures can be problematic for water resources projects. In concrete spillway chutes with joints or cracks offset into the chute flow, uplift forces transmitted into the foundation can fail floor slabs or walls, while flow into open joints can cause erosion of underlying soils, creating voids that threaten the structural integrity of the chute lining. Dealing with flow through small cracks in other reinforced concrete structures such as water tanks, reservoir liners, and hydropower facilities can also be challenging. Drainage systems to collect and remove such flow can be helpful but their design requires estimating flow rates through cracks.
For spillway chutes, methods for estimating the driving stagnation pressure at an offset (Wahl and Heiner 2024b) and the resulting flow rate (Wahl and Heiner 2024a) have been developed for short, wide cracks where friction losses are small and head loss is primarily associated with the entrance to the crack. However, when cracks are relatively narrow compared to their flow length, friction losses are significant and an estimate of the internal friction factor of the crack is needed. The combination of small flow passages and rough surfaces within cracks creates conditions unlike typical pipe flows for which friction factors can readily be estimated based on previous research.
A data set that addresses this need was collected by Kanitkar et al. (2011). They performed controlled tests of flow through narrow, full-depth cracks in concrete beam specimens representing potential cracks in large reinforced concrete structural sections. The data were used to relate the dimensionless friction factor directly to the dimensional crack width. This paper refines some assumptions in the data analysis and presents the results in relation to the Reynolds number of the crack flow and the dimensionless relative roughness. The use of these dimensionless parameters facilitates scale-independent application to spillway crack flow studies and other civil engineering applications, such as seepage from reinforced concrete storage tanks.
Experimental Setup
Kanitkar et al. (2011) described the construction and controlled flexural cracking of two identically constructed 1.83-m (6-ft) long, 0.61-m (2-ft) wide, 0.69-m (2.25-ft) deep concrete beams. The beams were reinforced on each side of the planned crack but were not reinforced through the cracked section except by greased dowel pins to aid with realignment of the pieces after they were cracked (Fig. 1). The specified concrete mix had a 28-day strength of 28 MPa (), a water-cement ratio of 0.55, 4% air entrainment, and a maximum aggregate size of 25 mm (1 in.). Following construction, curing, and cracking, rubber side seals and a pumping apparatus and manifold were installed so that pressurized water could be supplied at the top of the beam and discharged from the bottom of the crack. Alignment dowels, threaded rods, and brackets were installed at the four corners of the cracked sections, and reference pins were embedded in the specimens on each corner to enable precise adjustment of the crack width, which was measured with digital calipers having 0.01 mm resolution (R. Kanitkar, personal communication). The crack widths were determined for each test as the average of four measurements across the crack at the beam corners. Pressure gages measured the applied pressure head, and flow rates through the crack were determined by inline flow meters on the supply piping and by collecting discharged water in a volumetrically graduated tank for a measured time period. Crack widths were varied from the smallest achievable width of 1 mm up to about 10 mm and applied pressure heads varied from 14.1 to 24.6 m of water (46.2 to 80.8 ft), equivalent to pressures of 138 to 241 kPa (20, 25, 30, and ).
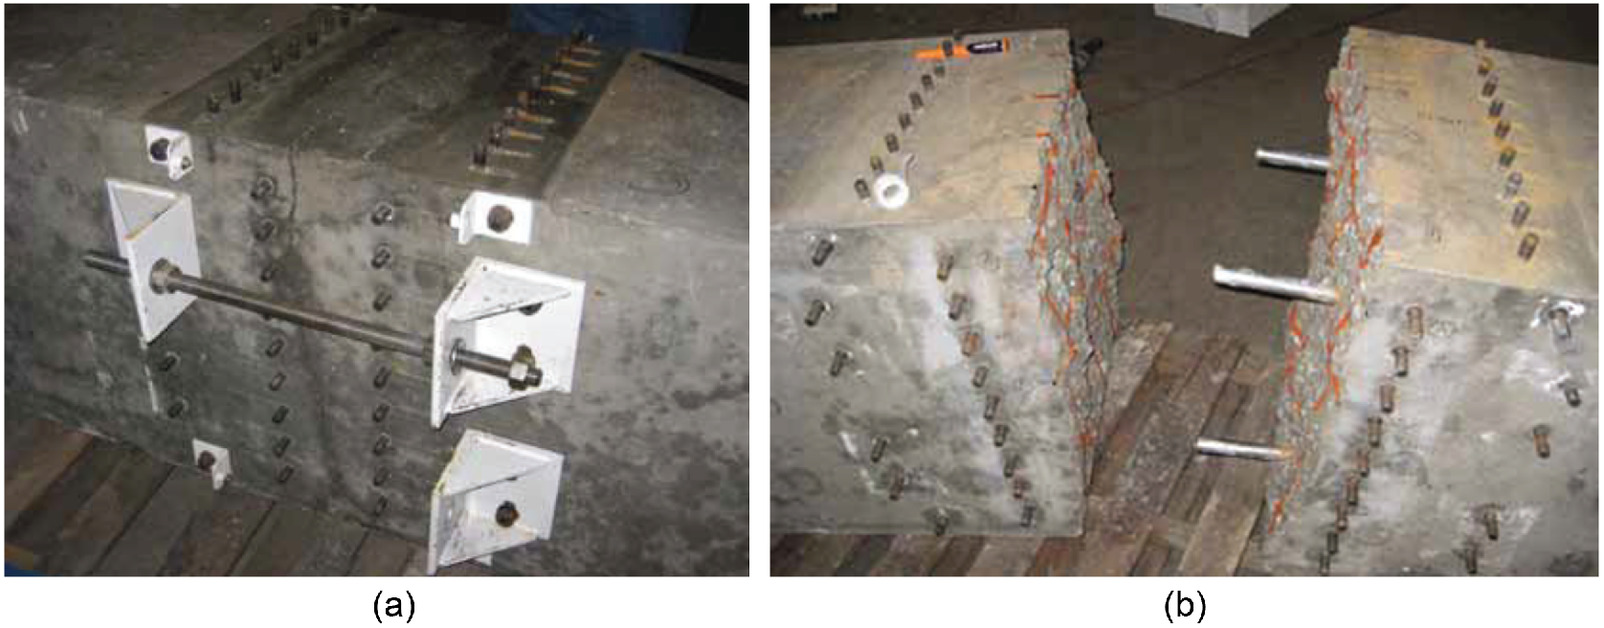
The system of threaded adjustment rods used to change and fix the crack width was designed to maintain relatively uniform crack dimensions over the full cross section of the beam. One unexpected complication was that the cracking process apparently generated some loose debris within the cracks, which prevented closing each crack back to a true zero width (i.e., the same original distance between the reference pins). Cracks were closed as tightly as possible, with the residual amount varying up to an estimated (R. Kanitkar, personal communication). Cracks were adjusted relative to the original precracked spacing of the reference pins to obtain the desired uniform crack-width setting for each test. Tests were conducted for narrow crack widths first, followed by wider cracks. The debris that remained within the cracks may have affected the tests at the narrowest crack settings, but likely washed out as the crack width was increased. Another explanation for the difficulty closing the crack is that the weight of the beams may have prevented keeping or restoring them to perfect alignment, even with the aid of the alignment dowels, so misalignment of the rough surfaces may have prevented the cracks from completely closing. It is also possible that the beams experienced some plastic deformation during the cracking process. Regardless of the reason for the slight residual spacing when closure of the cracks was attempted, crack widths were always set and recorded in the data set relative to the original precracked spacing of the reference pins.
The accuracy and precision of pressure gages was not reported, but tests were run so that all pressures were set to the specific values mentioned previously. The accuracy of flow rate measurements was also not reported, but an analysis of the data shows that the median coefficient of variation of flow rates for repeated tests of each crack setup was about 12.5%.
Calculations
The energy equation applied to the flow through the cracked beam iswhere = applied pressure head measured relative to the top of the beam (immersed depth if head had been provided by a water column); = beam depth; = acceleration due to gravity; = Darcy-Weisbach friction factor; = flow path length through the crack (taken to be which assumes that the flow path is relatively straight); = hydraulic radius defined as the cross-sectional flow area of the crack divided by its wetted perimeter; and is the average velocity through the crack, where is the total discharge; = crack width (space between the surfaces); and = beam width. This expression ignores minor losses at the entrance and assumes negligible velocity in the chamber where the inlet pressure head is measured and zero pressure (i.e., atmospheric) at the outlet of the crack below the beam. The term is approximated as , with the flow path length taken as . The exact hydraulic radius would be ; the approximation is equivalent to assuming that the side seals are much smoother than the cracked concrete surface and make a negligible contribution to friction losses, or that the beam width is much greater than the crack width so that the side seals are negligible in comparison to the beam width when determining the wetted perimeter. Kanitkar et al. (2011) omitted the beam depth, , from the left side of Eq. (1), which reduced the calculated friction factors by about 3% to 5% for low- and high-pressure tests, respectively. They also used an adjusted flow path length through the crack that was estimated to be 10% longer than the actual beam depth due to the meandering flow path through the crack; this reduced computed friction factors by 10%. In addition, an apparent data transcription error during publication caused the computed friction factors for specimen 1 to be incorrect in the published article; the values shown in the article’s data table were exactly equal to the friction factors computed for tests of specimen 2, including those with significantly different crack widths.
(1)
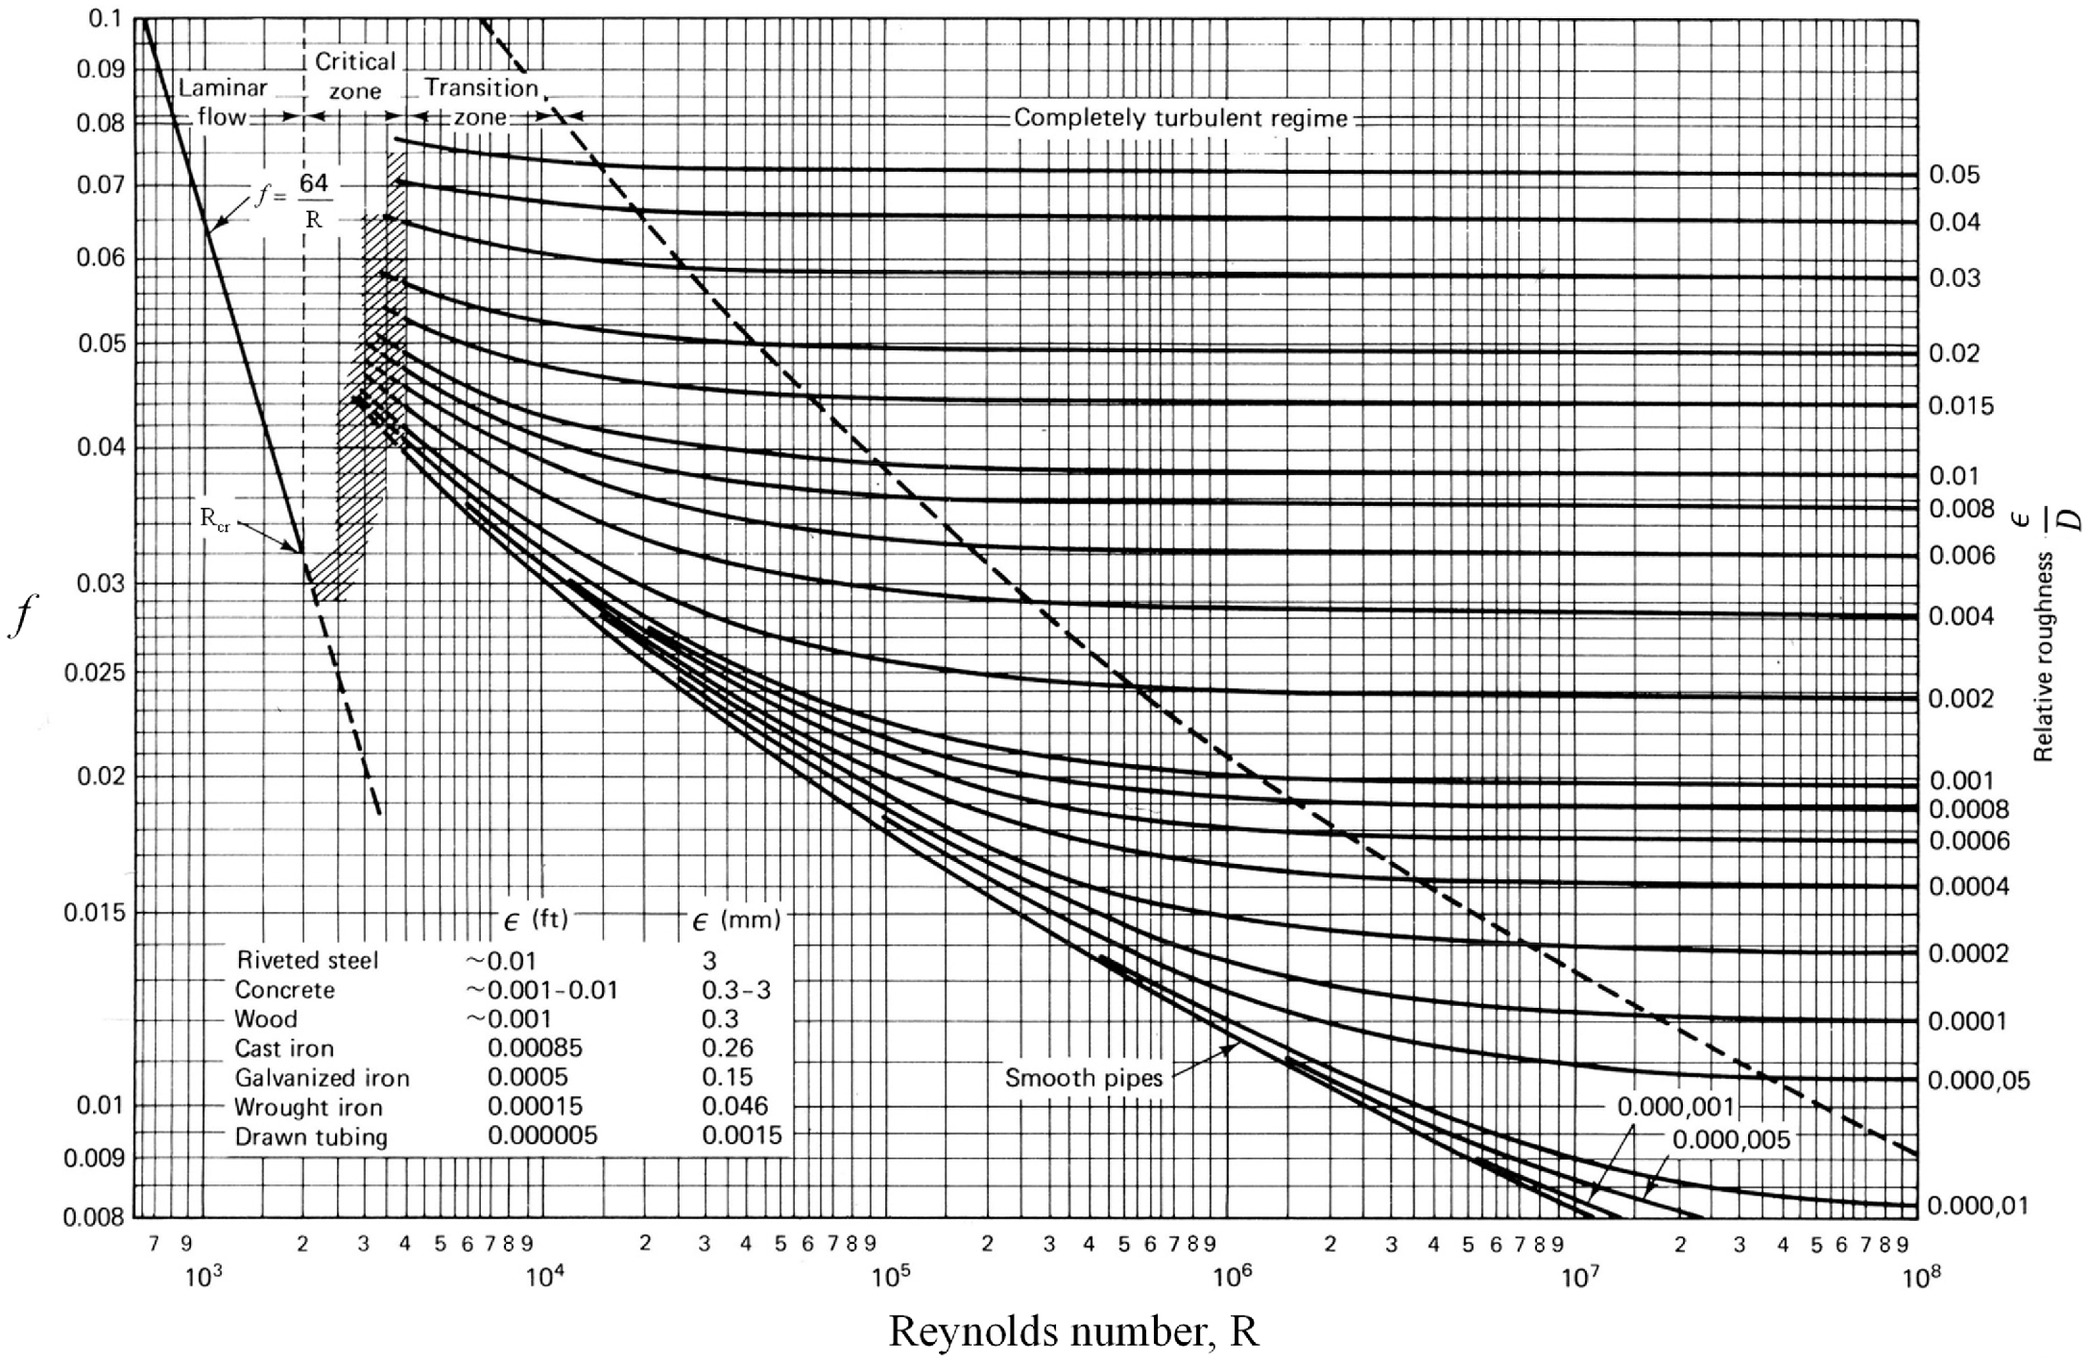
An important dimensionless parameter not considered in the original study is the Reynolds number, , where is the kinematic viscosity, taken to be at a temperature of 20°C (68°F), although the water temperature during testing is undocumented. The Reynolds number represents the ratio of inertial forces to viscous forces and is a fundamental parameter affecting the behavior of in certain flow regimes. Kanitkar et al. (2011) related to the crack width only, but a more useful relation should involve R (which includes both crack width and velocity), consistent with the Moody diagram (Fig. 2) used for friction factors in pipe flow and other hydraulic engineering applications (Moody 1944; Brown 2002). The Moody diagram shows that the friction factor varies within four different flow regimes defined by R and the relative roughness , where is the roughness of the surface and is the pipe diameter (replaced by when the conduit is not circular). For it is well established that the flow is typically laminar, with low friction factors due to the absence of turbulent dissipation. In this zone, the laminar friction factor is for a circular conduit, or for an infinitely wide rectangular conduit. [The relation for the infinitely wide case can be derived following the procedure outlined by Sabersky et al. (1971) for the circular case.] The range from approximately is a critical zone where laminar flow transitions to turbulent flow; this change is quite orderly (Schlichting 1968), not chaotic or random as the shaded region of the original Moody diagram might suggest, and initiates at a value of R that can depend on approach flow conditions such as passing the flow through a screen that triggers an early transition to turbulence (Swanson et al. 2002). The friction factor in this transitional range can be estimated analytically (Cheng 2008) if necessary. For R values above those of the critical zone, the flow is turbulent. Within the turbulent regime there is a transition zone in which is a function of both R and , but as R increases further the flow becomes fully turbulent and is a function of only .
Results
From Eq. (1), values of and R were computed from the original Kanitkar et al. (2011) data, assuming the flow path length equal to the beam depth (Table 1). The computed friction factors range from about 0.60 to 2.00. For the narrowest cracks (), R is in the range of about 1,500 to 4,000, where laminar flow might be possible, with much lower friction factors given by , but the computed values of are all much larger, suggesting three possibilities: the actual or effective crack width was less than measured; the effective flow path length was longer than the value used; or, the flow was turbulent despite the value of R. The calculated value of is inversely related to and proportional to (since is inversely related to and is proportional to ). R is independent of and , since for a constant beam width, is inversely related to while is proportional to . Thus, longer flow paths or smaller crack widths than those reported would reduce but not change R. Significant uncertainty in the crack width dimension seems possible, given the very small dimensions targeted and the size of the concrete beam elements being manipulated during the experiments. Uncertainty in the flow path length is also possible due to the rough surface of the cracks and the resulting meandering path taken by water flowing through the crack. Adjustments of both and were tested in an attempt to match the observed data to . It was necessary to increase the flow path length by a multiplication factor of 30–65, which is obviously unreasonable. Reductions of in the range of 0.73–1.22 mm were needed, which is theoretically possible but also practically implausible in comparison to the 0.01 mm precision of the crack-width measurements; a maximum measurement uncertainty of 0.05 mm is believed reasonable. The conclusion is thus made that all tests exhibited turbulent flow. The lower limit for turbulent flow in this environment may be , with turbulence forced by the relative roughness of the channel walls.
| Crack width, (mm) | Pressure head, (m) | Discharge, () | Friction factor, | Reynolds number, R |
|---|---|---|---|---|
| Specimen 1 | ||||
| 1.09 | 14.1 | 0.45 | 2.00 | 1,470 |
| 1.09 | 17.6 | 0.50 | 1.96 | 1,656 |
| 1.09 | 21.1 | 0.56 | 1.93 | 1,822 |
| 1.09 | 24.6 | 0.62 | 1.80 | 2,028 |
| 2.08 | 14.1 | 1.58 | 1.13 | 5,175 |
| 2.08 | 17.6 | 1.81 | 1.06 | 5,941 |
| 2.08 | 21.1 | 2.01 | 1.03 | 6,582 |
| 2.08 | 24.6 | 2.25 | 0.95 | 7,390 |
| 3.3 | 14.1 | 3.34 | 1.00 | 10,950 |
| 3.3 | 17.6 | 3.85 | 0.93 | 12,647 |
| 3.3 | 21.1 | 4.42 | 0.85 | 14,489 |
| 3.3 | 24.6 | 4.67 | 0.88 | 15,338 |
| 4.81 | 14.1 | 7.39 | 0.63 | 24,259 |
| 4.81 | 17.6 | 8.03 | 0.66 | 26,329 |
| 4.81 | 21.1 | 9.03 | 0.62 | 29,620 |
| 4.81 | 24.6 | 9.46 | 0.66 | 31,028 |
| 6.61 | 14.1 | 10.74 | 0.77 | 35,250 |
| 6.61 | 17.6 | 11.86 | 0.78 | 38,914 |
| 6.61 | 21.1 | 12.92 | 0.78 | 42,391 |
| 6.61 | 24.6 | 13.78 | 0.80 | 45,206 |
| 9.77 | 14.1 | 19.96 | 0.70 | 65,471 |
| 9.77 | 17.6 | 22.37 | 0.69 | 73,378 |
| 9.77 | 21.1 | 24.25 | 0.70 | 79,567 |
| 9.77 | 24.6 | 26.36 | 0.69 | 86,480 |
| 4.83 | 14.1 | 6.38 | 0.85 | 20,927 |
| 4.83 | 17.6 | 7.25 | 0.82 | 23,783 |
| 4.83 | 21.1 | 7.98 | 0.80 | 26,184 |
| 4.83 | 24.6 | 8.37 | 0.85 | 27,467 |
| 3.94 | 14.1 | 4.71 | 0.85 | 15,462 |
| 3.94 | 17.6 | 5.26 | 0.85 | 17,242 |
| 3.94 | 21.1 | 5.80 | 0.83 | 19,022 |
| 3.94 | 24.6 | 6.11 | 0.87 | 20,037 |
| Specimen 2 | ||||
| 1.08 | 14.1 | 0.47 | 1.81 | 1,532 |
| 1.08 | 17.6 | 0.55 | 1.62 | 1,801 |
| 1.08 | 21.1 | 0.60 | 1.62 | 1,966 |
| 1.08 | 24.6 | 0.71 | 1.35 | 2,318 |
| 1.63 | 14.1 | 0.83 | 1.99 | 2,712 |
| 1.63 | 17.6 | 0.93 | 1.93 | 3,063 |
| 1.63 | 21.1 | 1.00 | 1.99 | 3,291 |
| 1.63 | 24.6 | 1.17 | 1.71 | 3,829 |
| 3.18 | 14.1 | 3.17 | 0.99 | 10,412 |
| 3.18 | 17.6 | 3.57 | 0.97 | 11,716 |
| 3.18 | 21.1 | 3.86 | 0.98 | 12,668 |
| 3.18 | 24.6 | 4.25 | 0.95 | 13,930 |
| 4.84 | 14.1 | 6.10 | 0.94 | 20,016 |
| 4.84 | 17.6 | 6.69 | 0.97 | 21,941 |
| 4.84 | 21.1 | 7.37 | 0.95 | 24,176 |
| 4.84 | 24.6 | 8.03 | 0.93 | 26,329 |
| 6.41 | 14.1 | 9.67 | 0.87 | 31,731 |
| 6.41 | 17.6 | 10.57 | 0.90 | 34,671 |
| 6.41 | 21.1 | 12.09 | 0.82 | 39,659 |
| 6.41 | 24.6 | 12.55 | 0.88 | 41,170 |
| 9.44 | 14.1 | 18.76 | 0.72 | 61,559 |
| 9.44 | 17.6 | 21.08 | 0.71 | 69,155 |
| 9.44 | 21.1 | 22.74 | 0.72 | 74,599 |
| 9.44 | 24.6 | 25.26 | 0.68 | 82,879 |
| 4.82 | 14.1 | 6.34 | 0.86 | 20,802 |
| 4.82 | 17.6 | 7.08 | 0.85 | 23,224 |
| 4.82 | 21.1 | 7.67 | 0.87 | 25,149 |
| 4.82 | 24.6 | 8.26 | 0.87 | 27,095 |
| 3.87 | 14.1 | 4.49 | 0.89 | 14,717 |
| 3.87 | 17.6 | 4.98 | 0.89 | 16,352 |
| 3.87 | 21.1 | 5.53 | 0.87 | 18,132 |
| 3.87 | 24.6 | 5.99 | 0.86 | 19,664 |
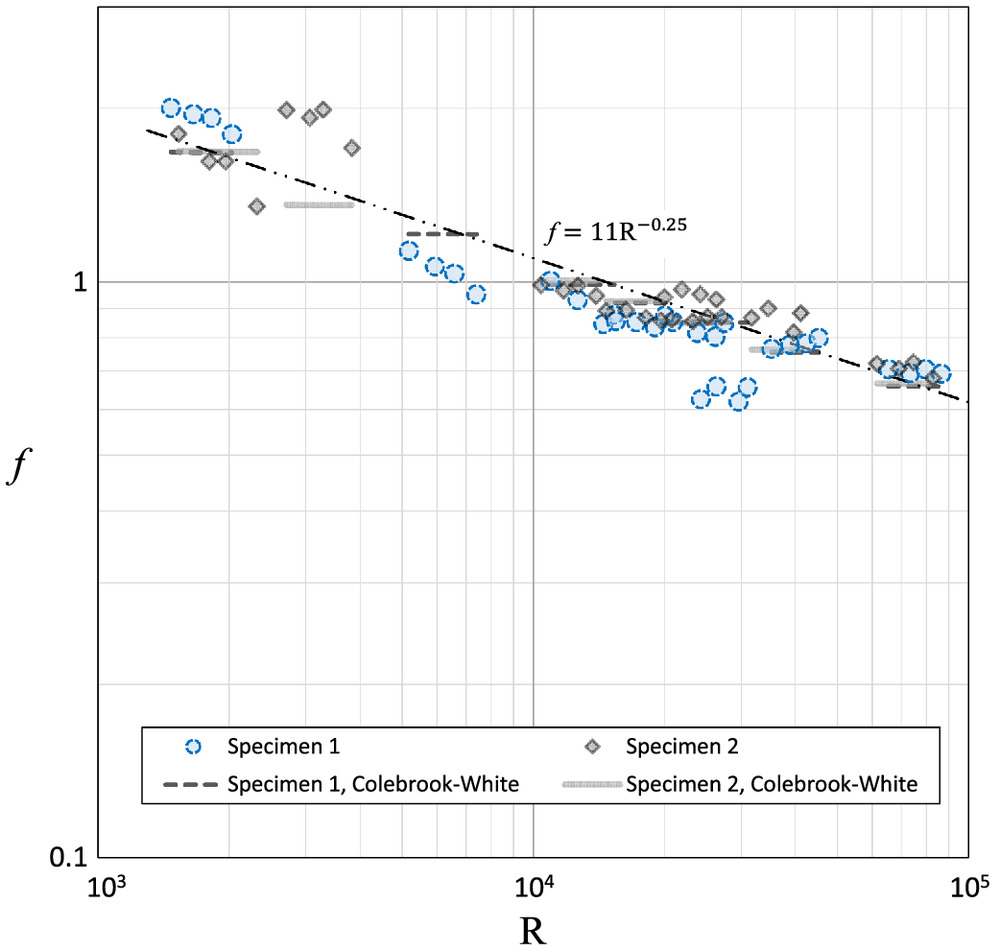
Fig. 3 shows the and R values plotted in comparison to the Moody diagram. The values of are all well above the traditional range of 0.008 to 0.10 typically encountered in pipe flow applications and also exceed the ranges commonly seen in both smooth and rough open-channel flows (Chow 1959, Figs. 1-3 and 1-4). The relation between and R is well represented by
(2)
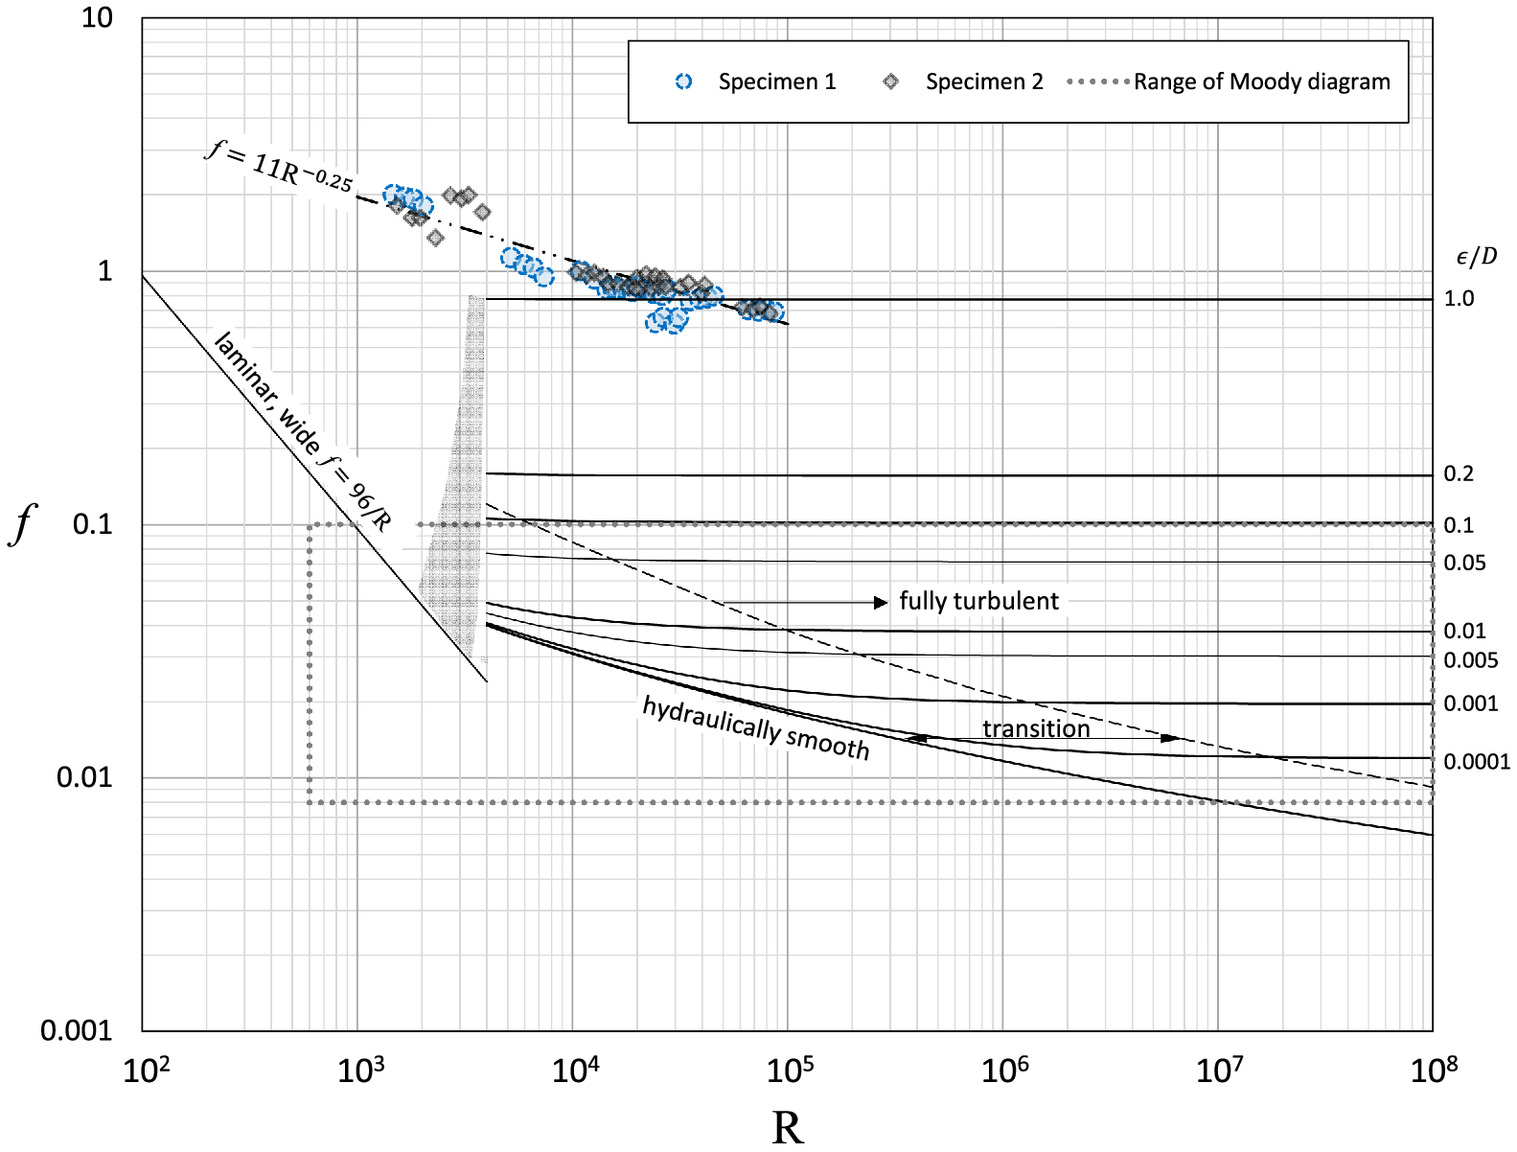
The data are relatively consistent with one another and with this relation, with the exception of two specific test configurations:
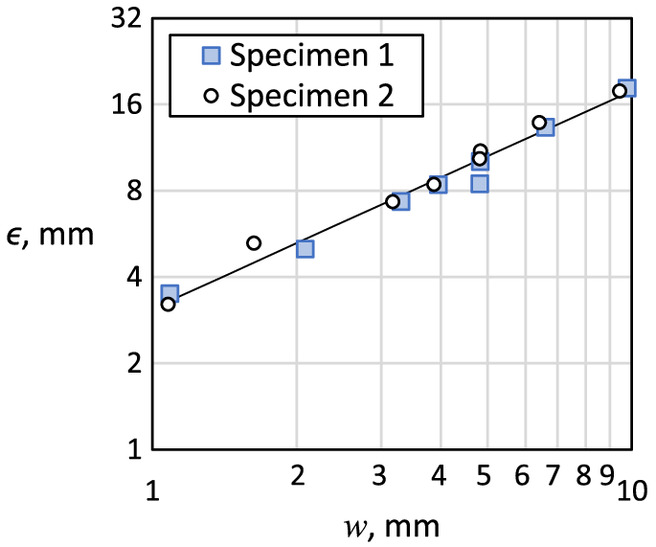
For each set of four tests conducted at a set crack width and incrementally increased pressures, the turbulent-flow data were also used to solve for an effective roughness height, , that would approximately match the observed values to those calculated by the Colebrook-White equation (1937), which can be solved iteratively or approximated using any of several explicit equations (e.g., Swamee and Jain 1976; Vatankhah 2018). Fig. 4 shows the resulting values of plotted versus the crack width, and the data trend is represented by the relation . This indicates that the effective roughness within the narrow crack increases with crack width and that the effective roughness heights are approximately 1.5−3 times larger than the crack widths. Such large roughness heights seem physically implausible and may indicate that the Colebrook-White equation is poorly suited to modeling flow resistance for this extreme situation of large roughness, narrow cracks, and low Reynolds number.
Despite this possibility, the relation illustrated in Fig. 4 was used to estimate for each test, and a value of was calculated with the Colebrook-White equation. These are plotted in Fig. 5 as short, nearly horizontal lines spanning the R range of each set of four tests performed at a fixed crack width. The independence from R follows the trend of the lines of constant that appear in the turbulent flow zone of the Moody diagram, which indicate that the friction factor should only be a factor of relative roughness for large R.
Discussion
The results indicating turbulent flow for R values as low as about 1,500 invite the question of where the transition to laminar flow will occur. The large relative roughness within the cracked concrete specimens seems to serve as a catalyst for turbulent flow. If the original test apparatus were available, experiments at lower pressure heads and Reynolds numbers (and with possibly smaller increments of pressure) might reveal the transition to laminar flow, or at least the beginning of the critical zone which has been typically characterized in previous research by a sharp decrease in for a small decrease in R (e.g., Swanson et al. 2002; McKeon et al. 2004).
Considering the work of Swanson et al. (2002) in more detail, their experiments show that in smooth-walled pipes the critical zone transition takes place around to 5,000 depending on pipe entrance conditions, and in the transition from turbulent flow to laminar flow as R is reduced, decreases rapidly from about 0.04–0.045 down to 0.02–0.03; the ratio of the changing values is about to . While certainly significant, the magnitude and rate of change of with R is probably still small enough and gradual enough that a flow transitioning from turbulent back to laminar conditions would not experience a friction factor reduction so large as to cause an increase of the flow rate, with . Such an increase would lead to an instability of the turbulent to laminar transition, which is not seen in the Swanson et al. (2002) data. Thus, in the present situation it seems likely that the transition from turbulent to laminar flow as R is reduced should similarly take place at an R value for which the turbulent and laminar friction factors differ by a ratio on the order of 1.5 to 2. At they differ by a ratio of more than 20, but they approach one another with decreasing R (Fig. 3). A suitable range for the transition appears to be to 45. Thus, turbulent flow seems likely for all but the smallest driving pressures on narrow cracks.
The flow through narrow concrete cracks could be considered analogous to flow through porous media (e.g., soils). Such flows are often modeled using Darcy’s law which states that flow velocity is proportional to the pressure gradient and a coefficient of permeability. Richardson (1961) explains that this relation is accurate only for cases where the flow through the pore spaces is laminar, and a rule of thumb for the upper limit of laminar conditions is a particle Reynolds number , where is the particle size of the media, is the discharge velocity (flow per unit time per unit of gross cross-sectional area), and is the kinematic viscosity (Tek 1957). The definitions of and R differ by the chosen length references (diameter of the particle the flow passes around versus the size of the opening the flow passes through) but both parameters are of a similar order of magnitude if the particle size of the media is considered representative of the flow passage dimension and the discharge velocity and through-crack velocity are comparable. This corroborates the idea that a transition between laminar and turbulent behavior would occur at very low values of R.
Experiments by Button et al. (1978) provide some corroboration of the large friction factor values computed from the Kanitkar et al. (2011) data. They tested gas flow through very narrow hydraulically smooth cracks (0.015 to 0.038 mm; 0.0006 to 0.0015 in.) that were both convergent and parallel, as well as wider artificially roughened cracks with parallel grit-blasted surfaces. The narrow, parallel, hydraulically smooth crack tests spanned both laminar and turbulent flow conditions and after conversion from Fanning to Darcy friction factors, they exhibited values ranging from 0.04 to 0.16 in turbulent conditions and 0.06 to 2.0 in laminar conditions. Their rough-crack tests spanned crack widths of 0.1 to 0.9 mm (0.004 to 0.035 in.) and yielded friction factors from 0.02 to 0.6 whereas the computed values in Table 1 range from about 0.6 to 2.0. However, their ratios of crack width to estimated roughness height were about 8.6 to 69 versus 0.3 to 0.6 for the Kanitkar et al. (2011) data. In other words, the roughness elements in the Kanitkar tests were potentially interfering with one another, whereas Button’s tests were far from this condition.
Another comparable study was performed by Gardner and Tyrrell (1986). They tested an aggregate crack created in a manner similar to the Kanitkar cracked beam tests, and also a constructed device they described as the Giant’s Causeway crack due to its similarity to the natural geologic formation by that name. For crack widths in the 5 to 20 mm range and large Reynolds numbers in the range of to , the aggregate cracks exhibited friction factors in the range of 0.6 to 1.0 with little dependence on R. Narrower cracks around 1 mm width behaved much differently from the Kanitkar data, with large reductions of the friction factor across a wide range of Reynolds numbers. The Giant’s Causeway crack exhibited friction factors between about 0.95 and 6, with the highest values associated with small crack widths (approximately 1.2 to 1.6 mm) tested at Reynolds numbers as low as about 200; these friction factors were still well above those that would be expected for laminar flow.
There is a fundamental difference in the behavior of the values predicted by the Colebrook-White equation and those obtained from the Kanitkar et al. (2011) experiments (Fig. 5); for each series of tests at a fixed crack width the Colebrook-White equation predicts almost constant values that are independent from R in the fully turbulent zone, whereas the measurements show an inverse relation between and R that is consistent across the tests at different crack widths and very similar to the typical behavior of in the transition region between hydraulically smooth and fully turbulent conditions. A possible explanation for this behavior is that the narrow crack in the concrete specimen behaves less like a straight pipe of uniform roughness and more like a sequence of minor losses associated with flow past the roughness elements of the cracked surface. This flow remains turbulent at low R, with losses that vary with R in a similar manner as transitional turbulent pipe flow. The conflicting trends in the Colebrook-White equation versus the observed data and the extremely large relative roughness values needed to obtain similar values suggest that the Colebrook-White equation simply does not apply well to this flow situation.
Conclusions
A unique set of tests performed to evaluate friction factors of flow through narrow cracks in concrete structures has been analyzed and compared to the widely used Moody diagram. These tests at extreme values of relative roughness are outside of the range of previously known pipe-flow hydraulic resistance data in the civil engineering literature. The experiments appear to have been carefully performed and instrumented and thus offer valuable information on the previously unstudied flow regime of high relative roughness combined with a low Reynolds number. Understanding flow resistance behavior for such rough surface conditions could help improve flow predictions for a wide range of civil engineering applications. The range of friction factors is comparable to previous experimental work in the energy and mechanical engineering fields aimed at the analysis of air and water leakage through cracks in pressurized industrial components.
Flow through cracks in two concrete beam specimens appears to exhibit turbulent behavior for a Reynolds number as low as , and Eq. (2) can be used to determine as a function of R. Comparison to other flow resistance research suggests that flow through cracked concrete sections and in other similar rough-walled environments may remain turbulent down to very low Reynolds numbers. Another most significant result is that the friction factors of flow through very rough, narrow cracks are dependent on Reynolds number, even for conditions in which full turbulence and Reynolds number independence would be expected based on the Moody diagram and the Colebrook-White equations.
Notation
The following symbols are used in this paper:
- beam width, 0.61 m (2 ft);
- pipe diameter [L];
- porous media particle diameter [L];
- Darcy-Weisbach friction factor = ;
- acceleration due to Earth’s gravity, ();
- flow path length, assumed equal to beam depth () [L];
- applied pressure [];
- total discharge through crack [];
- R
- Reynolds number for crack flow, ;
- Reynolds number for porous media, ;
- hydraulic radius, equal to flow area divided by wetted perimeter [L];
- discharge velocity in porous media, flow per unit time per unit gross area [];
- average velocity through crack [];
- crack width [L];
- beam depth, 0.69 m (2.25 ft);
- unit weight of water, ();
- head loss [L];
- roughness height [L]; and
- kinematic viscosity of water, at 20°C ( at 68°F).
Data Availability Statement
All data that support the findings of this study are available from the corresponding author upon reasonable request.
Acknowledgments
This work was jointly funded by the Bureau of Reclamation Dam Safety Office (Technology Development Program) and Research Office (Science and Technology Program). Joseph Kubitschek provided internal peer review. The authors appreciate the assistance and background information provided by Ravi Kanitkar, the principal investigator for the original experimental work. The anonymous reviewers and Associate Editor also provided insightful suggestions and directed us to additional helpful literature.
References
Brown, G. O. 2002. “The history of the Darcy-Weisbach equation for pipe flow resistance.” In Proc., Environmental and water resources history, 34–43. Reston, VA: ASCE. https://doi.org/10.1061/40650(2003)4.
Button, B. L., A. F. Grogan, T. C. Chivers, and P. T. Manning. 1978. “Gas flow through cracks.” J. Fluids Eng. 100 (4): 453–458. https://doi.org/10.1115/1.3448707.
Cheng, N. S. 2008. “Formulas for friction factor in transitional regimes.” J. Hydraul. Eng. 134 (9): 1357–1362. https://doi.org/10.1061/(ASCE)0733-9429(2008)134:9(1357).
Chow, V. T. 1959. Open-channel hydraulics, 10–11. New York: McGraw-Hill.
Colebrook, C. F., and C. M. White. 1937. “Experiments with fluid friction in roughened pipes.” Proc. R. Soc. London 161 (Jun): 367–381. https://doi.org/10.1098/rspa.1937.0150.
Gardner, G. C., and R. J. Tyrrell. 1986. “The flow resistance of experimental models of naturally occurring cracks.” Proc. Inst. Mech. Eng., Part C: J. Mech. Eng. Sci. 200 (4): 245–250. https://doi.org/10.1243/PIME_PROC_1986_200_125_02.
Kanitkar, R., W. W. Liu, G. Houlahan, and R. Kianoush. 2011. “Water flow through cracks in thick concrete sections.” Concr. Int. 33 (4): 43–48.
McKeon, B. J., C. J. Swanson, M. V. Zagarola, R. J. Donnelly, and A. J. Smits. 2004. “Friction factors for smooth pipe flow.” J. Fluid Mech. 511 (Sep): 41–44. https://doi.org/10.1017/S0022112004009796.
Moody, L. F. 1944. “Friction factors for pipe flow.” Trans. ASME 66 (8): 671–678. https://doi.org/10.1115/1.4018140.
Richardson, J. G. 1961. “Flow through porous media.” In Handbook of fluid dynamics, edited by V. L. Streeter. New York: McGraw-Hill.
Sabersky, R. H., A. J. Acosta, and E. G. Hauptmann. 1971. Fluid flow: A first course in fluid mechanics. 2nd ed. New York: Macmillan.
Schlichting, H. 1968. Boundary layer theory. 6th ed. New York: McGraw-Hill.
Swamee, P. K., and A. K. Jain. 1976. “Explicit equations for pipe-flow problems.” J. Hydraul. Div. 102 (5): 657–664. https://doi.org/10.1061/JYCEAJ.0004542.
Swanson, C. J., B. Julian, G. G. Ihas, and R. J. Donnelly. 2002. “Pipe flow measurements over a wide range of Reynolds numbers using liquid helium and various gases.” J. Fluid Mech. 461 (Jan): 51–60. https://doi.org/10.1017/S0022112002008595.
Tek, M. R. 1957. “Development of a generalized Darcy equation.” J. Pet. Technol. 9 (6): 45–47. https://doi.org/10.2118/741-G.
Vatankhah, A. R. 2018. “Approximate analytical solutions for the Colebrook equation.” J. Hydraul. Eng. 144 (5): 06018007. https://doi.org/10.1061/(ASCE)HY.1943-7900.0001454.
Wahl, T. L., and B. J. Heiner. 2024a. “Discharge through open offset joints and cracks in spillway chutes.” J. Hydraul. Eng. 150 (5): 04024032. https://doi.org/10.1061/JHEND8.HYENG-13898.
Wahl, T. L., and B. J. Heiner. 2024b. “Laboratory measurements of hydraulic jacking uplift pressure at offset joints and cracks.” J. Hydraul. Eng. 150 (4): 04024016. https://doi.org/10.1061/JHEND8.HYENG-13871.
Information & Authors
Information
Published In

Journal of Hydraulic Engineering
Volume 151 • Issue 1 • January 2025
Copyright
This work is made available under the terms of the Creative Commons Attribution 4.0 International license, https://creativecommons.org/licenses/by/4.0/.
History
Received: Dec 20, 2023
Accepted: Jul 23, 2024
Published online: Sep 20, 2024
Published in print: Jan 1, 2025
Discussion open until: Feb 20, 2025
ASCE Technical Topics:
Authors
Metrics & Citations
Metrics
Citations
Download citation
If you have the appropriate software installed, you can download article citation data to the citation manager of your choice. Simply select your manager software from the list below and click Download.