Geomorphic Evolution of a Levee Setback in a Gravel–Sand Channel in Washington State
Publication: Journal of Hydraulic Engineering
Volume 151, Issue 1
Abstract
Levee setbacks can create space for side channels, reduce flood impacts, and provide environmental benefits. Guidance is needed on how side channel design affects geomorphic changes over time. This paper explores application of existing research on natural and forced side channels to a levee setback with side channel on the White River (Washington). The side channel maintained a high bifurcation angle into the setback for 2 years. High flows then reset the bifurcation to a lower angle. Flow and sediment volumes and deposition patterns from each 2-year period matched results from existing studies for either a high or low angle. Application of existing research insight into expected flows and sediment patterns was dependent on a static bifurcation angle. In this case study, because the entrance area did not restrict the bifurcation angle and the flow regime included high flows, the bifurcation angle could adjust to maintain the side channel. Designing a large setback entrance enabled the channel to self-adjust to maintain flow and sediment transport into the side channel without the need for engineering intervention.
Introduction
Floods can be devastating to people and communities. In the last 10 years (2013–2022), the US experienced 17 separate floods that each caused over $1 billion in damages (NOAA and NCEI 2023). Traditional approaches to flood risk management have focused on increasing the flow area within the channel banks or the channel flow capacity. This has been done through channel widening, reducing hydraulic roughness, and increasing the bank heights with floodwalls and levees (Arnold 1988; USACE 2000; Woodward 2015). Common channel modifications in the US include direct dredging of the channel bed, removal of in-channel wood, and selective removal of those areas of in-channel and bank bars exposed at nonflood flow water elevations (e.g., USACE 1994). In urban areas with significant flood risk, major channel modifications can include removing wood from within channel, dredging channel bars and bed, meander cutoffs (Beuchert 1965), and channel bank and bottom hardening with rock riprap, articulated concrete mats, and concrete lining.
These well-intended alterations have frequently resulted in significant ecological impacts that reduced system resilience and initiated geomorphic responses that require vigilant management to address, including long-term financial commitments (e.g., Arthur D. Little, Inc. 1973; Keller 1975; Schoof 1980; Nunnally and Shields 1985; Tullos et al. 2021). In rivers with high sediment loads, these changes to channel geometry often lead to the growth of in-channel and alternate bars (Bountry et al. 2009) and channel bed aggradation (Landwehr and Rhoads 2003). Increased sediment deposition rates over time reduce the within-bank channel area and total channel flow capacity, increasing the risk of flooding to the surrounding community. The limited effectiveness of past interventions combined with the high maintenance cost, both monetary and ecological, has resulted in consideration of other methods of reducing flood risks for communities.
Levee setbacks are projects that restore lateral connectivity and enhance system resilience by reconnecting channels and floodplains. A setback removes existing bankside levees and replaces them with new levees built further from the channel, at the edges of the historical channel migration area if possible. The land between the new levee and the channel banks is often purchased by the local or state government and becomes part of the channel floodplain area. Levee setbacks were identified as an example of how flood risk can be reduced through nature-based infrastructure projects by The Nature Conservancy as Floodplains By Design (Reuter et al. 2005), the European Union through Room for the River (Rijke et al. 2012), and USACE as Engineering with Nature (Haring et al. 2021; Schielen et al. 2021). Management benefits from levee setbacks include decreased flood levels and velocities and a reduction in the frequency of maintenance and repair on levees (Dahl et al. 2017; Schielen et al. 2021). Ecosystem benefits can include reestablishment of groundwater recharge areas, nutrient cycling, sediment storage, and ecological enhancements for riparian functions, including habitat for terrestrial and aquatic species (e.g., Bartell et al. 2020).
Levee setbacks are becoming more common as watershed managers realize their potential to reduce maintenance costs and property loss associated with flooding, provide resilience against increasing flows in the future, and improve ecological and geomorphic river functions through lateral reconnection (Tullos et al. 2021; Dierauer et al. 2012; Smith et al. 2017; Beechie et al. 2013). Benefits from setbacks have been realized on the Middle Mississippi River (Dierauer et al. 2012), the Sacramento River (Smith et al. 2017), the Lower Illinois River (Guida et al. 2016), and the Missouri River (Schielen et al. 2021). Washington State has been increasingly active in the design, pursuit, and construction of levee setbacks over the last two decades as a means of decreasing the frequency and extent of damaging overbank flows on infrastructure and the population (e.g., Dahl et al. 2017; Jones et al. 2018).
There is not a defined process for planning a levee setback to realize the potential management and ecosystem benefits, and few projects have had robust postproject monitoring (Tullos et al. 2021). The Countyline levee on the White River in Washington State was set back in March 2017 with the stated goals of reducing flood-related water surface elevations and improving in-stream habitat by reducing the rate of main channel aggradation and increasing the floodplain area available for sediment storage (Herrera Environmental Consultants 2014). The project was designed using historic aerial imagery analysis and numerical modeling. The historic imagery informed the upstream location for water to flow into the setback area, and a two-dimensional (2D) hydraulic model guided placement and design of log jams and wood revetments within the setback area. The Countyline reach and levee setback now have 5 years of postproject monitoring data.
This paper presents the Countyline Levee Setback Project as a case study of how a managed levee setback evolves over time and shows how the design process can be informed by making use of the findings from natural side channel reconnection and bifurcation projects. The geomorphic changes measured in the setback area and main channel are presented first. A discussion follows of the efficacy of prior research on side channels and bifurcations to predict and inform the Countyline Levee Setback Project in particular and how the monitoring postproject may be used to inform levee setback project planning in general.
Study Area
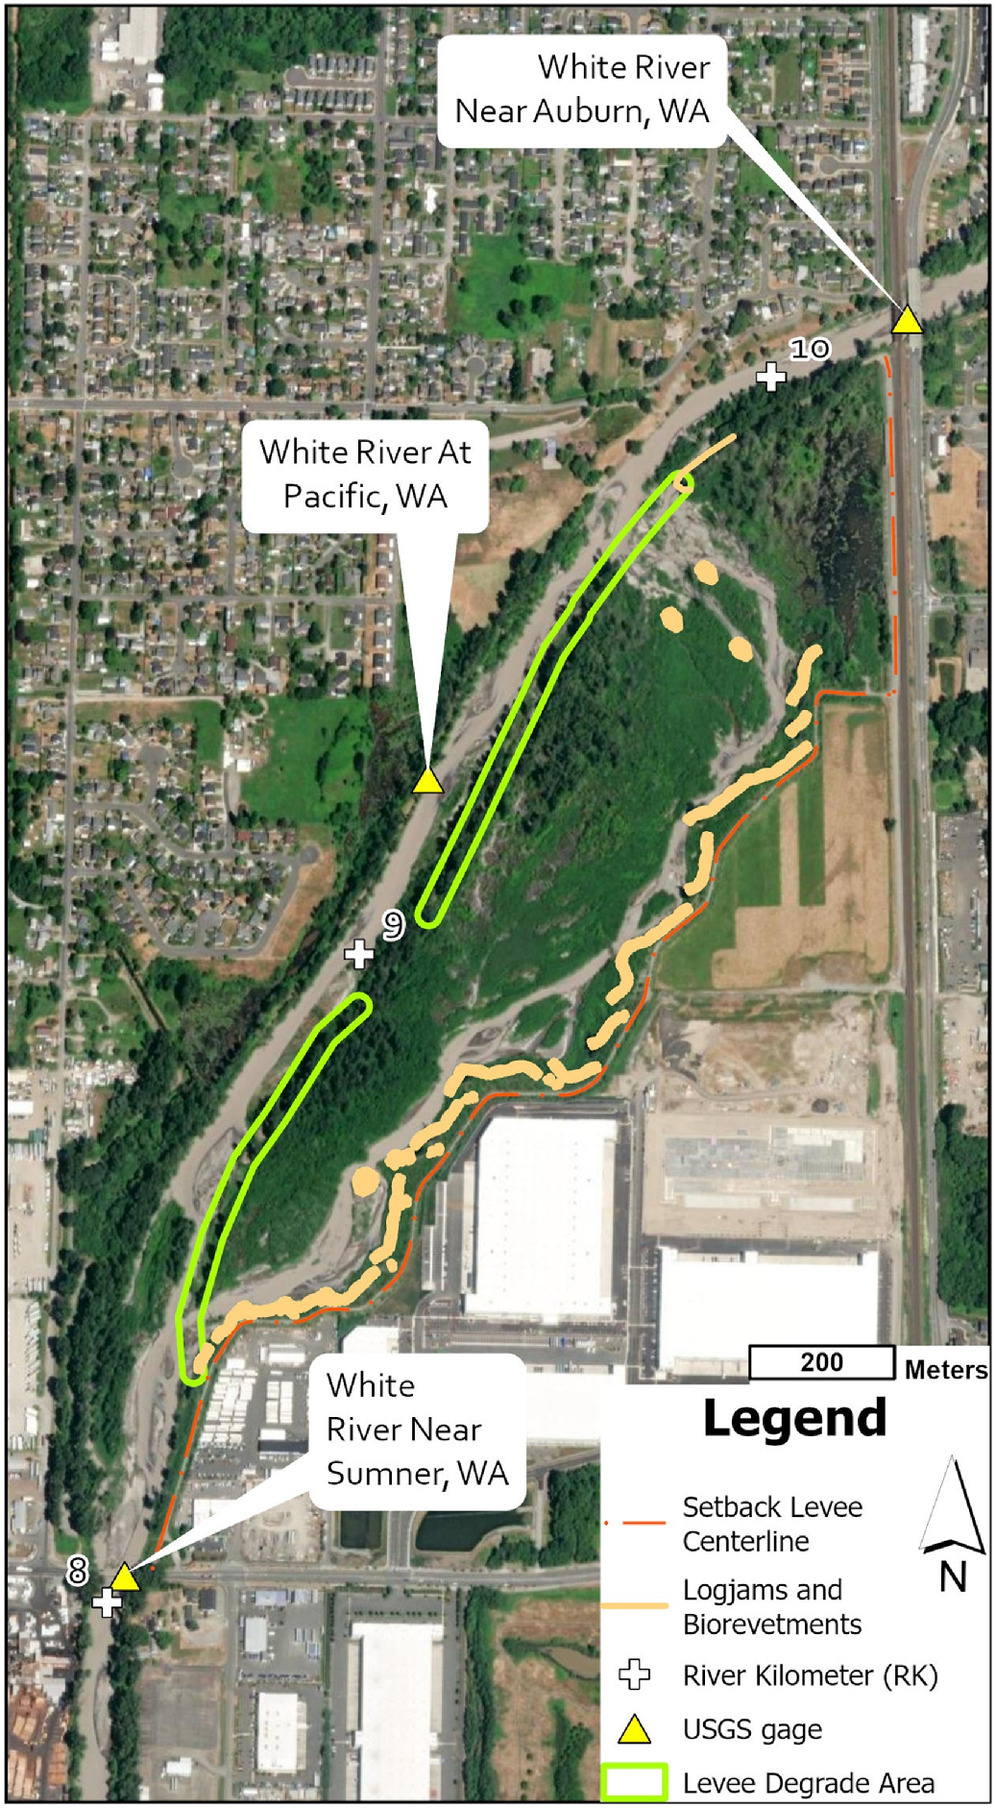
The White River originates at the Emmons Glacier on Mount Rainier and flows approximately 105 km downstream to a confluence with the Puyallup River and then another 16 km to Puget Sound (Fig. 1). The catchment area is . The White River is characterized as a wandering channel in that it has an irregularly sinuous planform with both meandering and braided reaches (Beechie et al. 2006; McQueen et al. 2021). Channel gradient lowers quickly with distance down Mount Rainier from over 3% to 0.3% at river kilometer (RKm) 90. Near the study area, the gradient decreases from 0.5% at RKm 12 to 0.03% at RKm 4, promoting deposition and formation of an alluvial fan. The population centers and channel bank levees begin at RKm 13 and extend downstream. The study reach is the Countyline levee setback on the lower part of the White River, between at RKm 10 and RKm 8 (Fig. 2).
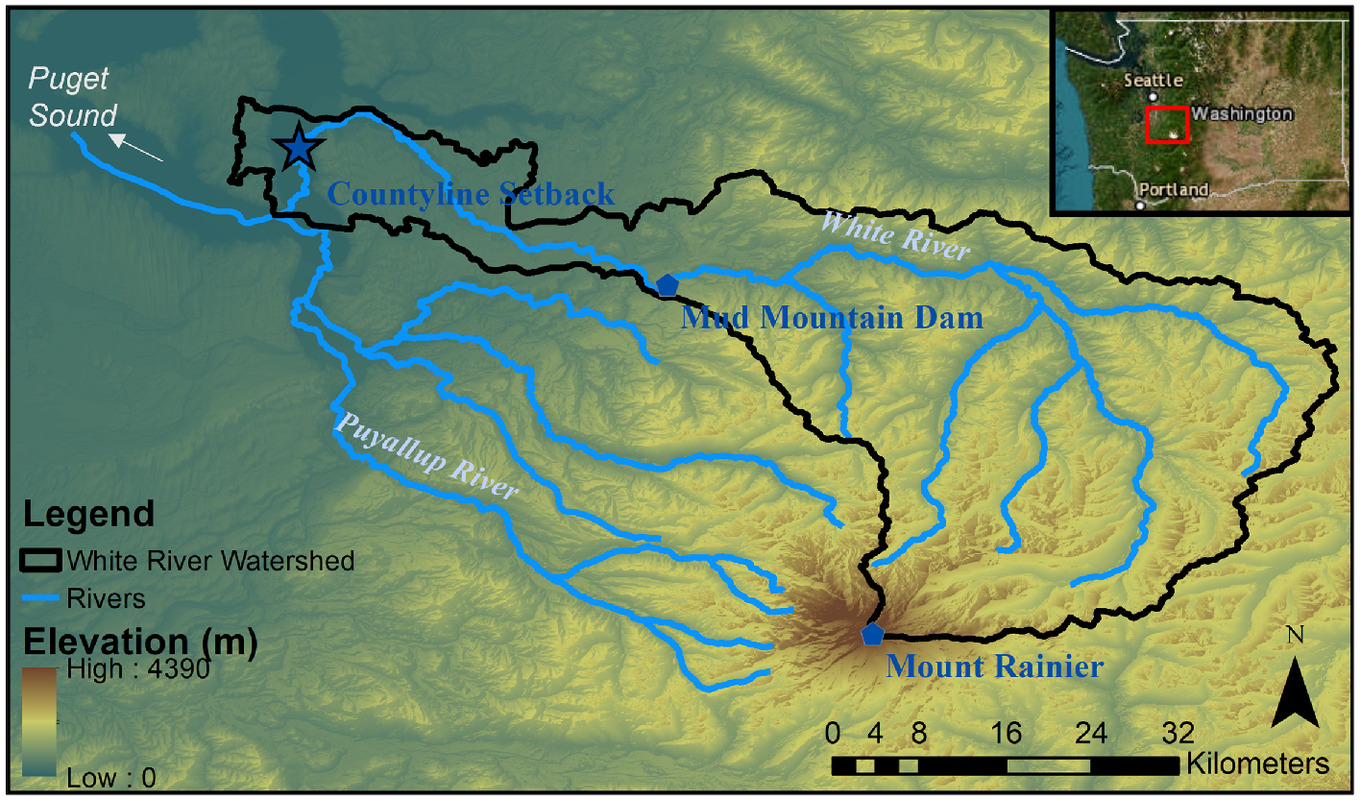
Coarse substrate material deposits below RKm 10, and the majority of the fine sands and silts pass through the river and out to Puget Sound. Grain size distribution measurements in the project area determined the subsurface median grain size to be 39 mm and with a sand content of 8% (Anderson and Jaeger 2021). Surface counts were limited to the gravel fraction and found the median gravel size to be 52 mm (Czuba et al. 2010). Direct bed-load samples were collected from RKm 10 by the USGS using a modified Helley-Smith sampler with with a 20- by 10-cm opening and a 1.40 expansion ratio, often called an Elwha sampler (Czuba et al. 2012). Three 2010 samples were collected at flow rates between 86 and . Two additional 2011 samples were collected during flows at 185 and . These data have been used to generate a sediment transport rating curve using the calibrated Wilcock and Crowe (2003) model.
Flows through the study area are controlled by Mud Mountain Dam at RKm 42, which was constructed to reduce the flood risk to downstream communities. During normal operations, the tunnel at the base of the dam remains open, and all incoming sediment and water passes through the dam. When a flood occurs, the base tunnel is closed and only the water tunnels at higher elevations are used for flow releases. The dam stores water and sediment in the reservoir during floods. Once a flood recedes, the base tunnel is opened, and the stored water and sediment are released downstream. The main impact of the dam on the study site is on river hydrology, reducing flood flow peaks and elongating the falling limbs of floods such that downstream flows remain elevated longer than would be natural. Maximum releases from the dam are set to avoid exceeding downstream channel capacity.
Until 1984, downstream channel capacity was maintained by removing in-channel gravel (Prych 1988). Between 1984 and 2009, deposition in the study reach aggraded the channel bed by up to 2 m (Anderson and Jaeger 2021). Gravel bars formed in the study reach and became the sites of natural wood accumulation. An existing midchannel bar expanded to connect to the bank and was vegetated by the mid-2010s. Peak flow releases from the dam were reduced from 340 to in 2009 (Jones et al. 2018) due to the loss of channel capacity. As a consequence, the dam is operated to hold flood waters twice as often and the levee setback project was completed to help reduce flood risk.
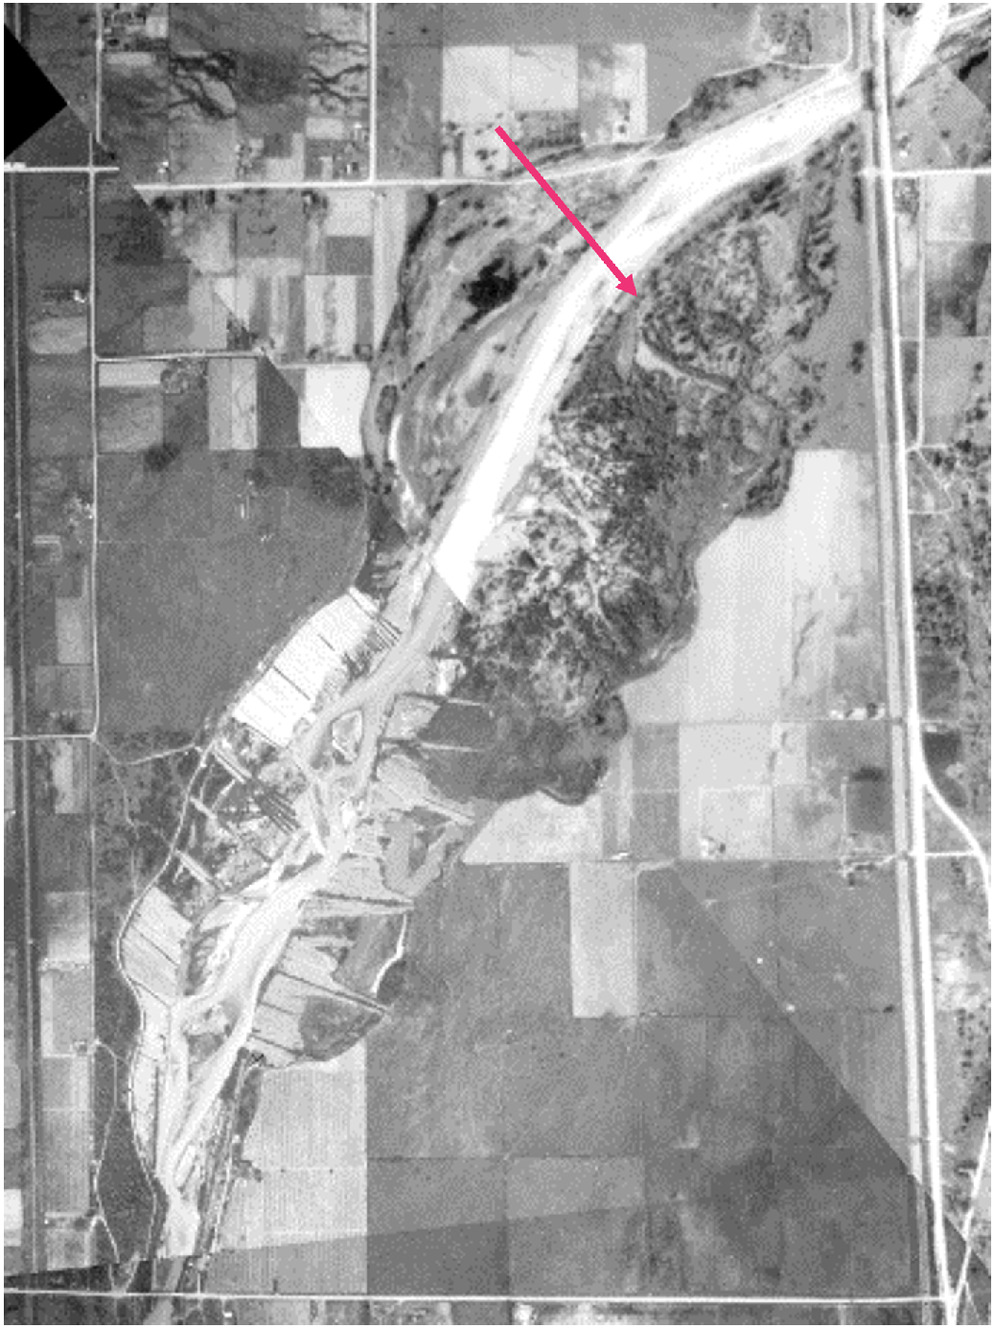
Land cover in the setback project area has historically been dominated by open space and forested wetlands with heavier tree growth further from the riverbank (Fig. 3). Area levee construction began in the 1920s. Visible on the 1931 imagery are side channel bifurcations in the upper part of the main channel, diffuse connections to the floodplain further south, and areas where connections had been recently eliminated through levee construction. Natural side channels were approximately 95, 185, and 400 m downstream of the BNSF railroad bridge, with the side channel diverging at 400 m appearing larger than the others. The effect of disconnection of the mainstem from the side channels remained evident in the 2016 imagery as an area of lighter vegetation density where the larger side channel had been. Wood became abundant throughout the site as any fallen trees were left in place. Beaver were active in the area and beaver dams documented in 2016 caused partial to full inundation of much of the middle portion of the area planned for the setback levee. In areas that were partially inundated, the vegetation was less dense and seasonal.
Levee Setback Design
The Lower White River Countyline Levee Setback Project (the project) was completed in 2017 and increased the floodplain area available by approximately 49 ha (McCarthy et al. 2020). Over the summer of 2017, the left bank levee was removed or lowered to approximate the natural bankfull elevation with the exception of a short reach in the lower third of the study area, which was left in place to preserve tree clusters and a bald eagle nest site (Fig. 2). A new 1,800-m-long levee was constructed on a terrace separated from the river by an area of forested wetland and open space. A 3-m-tall bioengineered bank revetment (biorevetment) was constructed immediately riverward of the new levee for erosion protection (Herrera Environmental Consultants 2014).
Multiple engineered log jam (ELJ) structures were constructed within the setback area with the goal of dispersing flow entering the setback area and where hydraulic modeling indicating a potential for erosion adjacent to the new levee and biorevetment. The five ELJs in the interior of the setback area were each 5.4 m tall, 25–27 m wide, and built from approximately 80 large logs. Three ELJs were constructed near the entrance to the setback area, approximately 120 and 225 m downstream of the notched bank, to ensure the flow would form multiple channels. These ELJs were 5 m tall, 16.8 m wide, and contained 41 large logs (Herrera Environmental Consultants 2014).
The location of the larger 1931 side channel, approximately 400 m downstream from the BNSF bridge, became the template for establishing the entrance to the setback area and initial path for a new side channel (Fig. 3). The bifurcation was established by lowering 445 m of the left bank to approximately 1.5 m below bankfull elevation, essentially notching the bank. During project construction, a temporary access road approximately 35 m wide was built along the far side of the levee setback along with staging areas to enable construction of the new levee and the associated wooden revetment. Additional staging areas were built where ELJs were part of the design. The side channel formed along a path coincident with the now-removed construction access road. Upstream of the lowered left channel bank, approximately 360 m of the existing levee along the left bank downstream from the railroad bridge abutment was raised and resurfaced to prevent the possibility of erosion near the bridge abutment.
Stated preproject goals included reducing flood risk by reconnecting the channel to the floodplain, providing room for channel migration, and encouraging deposition outside the mainstem channel. Project progress toward these goals has been monitored through the use of aerial imagery, LiDAR, field surveys, and USGS stream gauge data to examine the project’s impact on river flows, floodplain connectivity, and sediment storage. LiDAR was flown annually in March from 2016 to 2022 when the flow was below bankfull. The resolution of the data from 2017 was too low for use in this analysis, and the 2016 data were used in its place to represent the preproject state (King County 2022; Corum et al. 2023). Cross-sections through the main channel, and then both main channel and setback area, were measured from 2016 to 2018 and from 2021 to 2022. USGS gauges located on the White River at upstream, middle, and downstream locations have recorded water stage through the reach (Gauges 12100496, 12100498, and 12100500) since October 2012.
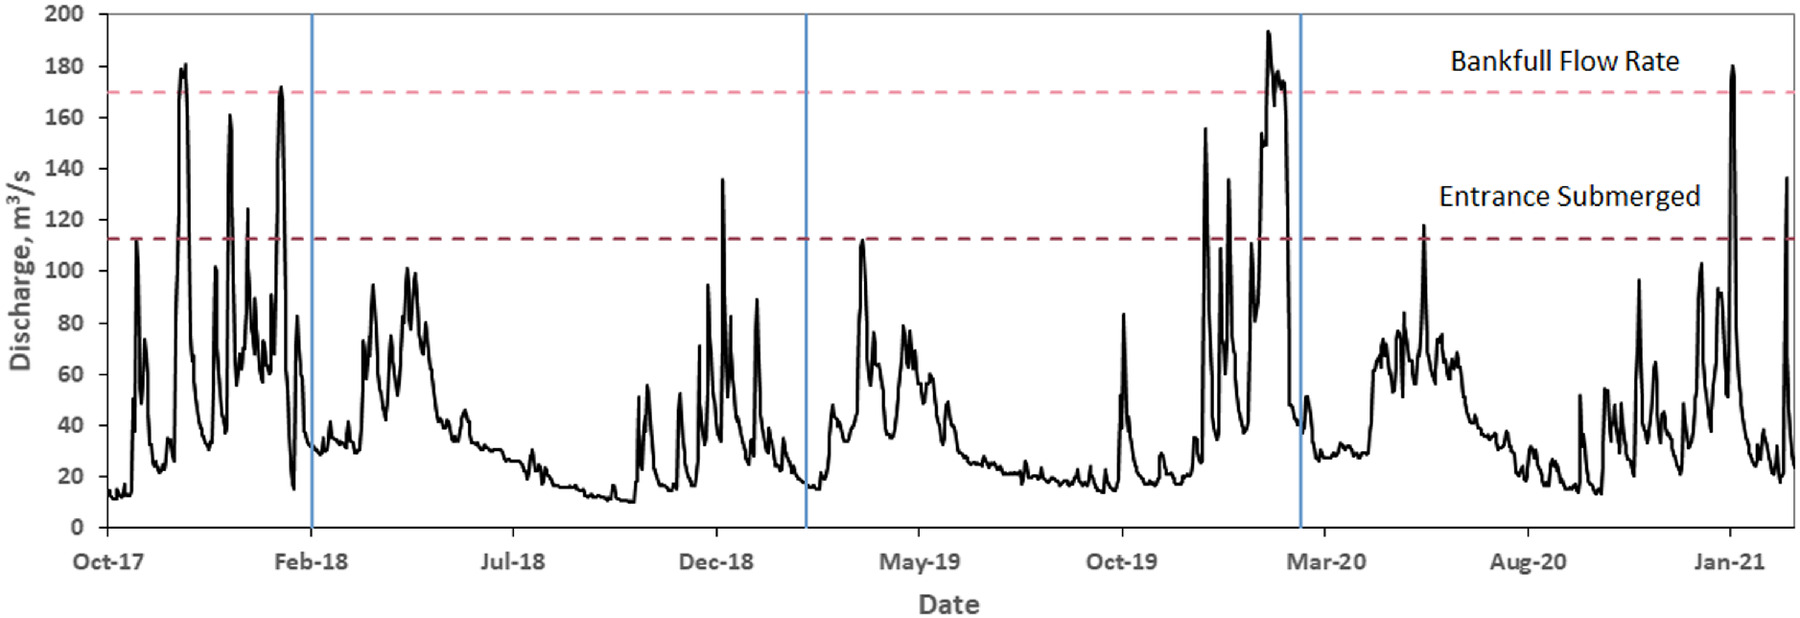
Postproject Analysis
The geomorphic changes due to the project were analyzed using information gathered from site visits, LiDAR, aerial imagery, and cross-section data. Flow rates reached or exceeded , the estimated preproject bankfull flow, multiple times since project completion (Fig. 4). Changes to mainstem and side channel bathymetries were measured from cross sections. Net deposition and erosion volumes were measured by differencing digital elevation maps (DEMs) created from the LiDAR data. The analysis follows LiDAR dates, with the flows and sediment transport volumes analyzed annually in March. A two-dimensional hydraulic model was created during project design. The modeling efforts were the subject of the study by Corum et al. (2023) and are fully discussed there.
This model was updated with postproject flows and topography and verified against the postproject water surface elevations. This analysis made use of the design model with updated LiDAR to determine the percent of main channel flow diverted and to measure the angle of the dominant flow path across the setback entrance each year. To maintain a consistency, only main channel flows between 56 and were considered when evaluating the angle at which the bulk of the flow passed into the setback area. These flow rates correspond to the high flows frequent during winter storms. Repeat aerial imagery, which were taken during low-flow summer months, were used to supplement the analysis and evaluate planform changes (Fig. 5).
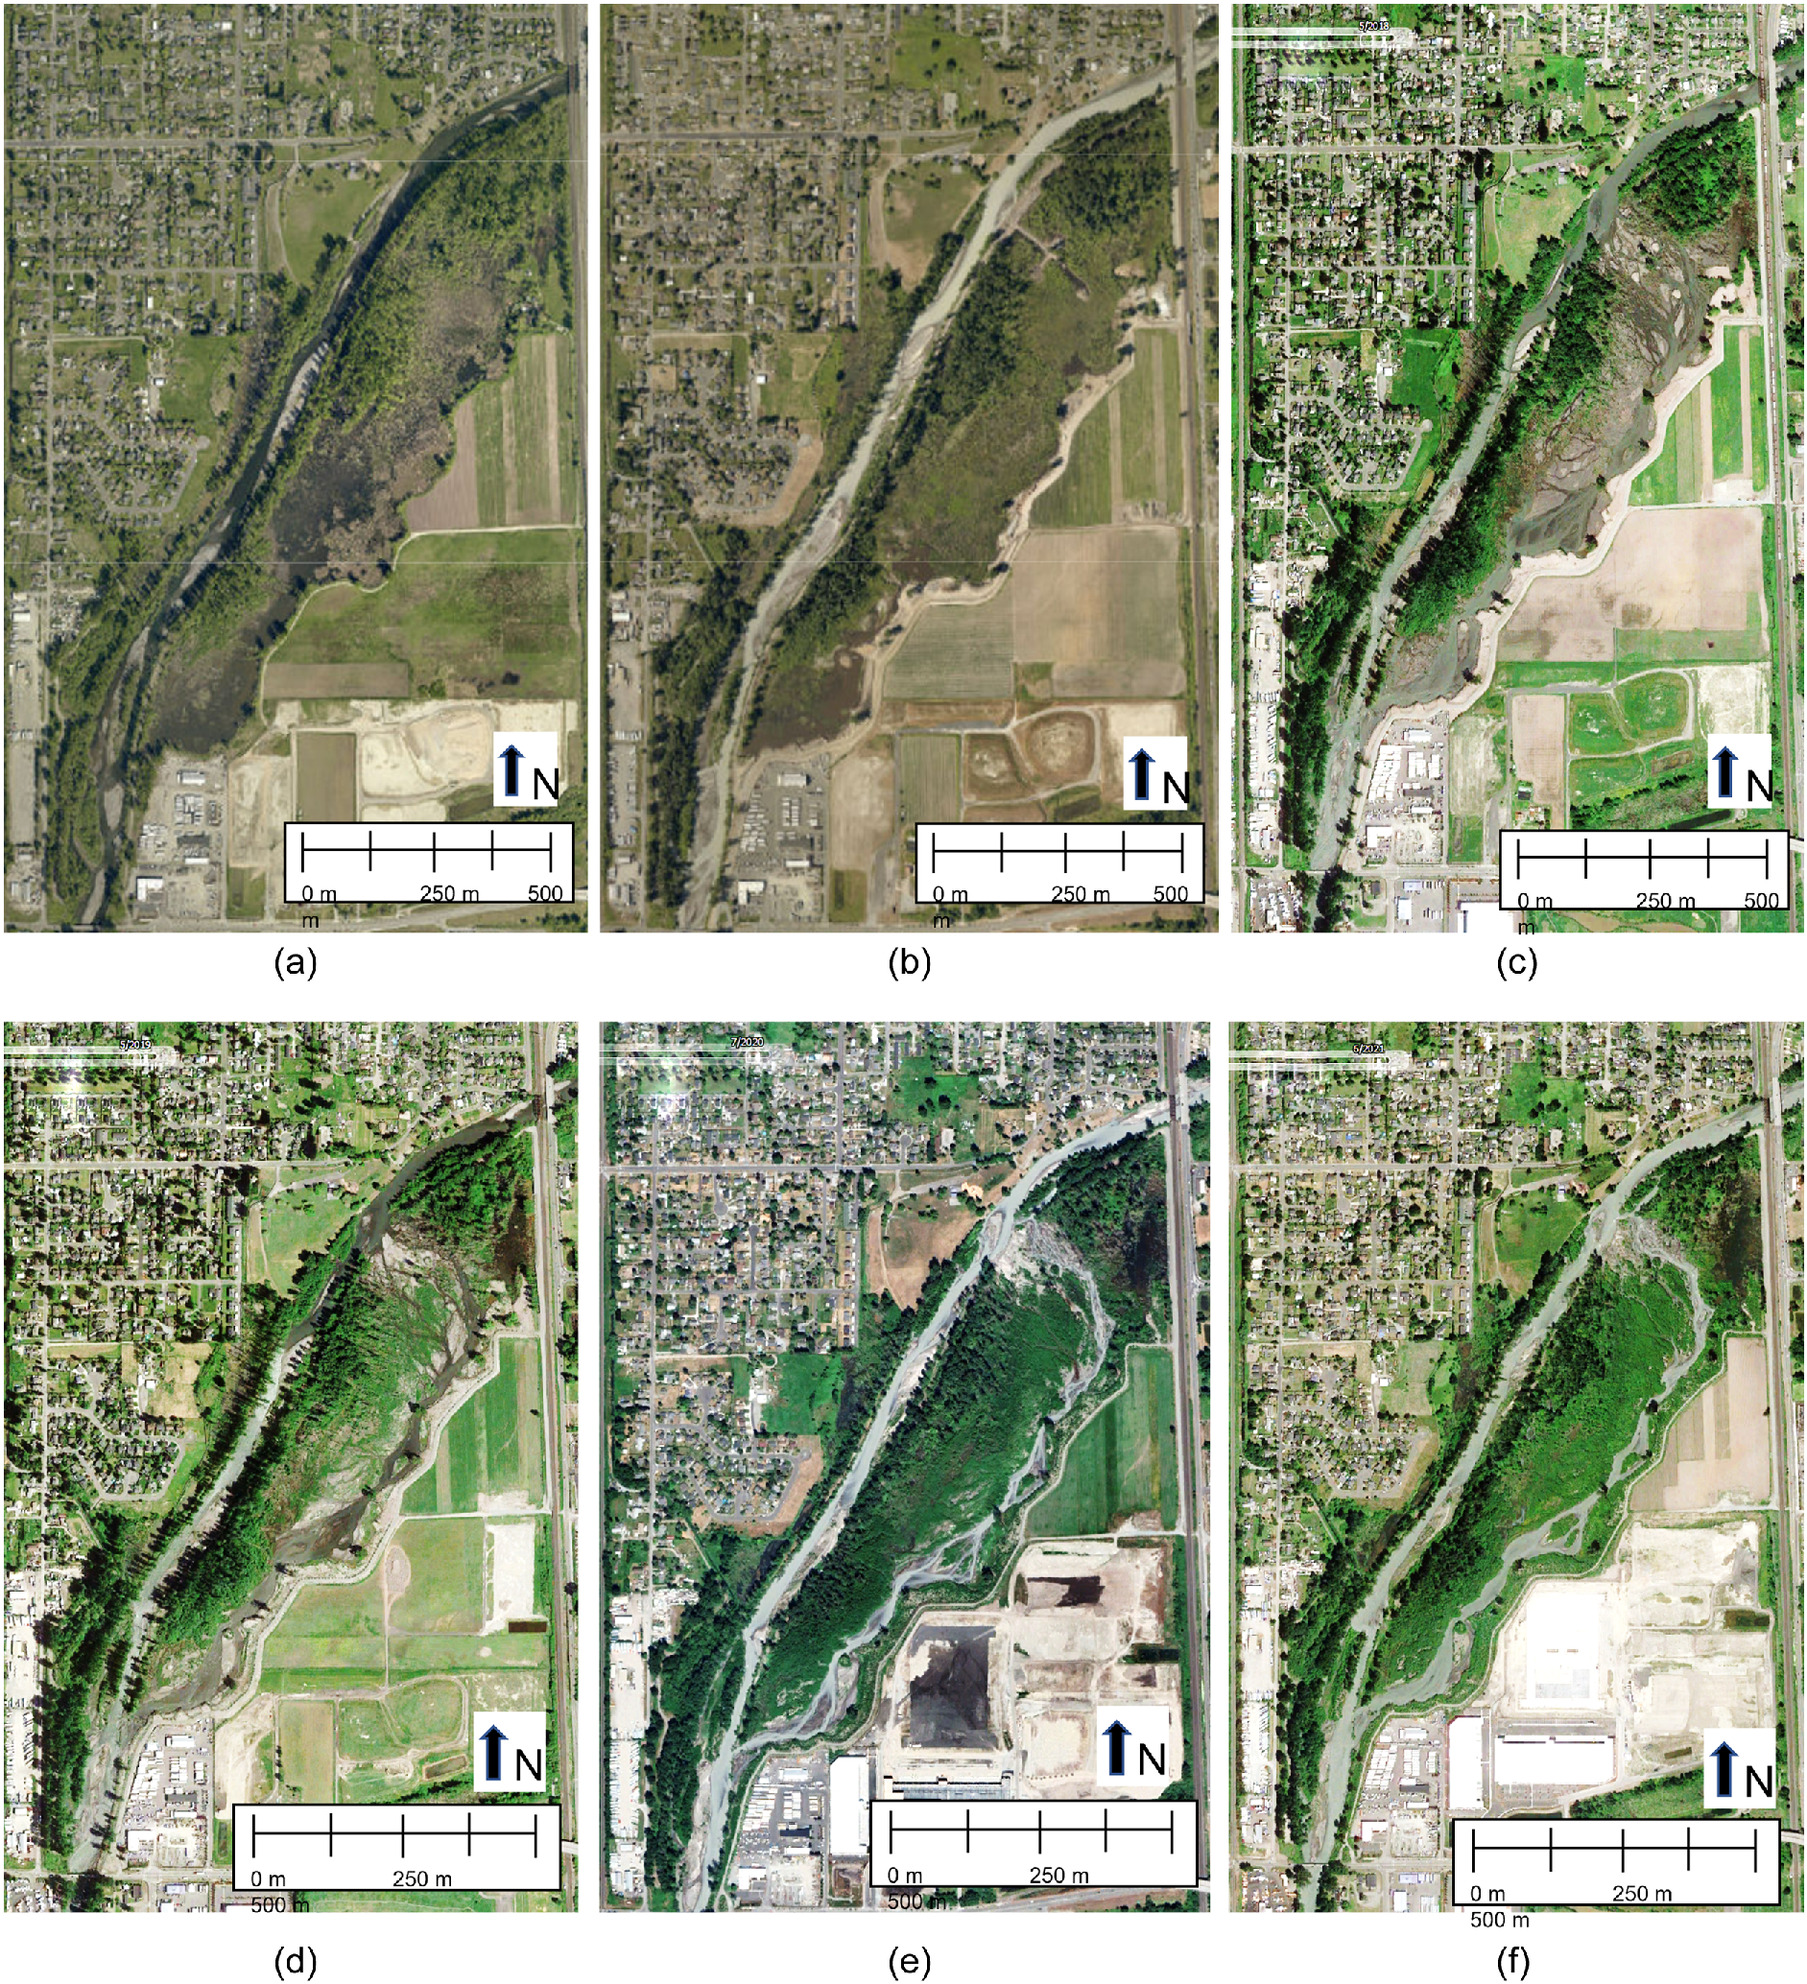
White River flow first entered the levee setback area in October 2017, when river flow increased from 12.5 to and remained high for a week. Water diverted across the full width of the 445-m notch into the setback area [Figs. 5(a–c)]. During the October flood that initiated flow into the setback area, 56% of the main channel flow (median value) was diverted into the setback area at a 90° angle to the main channel (Table 1).
| Start year | End year | Channela | Floodplaina | Totala | Bifurcation angle of main flow path (degrees) | Flow diverted from main to side channel (%) | Sediment diverted from main to side channel (%) |
|---|---|---|---|---|---|---|---|
| October, 2017 | — | — | — | — | 90 | 56 | 34 |
| 2018 | 112,900 | 112,800 | 85 | 63 | 43 | ||
| 2018 | 2019 | 11,800 | 18,200 | 30,000 | 80 | 58 | 36 |
| 2019 | 2020 | 700 | 70 | 76 | 55 | ||
| 2020 | 2021 | 15,800 | 5,100 | 55 | 76 | 59 | |
| Cumulative net change () | 1,700 | 141,200 | 142,900 | — | — | — | |
a
Net volume difference ().
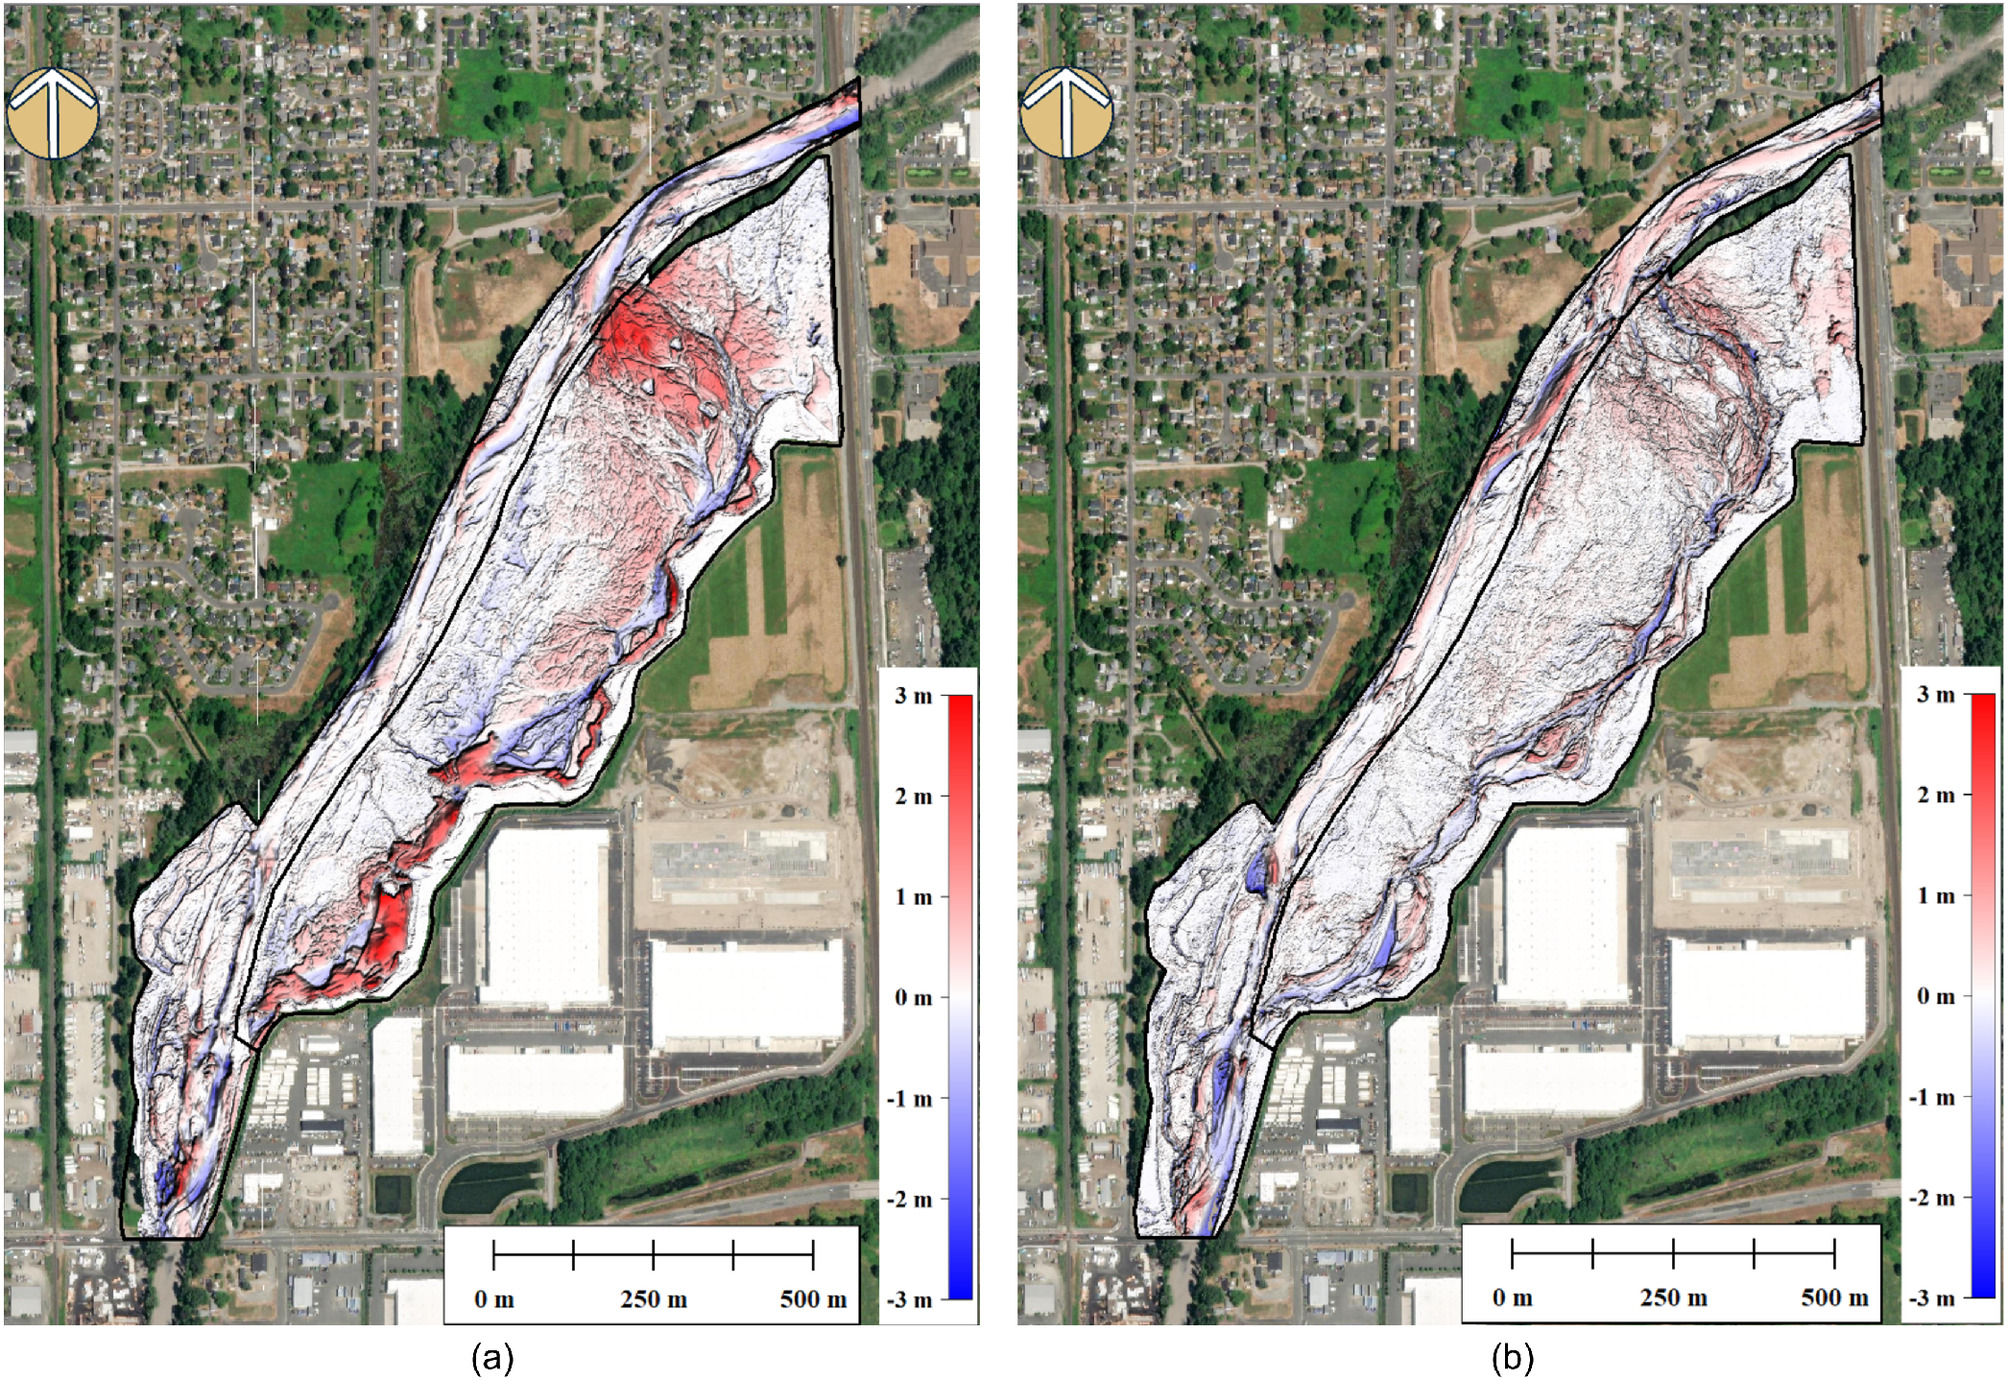
March 2018 LiDAR was taken at the end of the high-flow season and after three flow events that exceeded . Over the first 5 months of connection, water and sediment were diverted into the setback area with the dominant flow path angled 85° from the main channel (Fig. 6). Two ELJ are shown in Figs. 6(b and c) and identified in Fig. 6(b). The open line in Fig. 6(a) is the side channel entrance, and its cross section is shown in Fig. 7. Two dashed open lines in Fig. 6(a) correspond to the longitudinal profiles in Fig. 8. Fig. 6(b) shows the high bifurcation angles and dominant flow path. Fig. 6(c) shows the 2021 bifurcation angle identified on the 2020 image. The percentage of main channel flow diverted increased to a median of 63% during this time frame. Once in the setback area, the majority of the diverted flow followed the path of the former construction access road along the far edge of the setback area.
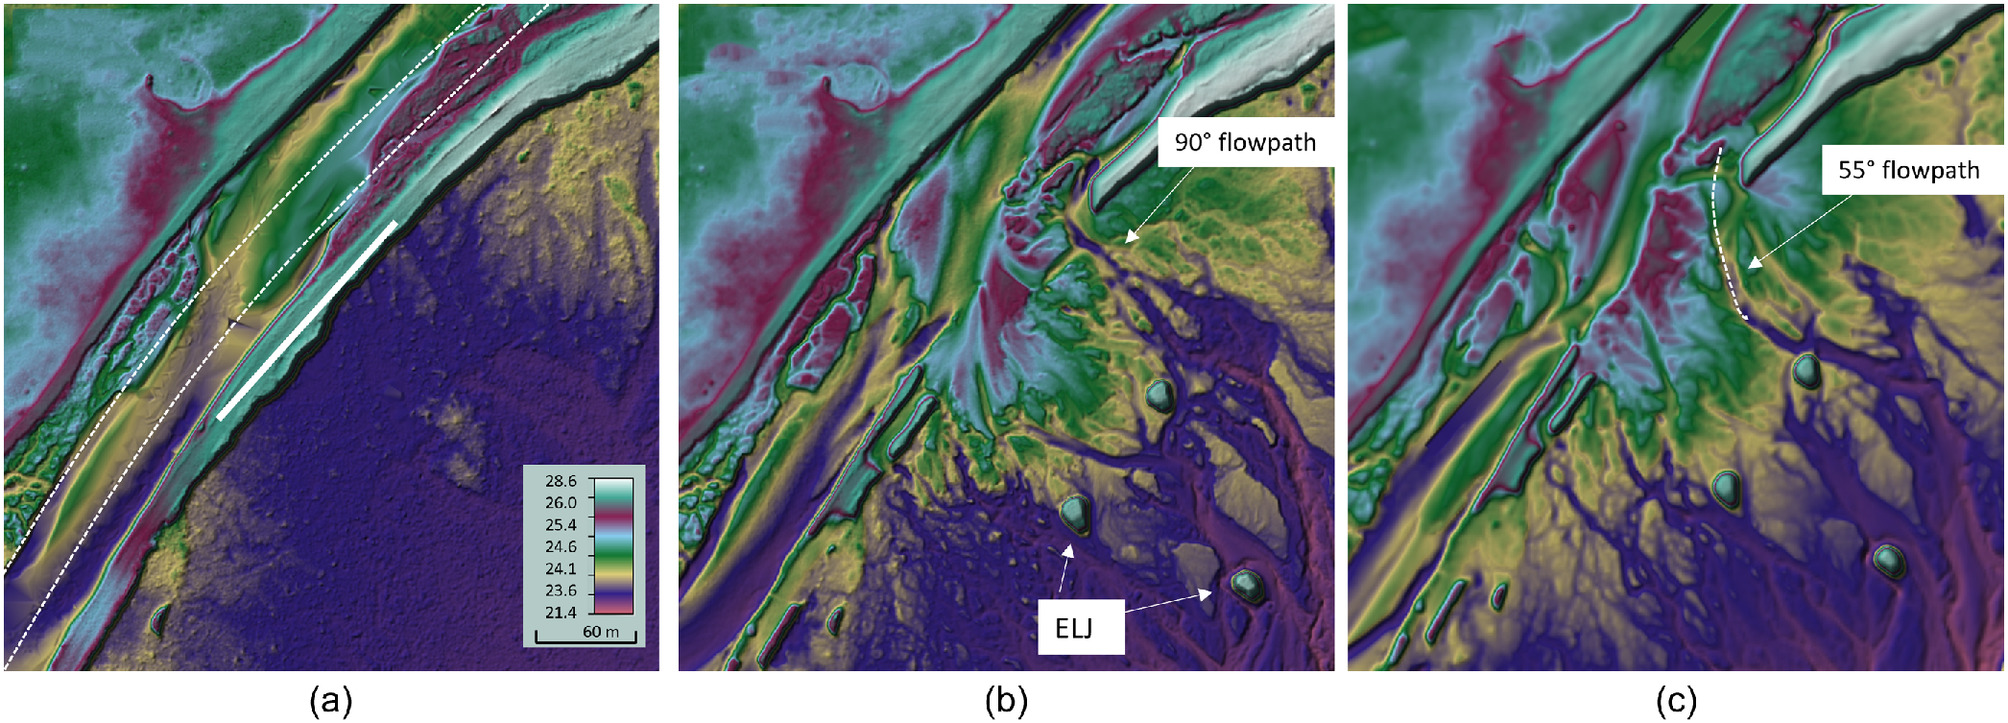
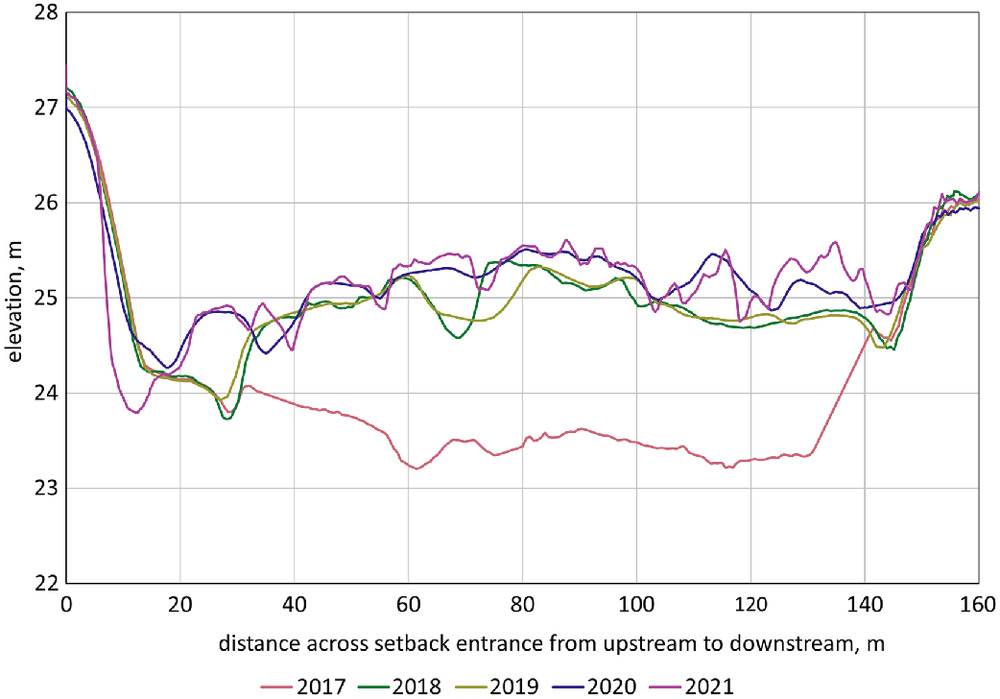
Most of the channel bed change at the setback entrance occurred as deposition between October 2017 and March 2018 (Fig. 6). Deposition over the first 5 months aggraded 1–2 m across the width of the notched bank and reduced the entrance flow area by (Fig. 7). Deposition extended into the setback area, creating a fan shaped deposit. The exception was the portion of the entrance area corresponding to the 80°–90° flow path, which remained unchanged.
The May 2018 aerial [Fig. 5(c)] provides insight into the initial morphology adjustments within the whole setback area. The flow rate at the time of the image was , declining from a peak of . Multiple small channels flowed from the main channel across the entrance into the setback area and would have been engaged in transporting water and fine sediment. Through the midsection of the setback area, small rivulets drain water toward the side channel along the revetment. These small individual flows converged into a wide braided channel along the eastern revetment, joining the flow that entered from the setback entrance and following the path of the former construction road. The side channel has remained along the eastern revetment with a pattern characterized by alternating multithread and single-thread reaches.
Wood has the potential to affect change in channel planform where it blocks a significant amount of the channel cross section (Redolfi et al. 2021). The large wood jams included in the setback design have created localized areas of channel braiding. Tree and shrub planting began in autumn 2017 in the area of the former construction path and along the biorevetment. When surveyed in autumn 2018, the area around the side channel had 18% plant cover (Lincoln et al. 2020). Overall, the majority of the vegetation within the setback were those plants not disturbed by the project.
The only high flow between March 2018 and March 2019 peaked at . There was little change in the entrance channel morphology, and the main flow path into the setback area remained at a high 80° angle to the main channel (Table 1). Side channel and setback vegetation developed during the second year, possibly in response to fewer disruptive flood events and reduced flow diversion from the main channel to a median of 58%. Planting continued in the setback area, and vegetation growth had expanded over the middle area of the setback. The average tree and shrub cover in the setback area increased from 18% in 2018 to 30% in 2019 (Lincoln et al. 2020). By the end of the second flood season in 2019, many of the smaller channels in the setback area coalesced into fewer, more permanent flow paths [Fig. 5(d)]. The overall planform of the side channel was becoming a single-thread to multithread with variable width and midchannel gravel bars where the side channel widened [Figs. 5(d–f)]. Some of the midchannel bars had seasonal vegetation growth.
During the third and fourth years of monitoring, from March 2019 through March 2021, the morphology of the setback channel continued to coalesce into a single-thread channel with areas of vegetated midchannel gravel bars [Figs. 5(e and f)]. Tree and shrub cover in the setback area continued to increase with time and reached 35% of the area by 2021 (King County 2022). The setback channel morphology had not been impacted by wood transported into the setback area or contributed from setback planting, although this may occur in future years as the transported wood forms log jams in the channel. The main flow path shifted as high flow rates occurred and bar movement in the main channel affected flow direction.
Two high-flow events occurred winter 2020; one peaked at and the second peaked at and remained above for 5 days. One flow over bankfull occurred in 2021 with a peak flow rate of . Deposition within and adjacent to the setback entrance enabled formation of multiple shallow flow paths and shifted the direction of the main flow path (Fig. 6). Between 2019 and 2020, there was of net aggradation over the cross section defining the entrance to the setback, with the majority of the deposition in the formerly dominant pathway, which aggraded by 0.5 m (Fig. 7).
The dominant flow path from main channel into the side channel reduced from 80° to 70° in 2020 and to 55° in 2021 [Fig. 6(c)]. Flow entering at an 85°–90° angle was diverted by a channel bar and passed around the upstream edge of the channel bank to create a backwater between the bank and setback area that was later colonized by beavers. Thus, the majority of the flow into the side channel entered the setback at a lower angle. Flow diversion for both years was 76% of the main channel flow rate, and there was little net change in the entrance cross-sectional area between 2020 and 2021 (Table 1).
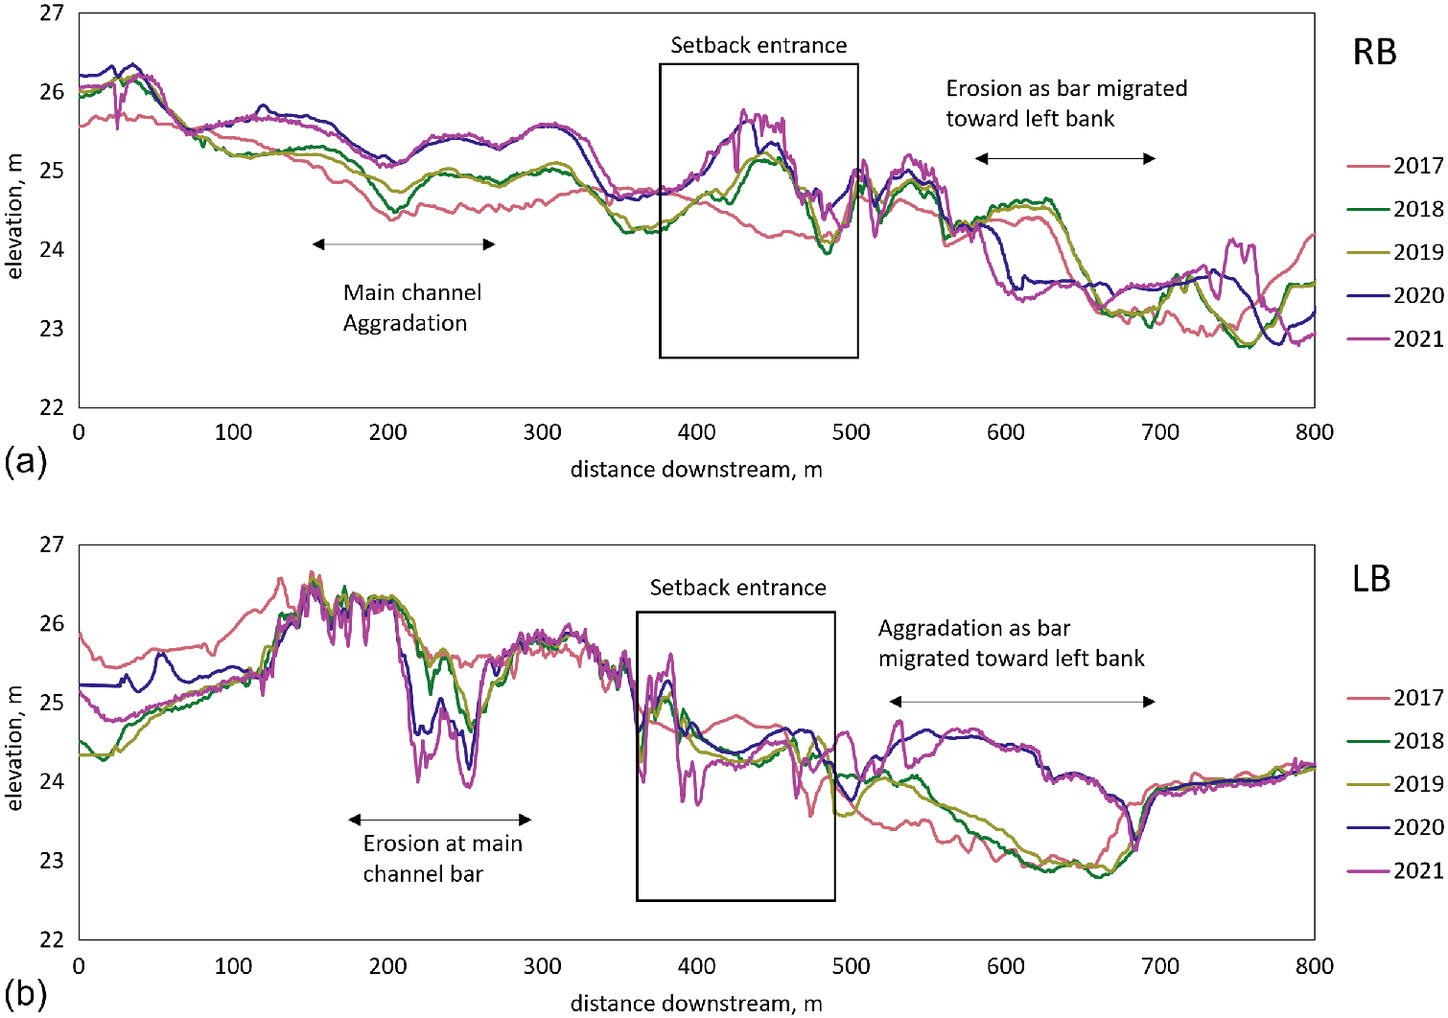
Sediment processes of deposition, erosion, and partial transport affected the main channel bed differently depending on proximity to the setback entrance and the hydraulic changes associated with the flow bifurcation. The impact of the setback was immediately noticeable because main channel bed erosion occurred with gravel bar mobility. Repeat cross sections indicated up to 1 m of erosion from the main channel bed over the first year (Lincoln et al. 2020). Increased sediment mobility was noticeable throughout the main channel over the monitoring years as gravel bars formed and eroded. Longitudinal profiles to the right and left of the channel midline were measured from the repeat LiDAR to identify and illustrate changes in the main channel bars and bed over the reach (Fig. 8).
In the main channel, immediately upstream of the setback entrance, a midchannel bar began forming within the first year of the setback over an area extending from 0.6 m from the entrance of the setback to approximately 305 m upstream [Fig. 8(a)]. This bar became a depositional site for wood in subsequent years (King County 2022). In the same area, over the left third of the main channel, the bed eroded 1.5 m as a chute cut through a preexisting channel bar to flow into the setback area [Fig. 8(b)].
Downstream of the setback, main channel aggradation and erosion were measured over a distance of 150 m and were primarily associated with a shift in the location of the main flow thread relative to a large gravel bar. The bar eroded on its right side while aggrading and growing laterally toward the left bank. The right bank longitudinal profile [Fig. 8(a)] illustrates erosion of the right edge of the gravel bar, and the left bank longitudinal project [Fig. 8(b)] illustrates deposition as the channel bar expanded toward the left bank. Downstream of the levee setback project, the White River bed elevation fluctuated with the transport of gravel bars through the channel.
The sediment rating curve calibrated to 2010 bed-load transport samples was used to determine potential sediment transport rates in the main channel and the setback area. As the relative amount of flow diverted into the side channel increased over the years, the potential diversion of sediment from the main channel increased from 34% to 59% (Table 1). The continued exchange and transport of sediment through the setback area and main channel was inferred from an analysis of repeat LiDAR for each year through 2021 (Fig. 9) (Lincoln et al. 2020) as bathymetric changes around the entrance to the setback area modulated the volumes of water and sediment transported into the setback area versus downstream in the main channel. Elevation changes measured over the setback area indicated a large area of land being repeatedly reworked and an increase in overall topographic complexity.
Global Mapper version 25 was used to difference sequential LiDAR images, taken in March of each year. Net changes in elevation were interpreted as indicators of sediment storage in the project area. The project area was divided into the main channel and the setback area (Fig. 9), and sediment storage change estimates from within the main channel were inferred from topography changes at exposed channel bar areas. The largest volumes of net erosion and deposition in the study reach occurred during the first year, as the channel morphology in the setback area was developing (Table 1). After the high flows, from October 2017 through March 2018, net erosion of was measured from the LiDAR in the main channel and net deposition of was measured over the setback area. The deposition was estimated to be predominantly sand-sized with only approximately 0.5% of the total amount to be gravel (Lincoln et al. 2020). Gravels transported into the setback were deposited across the setback entrance, contributing to the aggradation and formation of gravel bars around the entrance.
In contrast to 2017 and 2018, there was a small amount of net sediment deposition in the main channel and net erosion from the setback area in 2019. Gravels initially deposited at the setback entrance were remobilized and transported further downstream in subsequent years, helping create and maintain gravel bars in the side channel. Flows in 2020 and 2021 included peak events similar to those in 2017. Measured volumes of net erosion and deposition indicate transport of the majority of the sediment stored in the main channel since 2018 and significant deposition over the floodplain area. The overall net change was more than of sediment stored in the floodplain area.
When compared, the sediment volume predicted to transport into the setback area from the flow ratio was smaller than the net sediment volume differences inferred from the LiDAR analysis. However, the differenced LiDAR is mirroring changes in the surface elevation, which include deposition, erosion, and general reworking of the ground surfaces with sediment movement within the project area. The overall trend predicted from the flow ratios, including the fluctuations in sediment diversion to the setback area by year, matched the general trend in measured net deposition.
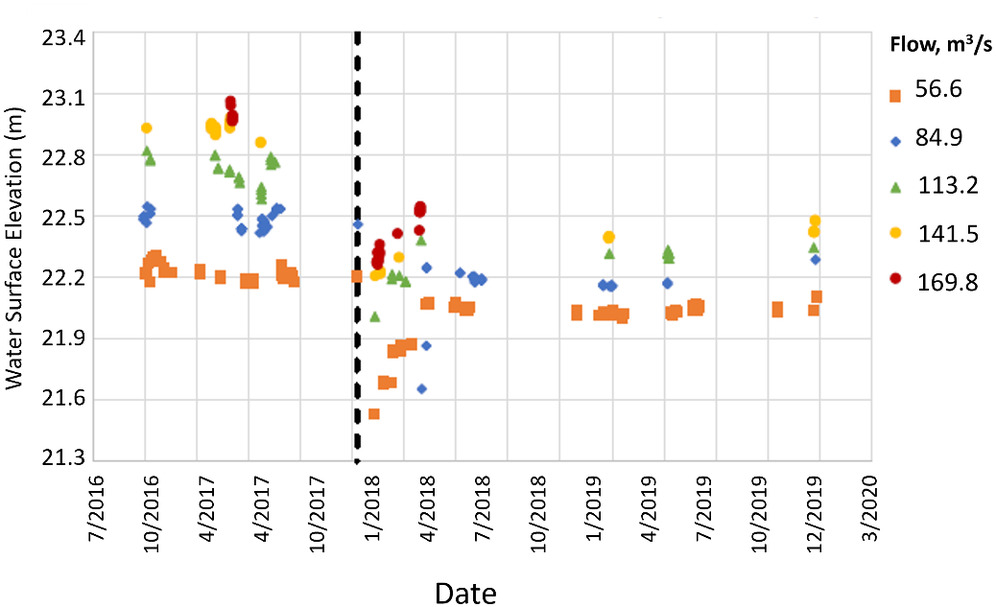
The extent of flood risk reduction following the levee setback was evaluated from the change in water surface elevations as recorded at USGS Gauge 12100498 for flows up to . The impacts of the diversion of water and sediment into the setback area are illustrated by comparing the water surface elevation of current flows with similar flows from prior to the setback project. The water surface elevation in the mainstem White River decreased by up to 0.6 m (Fig. 10), and the theoretical overbank flow rate has increased from 140 to (King County 2017). The decreases in water surface elevations were immediate after the setback was completed and have been sustained through the monitoring period. It may be reasonably assumed that by redirecting deposition to the setback area, continued channel aggradation, and any associated increase in flood risk, was largely averted.
Diversion Side Channels and Channel Bifurcations
The life cycle of natural and constructed side channels and channel diversions has been studied more extensively than those associated with levee setbacks (e.g., Hooke 2003; Toonen et al. 2012; Ferrer-Boix et al. 2021). Laboratory studies of flow diversions and field studies of side channels have correlated the hydraulics and sediment processes at the entrance to the diversion to the proportion of flow diverted and the angle of the flow diversion (Constantine et al. 2010; Dutta et al. 2017; Alomari et al. 2018, 2020). The reconnection of the levee setback area to the White River enabled a side channel to form but did not predetermine either the diversion angle or the path of the side channel. Side channel formation within the White River setback area indicated similarity between the processes at natural or constructed side channels and those acting on the setback area. This indicates that information from life-cycle studies of natural and constructed side channels and channel diversions may be used to inform and predict the evolution of side channels within a levee setback.
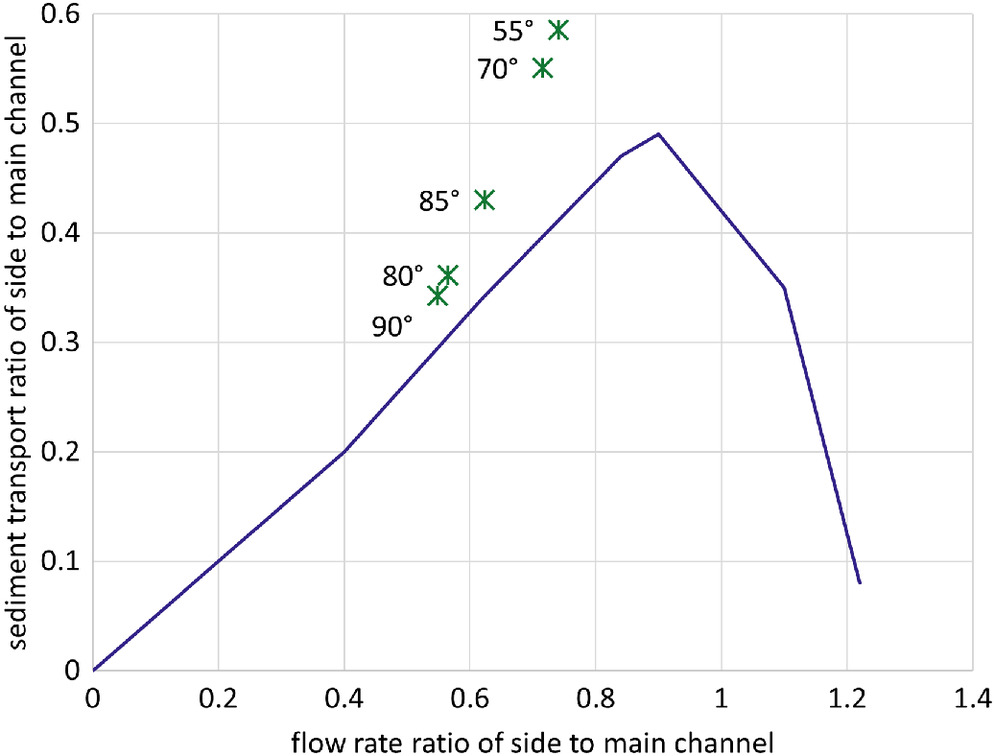
At a 90° forced channel bifurcation, the amount of bed load diverted into the side channel was shown in laboratory studies to increase as the proportion of main channel flow diverted into the side channel increased (Fig. 11) (Barkdoll et al. 1999; Herrero et al. 2015). However, hydraulics generated at a channel bifurcation reduced the sediment transport capacity of the flow as it passed into the side channel. As a result, sediment deposited at the side channel entrance and within the side channel just downstream of the entrance. At fixed 90° bifurcations, deposition continued when more than half the main channel flow was being diverted into the side channel, essentially turning the side channel into the main channel. When this occurred, bars eroded and sediment transported further downstream (Fig. 11) (Barkdoll et al. 1999; Alomari et al. 2020).
For the first 2 years following reconnection of the White River to the setback area, flow diverted across the notched area of the left bank into the setback area at an 80°–90° angle. Over the same time frame, the area of the channel entrance decreased by as gravels deposited across the entrance (Fig. 7) and setback area (Fig. 9) with the exception of the main flow path. Gravel bars formed in the main flow path within 100 m of the setback entrance and in the main channel just upstream of the setback entrance (Figs. 6 and 8). The pattern of deposition and bar growth in the main channel and dominant side channel agrees with the laboratory findings for high-angle flow bifurcations. (Herrero et al. 2015; Alomari et al. 2018, 2020).
The data from the White River are plotted against the relation for 90° side channels established by Barkdoll et al. (1999) in Fig. 11. When the main flow path was at a high diversion angle, the White River data plot near what would have been predicted. The lack of high flows, as well as the reduction in sediment transport far into the side channel, led to limited reworking of the setback area during the first 2 years. The side channel developed a stable morphology.
After 2 years, the main flow path into the White River side channel reduced to 70° and then 55° as the gravel bars around the entrance adjusted during high-flow events (Fig. 6). Existing field data studies from natural side channels indicated that the sediment will transport further into a side channel when the bifurcation from the main channel is at a lower angle (Constantine et al. 2010; Shields and Abt 1989). Those studies found that an alternate bar sequence formed through the side channel over time as the sediment transported into the side channel deposited. The processes appear to have been similar at the White River. As the bifurcation angle reduced, the percent of main channel flow diverted into the setback area increased to 76% and the sediment transport to 59%.
Despite the increase in diverted sediment, the morphology of the setback area remained substantially unchanged with minimal topographic reworking (Fig. 9). Deposition and erosion continued to alter the entrance and setback areas, but to a lesser amount than when the setback area was first connected. Beaver activity was noted in the setback area over this time period, which may be connected to wood influx to the setback area with the larger flow diversions. The White River data diverged from the predictive relation between diverted flow and sediment for 90° diversions, illustrating the importance of the diversion angle on the rate of flow and sediment transported into the side channel (Fig. 11).
The patterns of bar formation and sediment transport into the Countyline levee setback area compared well with what has been measured in flow diversion research (Herrero et al. 2015; Bertoldi 2012; Barkdoll et al. 1999) and measured at natural side channels (Constantine et al. 2010; Shields and Abt 1989) but did not follow a single previously described trajectory. Previous research has focused on the sediment processes and related hydraulics near the entrance and through the side channel with a flow diversion that was either high or low angle to the main channel. Laboratory studies fixed the side channel angle within the flume setup, whereas field studies measured channels at only one point in time. Accordingly, the past studies examined the processes for a single side channel bifurcation angle.
By monitoring the progression of the setback area and side channel over 4 years, the White River case study has illustrated the ability of a channel to adjust to high deposition around the side channel entrance by reducing the angle of the dominant flow diversion into the side channel. Thus, the processes in the White River levee setback fit into the patterns established by previous studies and showed that there can be progression in the diversion angle, which has not been previously recognized. The White River case illustrates the importance of a large setback entrance area and a natural flow regime that includes high-flow events for the evolution and persistence of the setback entrance.
Summary and Conclusions
Setback projects are an increasingly popular means of achieving the dual goals of flood risk reduction and ecosystem restoration in areas where channels have been restricted from much of their natural floodplain area by levees on or adjacent to channel banks. The channel in the study reach of the White River in Washington State prior to the levee setback was an aggrading, laterally constrained, single-thread channel with alternate bars. The White River Countyline Levee Setback Project removed the majority of the levee separating the left bank of the main channel from 49 ha of mixed open space and forested wetlands. An entrance to the setback area was created by lowering 445 m of the left channel bank near the upstream end of the setback reach.
The study area was monitored for 4 years after the White River setback project was completed. The connection between the main and side channel, the major flow paths across the side channel entrance, and the evolution of side channel morphology were analyzed from aerial imagery, field surveys, USGS stream gauge data, and by differencing repeat LiDAR surveys. A two-dimensional hydraulic model developed during project design was updated with postproject flows and topography and used to determine the percent of main channel flow diverted and to measure the angle of the dominant flow path across the setback entrance each year.
The flow and sediment transport patterns at the setback entrance and throughout the side channel exhibited similarities to previously defined patterns for both diversions and side channels, because the processes driving changes at the setback did not follow a single previously defined trajectory. For the first 2 years following reconnection of the White River to the setback area, flow diverted across the notched area of the left bank at an 80°–90° angle, and a side channel formed through the setback area. The reach was without large-flow events in the second year, and tree and shrub cover increased in the setback area where the side channel had developed as a single thread with midchannel bars. Deposition around the setback channel entrance led to the formation of gravel bars in the main channel upstream of the setback entrance and within the side channel near the setback entrance.
The amount of sediment and flow diverted from the main channel and the formation of gravel bars around the entrance fit with what would have been expected from previous research on 90° channel bifurcations. Existing research suggested that deposition would continue and form a plug across the side channel entrance, separating the side channel from the main channel, or alter the course of the main channel entirely. Instead, high-flow events during the third and fourth years of monitoring mobilized the deposits, reset the gravel bars, and reduced the angle of the flow path into the side channel to 55° from the main channel. A greater amount of sediment was diverted further into the side channel. For the third and fourth years of monitoring, the White River setback area more closely followed the processes identified by existing literature for lower angle side channels. Thus, the processes in the White River levee setback fit into the patterns established by previous studies for both high-angle and lower angle side channels and showed that there can be progression in the diversion angle, which has not been previously recognized.
A natural flow regime that included high-flow events and a large entrance area were important for the evolution and persistence of the side channel within the levee setback area. This case study shows that if the natural flow regime includes high-flow events, and the entrance reach into the setback area does not constrain the side channel connection, the bifurcation angle of the main flow path will adjust to maintain a side channel. Existing literature on side channels and forced channel bifurcations has provided insight into the rates of flow and sediment transport that may be expected upon channel reconnection, but these are dependent on an established setback angle. These analogies can also aid in setting expectations for the amount of sediment transported far into a side channel and the deposition of sediment bars around a setback entrance and within the side channel, depending on the setback angle.
What has not been fully recognized is the ability of the channel to adjust the setback angle. When deposition and growth of sediment bar at the channel entrance for a high-angle bifurcation impairs transport into the side channel, high flows will reduce the angle of the main flow path to mobilize and transport sediment further into and through the side channel. Where setbacks are engineered, this case study illustrates the importance of longer monitoring prior to any consideration of costly interventions at the side channel entrance. Over time, the side channel in a levee setback may perform its own adaptive management.
Data Availability Statement
All data and models that support the findings of this study are available from the corresponding author upon reasonable request.
Acknowledgments
Funding for this study was provided by the US Army Corps of Engineers Flood and Coastal Systems Research and Development Program under the “Evaluation of Levee Setbacks and River Restoration Projects for Flood Risk Reduction” work unit and the Geophysical Computational Modeling Program. The authors greatly appreciate the data and insights provided by King County, particularly Chris Brummer, as well as the suggestions made by four reviewers, which have much improved the text.
References
Alomari, N. K., B. Yusuf, T. A. Mohammad, and A. H. Ghazali. 2018. “Experimental investigation of scour at a channel junctions of different diversion angles and bed width ratios.” Catena 166 (Jan): 10–20. https://doi.org/10.1016/j.catena.2018.03.013.
Alomari, N. K., B. Yusuf, T. A. Mohammad, and A. H. Ghazali. 2020. “Influence of diversion angle on water and sediment flow into diversion channel.” Int. J. Sediment Res. 35 (6): 600–608. https://doi.org/10.1016/j.ijsrc.2020.06.006.
Anderson, S. W., and K. L. Jaeger. 2021. “Coarse sediment dynamics in a large, glaciated river system: Holocene history and storage dynamics dictate contemporary climate sensitivity.” GSA Bull. 133 (5–6): 899–922. https://doi.org/10.1130/B35530.1.
Arnold, J. L. 1988. The evolution of the 1936 Flood Control Act. Washington, DC: USACE.
Arthur D. Little, Inc. 1973. Vol. I of Report on channel modifications, 394. Washington, DC: Council on Environmental Quality.
Barkdoll, B. D., R. Ettema, and A. J. Odgaard. 1999. “Sediment control at lateral diversions: Limits and enhancements to vane use.” J. Hydraul. Eng. 125 (8): 862–870. https://doi.org/10.1061/(ASCE)0733-9429(1999)125:8(862).
Bartell, S. M., C. T. Woodard, C. H. Theiling, and T. A. Dahl. 2020. Development and application of the CASM-SL to support nutrient management in potential Sangamon River Levee setbacks. ERDC TR-20-9. Vicksburg, MS: US Army Engineer Research and Development Center.
Beechie, T., et al. 2013. “Restoring salmon habitat for a changing climate.” River Res. Appl. 29 (8): 939–960. https://doi.org/10.1002/rra.2590.
Beechie, T. J., M. Liermann, M. M. Pollock, S. Baker, and J. Davies. 2006. “Channel pattern and river-floodplain dynamics in forested mountain river systems.” Geomorphology 78 (1–2): 124–141. https://doi.org/10.1016/j.geomorph.2006.01.030.
Bertoldi, W. 2012. “Life of a bifurcation in a gravel-bed braided river.” Earth Surf. Processes Landforms 37 (12): 1327–1336. https://doi.org/10.1002/esp.3279.
Beuchert, E. W. 1965. “State regulation of channel encroachments.” Nat. Resour. J. 4 (3): 486–521.
Bountry, J. A., J. E. Godaire, R. E. Klinger, and D. R. Varyu. 2009. Geomorphic analysis of the Skokomish River, Mason County, Washington. SRH-2009-22. Denver: US Department of the Interior.
Constantine, J. A., S. R. McLean, and T. Dunne. 2010. “A mechanism of chute cutoff along large meandering rivers with uniform floodplain topography.” Geol. Soc. Am. Bull. 122 (5–6): 855–869. https://doi.org/10.1130/B26560.1.
Corum, Z., K. Jones, and T. Dahl. 2023. “Practical evaluation of USACE sediment models on the Lower White River in Washington State—Case study of the Countyline Levee Setback Project.” In Proc., SEDHYD 2023. Denver: US Bureau of Reclamation.
Czuba, J. A., C. R. Czuba, C. S. Magirl, and F. D. Voss. 2010. Channel-conveyance capacity, channel change, and sediment transport in the lower Puyallup, White, and Carbon Rivers, western Washington. Washington, DC: USGS.
Czuba, J. A., C. S. Magirl, C. R. Czuba, C. A. Curran, K. H. Johnson, T. D. Olsen, H. K. Kimball, and C. C. Gish. 2012. Geomorphic analysis of the river response to sedimentation downstream of Mount Rainier, Washington. Washington, DC: USGS.
Dahl, T. A., C. H. Theiling, and W. Echevarria. 2017. Overview of levee setback projects and benefits. Vicksburg, MS: US Army Engineer Research and Development Center.
Dierauer, J., N. Pinter, and J. W. Remo. 2012. “Evaluation of levee setbacks for flood-loss reduction, Middle Mississippi River, USA.” J. Hydrol. 450 (Sep): 1–8. https://doi.org/10.1016/j.jhydrol.2012.05.044.
Dutta, S., D. Wang, P. Tassi, and M. H. Garcia. 2017. “Three-dimensional numerical modeling of the Bulle effect: The nonlinear distribution of near-bed sediment at fluvial diversions.” Earth Surf. Processes Landforms 42 (14): 2322–2337. https://doi.org/10.1002/esp.4186.
ESRI (Environmental Systems Research Institute). 2023. “World imagery.” Accessed November 7, 2023. https://services.arcgisonline.com/ArcGIS/rest/services/World_Imagery/MapServer.
Ferrer-Boix, C., J. B. Oliva, J. P. Martín-Vide, and A. Ollero. 2021. “Alluviation of a side-channel by bed material load. Field measurements and modeling.” Geomorphology 389 (Jan): 107801. https://doi.org/10.1016/j.geomorph.2021.107801.
Guida, R. J., J. W. Remo, and S. Secchi. 2016. “Tradeoffs of strategically reconnecting rivers to their floodplains: The case of the Lower Illinois River (USA).” Sci. Total Environ. 572 (Jun): 43–55. https://doi.org/10.1016/j.scitotenv.2016.07.190.
Haring, C., R. Schielen, J. Guy, L. Burgess-Gamble, and B. Bledsoe. 2021. “Chapter 16: Fluvial systems and flood risk management.” In International guidelines on natural and nature-based features for flood risk management, edited by T. S. Bridges, J. K. King, J. D. Simm, M. W. Beck, G. Collins, Q. Lodder, and R. K. Mohan, 780–802. Vicksburg, MS: US Army Engineer Research and Development Center.
Herrera Environmental Consultants. 2014. Basis of design report for White River at Countyline Levee Setback Project, 66. Seattle: King County Department of Natural Resources and Park.
Herrero, A., A. Bateman, and V. Medina. 2015. “Water flow and sediment transport in a 90° channel diversion: An experimental study.” J. Hydraul. Res. 53 (2): 253–263. https://doi.org/10.1080/00221686.2014.989457.
Hooke, J. 2003. “Coarse sediment connectivity in river channel systems: A conceptual framework and methodology.” Geomorphology 56 (1–2): 79–94. https://doi.org/10.1016/S0169-555X(03)00047-3.
Jones, K. E., T. A. Dahl, and Z. P. Corum. 2018. Modeled sedimentation in the lower White River Countyline Levee Setback, Washington State: Comparison of 1D (HEC RAS) and 2D (AdH) Results. ERDC-CHL TR-18-9. Vicksburg, MS: USACE.
Keller, E. A. 1975. “Channelization: A search for a better way.” Geology 3 (5): 246–248. https://doi.org/10.1130/0091-7613(1975)3%3C246:CASFAB%3E2.0.CO;2.
King County. 2017. Lower White River 2009–2016 in-channel sediment monitoring. Prepared by Terry Butler, Fred Lott, and Chris Brummer. Seattle: King County Department of Natural Resources and Parks.
King County. 2022. Countyline Levee Setback Project: Year 3 monitoring report (2020). Prepared by Alex Lincoln, Zanna Doak, and Judi Radloff. Seattle: King County Water and Land Resources Division.
Landwehr, K., and B. L. Rhoads. 2003. “Depositional response of a headwater stream to channelization, east central Illinois, USA.” River Res. Appl. 19 (1): 77–100. https://doi.org/10.1002/rra.699.
Lincoln, A., J. Radloff, S. Shelton, H. Karlsson, L. Russell, F. Lott, and K. Bauman. 2020. Countyline Levee Setback Project year 1 and 2 monitoring report, 86. Seattle: King County Department of Natural Resources and Parks.
McCarthy, S., C. Gregersen, J. Wilhelm, D. Lantz, S. Shelton, A. Lincoln, J. Radloff, H. Karlson, L. Russell, and F. Lott. 2020. Countyline Levee Setback Project baseline monitoring report, 49. Seattle: King County Department of Natural Resources and Parks.
McQueen, R., P. Ashmore, T. Millard, and N. Goeller. 2021. “Bed particle displacements and morphological development in a wandering gravel-bed river.” Water Resour. Res. 57 (2): e2020WR027850. https://doi.org/10.1029/2020WR027850.
NOAA and NCEI (National Centers for Environmental Information). 2023. “US billion-dollar weather and climate disasters.” Accessed December 10, 2023. https://www.ncei.noaa.gov/access/billions/.
Nunnally, N. R., and F. D. Shields. 1985. Incorporation of environmental features in flood control channel projects. Vicksburg, MS: US Army Engineer Waterways Experiment Station.
Prych, E. A. 1988. Flood-conveyance capacities and changes in channels of the lower Puyallup, White, and Carbon Rivers in western Washington. Washington, DC: USGS.
Puget Sound River History Project. 2003. White River Orthophotos–1931. Seattle: Univ. of Washington.
Redolfi, M., M. Musa, and M. Guala. 2021. “On steady alternate bars forced by a localized asymmetric drag distribution in erodible channels.” J. Fluid Mech. 916 (Jan): A13. https://doi.org/10.1017/jfm.2021.122.
Reuter, M., K. Lubinski, P. West, D. Blodgett, and M. Khoury. 2005. “The Nature Conservancy’s approach to conserving and rehabilitating biological diversity in the Upper Mississippi River system.” Arch. Hydrobiol. Suppl. 155 (Sep): 549–560.
Rijke, J., S. van Herk, C. Zevenbergen, and R. Ashley. 2012. “Room for the River: Delivering integrated river basin management in the Netherlands.” Int. J. River Basin Manage. 10 (4): 369–382. https://doi.org/10.1080/15715124.2012.739173.
Schielen, R., C. Haring, L. Burgess-Gamble, J. Guy, B. Bledsoe, and R. Mandel. 2021. “Chapter 17: Benefits and challenges in the application of NNBF in fluvial systems.” In International guidelines on natural and nature-based features for flood risk management, edited by T. S. Bridges, J. K. King, J. D. Simm, M. W. Beck, G. Collins, Q. Lodder, and R. K. Mohan, 803–845. Vicksburg, MS: US Army Engineer Research and Development Center.
Schoof, R. 1980. “Environmental impact of channel modification 1.” JAWRA J. Am. Water Resour. Assoc. 16 (4): 697–701. https://doi.org/10.1111/j.1752-1688.1980.tb02451.x.
Shields Jr., D. F., and S. R. Abt. 1989. “Sediment deposition in cutoff meander bends and implications for effective management.” Regul. Rivers: Res. Manage 4 (4): 381–396. https://doi.org/10.1002/rrr.3450040406.
Smith, D. L., S. P. Miner, C. H. Theiling, R. L. Behm, and J. M. Nestler. 2017. Levee setbacks: An innovative, cost-effective, and sustainable solution for improved flood risk management. Vicksburg, MS: US Army Corps of Engineers Environmental Laboratory.
Toonen, W. H., M. G. Kleinhans, and K. M. Cohen. 2012. “Sedimentary architecture of abandoned channel fills.” Earth Surf. Processes Landforms 37 (4): 459–472. https://doi.org/10.1002/esp.3189.
Tullos, D., D. W. Baker, J. Crowe Curran, M. Schwar, and J. Schwartz. 2021. “Enhancing resilience of river restoration design in systems undergoing change.” J. Hydraul. Eng. 147 (3): 03121001. https://doi.org/10.1061/(ASCE)HY.1943-7900.0001853.
USACE. 1994. Hydraulic design of flood control channels: Engineering and design (EM-1110-2-1601) Change 1, 183. Washington, DC: USACE.
USACE. 2000. Design and construction of Levees (EM-1110-2-1913), 164. Washington, DC: USACE.
USGS. 2018. “The national elevation dataset.” Accessed April 25, 2023. https://apps.nationalmap.gov/viewer/.
Woodward, D. E. 2015. “A look back at the watershed protection and flood prevention act of 1954 (Pl-566).” In Proc., ASCE EWRI Watershed Management Symp., 160–168. Reston, VA: ASCE.
Information & Authors
Information
Published In

Journal of Hydraulic Engineering
Volume 151 • Issue 1 • January 2025
Copyright
This work is made available under the terms of the Creative Commons Attribution 4.0 International license, https://creativecommons.org/licenses/by/4.0/.
History
Received: Jul 23, 2023
Accepted: Jul 2, 2024
Published online: Sep 17, 2024
Published in print: Jan 1, 2025
Discussion open until: Feb 17, 2025
Authors
Metrics & Citations
Metrics
Citations
Download citation
If you have the appropriate software installed, you can download article citation data to the citation manager of your choice. Simply select your manager software from the list below and click Download.