Capillary Bridge in Contact with Ice Particles Can Be Related to the Thin Liquid Film on Ice
Publication: Journal of Cold Regions Engineering
Volume 38, Issue 1
Abstract
We experimentally demonstrate the presence of a capillary bridge in the contact between an ice particle and a smooth aluminum surface at a relative humidity of approximately 50% and temperatures below the melting point. We conduct the experiments in a freezer with a controlled temperature and consider the mechanical instability of the bridge upon separation of the ice particle from the aluminum surface at a constant speed. We observe that a liquid bridge forms, and this formation becomes more pronounced as the temperature approaches the melting point. We also show that the separation distance is proportional to the cube root of the volume of the bridge. We hypothesize that the volume of the liquid bridge can be used to provide a rough estimate of the thickness of the liquid layer on the ice particle since in the absence of other driving mechanisms, some of the liquid on the surface must have been pulled to the bridge area. We show that the estimated value lies within the range previously reported in the literature. With these assumptions, the estimated thickness of the liquid layer decreases from nearly 56 nm at T = −1.7°C to 0.2 nm at T = −12.7°C. The dependence can be approximated with a power law, proportional to (TM − T)−β, where β < 2.6 and TM is the melting temperature. We further observe that for a rough surface, the capillary bridge formation in the considered experimental conditions vanishes.
Practical Applications
Understanding the physics of ice and snow becomes vital as climate change accelerates. Ice exhibits exotic behavior since it is near its melting point. A liquid layer is present on ice surfaces, which is responsible for phenomena like the sticking of ice particles. Complex experiments using for example advanced laser-based methods or advanced molecular dynamics calculations have previously been used to estimate the thickness of this liquid layer. Here, we observe the formation of liquid bridges between ice and a smooth surface at temperatures well below the freezing point. We then estimate the thickness of the liquid layer on ice particles from the volume of the liquid bridge and show that it is within the range observed previously. This can help to understand this liquid layer and its relation to surface diffusion more intuitively.
Introduction
Michael Faraday (Faraday 1860) was the first to propose the idea of the presence of a thin liquid layer on the surface of ice particles. The idea was a source of controversies for decades, but it is widely accepted now and has been proven by many researchers, for example, Nakaya and Matsumoto (1954) and Szabo and Schneebeli (2007). Indeed, the breakage of the hydrogen bonds results in a jelly or quasi-liquidlike (QLL) layer on the ice surface at temperatures below the melting point which makes surface flow possible (Limmer 2016). The QLL has been extensively investigated by using different experimental methods like X-ray diffraction, X-ray absorption, or ellipsometry (Elbaum et al. 1993; Golecki and Jaccard 1977; Döppenschmidt and Butt 2000; Goertz et al. 2009; Bluhm et al. 2002; Lied et al. 1994; Sazaki et al. 2012; Asakawa et al. 2016; Sánchez et al. 2017). More recently, the QLL has been studied theoretically by using molecular dynamics (MD) simulation methods (Limmer 2016) and Monte Carlo simulations (Pickering et al. 2018). A thorough review about the premelting of ice and the QLL on ice has been provided by Slater and Michaelides (2019).
The presence of the QLL on the ice surface has a multitude of implications and a strong effect on the friction of ice and snow. Further, the QLL plays a crucial role in phenomena like ice sintering (Szabo and Schneebeli 2007; Bahaloo et al. 2022) or snow metamorphism (Ebner et al. 2015). In addition, it has been suggested that the QLL has a strong effect on the impact of chemical concentrations in snow (Waddington et al. 1996). Despite recognizing the importance of the QLL, it has been alleged that the lack of quantitative or even qualitative observations about the QLL prohibits it from being related to the crystallization of snow (Libbrecht 2005). The sublimation condensation caused by the Kelvin effect was proposed as the limiting factor for isothermal snow metamorphism (Ebner et al. 2015), but surface diffusion is also suggested as a strong candidate (Kingery 1960; Vetter et al. 2010). Experimentally, surface diffusion was identified as the driving mechanism in ice sintering (Kingery 1960). Surface diffusion was also found to be the dominant mechanism in snow metamorphism under isothermal conditions; however, for temperatures near the melting point, the sublimation deposition is considered to be the main mechanism (Vetter et al. 2010). Fluid flow was identified as the dominant mechanism for relative humidities higher than 62% while for relative humidities lower than 37%, the diffusion effects were identified as more important (Lai and Li 2019). Recently, it was shown that advective fluxes play an important role in the dynamics of the QLL (Sibley et al. 2021).
In general, a capillary bridge can be formed between particles due to contamination, adsorption, or lubrication (Gao 1997) and this effect is responsible for the adhesion of small particles. This phenomenon occurs at a relative pressure (or humidity) above 0.3 (Choi et al. 2001) and is related in most applications to the Kelvin effect when the pore sizes are on the nanoscale (Vitorino et al. 2018; Hsia et al. 2021; Deroche et al. 2019). Water vapor can also condensate in the pores at temperatures below the freezing point to form a liquid bridge. This phenomenon has been studied for the case of hydrocarbons of the order of nanometers (Nowak and Christenson 2009).
Surface characteristics of the ice as well as the presence of defects and dislocations are known to highly affect the onset and characteristics of the QLL (Slater and Michaelides 2019). Moreover, the presence of asperities, as for a rough surface, alters or even hinders the formation of the capillary bridge (Xiao et al. 2019). For instance, it has been indicated that rougher surfaces are more slippery due to the suppression of the capillary adhesion (Hsia et al. 2021; Herminghaus 2005). The surface roughness is also thought to have an effect on the formation of a liquid bridge between grains (Herminghaus 2005).
The primary questions related to the QLL are the minimum formation temperature and the temperature dependency of the thickness of the QLL. There is a large discrepancy in the reported experimental results, and MD simulations suffer from shortcomings related to oversimplified structures and approximate molecular interactions (Slater and Michaelides 2019). Consequently, the problem of the thickness of the QLL and its onset is still an attractive scientific question.
In this paper, we observe a liquid bridge in the contact of ice against a smooth surface and we hypothesize that the observed liquid bridge cannot be explained by effects like the Kelvin effect or by pressure melting, and that only the presence of a QLL moving into the bridge region can be the cause of the observed liquid bridge. We use this hypothesis to estimate the thickness of the QLL. We also delineate the sensitivity of the liquid bridge formation to the surface roughness. Considering the mechanical instability of the liquid bridge, we further relate the snapping height to the volume at the time of rupture of the liquid bridge.
Materials and Methods
The experimental setup used in this investigation is an updated version of the setup used in our previous study (Bahaloo et al. 2022). It is phenomenologically presented in Fig. 1. In the experiments, we press, with a constant speed, a semispherical ice particle against an aluminum (AL) surface, keep them in contact for a certain amount of time, and separate them with the same speed. We then observe the liquid bridge that may form during the separation. Contact is initiated by moving the ice particle upward toward the flat surface. We use two types of AL surfaces named “smooth” and “rough,” respectively. The root mean square roughness values for the smooth and rough surfaces are Sq = 76 and Sq = 272 nm, respectively, as measured on an area of 2 mm2 using a 3D optical surface profiler (Zygo NewView 7300, Lambda photometrics, UK). A semispherical ice particle with the radius rice ≈ 5 mm fixed to a plate is used in this study. Two perpendicular cameras are used to capture images in perpendicular planes and are employed to calculate geometrical quantities in the contact region. We kept the radius constant by adding water when required. The ice particle is connected to a linear servo controller (E625 series, Physik instrumente) and is pressed against the metallic surface at a speed of 0.02 mm/s during a temporal duration of 30 s with a fixed compressive force of 20 mN measured by a FUTEK LSB200 loadcell (FUTEK, Advanced sensor technology Inc.). The separation of the ice particle from the AL surface is also done at a speed of 0.02 mm/s. The experiments are performed in a freezer with a minimum achievable temperature of approximately −20°C.
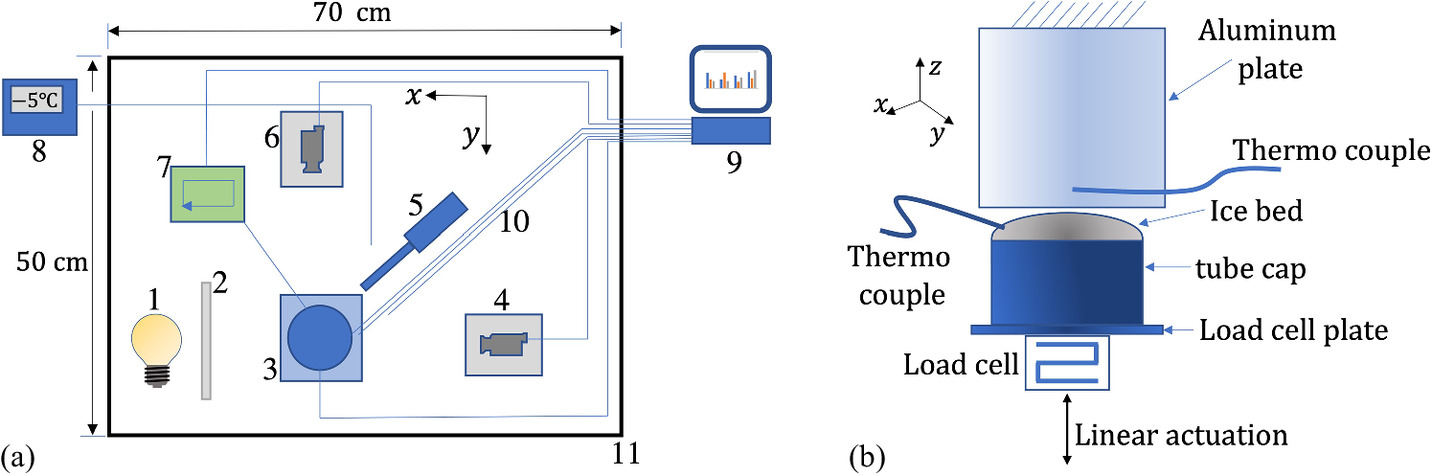
The AL surface is glued to a Peltier element which is used to set the temperature of the AL surface to minimize the temperature differences between ice and aluminum to achieve a nearly isothermal contact. A thermocouple is used within the ice particle to monitor the temperature throughout the experiments. Another thermocouple is located within the AL cube 1 mm from the surface of contact. Finally, a third thermocouple is employed in the air and at a distance of nearly 1 cm from the ice particle for monitoring the surrounding air temperature.
We control the temperature in the freezer using a PID (proportional integral derivative) controller (Shinko JCD series). Real-time temperature variations in the ice, metallic surface, and air are logged into a computer file using SignalExpress software (National Instruments, version 2015) at a sampling rate of 0.04 Hz. The variation in the temperature readings during the overnight measurements was less than ±0.75°C. The variations in the temperature readings during each specific experiment was less than 0.2°C. Throughout the entire measurement campaign, the humidity in the freezer is kept at approximately 50% for all the experiments and is measured by a hygrometer (type Testo 400, Testo Inc.). The temperature accuracy of the hygrometer is ±0.2°C for a measurement range of (−25°C to +74.9°C).
We employ two cameras (IDS uEye UI-314× series, 1,280 × 1,024 resolution, IDS Imaging Development Systems GmbH and IDS uEye UI-324× series, 1,280 × 1,024 resolution, IDS Imaging Development Systems GmbH) with a pixel size of 4.8 μm in orthogonal directions (x–y) to acquire high resolution video files during the experiments. The frame rate of the imaging is 50 Hz. We used a telecentric lens with 1:1 magnification. The images are captured in diffuse back-illumination from a light-emitting diode (LED) light source. The whole experimental setup is mounted on a rigid base.
Results
The layout of the liquid bridge which is formed during the separation of the ice particle from the smooth metallic surface is presented in Fig. 2. When a bridge forms between the ice particle and the smooth surface when in contact, it starts to deform and stretch during the separation of the ice particle from the surface. Consequently, its diameter decreases. Upon stretching to a certain value, the bridge ruptures due to mechanical instability. The diameters and height of the bridge right before the rupture are used to calculate the final volume, V, of the bridge. After having calculated V, we continue with calculating the thickness, tlq, of the QLL.
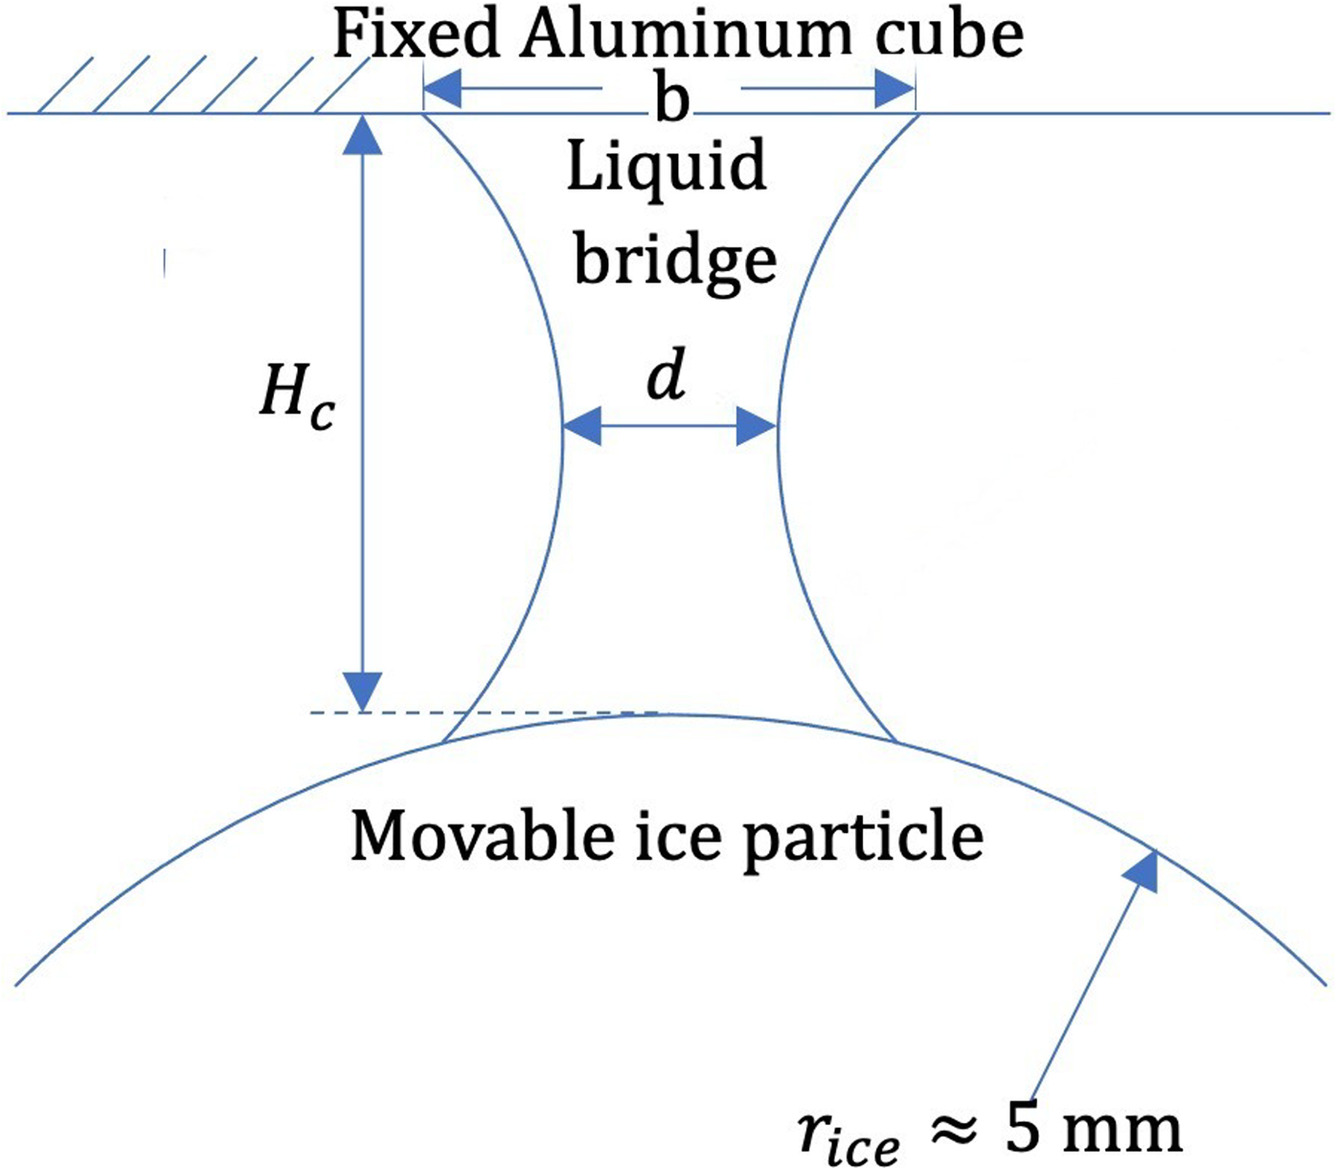
The bridge is considered as a hyperboloid of one sheet, which is obtainable by rotating a hyperbola around its minor axis. The hyperboloid is considered to have a circular cross section with the diameter d in the middle, diameter b at its base, and a height of Hc, as presented in Fig. 2. The values of d, b, and Hc are calculated from the acquired image frames using a MATLAB script where boundaries are detected using image processing tools, as depicted in Fig. 3. Values for d, b, and Hc corresponding to the frame right before the rupture of the bridge are considered as the desired values for the bridge diameters and height, respectively. From these values, the volume, V, is calculated as
(1)

The data obtained for the bridge height (equivalently called snapping distance), Hc, smaller diameter, d, and larger diameter, b, of the bridge at the rupture time are presented in Table 1. An interesting observation is that as an overall trend, these parameters all increase with temperature.
| T (°C) | d (μm) | b (μm) | Hc (μm) | 106 × V (μm3) | ||
|---|---|---|---|---|---|---|
| −1.5 | 171 | 293 | 294 | 8.791 | 0.0529 | 70.326 |
| −1.7 | 147 | 288 | 298 | 8.104 | 0.0509 | 64.835 |
| −2.1 | 102 | 226 | 196 | 3.579 | 0.0384 | 28.635 |
| −2.5 | 117 | 206 | 181 | 3.214 | 0.0355 | 25.716 |
| −2.6 | 73 | 144 | 167 | 1.329 | 0.0326 | 10.630 |
| −3.6 | 49 | 144 | 132 | 1.016 | 0.0249 | 8.129 |
| −3.8 | 73 | 91 | 127 | 0.438 | 0.0259 | 3.508 |
| −6.0 | 54 | 91 | 122 | 0.437 | 0.0240 | 3.491 |
| −9.2 | 29 | 58 | 54 | 0.0688 | 0.0106 | 0.550 |
| −10.8 | 24 | 43 | 34 | 0.0196 | 0.0058 | 0.157 |
| −10.9 | 24 | 48 | 49 | 0.0434 | 0.0096 | 0.347 |
| −12.7 | 24 | 48 | 34 | 0.0304 | 0.0067 | 0.243 |
There is a theoretical solution for the dependence of the dimensionless height of the bridge ( ) to its dimensionless volume ( ) in the form of (Willett et al. 2000)which may be used as a reference relation for a general behavior of a liquid bridge.
(2)
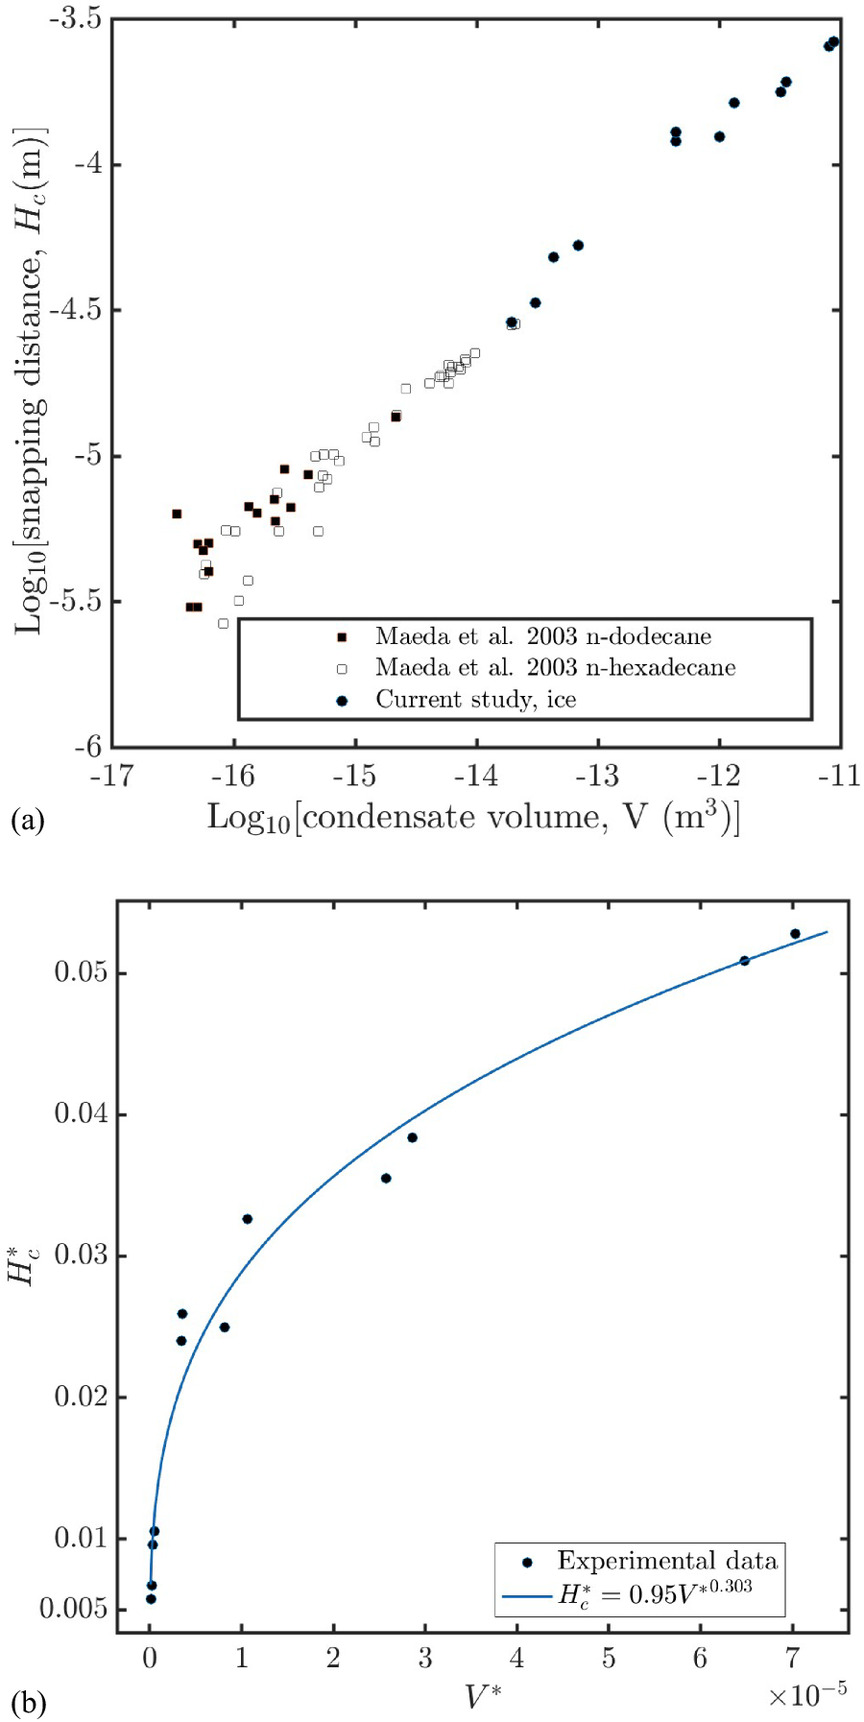
The relation between snapping height, Hc, and volume, V, of the bridge is plotted in Fig. 4(a). Included in the plot are results previously presented by Maeda et al. for the case of hydrocarbons (Maeda et al. 2003). For their case, the separation was on the nanometer scale. It is seen that all values, including ours, end up on a straight line with an inclination of roughly 1/3. By plotting, in Fig. 4(b), the dimensionless snapping height versus dimensionless volume, we verify that the observed data are in good agreement with Eq. (2). The power of the proportionality is obtained as 0.303 by curve fitting, which is close to the theoretical prediction of 1/3. In summary, we can verify that the the general relation in Eq. (2) between the snapping height and the bridge volume is valid also for water.
In the absence of other driving mechanisms and by roughly assuming that all of the liquid on the surface can be pulled into the bridge location, the thickness, tlq, of the QLL can be estimated by equating the volume of the liquid bridge to the volume of the thin film on the ice particle. Assuming a semispherical shape for the ice particle, the volume, Vlq, of the QLL on the ice particle becomes
(3)
Accordingly, from Eqs. (1) and (3), the thickness of the QLL on the ice particle is then estimated to be
(4)
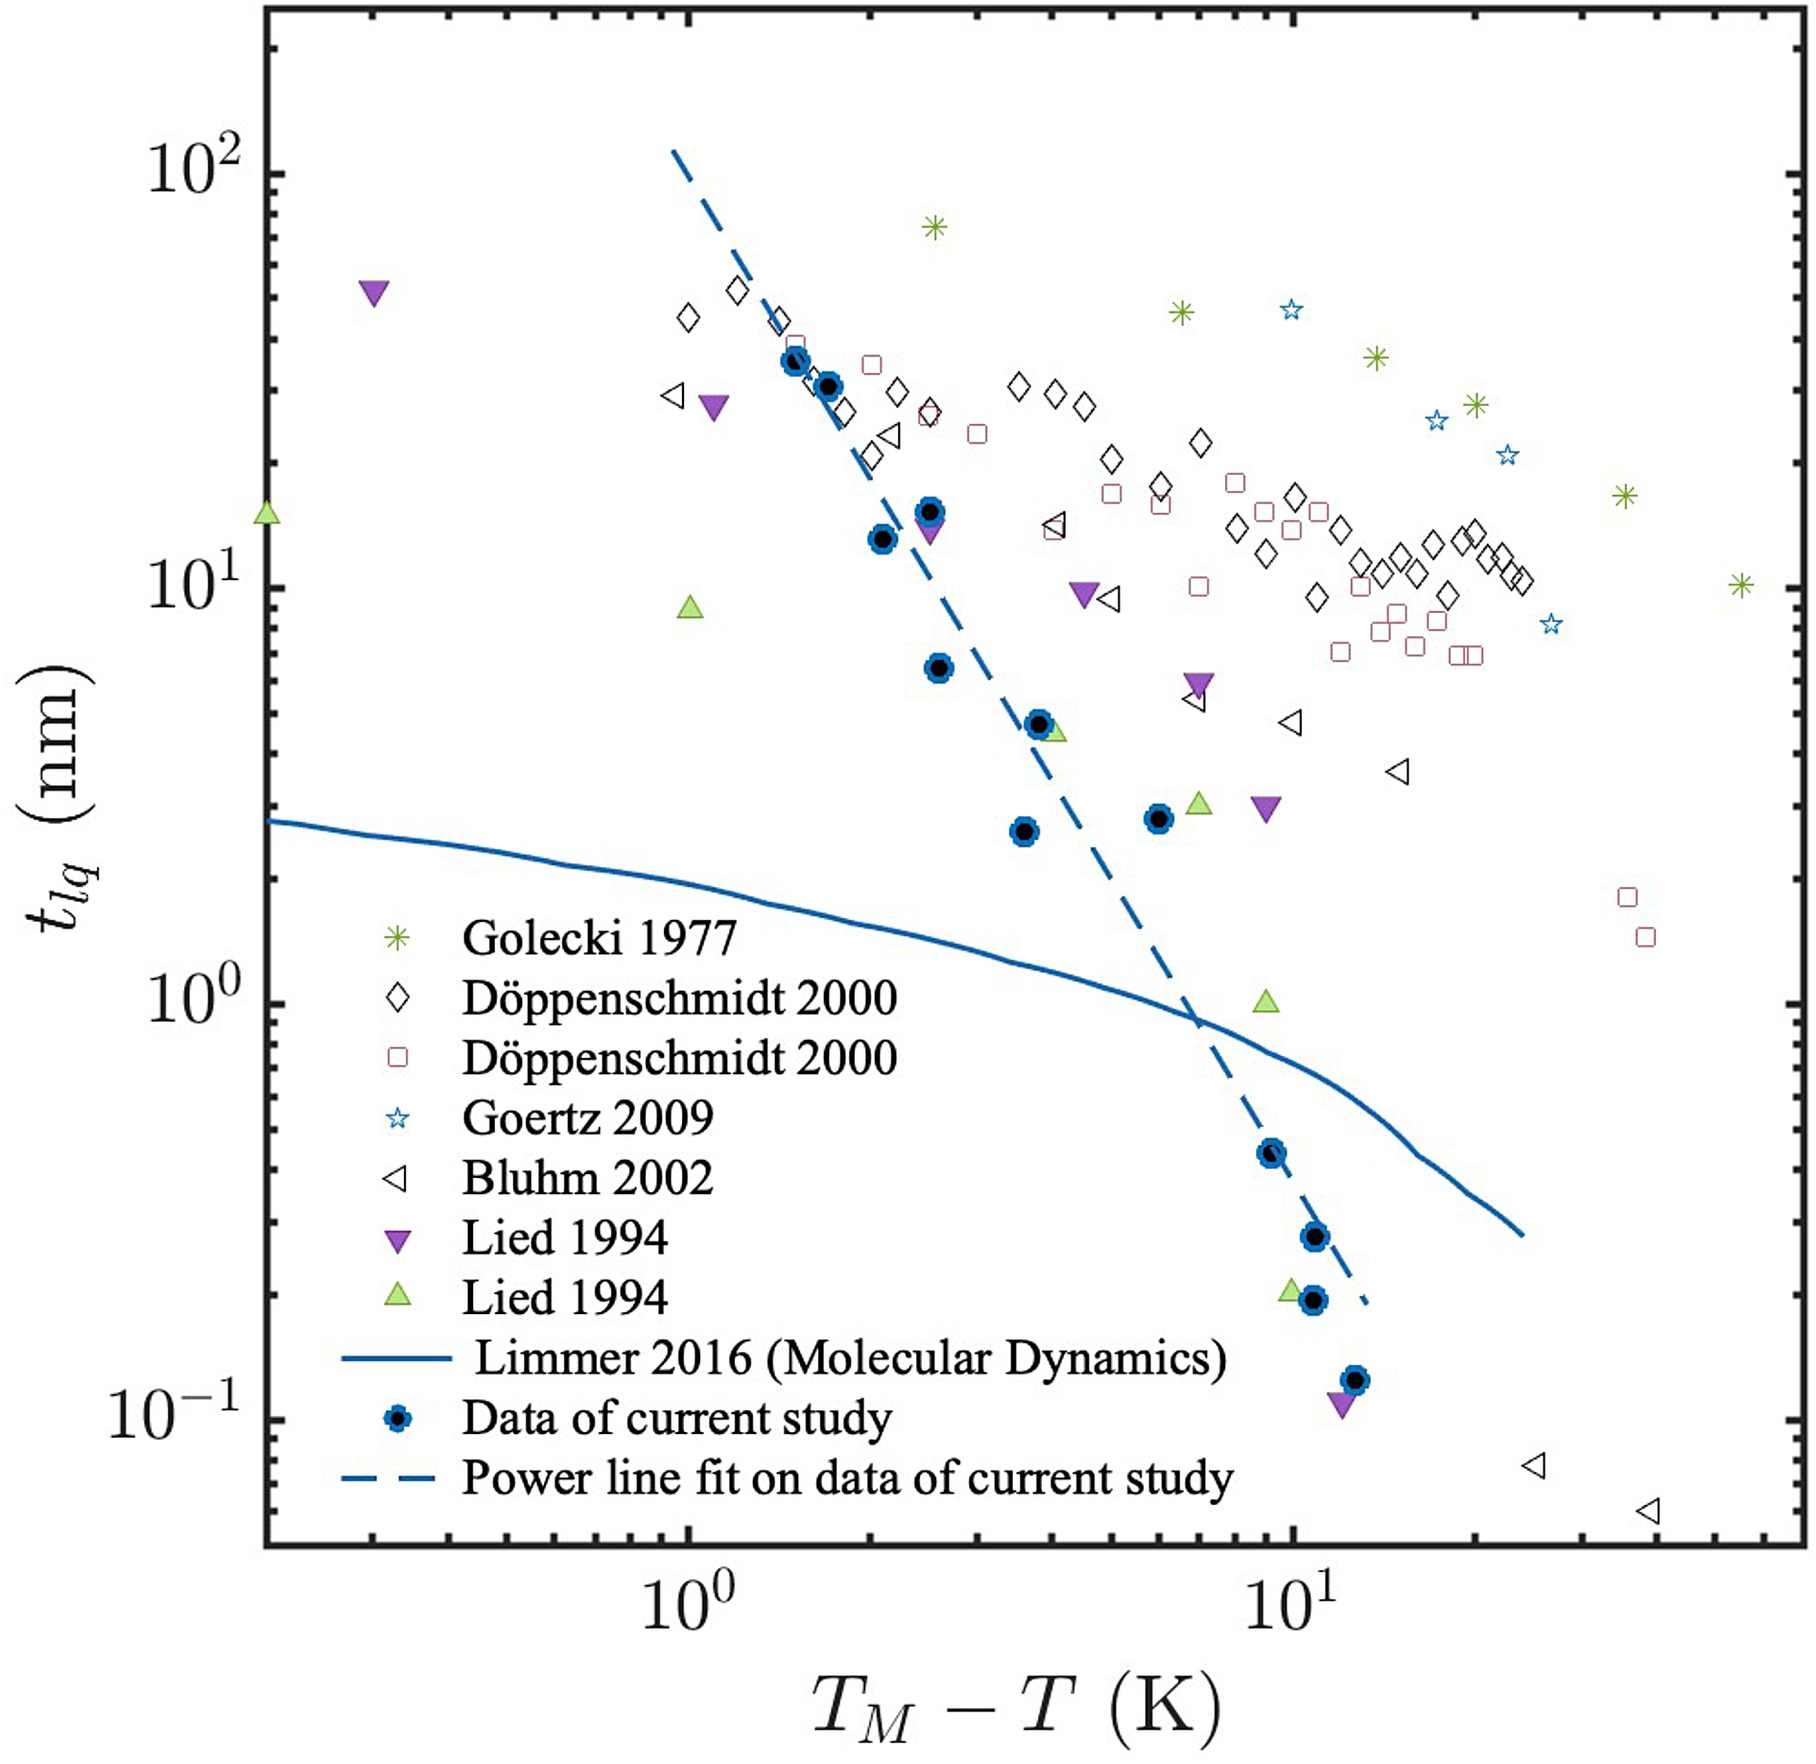
The estimated QLL thickness using Eq. (4) is plotted in Fig. 5 together with results previously reported in the literature. With this model, the thickness of the QLL reduces from approximately 56 nm at −1.7°C to nearly 0.2 nm at −12.7°C. Moreover, for our experimental data, the thickness of the liquid layer versus the temperature is given by tlq = 172.2(TM − T)−2.6 nm, with coefficient of determination R2 = 0.96, where TM = 0°C is the melting temperature, T is the temperature of the ice, and tlq is in nm units. A power law dependency was previously reported by Elbaum et al. (1993), however, in their case, the estimated exponent was −1.2 ± 1 which is approximately half of the value estimated in this study. A view on some of the existing experimental results plotted in Fig. 5 reveals large discrepancies. It is notable that MD simulations were also used to estimate the thickness of the QLL and generally the values are much smaller than the experimental ones (Limmer 2016; Slater and Michaelides 2019).
For the surface with a higher roughness, no visible liquid bridge is observed, and only sticking of ice to the AL surface is noted. When the contact area has a larger radius of curvature like in the case where the ice particle is pressed to have a plastic flow and left to rest for a while to freeze, we observe the formation of multiple small bridges, as presented in Fig. 6. These are very similar to what is reported by Maeda et al. (2003) for the case of hydrocarbons.

Discussions and Conclusions
After the formation of the initial bridge, liquid accumulates in the bridge area through either evaporation condensation, which is explained by the Kelvin effect (Kohonen et al. 1999; Christenson 1997; Nowak and Christenson 2009; Christenson 1995), or surface diffusion of the liquid film (Gao and Bhushan 1995). The surface roughness also affects at least the second mechanism significantly (Gao and Bhushan 1995; Seemann et al. 2001). Further, pressure or frictional melting are possible mechanisms. In general, it is difficult to determine the contribution of each mechanism (Herminghaus 2005). The Kelvin effect, which is dominant when the gap distance is very small, is given bywhere , and T are pressure, saturation pressure, work of adhesion, molar volume, equivalent radius, universal gas constant, and temperature, respectively. It is worth mentioning that p/p0 is equivalent to the relative humidity, ϕ, which we directly measure in this study using a hygrometer.
(5)
If we use an approximate work of adhesion of 0.85 N/M (Israelachvili 2011), molar volume 18 cm3, gas constant 8.314 J/mol-K, and temperature of 263 K, we can verify that rav can range from approximately 6 to 600 nm for relative humidities of 0.3 to 0.99, respectively. The larger of the obtained radii is approximately ten times smaller than the observed radius in these experiments, as presented in Table 1. In this paper, we therefore conclude that the Kelvin effect cannot be the dominant mechanism in the formation of the liquid bridge under the conditions considered. Frictional melting can also be excluded immediately since we only consider normal contact and there is essentially no tangential movements.
Pressure melting cannot be the reason for the observation of a liquid bridge either since the imposed force during the contact of the ice particle against the aluminum surface is 20 mN, which results in a contact stress of approximately 1 MPa using Johnson–Kendall–Roberts (JKR) contact model (Shull 2002). According to the Clapeyron equation (Borgnakke and Sonntag 2022), a compressive stress of approximately 13.5 MPa is required to lower the melting point by one degree. Pressure melting can therefore be ruled out as the reason for the formation of the liquid bridge.
The only remaining mechanism is surface diffusion or flow of the film. We therefore hypothesize that the flow of a liquid or quasi-liquid layer on the ice particle toward the contact region is the main mechanism responsible for the observed capillary bridge. Using this hypothesis, we estimate the thickness of the QLL on the ice surface using the volume of the observed liquid bridge, as given by Eq. (4).
With the initiation of the contact and formation of a meniscus, a resulting negative Laplace pressure is created in the film in the proximity of the contact because of the concave shape of the meniscus, which will pull the thin film into the contact area. Consequently, if we consider the volume of the bridge to be equivalent to the spread volume of the film on the surface, we obtain an estimation of the QLL on the ice particle. Such a calculation of the QLL thickness predicts that at approximately −13°C, a layer of the thickness of approximately a bilayer of water molecules emanates from the bulk ice. This is similar to the previously published results of Sánchez et al. (2017) where a surface-specific vibrational sum frequency generation (SFG) spectroscopy method was used to estimate the film thickness. In that study, a sudden change in the SFG spectra occurred at approximately −16°C suggesting that one or two layers of molten bilayers emanate on the surface of the ice. Moreover, the estimated thickness of the QLL is well inside the observed results in the literature, as presented in Fig. 5, and decreases sharply with the temperature. In fact, the thickness changes from approximately 56 nm at −1.7°C to nearly 0.2 nm at −13°C, as presented in Fig. 4. The observed distribution is similar to those previously obtained using X-ray scattering (Lied et al. 1994). In the literature, the dependence of the thickness of the QLL to the temperature has previously been modeled in a logarithmic (Libbrecht 2005; Lied et al. 1994) or power form (Elbaum et al. 1993). We find a power form dependence with the power of dependence of −2.6.
Another interesting observation is that for a “gentle pushing” and “slow” separation, the ratio of the height of the bridge at snapping distance when plotted against the volume of the bridge follows an experimentally verified, theoretical formula. Based on such a formula, we expect a dependency of the snapping distance proportional to the cube root of the volume of the bridge. The observed behavior is presented in Fig. 4(a). The observed results are an extension of results previously presented for hydrocarbons. Therefore, our results indicate that the mentioned theoretical formula is applicable for water and on much larger length scales than previously reported.
The model we used in this study is an approximate model, and the volume of the liquid film modeled in Eq. (3) is a rough estimation. The weak part of the model is the assumption that the entire liquid film on the ice surface flows into the liquid bridge. Using contact experiments between tipless cantilevers and a silicon wafer on an atomic force microscope (AFM), the growth mechanisms of a water bridge at different relative humidities was investigated by Lai and Li (2019). With the aid of potassium hydroxide (KOH) coatings, a “radius of collection” of 23.6 μm was obtained for which the film certainly moves toward the contact area. The cantilever width of Lai and Li (2019) was 60 μm while the radius in the current experiment is approximately 5 mm. A linear scaling provides an estimation for the expected radius of collection of 5 × 23.6/30 ≈ 4 mm which is of the order of the radius of the ice particle. Moreover, since the relative humidity in this study is high enough, , the flow mechanism of the QLL dominates over the surface diffusion effects, as explained by Lai and Li (2019), and advective effects are important. It is most likely that the model still underestimates the film thickness in general and in particular for lower temperatures since the fluidity will be less due to the increased viscosity. The film thickness, as predicted by Eq. (4), will therefore be a lower bound for the actual film thickness and the power dependence of (TM − T)−2.6 will be an overestimation of the temperature dependence. The relation should therefore be written as (TM − T)−β, where β < 2.6. Determining a correct value for β will require more detailed experiments.
The formation of multibridges or something called “nanobridges” was previously reported in experiments related to hydrocarbons with nanometer scale separations (Maeda et al. 2003). Here, we can also see such a behavior, as indicated in Fig. 6, if the contact area is locally flattened by reasons like the previous plastic deformations. In this case, the preferred location for the formation of the bridge can be literally anywhere in the flat area and consequently multiple bridges are expected to be observed.
As it is known, the surface structure and surface conditions of the ice, along with the presence of the defects and dislocations, affect the onset and behavior of the QLL significantly (Slater and Michaelides 2019). The presence of the liquid bridge in this study is sensitive to the surface roughness either on the metallic or ice surface. We observe here that the presence of a small roughness obstructs the formation of the bridge. This behavior can be related to the fact that surface roughness can hinder the movement or transfer of the surface layer and consequently the liquid bridge fails to form. We employed two different surface roughnesses for the Al surfaces to show that roughness plays a significant role but we did not quantify the effect or relate it numerically to identify the minimum roughness that prevents the formation of the liquid bridge at a given thickness. This can be a subject of an independent study.
The presence of a liquid film responsible for the adhesion of ice particles was inferred from the observed rotation of two bonded ice particles upon separation (Nakaya and Matsumoto 1954), where the adhesive behavior of the ice particles even after the breakage of the bonds was related to the presence of a liquid layer on the ice particles. The rotations appeared “sometimes” but not “rarely” during the experiments especially at temperatures above −7°C. Similarly, in the separation of an ice particle from another ice particle, a liquid bridge is reported to be observed at temperatures near the melting point (Bahaloo et al. 2022).
The fact that we clearly observe a liquid bridge can be a proof of the existence of a liquid film on the ice particles that is pulled into the contact area due to the negative pressure at the bridge location. We observe this behavior for the relative humidity of approximately 50%. Therefore, we suggest the possibility of the existence of the QLL without the necessity of having supersaturated conditions as reported by Asakawa et al. (2016).
The estimation of the thickness of the QLL using our method has its own limitations. First, we did not study the effect of the relative humidity on the thickness of the QLL. The thickness is expected to increase with relative humidity, but an independent study is required to quantify the relationship. Second, we did not quantify the effect of the surface roughness on the size of the liquid bridge, and we only observed the prevention of liquid bridge formation for a surface roughness 3.5-times larger than the named smooth surface. A gradual increment in the surface roughness is expected to affect the behavior of the liquid bridge and makes it more local to the asperity areas or to generate multiple smaller bridges.
In summary, we have shown the formation of a liquid bridge during the contact of an ice particle to a smooth metallic surface under the application of a gentle pressure and we used the volume of the observed liquid bridge to roughly estimate the thickness on the liquid film on the ice. We hypothesize that the formation of the liquid bridge is dominated by the flow of a liquid film into the contact area and showed that such a film has a thickness that increase sharply with temperature. We have also shown that the height to volume ratio of the bridge at the time of bridge rupture follows the expected theoretical relation. We finally observed that the roughness of the surface greatly affects the formation of the liquid bridge.
Data Availability Statement
All data, models, and code generated or used during the study appear in the published article.
Acknowledgments
We appreciate the assistance from Per Abrahamsson and Tobias Eidevåg, then at Chalmers University of Technology, now at Volvo cars, for the initial version of the load cell measurement device. We are thankful for the help and assistance from Henrik Lycksam at the division of experimental mechanics at Luleå University of Technology.
References
Asakawa, H., G. Sazaki, K. Nagashima, S. Nakatsubo, and Y. Furukawa. 2016. “Two types of quasi-liquid layers on ice crystals are formed kinetically.” Proc. Natl. Acad. Sci. U.S.A. 113 (7): 1749–1753. https://doi.org/10.1073/pnas.1521607113.
Bahaloo, H., T. Eidevåg, P. Gren, J. Casselgren, F. Forsberg, P. Abrahamsson, and M. Sjödahl. 2022. “Ice sintering: Dependence of sintering force on temperature, load, duration, and particle size.” J. Appl. Phys. 131 (2): 025109. https://doi.org/10.1063/5.0073824.
Bluhm, H., D. F. Ogletree, C. S. Fadley, Z. Hussain, and M. Salmeron. 2002. “The premelting of ice studied with photoelectron spectroscopy.” J. Phys.: Condens. Matter 14 (8): L227–L233.
Borgnakke, C., and R. E. Sonntag. 2022. Fundamentals of thermodynamics. Hoboken, NJ: John Wiley & Sons.
Choi, J.-G., D. Do, and H. Do. 2001. “Surface diffusion of adsorbed molecules in porous media: Monolayer, multilayer, and capillary condensation regimes.” Ind. Eng. Chem. Res. 40 (19): 4005–4031. https://doi.org/10.1021/ie010195z.
Christenson, H. 1995. “Liquid capillary condensates below the freezing point.” Phys. Rev. Lett. 74 (23): 4675–4678. https://doi.org/10.1103/PhysRevLett.74.4675.
Christenson, H. 1997. “Phase behaviour in slits—when tight cracks stay wet.” Colloids Surf., A 123: 355–367. https://doi.org/10.1016/S0927-7757(96)03781-8.
Deroche, I., T. J. Daou, C. Picard, and B. Coasne. 2019. “Reminiscent capillarity in subnanopores.” Nat. Commun. 10 (1): 4642. https://doi.org/10.1038/s41467-019-12418-9.
Döppenschmidt, A., and H.-J. Butt. 2000. “Measuring the thickness of the liquid-like layer on ice surfaces with atomic force microscopy.” Langmuir 16 (16): 6709–6714. https://doi.org/10.1021/la990799w.
Ebner, P. P., M. Schneebeli, and A. Steinfeld. 2015. “Tomography-based monitoring of isothermal snow metamorphism under advective conditions.” Cryosphere 9 (4): 1363–1371. https://doi.org/10.5194/tc-9-1363-2015.
Elbaum, M., S. Lipson, and J. Dash. 1993. “Optical study of surface melting on ice.” J. Cryst. Growth 129 (3–4): 491–505. https://doi.org/10.1016/0022-0248(93)90483-D.
Faraday, M. 1860. “I. Note on regelation.” Proc. R. Soc. London 10: 440–450. https://doi.org/10.1098/rspl.1859.0082.
Gao, C. 1997. “Theory of menisci and its applications.” Appl. Phys. Lett. 71 (13): 1801–1803. https://doi.org/10.1063/1.119403.
Gao, C., and B. Bhushan. 1995. “Tribological performance of magnetic thin-film glass disks: Its relation to surface roughness and lubricant structure and its thickness.” Wear 190 (1): 60–75. https://doi.org/10.1016/0043-1648(95)06648-9.
Goertz, M., X.-Y. Zhu, and J. Houston. 2009. “Exploring the liquid-like layer on the ice surface.” Langmuir 25 (12): 6905–6908. https://doi.org/10.1021/la9001994.
Golecki, I., and C. Jaccard. 1977. “The surface of ice near 0°C studied by 100 kev proton channeling.” Phys. Lett. A 63 (3): 374–376. https://doi.org/10.1016/0375-9601(77)90936-7.
Herminghaus, S. 2005. “Dynamics of wet granular matter.” Adv. Phys. 54 (3): 221–261. https://doi.org/10.1080/00018730500167855.
Hsia, F.-C., S. Franklin, P. Audebert, A. M. Brouwer, D. Bonn, and B. Weber. 2021. “Rougher is more slippery: How adhesive friction decreases with increasing surface roughness due to the suppression of capillary adhesion.” Phys. Rev. Res. 3 (4): 043204. https://doi.org/10.1103/PhysRevResearch.3.043204.
Israelachvili, J. N. 2011. Intermolecular and surface forces. Cambridge, MA: Academic Press.
Kingery, W. 1960. “Regelation, surface diffusion, and ice sintering.” J. Appl. Phys. 31 (5): 833–838. https://doi.org/10.1063/1.1735704.
Kohonen, M., N. Maeda, and H. Christenson. 1999. “Kinetics of capillary condensation in a nanoscale pore.” Phys. Rev. Lett. 82 (23): 4667–4670. https://doi.org/10.1103/PhysRevLett.82.4667.
Lai, T., and P. Li. 2019. “Direct evidence of a radius of collection area for thin film flow in liquid bridge formation by repeated contacts using AFM.” Langmuir 35 (20): 6585–6593. https://doi.org/10.1021/acs.langmuir.9b00827.
Libbrecht, K. G. 2005. “The physics of snow crystals.” Rep. Prog. Phys. 68 (4): 855–895. https://doi.org/10.1088/0034-4885/68/4/R03.
Lied, A., H. Dosch, and J. Bilgram. 1994. “Surface melting of ice Ih single crystals revealed by glancing angle x-ray scattering.” Phys. Rev. Lett. 72 (22): 3554–3557. https://doi.org/10.1103/PhysRevLett.72.3554.
Limmer, D. T. 2016. “Closer look at the surface of ice.” Proc. Natl. Acad. Sci. U.S.A. 113 (44): 12347–12349. https://doi.org/10.1073/pnas.1615272113.
Maeda, N., J. N. Israelachvili, and M. M. Kohonen. 2003. “Evaporation and instabilities of microscopic capillary bridges.” Proc. Natl. Acad. Sci. 100 (3): 803–808. https://doi.org/10.1073/pnas.0234283100.
Nakaya, U., and A. Matsumoto. 1954. “Simple experiment showing the existence of “liquid water” film on the ice surface.” J. Colloid Sci. 9 (1): 41–49. https://doi.org/10.1016/0095-8522(54)90084-7.
Nowak, D., and H. K. Christenson. 2009. “Capillary condensation of water between mica srfaces above and below zero-effect of surface ions.” Langmuir 25 (17): 9908–9912. https://doi.org/10.1021/la901070m.
Pickering, I., M. Paleico, Y. A. P. Sirkin, D. A. Scherlis, and M. H. Factorovich. 2018. “Grand canonical investigation of the quasi liquid layer of ice: Is it liquid?” J. Phys. Chem. B 122 (18): 4880–4890. https://doi.org/10.1021/acs.jpcb.8b00784.
Sánchez, M. A., et al. 2017. “Experimental and theoretical evidence for bilayer-by-bilayer surface melting of crystalline ice.” Proc. Natl. Acad. Sci. 114 (2): 227–232. https://doi.org/10.1073/pnas.1612893114.
Sazaki, G., S. Zepeda, S. Nakatsubo, M. Yokomine, and Y. Furukawa. 2012. “Quasi-liquid layers on ice crystal surfaces are made up of two different phases.” Proc. Natl. Acad. Sci. 109 (4): 1052–1055. https://doi.org/10.1073/pnas.1116685109.
Seemann, R., W. Mönch, and S. Herminghaus. 2001. “Liquid flow in wetting layers on rough substrates.” Europhys. Lett. 55 (5): 698–704. https://doi.org/10.1209/epl/i2001-00344-9.
Shull, K. R. 2002. “Contact mechanics and the adhesion of soft solids.” Mater. Sci. Eng.: R: Rep. 36 (1): 1–45. https://doi.org/10.1016/S0927-796X(01)00039-0.
Sibley, D. N., P. Llombart, E. G. Noya, A. J. Archer, and L. G. MacDowell. 2021. “How ice grows from premelting films and water droplets.” Nat. Commun. 12 (1): 1–11. https://doi.org/10.1038/s41467-020-20318-6.
Slater, B., and A. Michaelides. 2019. “Surface premelting of water ice.” Nat. Rev. Chem. 3 (3): 172–188. https://doi.org/10.1038/s41570-019-0080-8.
Szabo, D., and M. Schneebeli. 2007. “Subsecond sintering of ice.” Appl. Phys. Lett. 90 (15): 151916. https://doi.org/10.1063/1.2721391.
Vetter, R., S. Sigg, H. M. Singer, D. Kadau, H. J. Herrmann, and M. Schneebeli. 2010. “Simulating isothermal aging of snow.” Europhys. Lett. 89 (2): 26001. https://doi.org/10.1209/0295-5075/89/26001.
Vitorino, M. V., A. Vieira, C. A. Marques, and M. S. Rodrigues. 2018. “Direct measurement of the capillary condensation time of a water nanobridge.” Sci. Rep. 8 (1): 13848. https://doi.org/10.1038/s41598-018-32021-0.
Waddington, E., J. Cunningham, and S. Harder. 1996. “The effects of snow ventilation on chemical concentrations.” In Chemical Exchange between the Atmosphere and Polar Snow, edited by E. W. Wolff and R. C. Bales, 403–451. Berlin, Heidelberg: Springer.
Willett, C. D., M. J. Adams, S. A. Johnson, and J. P. K. Seville. 2000. “Capillary bridges between two spherical bodies.” Langmuir 16 (24): 9396–9405. https://doi.org/10.1021/la000657y.
Xiao, C., P. Shi, W. Yan, L. Chen, L. Qian, and S. H. Kim. 2019. “Thickness and structure of adsorbed water layer and effects on adhesion and friction at nanoasperity contact.” Colloids Interfaces 3 (3): 55. https://doi.org/10.3390/colloids3030055.
Information & Authors
Information
Published In

Journal of Cold Regions Engineering
Volume 38 • Issue 1 • March 2024
Copyright
This work is made available under the terms of the Creative Commons Attribution 4.0 International license, https://creativecommons.org/licenses/by/4.0/.
History
Received: Mar 3, 2023
Accepted: Jul 25, 2023
Published online: Oct 25, 2023
Published in print: Mar 1, 2024
Discussion open until: Mar 25, 2024
ASCE Technical Topics:
- Aluminum (material)
- Bridge engineering
- Bridges
- Climates
- Cold regions engineering
- Engineering fundamentals
- Engineering materials (by type)
- Environmental engineering
- Humidity
- Hydraulic engineering
- Hydraulic properties
- Hydraulic roughness
- Ice
- Material mechanics
- Material properties
- Materials engineering
- Measurement (by type)
- Metals (material)
- Meteorology
- Particles
- Structural engineering
- Temperature effects
- Temperature measurement
- Thickness
- Water and water resources
Authors
Metrics & Citations
Metrics
Citations
Download citation
If you have the appropriate software installed, you can download article citation data to the citation manager of your choice. Simply select your manager software from the list below and click Download.