Exploring Sustainability in Resource Management: Implementation of a Water–Energy–Human Nexus Framework at a University Campus
Publication: Journal of Construction Engineering and Management
Volume 150, Issue 10
Abstract
The intricate relationship between water and energy resources is embodied in the concept of water–energy nexus (WEN), emphasizing the need for a unified strategy to manage these vital resources with sustainability objectives like efficiency, cost savings, and emissions reduction in mind. To delve deeper into this relationship, this research presents a study focusing on the dynamics of the water–energy–human nexus (WEHN) specific to the academic environment of a university. It aims to delve into the multifaceted interactions among human behaviors, water usage, wastewater, and energy systems. This cohesive framework captures the symbiotic relationship between human-centric strategies—spanning end-users to high-level decision makers, technical facets, and environmental subsystems. To address this intricacy, our approach adopts an emergy-centric system dynamics (SD) model to map out these detailed interdependencies specific to academic environments. Simulation experiments were conducted using the SD model to test various sustainability improvement strategies. Results showed that influencing end-user’s water and electricity usage behaviors and operational decisions regarding space heating could be effective in reducing the overall emergy and improving system sustainability. It was also observed that when combining several strategies, the effect could be less than the sum of the effects of individual strategies. The proposed WEHN framework and emergy-based SD modeling provided a valuable approach for planners and decision makers to quantitatively assess sustainability of complex systems and evaluate different sustainability enhancement strategies. This study also bridges the gap between sustainability assessment and practical application, offering the construction engineering and management global community an easy-to-use framework to navigate and enhance complex infrastructural ecosystems.
Introduction
Global demand for water and energy has increased dramatically due to several factors such as population increase and technological infrastructure modernization in countries around the world (Halder et al. 2015). Global water and energy demand are projected to continue to grow substantially compared with current demand. For example, it is projected that global water demand for all consumption could increase by 20% to 30% by 2050 (Boretti and Rosa 2019). Over the same time period, global energy consumption could increase by nearly 50% (Capuano 2021).
Scarcity and depletion of water and energy are two major challenges that are drawing the attention of scientists and policymakers around the world (e.g., Scott and Sugg 2015; Environmental and Energy Study Institute 2021). For example, groundwater and ice stocks, two primary sources of water, are decreasing due to increased consumption and global warming (de Marsily 2021). Given the limited nature of these resources, optimizing their usage and preserving them for the future while meeting people’s daily needs is crucial for achieving sustainability goals such as resource efficiency, cost savings, and emission reductions.
Water and energy are highly interdependent and together have a significant impact on sustainability (Dai et al. 2018). Water can be used for steam, cooling, or chilling purposes in electricity production processes, and energy serves for water supply, distribution, and wastewater treatment purposes (Sanders and Webber 2012). A solution that addresses the scarcity of one of the resources (i.e., water or energy) may result in suboptimal resource management. A comprehensive understanding of the water–energy nexus (WEN) can help understand the complex and nonlinear interactions and balance the trade-offs between water and energy under changing environments (Hamiche et al. 2016). It can lead to robust water and energy planning and an understanding of potential policy and technology management options for water and energy conservation and sustainable community development.
Numerous studies are available in the literature that consider the effects of water production and consumption on the usage of different energy sources such as fossil fuels, renewable energy, and hybrid energy (Cherchi et al. 2015; Olcan 2015; Rodrigues et al. 2020; Shakib et al. 2012; Smaoui et al. 2015). Compared with such a unidirectional investigation, there are also several studies available in the literature that consider the interactions (i.e., bidirectional) of different energy sources with water production and consumption (Al-Nory and El-Beltagy 2014; Clarke et al. 2015; Perković et al. 2016; Santhosh et al. 2014). These studies primarily focused on developing robust grid management studies. However, fluctuations in system performance can stem from end-user behavior and strategic-level decision-making related to water and energy consumption (Huang et al. 2023).
Moreover, the majority of current studies attempted to enhance sustainability primarily via a technological initiative such as reconfiguring the connections between water and energy systems, controlling resource flow, and integrating new renewable energy (e.g., solar) and water (e.g., desalination) technologies (Al-Ansari et al. 2017; Mouri and Oki 2010; Panagopoulos 2021). A comprehensive mathematical modeling framework that integrates the human element within the nexus, examines its interaction with water and energy systems, and formulates sustainability strategies to equitably balance water-energy trade-offs, all while accounting for end-user impacts, remains an area ripe for deeper investigation.
This study focuses on the production and consumption of interdependent water and energy resources on a university campus to better understand WEN. A university campus is a comprehensive geographical entity with characteristics of a community that integrates education, learning, living, volunteer work, and other activities (Korsavi et al. 2021). Many universities around the world have adopted strategies to enhance campus sustainability (Association for the Advancement of Sustainability in Higher Education 2021). A university campus offers a suitable test bed for in-depth analysis of WEN due to its large population and various operations (Li et al. 2022). A holistic analysis and understanding of WEN on campus can provide key insights into community sustainability.
Extensive studies have been conducted on campus water and wastewater reuse and energy-saving strategies (Gu et al. 2018, 2019; Nogueira and Perrella 2015). In a university setting where water and energy are interdependent, end users can encompass libraries, lecture halls, residence halls, research facilities, student centers, and staff offices, all demonstrating varying demands for energy and water. Given the high degree of interdependence within such systems, the behaviors of end users can profoundly influence the overall water–energy dynamics (Huang et al. 2023). As strategic-level decision-making is explored, especially concerning the university administration’s pursuit of long-term sustainability goals or simply focusing on resource optimization and cost minimization, complexities may be amplified. These intricacies give rise to additional changes and implications, making the scenario more multifaceted and challenging to navigate. These alterations have considerable ramifications not only for the efficiency of the system but also for achieving different levels of sustainability. A mechanism that can explicitly examine the links within WEHN and develop multifaceted strategies combining human, water, and energy system-based interventions is needed to understand the current sustainability level at university campuses and propose strategies that can enhance it.
Building on established integrated frameworks for WEN, this study presents a unified water–energy–human nexus (WEHN) framework. This framework delves into the intricate interconnections among human behaviors, water and wastewater systems, and power/energy dynamics within the specific context of a university campus setting. A unified measure to evaluate sustainability of complex systems, accounting for different forms of energy and resources in the WEHN was needed. In the majority of the studies in the WEN domain, the units used for water and energy are cubic meters for water and Joule for energy (Fang and Chen 2017; Larsen and Drews 2019; Perrone et al. 2011). These studies either quantify (1) the energy impact of supplying water and wastewater services (Cohen et al. 2004; Lundie et al. 2004; Tidwell and Pebbles 2015), or (2) the water impact of generating energy (Antipova et al. 2002; Zhang and Anadon 2013) and develop sustainability strategies accordingly. The concept of emergy was used in this study as a unified measure that accounts for end-users’ behavior and can directly compare different strategies because they usually have unique impacts on water and energy systems (Hau and Bakshi 2004; Cerutti et al. 2011).
The theoretical and conceptual basis for emergy is grounded in the theories of energetics and general systems ecology (Odum 1996, 2000, 2007). Emergy is defined as the sum of all inputs of solar exergy (or equivalent amounts of geothermal or gravitational exergy) directly or indirectly required in a process (Brown et al. 2016). This process may involve different types of investment, goods, services, processes, and information. In essence, emergy analysis is a type of embodied energy analysis that can provide common solar energy units (i.e., sej) for uniform comparison of environmental and economic entities (Xie et al. 2021).
Emergy analysis has received significant attention over the years due to its ability in lending quantitative insights into questions of resource management and environmental impacts. It has been widely applied in different areas such as manufacturing, supply chain, agriculture, and power grid management (Chen et al. 2006; Zhang et al. 2020). For example, in a recent study, the concept of emergy has been used to assess the water–energy–emissions nexus in a wastewater treatment plant (Modiri et al. 2022). In this study as well, the solar energy joule equivalent via emergy analysis has been utilized to provide a consistent benchmark, allowing for the holistic comparison of diverse resources and inputs. This approach ensures a more comprehensive understanding of resource consumption and the underlying energy investments. It is important to clarify that we are not proposing any alterations or modifications to the established emergy measurement methodologies. Rather, its inherent capabilities are leveraged to holistically evaluate the impacts of end-user behaviors on the nexus.
A system dynamics (SD) modeling approach was proposed to facilitate the investigation of multifaceted strategies through simulation experiments. A case study was conducted to test the proposed methods and models based on a WEHN at the University of Connecticut (UConn) main campus. The WEHN includes a state-of-the-art cogeneration facility and a reclaimed water facility, serving the university students and staff. Information regarding water and energy supply and demand, infrastructure operation, and seasonal population change on campus were collected to develop a computational model of the WEHN. Multiple sets of simulation experiments were conducted, and the results indicated that various strategies and their combinations, including end-user behavioral change, operational decision change, and technical system alteration could reduce the emergy needs for water and energy consumption, leading to higher levels of sustainability. Essentially, this study integrates the complex system theory, emergy theory, and SD modeling to create a novel approach for sustainability assessment. The findings can aid decision makers in identifying effective strategies under both short-term and long-term sustainability goals.
The exposition of this study is as follows: first, a detailed description of a WEHN conceptual framework of the UConn university campus is provided; second, a system dynamics model of the WEHN is presented; third, multifaceted strategies that could be used to improve the current sustainability levels are proposed and evaluated; fourth, key managerial insights and the implications of the research findings are provided; and fifth, the research conclusions, limitations, and future research directions are presented.
Water–Energy–Human Nexus Conceptual Framework
This section introduces a WEHN framework that conceptualizes UConn’s water and energy systems and their interactions, and quantifies their environmental performance using a unified measure, emergy.
Water and Energy at UConn
The conceptual framework was developed for the interdependent cogeneration facility (i.e., Cogen plant) and wastewater treatment plant (WWTP) at UConn, serving approximately 28,000 undergraduate and graduate students as well as faculty and staff members throughout the year. The University of Connecticut draws water from its well fields near the Fenton River and Willimantic River, and Connecticut Water Company’s Northern-Western system. The well fields do not pump directly from the rivers. Instead, the wells pump groundwater from underground aquifers (University of Connecticut 2021a).
A cogeneration facility produces electricity and heat at the same time in a single plant, powered by just one source of energy, thereby guaranteeing a more efficient use of resources. This Cogen plant at UConn allows over 80% of the fuel energy to be harnessed, versus 33% from a conventional electric power plant (University of Connecticut 2021b). Most of the electricity on campus is provided by the Cogen plant. The cogeneration process in the plant is shown in Fig. 1.
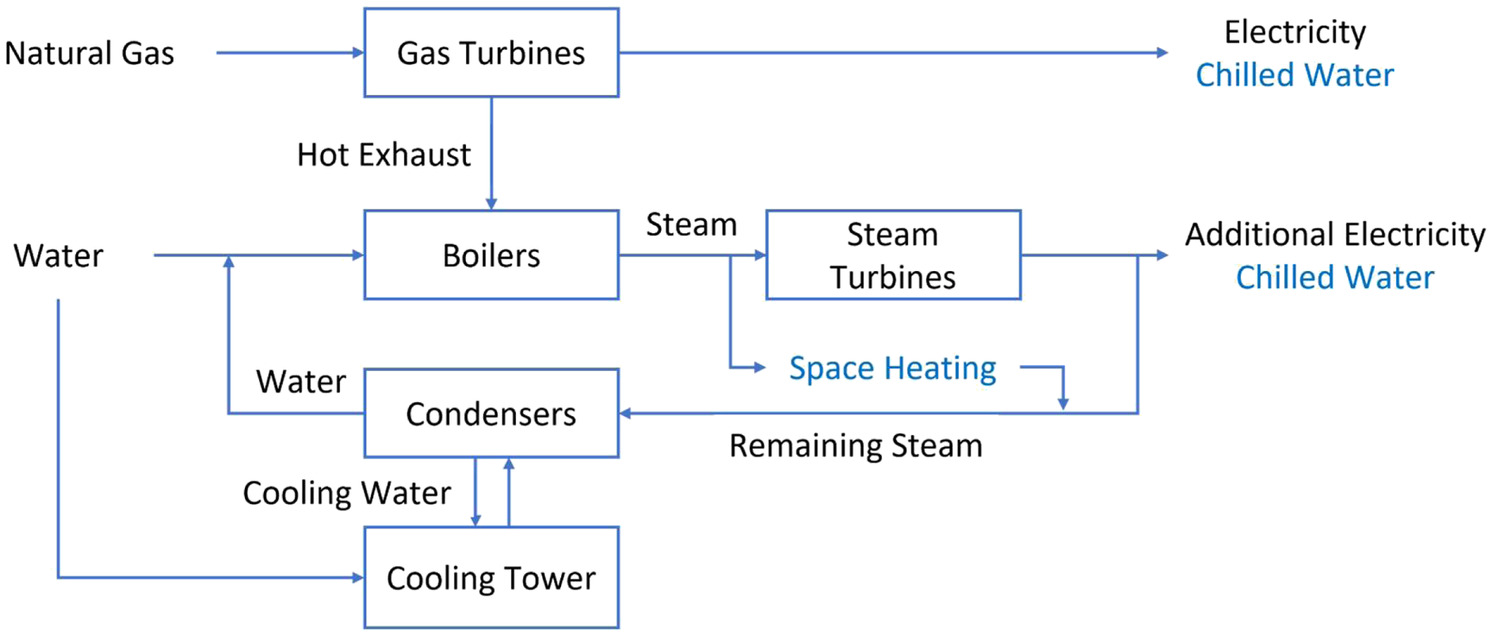
First, natural gas turbines are used to generate electricity. During the electricity generation process, a heat-recovery steam generator (HRSG) (i.e., gas turbines and boilers) uses heat from natural gas turbine exhaust to produce steam. Afterward, some of the steam goes through steam turbines to generate additional electricity. The remaining steam is piped to buildings for space heating purposes. Finally, all steam would go back to condensers and cooling towers to turn the steam into water.
The WWTP at UCONN contains two parts: the water pollution control facility (WPCF) and the reclaimed water facility (RWF). The WPCF primarily collects and treats domestic wastewater generated on campus. The effluent discharge from the facility is divided into the RWF and an outfall 4.83 km (3 mi) from campus, which discharges into the Willimantic River (University of Connecticut 2021c, 2022). The RWF uses a tertiary treatment process that allows UConn to divert up to 3.79 ML (1 million gal.) of treated water to meet the campus’s needs each day. One of these needs is at the Cogen power plant, which uses between 946,353 L (250,000 gal.) and 1,703,435 L (450,000 gal.) of cooling water per day (University of Connecticut 2021b). The RWF sends reclaimed water to the Cogen power plant to be used in the cooling towers and boilers. Approximately 20% to 60% of the water used returns to the WPCF (University of Connecticut 2022).
Water–Energy–Human Nexus Conceptualization
To better understand the water and energy systems, how they serve people in the university community, and how they affect the ecosystems, a water–energy–human nexus framework is proposed in Fig. 2. Essentially, in this framework, there are three core subsystems: water subsystem, energy subsystem, and human subsystem. The water subsystem has two major components: water supply and WWTP. The WWTP can be further categorized into the WPCF and RWF. For the energy subsystem, the state-of-the-art cogeneration (Cogen) plant is considered. Finally, the human subsystem refers to students, faculty, and staff as the end-users of water and energy on campus.
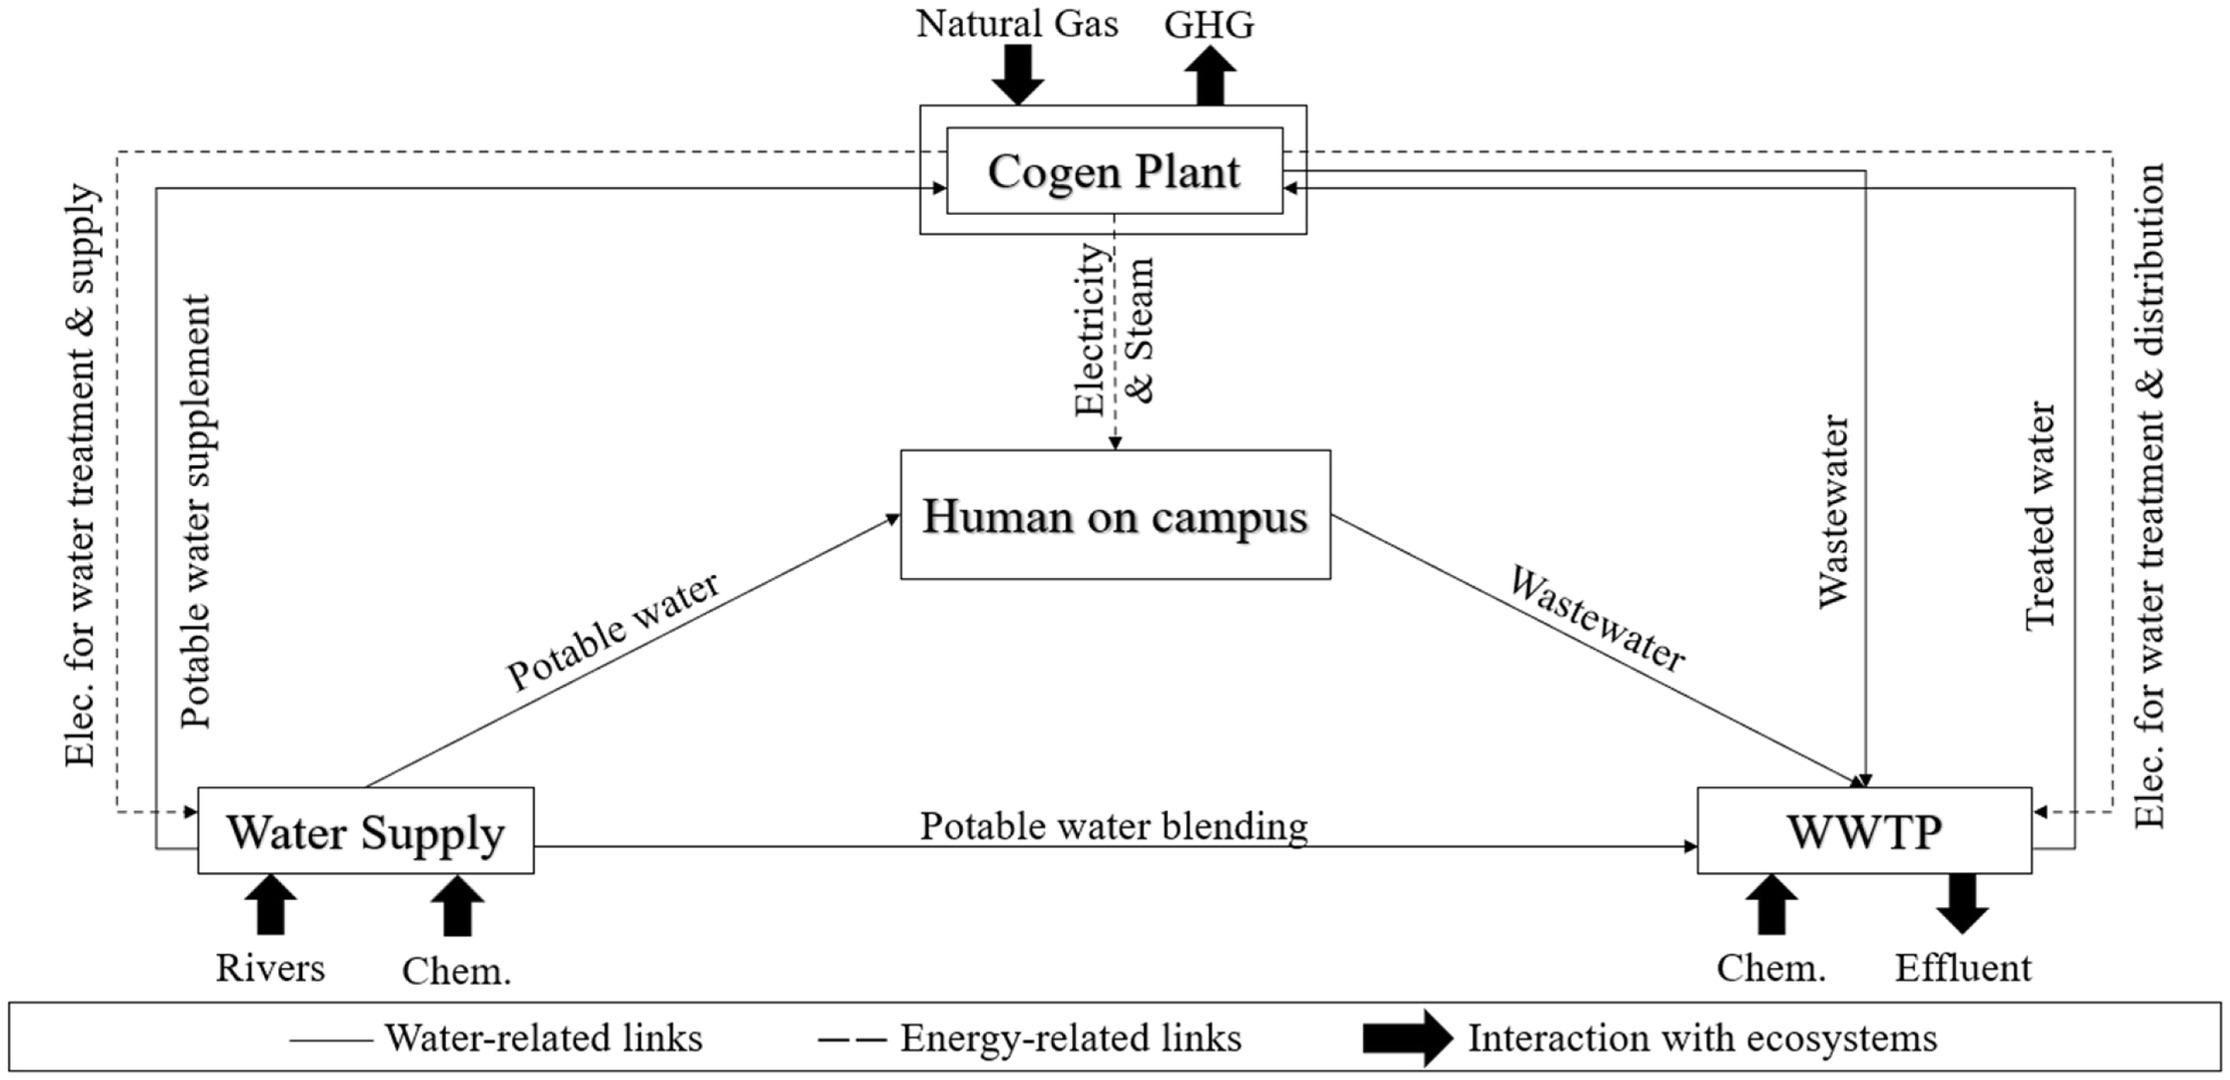
The three subsystems have multiple interdependencies and intradependencies. Different from the traditional WEN framework, the WEHN framework is human-centered. This is because ultimately both water and energy subsystems are developed by and for humans. In this study, we highlight the central role of end-users as they consume water and energy resources and produce wastewater that flows into WPCF. For example, in 2016, approximately 4.240 ML (1.12 million gal.) of water per day was consumed by approximately 27,900 on-campus service population (e.g., students, administration, faculty, and staff) (University of Connecticut 2021a). In 2020, the on-campus service population and resultant water usage decreased to approximately 27,300 and 2.461 ML (0.65 million gal.) of water per day, respectively. The reason for this sharp decline in water usage despite an almost similar level of on-campus service population is due to COVID-19 restrictions that were in effect. This shows the impact that end-user behavior can have on resource usage.
Regarding the water subsystem, the water supply system, WPCF, and RWF are interconnected. More specifically, the WPCF and RWF carry out wastewater treatment and retreatment while reclaimed water circulates among these two facilities. The water supply system sends potable water to both WPCF and RWF for blending purposes. The water subsystem is closely connected with both human and energy subsystems. The water supply system provides potable water for end-users’ daily consumption and for blending at the Cogen plant. RWF provides reclaimed water for cooling or boiling purposes in the Cogen plant. Finally, the energy subsystem, the Cogen plant, is linked with the human subsystem by providing electricity and heat for the daily consumption of end-users. In addition, the Cogen plant is connected to the water subsystem by generating electricity for water supply, distribution, and treatment processes.
The human, water, and energy subsystems also interact with ecosystems to varying degrees. Natural resources in the ecosystem are used as input to the water and energy subsystems. For example, the input source of the water supply system is a river, and the output is potable water; the input to the Cogen plant is natural gas and the output is electricity and steam. During the water and energy production processes, a significant amount of pollution may be generated, which affects the ecosystem. For example, large amounts of greenhouse gas (GHG) can be emitted into the air during the electricity and steam generation process in the Cogen plant. To achieve the desired sustainability goals, the interactions among the three subsystems and their relationships with the ecosystem should be well captured and quantified.
Assessing WEHN Performance Based on Emergy
In the proposed WEHN framework, the concept of emergy is used as a unified measurement for quantifying the consumption of different forms of resources in order to meet the end-users’ water and energy needs. Apart from providing a common unit that allows all resources to be compared, emergy analysis provides a mechanism that can capture the crucial contribution of ecosystems to human well-being (Hau and Bakshi 2004).
Emergy analysis stands as a pivotal concept in the realm of sustainability due to its ability to offer a comprehensive framework for evaluating the ecological and environmental facets intrinsic to sustainable practices. Emergy analysis delves deep into understanding the entirety of energy and resource dynamics within a system. It does not just account for the immediate inputs, but also incorporates the indirect resources and energy that underpin and sustain a system. By encompassing all these aspects, emergy analysis ensures a holistic view of a system’s environmental footprint, making it an indispensable tool for informed decision-making in sustainable development.
To implement emergy analysis in this study, a system diagram (Fig. 3) was developed to better visualize emergy consumed during the creation of water and energy services. This emergy system diagram identifies sources, flows, storages, interactions, and transactions during the whole process. For example, for the cogeneration plant production process, resource inputs include materials, natural gas, oxygen, labor and service (L&S), potable water, and treated water (from the resource storages), as well as capital (from the asset storage). Materials, natural gas, oxygen, L&S, potable water, and treated water storages connect to the cogeneration plant through generic resource flows. The capital storage connects to the cogeneration plant through money flow.
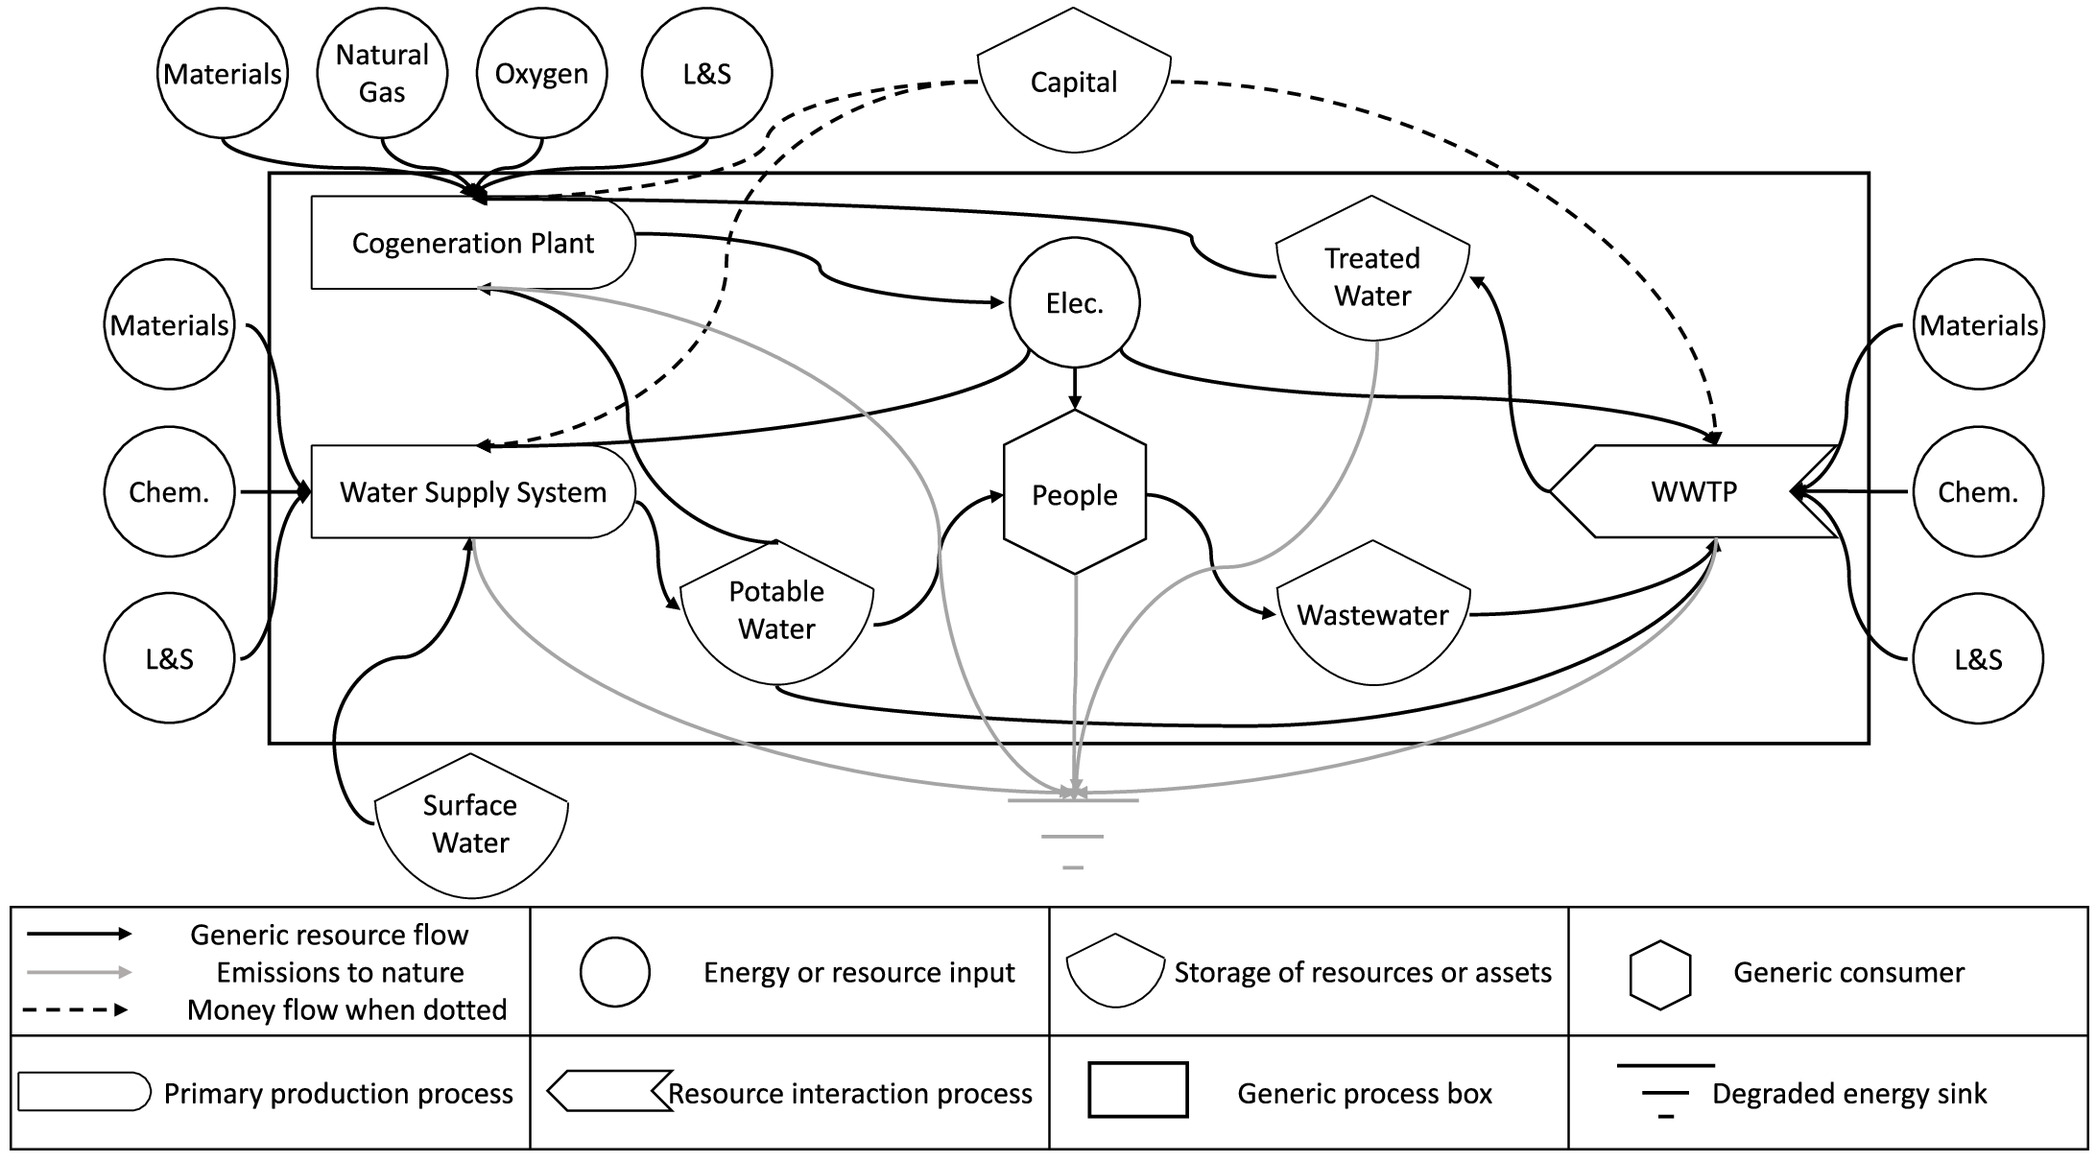
The cogeneration plant production process generates electricity as an output, which serves as an input for other facilities. In addition, by-products generated by the cogeneration plant production process flow to the degraded energy sink. The diagram integrates human factors by monitoring individual water and energy consumption, ensuring a holistic representation that aligns with real-world behaviors and highlights avenues for efficiency improvements.
Because emergy analysis measures all the inputs required to sustain a process as solar emergy, different kinds of investment, goods, services, processes, and information need to be quantified by means of a solar transformed value. It can be defined as the emergy of one type required to make a unit of energy of another type with the unit of solar emjoules per joule (i.e., sej/J). Thus, emergy of a particular type can be estimated by multiplying each quantity of energy (i.e., exergy) that is available for use by its solar transformed value (Yazdani et al. 2020). This can be mathematically expressed as follows:where , , and = emergy, solar transformed value, and exergy of the th source, respectively. The solar transformed value, , is the solar emergy used in producing 1 J of a product or service. Subsequently, the emergy for an entire system can be calculated as follows:where TEM = total emergy of the entire system; and = set of exergy sources. values can vary depending on the emergy baseline used for calculation. Emergy baseline refers to the geo-biosphere emergy baseline (GEB), quantifying the total global annual emergy inputs emanated from the solar radiation, tidal momentum, and geothermal on the biosphere (Brown et al. 2016). The emergy baseline value can vary at different periods of time. As a result, the solar transformed value can be calculated using equation:
(1)
(2)
(3)
The , , and values for different sources are typically identified from the previous research studies. Eq. (3) can be used to modify the old values based on the most recent GEB values.
System Dynamics Model
Based on the WEHN conceptual framework, this study applies SD modeling techniques to formulate and simulate the water and energy systems at UConn. SD modeling offers a whole-system approach to map the relationships and feedback between different infrastructure systems’ performance measures (e.g., emergy) and important parameters (e.g., resource availability) (Prouty et al. 2018; Rehan et al. 2011). Moreover, SD models can develop simulating scenarios (i.e., what-if scenarios) to inform decision makers about the expected or most likely change in performance measures based upon different management strategies (Olabisi et al. 2010). In this section, first, the different subsystems in the SD model are described. These subsystems are based on the campus-based conceptual model demonstrated in the previous section. Second, the emergy values related to these subsystems are explained in detail. Finally, using the SD model and emergy value estimation, the current sustainability level of the WEHN at UConn campus is measured.
Model Description
A SD model was developed using the AnyLogic platform. The time horizon of the model is 1 year, capturing both the fall and spring semesters, in addition to the summer and winter breaks. Fig. 4 shows a stock and flow diagram of the SD model.
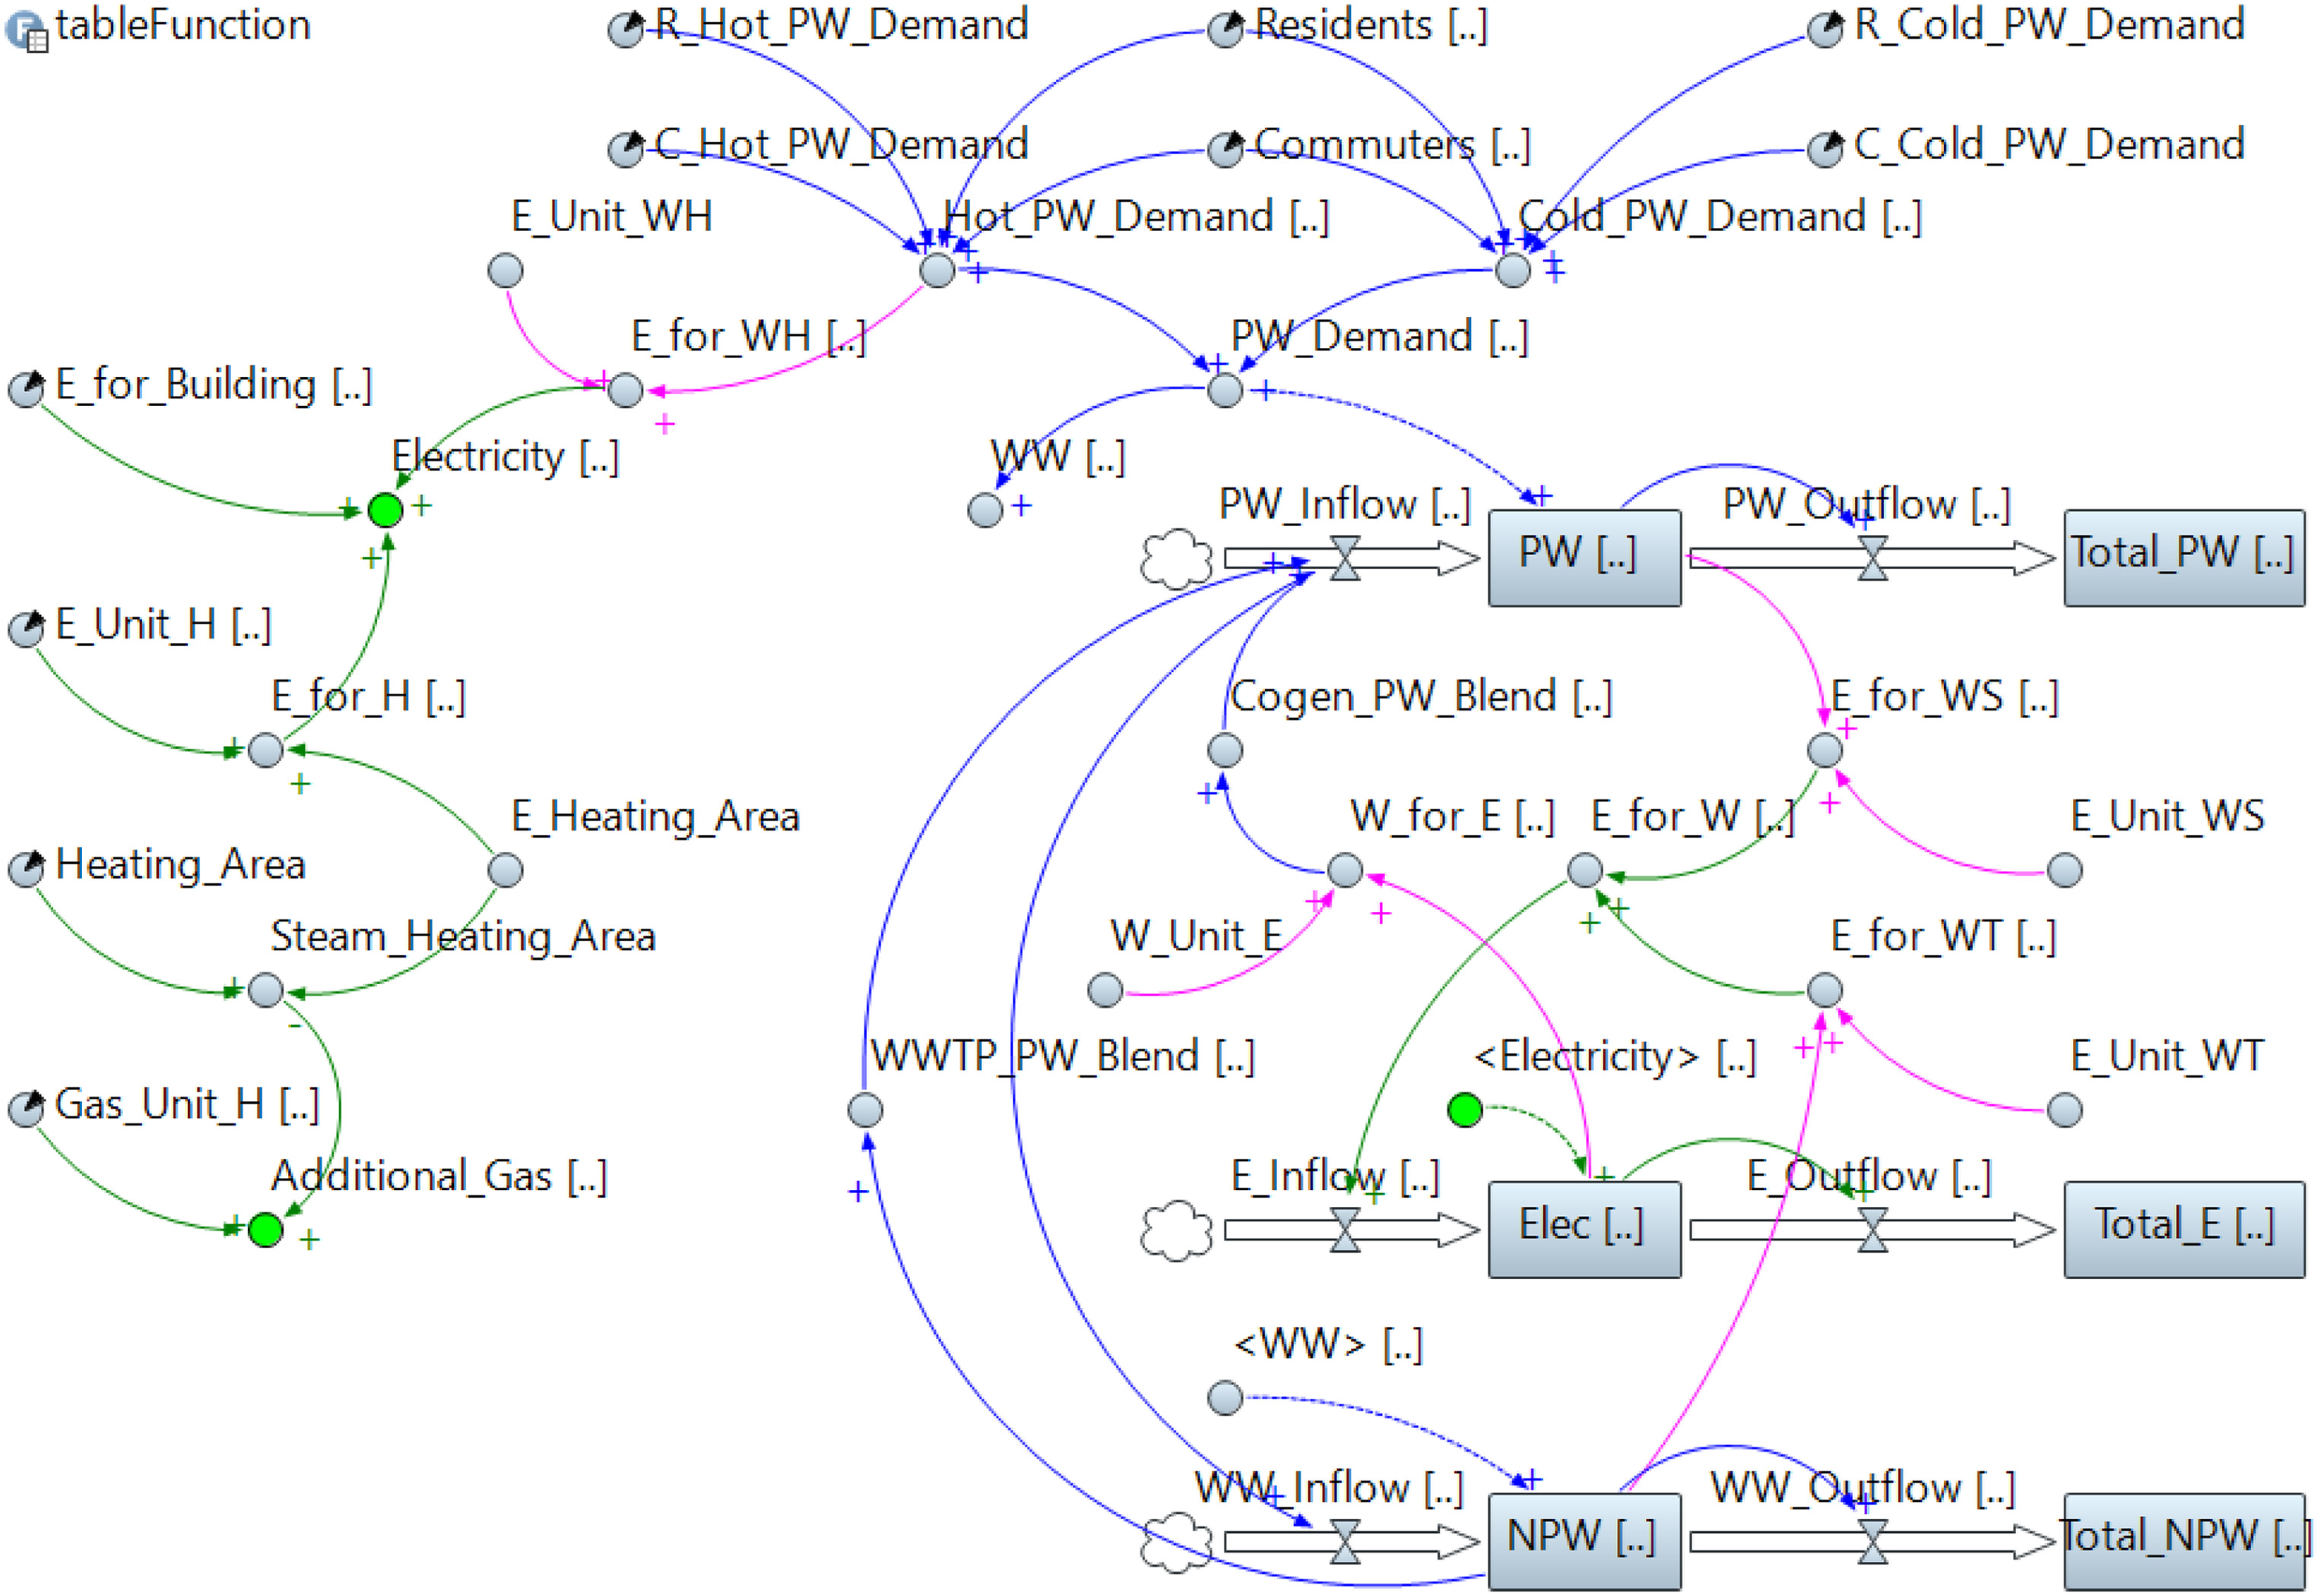
The details of the model are described as follows. The SD model has three kinds of variables: stock, flow, and auxiliary. Mathematically, a stock is an accumulation or integration of flows over time—with outflows subtracting from the stock. It typically has a specific value at each point in time. Total potable water (i.e., Total_PW) is an example of a stock variable in this study that captures the overall potable water flow at a particular time. A flow rate changes a stock over time and is typically measured over a certain interval of time. For example, E_for_W is a flow rate variable in this study that captures the potable water flow rate from the PW stock that also sends water for generating electricity. Finally, auxiliary variables, typically known as constants, simply represent calculations based on stocks and flows. Hot_PW_Demand is an auxiliary variable considered in this study that estimates the total hot potable water demand generated from a fixed number of residents and commuters and their unit demand. Combined, these variables develop the basic structure of the stock-flow diagram, in which feedback loops, the foremost concept in the simulation of the model, could be observed.
Human Subsystem
The human subsystem in this study includes residents and commuters on campus and directly determines the water and energy demand. Residents are identified as people who live on campus. Commuters are identified as faculty and staff, as well as commuting students. During the 1-year modeling period, the number of student residents experiences seasonal variation. The number of residents is higher during the fall and spring semesters and smaller during the summer and winter breaks. It is estimated that the residential population at UConn campus is about 12,296 in the fall semester and 11,633 in the spring semester (Milone & Macbroom 2020). To simplify the model, it is assumed that there are no residents during the summer and winter breaks. The commuter population is approximately 15,400 all year around. Furthermore, the aspect of strategic-level decision-making, a crucial component of the human subsystem, has been indirectly incorporated into the SD model. Essentially, this incorporation was achieved by introducing flexibility into the SD model, enabling it to simulate various levels of operational decision-making, primarily focusing on the operations of the energy subsystem.
Water Subsystem
The water subsystem has two stock variables: potable water consumption and treated water consumption. The potable water consumption stock quantifies cumulative potable water consumption on campus over time, including the potable water consumed by residents and commuters on campus, the potable water blending for the wastewater treatment plant, and the potable water blending for the Cogen plant. The amount of potable water consumption by residents and commuters depends on the population on campus. Residential potable water demand was observed to be about 77.6 L (20.5 gal.) and 47 L (12.4 gal.) per day per capita, respectively, for cold and hot potable water, whereas nonresidential potable water demand was observed to be approximately 43.5 L (11.5 gal.) and 23.5 L (6.2 gal.) per day per capita, respectively for cold and hot potable water (Milone & Macbroom 2020; Tourigny and Filion 2019). The amount of potable water blending depends on the treated water amount in both WWTP and the Cogen plant.
The treated water stock quantifies cumulative treated water on campus over time. The wastewater generated by users is treated and consumed on campus. Part of the treated water circulates in the electricity generation process and serves heating or cooling purposes. The treated water demand for electricity generation depends on the nonpotable water usage per unit of electricity generation and the total electricity demand on campus. As a result, the flow variable for the treated water stock is identified as the sum of the treated water circulation and potable water blending for both the WWTP and the Cogen plant.
Energy Subsystem
There are two stock variables for the energy subsystem: electricity consumption and steam consumption. The electricity consumption stock quantifies the electricity consumption on campus over time. The flow variable for the electricity consumption stock is the total electricity demand for buildings, space heating, water heating, supply, and treatment on campus. Electricity demands for unit water heating, supply, and water treatment are 25,330, 528, and 792 kWh/ML (0.096, 0.002, and .), respectively (Bluejay 2015; Goldstein and Smith 2002). Electricity demand for buildings or space heating depends on the electricity usage per unit area and the area size of buildings or space heating on campus. There are in total 0.947 million m2 (10.2 million sq ft) of building areas at UConn main campus, and in total 0.678 million m2 (7.3 million sq ft) space heating areas at UConn main campus (Tietjen 2016). The average electricity consumption for buildings at UConn (excluding water and space heating) is ( ) (E Source Companies LLC 2022).
In a real-world scenario, electricity usage fluctuates during semesters and breaks due to population change on a university campus. A simplified assumption is made in this study to account for this effect in the model: during the fall and spring semesters, electricity consumption for buildings is 10% higher than ( ft/day), whereas during the winter and summer breaks, electricity consumption for buildings is 10% lower. The average electricity consumption for space heating is ( ) (IotaComm 2020). To reflect the effects of seasonal change, it was assumed that electricity consumption for space heating is twice as high as ( ) during winter, and there is no need for space heating during summer.
Steam consumption is the total amount of steam demand for spacing heating on campus. When space heating is provided by steam, the unit steam consumption is ( ) (Langer 2022). Similarly, it was assumed that the steam consumption for spacing heating is twice as high during winter, and there is no need for spacing heating during summer.
Reinforced Loop
In the studied system, the water and energy consumption are closely interconnected, which forms a reinforced loop in the SD model. Electricity is required for water heating, supply, and treatment. The average electricity demand for water heating, water supply, and water treatment is assumed to be 25,330, 528, and 792 kWh/ML (0.096, 0.002, and .). (Bluejay 2015; EPRI 2021). On the other hand, water is needed for electricity generation on campus. The water demand for unit electricity production was assumed to be 1.893 L/kWh () (Stanford University 2013). If the total water consumption increases, electricity usage for water heating, supply, and treatment will accordingly increase. As a result, more electricity will be generated, and more water will be needed for the additional electricity generation.
Emergy Estimation
Emergy values were estimated for potable water, treated water, electricity, and steam. These values helped to quantify different objectives (e.g., economic cost and environmental impact) toward sustainability goals via a unified measurement. With regards to potable water emergy estimation, inputs included renewable resources (e.g., river) and human-made inputs (e.g., chemicals and electricity). The old solar transformed value for potable water (i.e., ) was found to be . The old and new GEB values were observed to be and , respectively (Brown et al. 2016; Odum 1996, 2007). Using Eq. (3), the new solar transformed value for potable water (i.e., ) was estimated to be .
With regards to treated water, the emergy considered in this study is the energy consumed for turning the wastewater into treated water (i.e., the wastewater treatment process). Inputs for the wastewater treatment process included wastewater, resources (e.g., chemicals and construction materials), energy, and economic input (e.g., cost of treating sludge); outputs include treated water and emission of pollutants. The difference between solar transformed values of treated water (i.e., ) and wastewater (i.e., ) was used as the solar transformed value of this process. The equivalent emergy value for this process was using the new solar transformed value.
Finally, to estimate the emergy values for electricity and steam, first, consumption of different inputs [i.e., flow inputs: oxygen, potable water, and natural gas; economic cost: investment and operations and maintenance (O&M) cost] and outputs (i.e., electricity and steam) were estimated. For example, the value for net electricity consumed at UConn is 24,900 kW. The total installment cost is . Assuming a 40-year designed life for UConn cogeneration plant that is producing the electricity, the yearly investment cost was estimated to be 917,565 USD (i.e., ). Using the same set of GEB baselines and old solar transformed values for each input and output, the emergy values were estimated. The emergy values for electricity and steam were estimated to be and sej, respectively. Table 1 presents the emergy values of major inputs and outputs in the Cogen plant. Table 2 summarizes the emergy values for potable water, nonpotable water, electricity, and steam, respectively.
| Item | Description | Basic data | UEV (sej/unit) | Emergy (sej) |
|---|---|---|---|---|
| Inputs | ||||
| R | Oxygen (in air) | |||
| NR | Potable water | |||
| NP1 | Natural gas | |||
| NP2 | Investment cost | USD | ||
| NP3 | O&M | USD | ||
| Output, | ||||
| Electricity | ||||
| Steam | ||||
| Total | — | — | — | |
Note: UEV = unit emergy value.
| Source | UEV | Converted UEV |
|---|---|---|
| Potable water | (.) | |
| Treated water | (.) | |
| Electricity | ||
| Steam |
Note: UEV = unit emergy value.
Simulation Experiments
Three sets of experiments were conducted considering: (1) end-users’ water and energy consumption behavioral change, (2) operational decisions regarding space heating, and (3) combinations of multifaceted strategies mentioned previously. The first set of experiments was designed to evaluate the impact of modifications on end-users’ behavior relating to water and energy consumption. In these experiments, various scenarios were constructed to observe the potential changes and outcomes resulting from alterations in consumption patterns. The aim was to gain insights into how shifts in individual and collective behaviors can influence the overall sustainability of the system. By closely examining these variations, the experiments sought to uncover the intricate relationship between user behavior and resource utilization, thereby providing valuable data to inform future strategies and interventions for promoting sustainable consumption practices.
The second set of experiments honed in on evaluating the impact of varying operational decisions concerning sources of space heating on the overarching sustainability of the system. At present, the entirety of space heating at UConn is facilitated by steam generated in the Cogen plant. This set of experiments introduced an alternative scenario where space heating could be achieved using electricity, offering a contrasting operational strategy for heating provision. In implementing this alternative, the system would not directly use steam for space heating. Instead, a greater volume of steam would be directed through the steam-driven turbine generators. This adjustment in operational flow would result in the generation of additional electricity, which would then be allocated for space heating.
By exploring this alternative, the experiments aimed to discern the potential shifts in sustainability and efficiency that might arise from such a change in operational strategy. The findings from this set of experiments would provide valuable insights into the feasibility and implications of diversifying space heating sources, and how such diversification could influence the ecological footprint and resource utilization of the university campus. This deeper understanding would be instrumental for informed decision-making in developing sustainable operational practices and optimizing resource use.
Finally, the third set of experiments delved into the possibility of devising novel strategies by amalgamating various tactics explored in the first and second experiments. The primary aim was to assess if a synergistic approach, integrating multiple strategies, could provide an amplified positive impact on sustainability compared with the sum of their individual effects. It is pivotal to recognize that although some strategies might offer tangible benefits when combined, others might lead to diminishing returns or even counterproductive outcomes. This dynamic underscores the importance of meticulous evaluation and strategy design. Planners and decision makers; thus, have the onus of navigating this intricate landscape. They need to be acutely aware of these potential synergies and trade-offs. By understanding the interactions between different strategies, they can tailor a roadmap that aligns closely with the desired sustainability objectives.
Results
To assess the effects of different strategies on improving sustainability on UConn campus, numerical experiments were designed and conducted using the SD model. The SD model was used to first estimate the current sustainability level of the UConn campus. Currently, at UConn all space heating is provided by steam generated in the Cogen plant. Based on the information, the SD model was run to estimate the total water and energy resource consumption at UConn for a year. Results showed that to fulfill the current water and energy demand, total potable water (PW) and treated water (NPW) consumption are 1,899 ML (501,658 kgal.) and 1,603 ML (423,406 kgal.), respectively (Table 3). The overall electricity consumption is 188,674 MWh, and of steam is required for steam-based space heating. The equivalent emergy was estimated to be sej. It is important to mention that Table 3 establishes the baseline for subsequent experiments. These results provided decision makers with a general idea about the level of resource consumption and level of sustainability of campus and a basis for comparison for potential sustainability enhancement strategies.
| Resource | Amount | UEV () | Emergy |
|---|---|---|---|
| Total potable water | 1,899 ML (501,658 kgal.) | ||
| Total treated water | 1,603 ML (423,406 kgal.) | ||
| Total electricity | 188,674 MWh | ||
| Total steam | |||
| Total emergy | — | — |
Note: UEV = unit emergy value.
The estimated results were compared with the UConn Water Supply Plan Report (Milone and Macbroom 2020). It was observed that the typical average potable water usage from 2011 to 2019 was 3.351 ML (885,054 gal.) per day or 1,223 ML (323,045 kgal.) annually (Milone & Macbroom 2020). The simulation result showed that the annual water usage was 1,899 ML (501,658 kgal.), which was approximately 55.3% higher compared with the UConn Water Supply Plan Report. According to the report, the total electricity production in 2019 was 126,455 MWh. The simulated electricity demand of 188, 674 MWh was approximately 49.2% higher compared with 126,455 MWh. The error rate for both the water and energy consumption in the model is at a similar level (both are around 50%). The reason behind this is twofold. First, the unmetered water demand is not included in the report. Unmetered water refers to water consumed for authorized utility purposes such as operation and maintenance and unauthorized uses such as inaccurate meters or leaks. Without considering the unmetered water, the true resource flow may not be captured. Second, maximum utilization is assumed in the SD model. The SD model assumes that all the residential and commuter population will consume the maximum available resources (based on their usage rate). This may not be accurate because the usage rate may vary from person to person.
Experiment 1
Two scenarios were created: in Scenario S1, it was assumed that end-users’ water demand decreased by 10% by various water conservation campaign activities on campus, such as the Step the Drop initiative (UConn Office of Sustainability 2022). Scenario S2 assumed that end-users’ energy demand decreased by 10% by various energy conservation campaign activities on campus, such as the EcoMadeness initiative. By integrating these human-centric changes into the system dynamic model, the intent was to weave the human subsystem more seamlessly with the technical water and energy systems. The system dynamic model was run under the two scenarios. The model output including potable consumption, treated water amount, electricity consumption, and the total emergy value, were compared with the baselines in the current situation. Fig. 5 summarizes the percentage change of each output indicator.
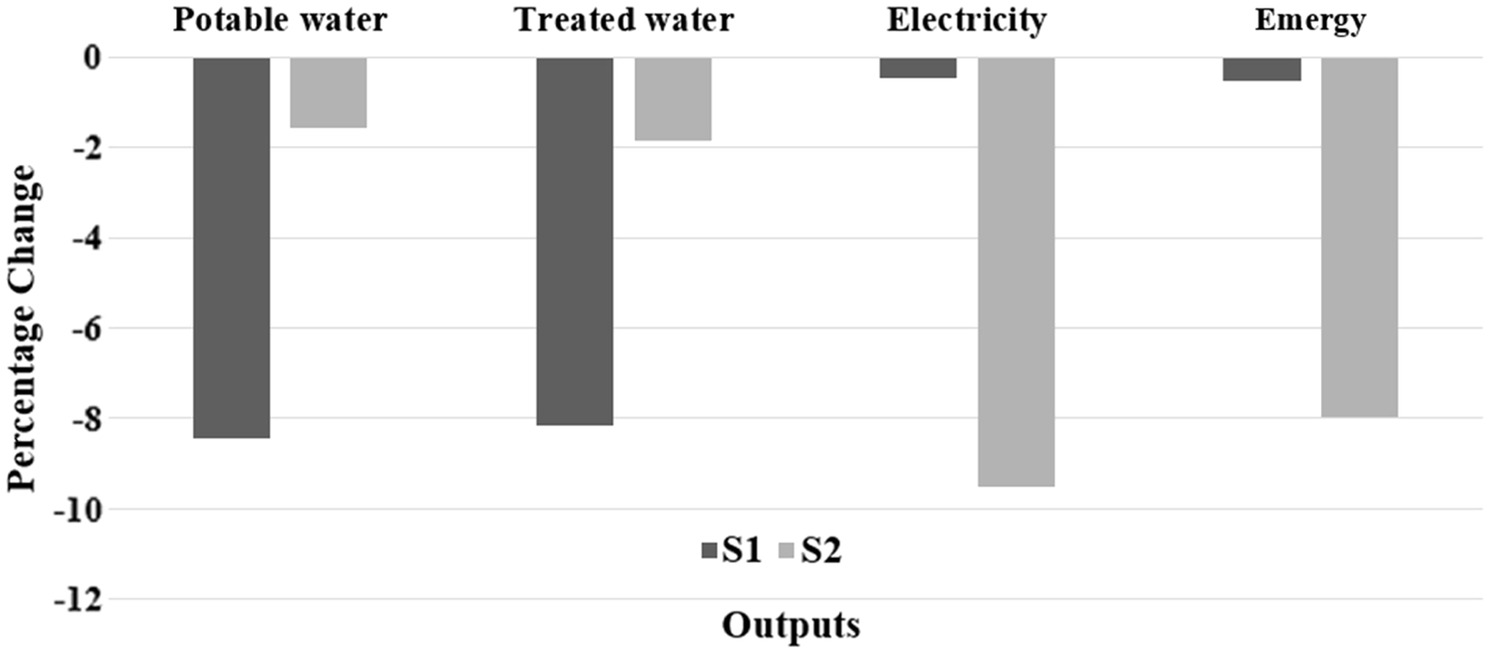
The results showed that S1 had a significant effect in reducing water resource consumption and wastewater treatment needs, with yearly potable water consumption decreased by almost 8.44% and treated water amount decreased by 8.15% (Fig. 5). The electricity consumption in S1 only reduced 0.47% compared with the baseline. On the other hand, electricity consumption decreased significantly (9.53%) in S2. The potable water consumption and treated water were reduced by 1.56% and 1.85%, respectively, in S2. This makes intuitive sense because a decrease in water and electricity demand will have more significant impacts on their respective product requirements.
One interesting observation from this experiment was that Scenario S2 had a more significant impact on water (e.g., 1.56% for potable water and 1.85% for treated water) compared with the impact that Scenario S1 had on electricity (i.e., 0.47%). This indicates that in the context of this WEHN, the dependency of energy on water is stronger than that of water on energy. In other words, there is a larger water consumption requirement for electricity generation, whereas energy requirement for water supply and distribution is relatively low. As a result, the impact of human energy consumption reduction on water was more significant than human water consumption reduction on electricity.
A deep-dive into these findings underscored a pressing need to harmonize human behaviors—be it water or energy-saving—with the broader technical systems for holistic sustainability outcomes. Moreover, when emergy values of these scenarios were measured against the baseline, S2 stood out as a beacon of how strategic shifts in human behavior, when synced with the technical system, can drive systemwide sustainability. More specifically, when comparing with the current emergy values, it was found out that Scenario S2 could reduce the overall emergy by 7.97%, whereas Scenario S1 could only reduce the overall emergy by 0.52%. This shows that S2 is more effective in enhancing the overall sustainability of the WEHN on the UConn campus. Planners and decision makers should be cognizant of this phenomenon. If they plan to enhance sustainability by influencing end-user behaviors, advocating electricity savings in this case could be more effective for the system as a whole.
Experiment 2
Two simulation scenarios were developed (i.e., S3 and S4) to test the effects of space heating sources used at UConn. In Scenario S3, it was assumed that half of the facilities on campus would adopt steam-based space heating, whereas the rest would adopt electricity-based space heating. Scenario S4 assumed that all space heating would be provided by electricity generated in the Cogen plant. Fig. 6 summarizes the percentage change of each output indicator compared with the baseline in these two simulation scenarios.
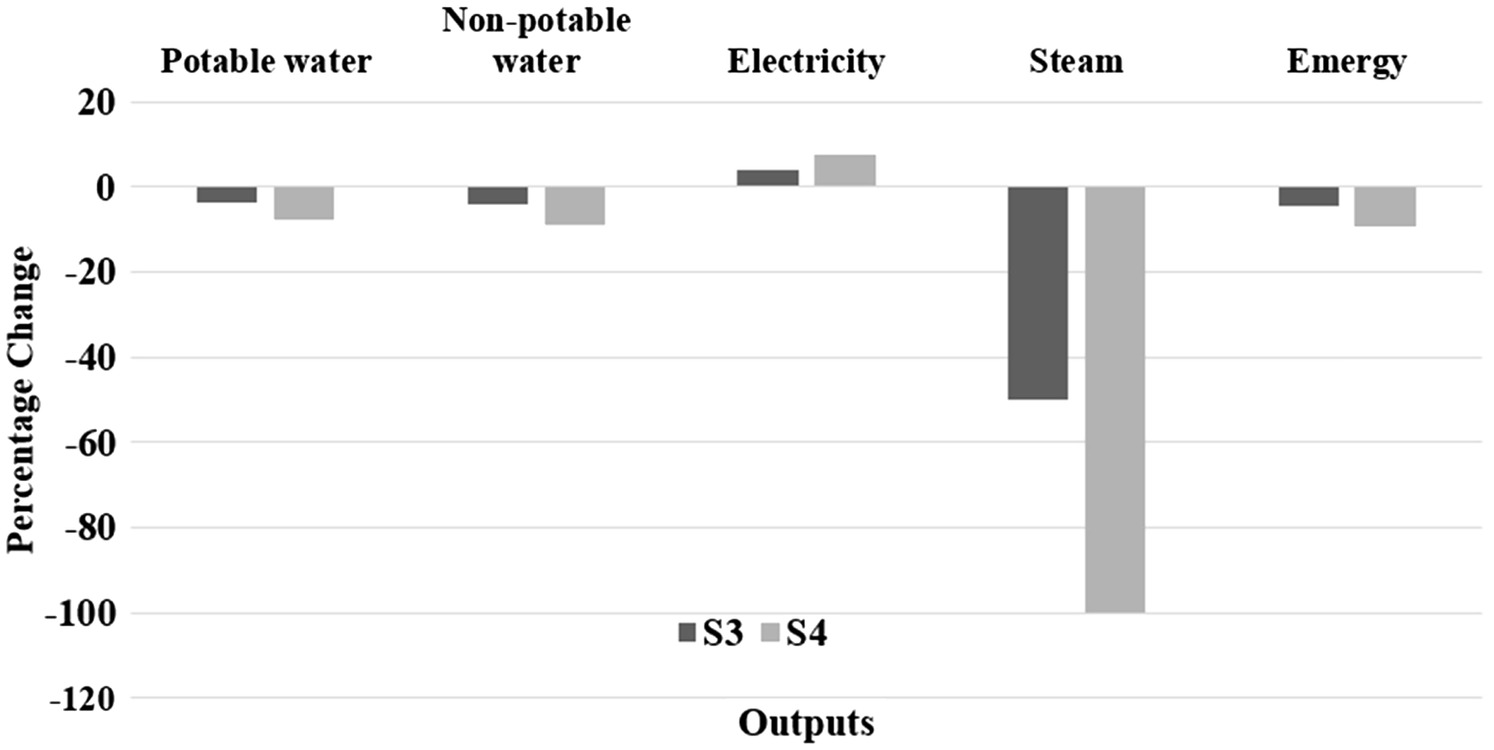
Results showed that in both Scenarios S3 and S4, potable water consumption, treated water amount, and steam consumption reduced, but electricity consumption increased. As a direct outcome of the change in space heating sources, the additional steam generation requirement dropped by 50% and 100%, respectively, in Scenarios S3 and S4. Accordingly, electricity consumption increased by 3.80% in S3 and 7.60% in S4 to meet the requirement for space heating.
In terms of water, potable water usage was reduced by 3.63% in S3 and 7.57% in S4 respectively. The treated water was reduced by 4.3% in S3 and 8.97% in S4, respectively. The reason behind it is that when using steam-based space heating, there is a certain loss of water during the process of turning water into steam because steam vents to the atmosphere. Water loss during the process of electricity generation is much smaller.
Overall, emergy decreased by 4.64% and 9.26% in Strategies S3 and S4, respectively, compared with the base case. Although more electricity consumption would increase the emergy, the reduction in water and steam decreases the emergy even more. This experiment elucidates the crucial intersection of human behavior, particularly at the decision-making level, with technical systems. This could help decision makers to make operational decisions regarding the reuse of steam for power and heat. The results vividly capture how strategic, sustainability-focused decisions can lead to notable shifts in system performance. They also underline the potential ripple effects of a single decision, emphasizing the need for a harmonized integration of the human subsystem with technical operations. Trade-offs among water, electricity, and steam need to be carefully evaluated based on decision makers’ priorities and constraints when developing strategies for improving sustainability.
However, there are technical limitations to such operational decisions, such as the availability of electric spacing heating systems for buildings. For university campuses aiming to heighten sustainability, fostering an environment that encourages behavior favoring sustainable practices, both at the end-user and decision-making levels, is paramount. Decision makers must recognize the profound impacts of their choices and be guided by a commitment to holistic sustainability.
Experiment 3
Six additional strategies (i.e., Strategies S5 through S11) were developed (Table 4). For example, Strategy S8 combines Strategies S2 and S3, meaning (1) end-users’ energy demand decreases by 10%, and (2) 50% of the space heating is provided by steam and electricity each. Figs. 7 and 8 show the total potable water consumption and total electricity consumption over time during a year under selected scenarios. Simulation results of all scenarios are summarized in Table 4.
| Scenario | Scenario composition | Total potable water [(ML) kgal.] | Total treated water [(ML) kgal.] | Total electricity (MWh) | Total steam (MJ) | Emergy (sej) |
|---|---|---|---|---|---|---|
| S5 | 1,709 (451,492) () | 1,442 (381,065) () | 169,807 () | (0.00%) | () | |
| S6 | 1,670 (441,216) () | 1,404 (370,790) () | 194,949 (3.33%) | () | () | |
| S7 | 1,596 (421,552) () | 1,329 (351,125) () | 202,110 (7.12%) | 0 () | () | |
| S8 | 1,808 (477,591) () | 1,512 (399,339) () | 177,881 () | () | () | |
| S9 | 1,740 (459,786) () | 1,444 (381,535) () | 185,051 () | 0 () | () | |
| S10 | 1,648 (435,350) () | 1,381 (364,923) () | 176,986 () | () | () | |
| S11 | 1,581 (417,642) () | 1,314 (347,216) () | 184,158 () | 0 () | () |
Note: Values in parentheses show the percentage decrease from the current levels. water saving; energy saving; S3 = half steam, half electric; and S4 = all electric heating.
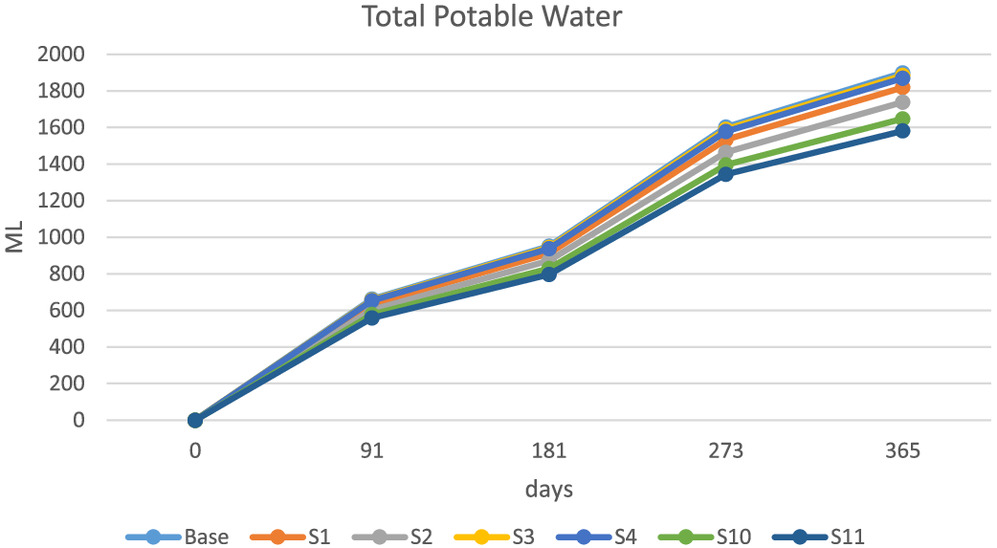
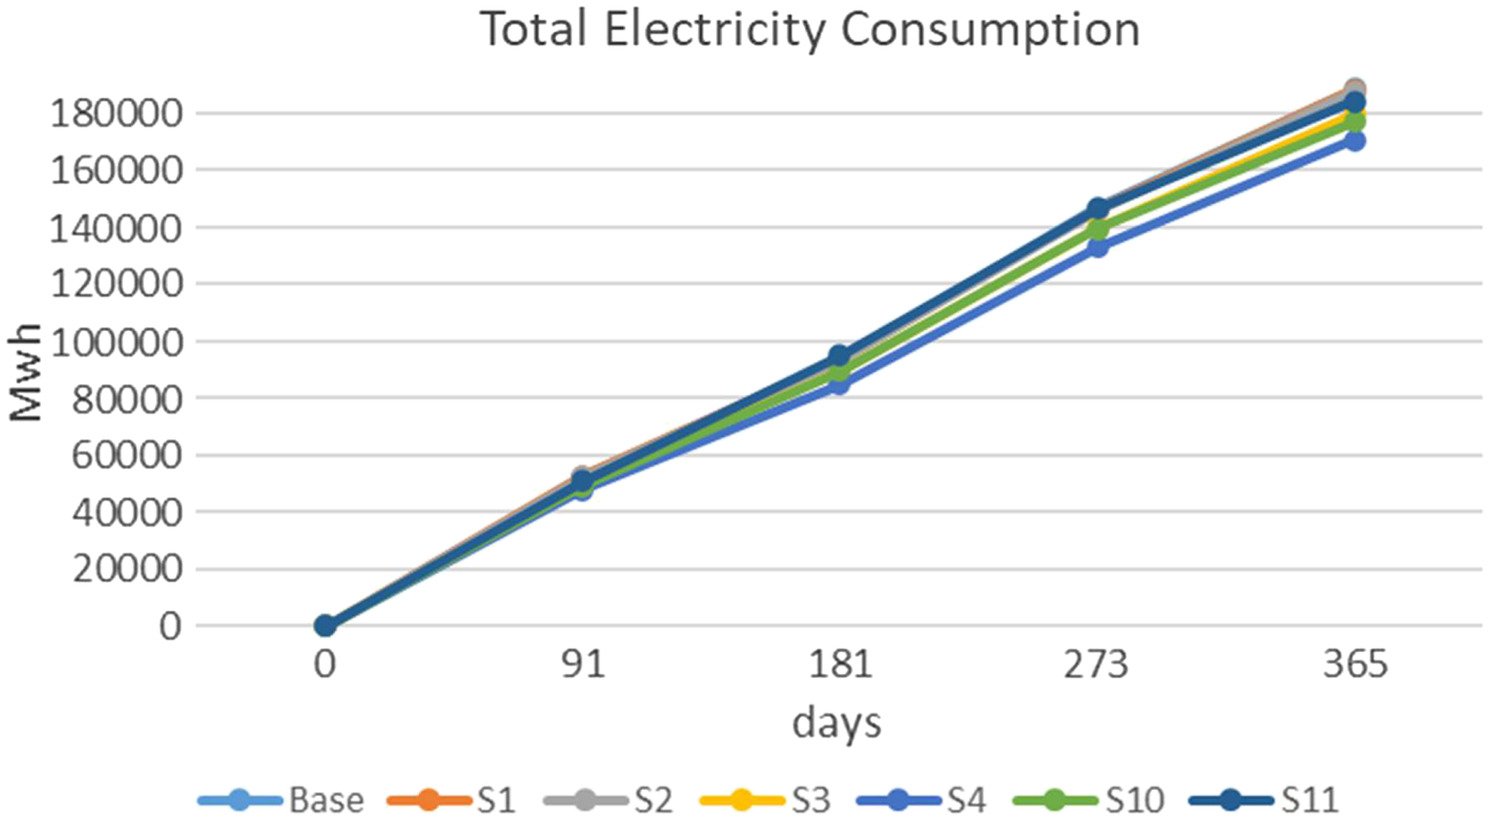
Results showed that the combined strategies have an additive effect on resource consumption reduction; however, depending on the nature of specific strategies, this effect could be less than the sum of the effects of the individual strategies. For example, in S2, the potable water consumption was reduced by 1.56%. In S3, the potable water consumption was reduced by 3.63%. However, in S8, where both S2 and S3 were implemented, the potable water consumption decreased by 4.80% compared with the current level, less than the 5.19% decrease that is the sum of 1.56% and 3.63%. Although the percentage difference is modest, it could represent a significant difference in actual resource consumption volumes. The simulation results illustrated that although integrating human strategies often amplifies benefits, the magnitude might differ based on the specific human behaviors and technical interplay involved. For example, individual reductions in water or energy consumption might not always linearly sum up when combined due to the nuanced feedback loops within the system. This nonlinearity, deeply rooted in human behavior and system response, emphasizes the necessity for decision makers to be adept and flexible, ensuring that they prioritize strategies that align best with overarching sustainability goals, all while fostering a culture of conscious consumption and responsibility among end-users.
Discussion
The University of Connecticut’s main campus was used as an application example to demonstrate how WEHN can optimize integrated resource management toward sustainability goals. The proposed SD model–based framework deconstructs the interdependencies among human, water, wastewater, and energy systems at UConn campus and facilitates the investigation of multifaceted strategies, leading to higher levels of sustainability. Although there is a plethora of research utilizing systems dynamic modeling for water–energy use, this particular approach stands out due to its in-depth examination of end-user behaviors within a university environment. This framework underscores the impact of academic cycles, student and faculty behaviors, and event-driven energy/water demands. By intricately weaving these human-driven strategies with the technical and natural subsystems, the study revealed layered interdependencies often overlooked in broader models. Moreover, the introduction of targeted scenario analyses, tailored to the university backdrop, offers a nuanced understanding of how systemic adjustments, at both user and administrative levels, can influence sustainability outcomes. In essence, this method bridges the gap between generalized modeling techniques and the specific, dynamic characteristics of university campuses, leading to more tailored and effective sustainability strategies.
The main avenues through which the suggested framework enhances sustainability in a broader context encompass the areas discussed in the next subsections.
Human Behavior and Sustainability
By explicitly considering human-driven strategies, the framework underscores the pivotal role of behavioral change in realizing sustainability goals. It emphasizes that although technological and infrastructural changes are crucial, the sustainable impact of these changes can be magnified or diminished based on end-user behavior.
Strategic Decision-Making
The framework aids decision makers in evaluating strategies not just based on immediate resource-saving impacts but also on long-term sustainability goals. Comparisons in terms of sustainability levels can be easily made using the integrated emergy indicator. This can foster the culture of continuous learning for sustainable progress. This forward-looking perspective ensures that adopted strategies are resilient and adaptable to future changes.
Interconnectedness and Resource Optimization
By elucidating the intricate interrelationships among water, wastewater, energy systems, and human activities, our framework promotes a systems-thinking approach. Such a perspective is vital for ensuring that resources are not viewed in silos but as interconnected entities. This holistic view can lead to more optimized and sustainable resource management strategies.
Scalability and Replicability
Although this study is presented within a university setting, the principles and methodologies encapsulated in our framework are designed to be scalable and replicable. This means that insights derived can be applied to broader urban environments or other similar microcosms, furthering the reach and impact of sustainable practices.
The current modeling framework can be used as a building block for more complex WEHN analysis. The simulation results of this study provide useful insights into sustainability practices by considering and comparing the impacts of different strategies related to human behavior change, operational decision-making, and combinations of multiple strategies. They can also create different realities regarding factors such as human behavior change and technological innovation, which facilitate scenario planning for sustainability improvement. Researchers and practitioners can modify this model to integrate system-specific characteristics and feedback loops that best reflect their own WEHN complexities.
Conclusions
This study has developed an emergy-based SD modeling framework for studying WEHN that can evaluate multifaceted strategies to improve sustainability. A case study was conducted that models the WEHN at UConn campus, consisting of a state-of-the-art cogeneration facility and a reclaimed-water facility, serving the university students and staff. Information regarding water and energy supply and demand, infrastructure operation, and seasonal population change on campus were collected to develop a computational model of the WEHN. Essentially, this study provides a formalized approach for sustainable development regarding resource use and reuse within a WEHN setup.
The overarching contributions of this study are twofold. First, this study contributes to the existing theory of sustainable development. This study integrates the theories of WEHN and system dynamics modeling to create a novel theoretical lens for sustainability assessment. The evaluation of interdependency among human, technical, and natural subsystems as complex systems and investigation of sustainability based on emergy estimation provide opportunities for a better understanding of a system’s performance. Emergy also provides a unified measurement tool for quantifying the consumption of different forms of resources and comparing different multifaceted strategies combining human and technology-based interventions. This is currently absent in WEHN-based research studies.
Second, this study has practical contributions that can potentially enhance the ability of decision makers in sustainability enhancement planning. Decision makers can quantitatively evaluate different strategies based on emergy. For example, decision makers can quantify the degree of decrease in emergy based on different strategies such as users’ water and energy consumption behavioral change, operational decisions regarding space heating sources, and combinations of strategies. This can help decision makers identify which strategy works better under both short-term and long-term sustainability goals. The proposed framework can also serve as the foundation for developing planning aid tools and indicators to better examine system interdependence, water and energy flow requirements, and end-users’ behavior.
Within the broader canvas of construction engineering and management research, a study in a university setting is indispensable for several reasons. Universities, as microcosms of urban environments, present a unique blend of architectural diversity, infrastructural challenges, and dynamic human behaviors. Their campus structures range from historical edifices with legacy infrastructural systems to cutting-edge, modern constructions designed for sustainability. This diversity offers a rich tapestry for examining construction techniques, materials, and management strategies. Moreover, the ebbs and flows of university life, marked by academic calendars, bring periodic surges and recesses in facility use, thereby testing the resilience, adaptability, and efficiency of constructed systems. However, what sets universities apart and warrants dedicated study is their inherent nature as crucibles of innovation. They often serve as pioneering grounds for sustainable practices, novel construction technologies, and advanced management methodologies, given their access to research, skilled talent, and their commitment to knowledge dissemination. A study capturing this environment does not merely detail the present; it often hints at future trends in construction engineering and management.
This study also offers a lens into best practices and potential pitfalls within a microurban environment. It provides a testing ground for theories that could later be scaled to larger urban settings. Most crucially, it amplifies the role of universities not just as educational institutions, but as vibrant, evolving hubs where construction and engineering theories are put to the test, refined, and perfected. In essence, by focusing on universities, the research provides insights that are both immediately actionable and strategically forward-looking, enriching the discipline’s global body of knowledge.
There are a few limitations in this study. This study only used the UConn campus and the technological infrastructure available within it to design the WEHN. A more holistic WEHN design may be required considering more dimensions of energy, water, and human systems (e.g., detailed water extraction process) such as to better capture the complex interdependencies and develop sustainable improvement strategies accordingly. More detailed analysis on how to combine comprehensive and transdisciplinary human-centered innovative approaches to water efficiency, energy efficiency, and greenhouse gas reduction is needed that can enhance the sustainability levels of university campuses. Collecting more user data regarding resource consumption behavior may also lead to a better estimation of sustainability levels. These limitations will be addressed by the authors in future studies.
Data Availability Statement
All data, models, or code that support the findings of this study are available from the corresponding author upon reasonable request.
Acknowledgments
The authors greatly acknowledge the financial support provided by the University of Connecticut Civil and Environmental Engineering Department Research Seed Grant.
References
Al-Ansari, T., A. Korre, Z. Nie, and N. Shah. 2017. “Integration of greenhouse gas control technologies within the energy, water and food nexus to enhance the environmental performance of food production systems.” J. Cleaner Prod. 162 (Sep): 1592–1606. https://doi.org/10.1016/j.jclepro.2017.06.097.
Al-Nory, M., and M. El-Beltagy. 2014. “An energy management approach for renewable energy integration with power generation and water desalination.” Renewable Energy 72 (Dec): 377–385. https://doi.org/10.1016/j.renene.2014.07.032.
Antipova, E., A. Zyryanov, D. McKinney, and A. Savitsky. 2002. “Optimization of Syr Darya water and energy uses.” Water Int. 27 (4): 504–516. https://doi.org/10.1080/02508060208687038.
Association for the Advancement of Sustainability in Higher Education. 2021. “Sustainable campus index introduction.” Accessed October 31, 2022. https://www.aashe.org/wp-content/uploads/2020/11/SCI_2020.pdf.
Bluejay, M. 2015. “Water heater energy use figures.” Accessed December 26, 2022. https://michaelbluejay.com/electricity/waterheaters-figures.html.
Boretti, A., and L. Rosa. 2019. “Reassessing the projections of the world water development report.” NPJ Clean Water 2 (1): 15. https://doi.org/10.1038/s41545-019-0039-9.
Brown, M. T., D. E. Campbell, C. de Vilbiss, and S. Ulgiati. 2016. “The geobiosphere emergy baseline: A synthesis.” Ecol. Modell. 339 (May): 92–95. https://doi.org/10.1016/j.ecolmodel.2016.03.018.
Capuano, L. 2021. “International energy outlook (IEO).” Accessed October 31, 2022. https://www.eia.gov/outlooks/ieo/.
Cerutti, A. K., S. Bruun, G. L. Beccaro, and G. Bounous. 2011. “A review of studies applying environmental impact assessment methods on fruit production systems.” J. Environ. Manage. 92 (10): 2277–2286. https://doi.org/10.1016/j.jenvman.2011.04.018.
Chen, G. Q., M. M. Jiang, B. Chen, Z. F. Yang, and C. Lin. 2006. “Emergy analysis of Chinese agriculture.” Agric. Ecosyst. Environ. 115 (1–4): 161–173. https://doi.org/10.1016/j.agee.2006.01.005.
Cherchi, C., M. Badruzzaman, M. Gordon, S. Bunn, and J. G. Jacangelo. 2015. “Investigation of cost and energy optimization of drinking water distribution systems.” Environ. Sci. Technol. 49 (22): 13724–13732. https://doi.org/10.1021/acs.est.5b03666.
Clarke, D. P., Y. M. Al-Abdeli, and G. Kothapalli. 2015. “Multi-objective optimisation of renewable hybrid energy systems with desalination.” Energy 88 (Aug): 457–468. https://doi.org/10.1016/j.energy.2015.05.065.
Cohen, R., G. Wolff, and B. Nelson. 2004. “Energy down the drain.” Accessed December 11, 2022. https://www.nrdc.org.
Dai, J., S. Wu, G. Han, J. Weinberg, X. Xie, X. Wu, X. Song, B. Jia, W. Xue, and Q. Yang. 2018. “Water-energy nexus: A review of methods and tools for macro-assessment.” Appl. Energy 210 (Jan): 393–408. https://doi.org/10.1016/j.apenergy.2017.08.243.
de Marsily, G. 2021. “Will we soon run out of water?” Ann. Nutr. Metab. 76 (1): 10–16. https://doi.org/10.1159/000515019.
Environmental and Energy Study Institute. 2021. “Fossil fuels.” Accessed October 31, 2022. https://www.eesi.org/topics/fossil-fuels/description#:∼:text=Fossil%20fuels%E2%80%94including%20coal%2C%20oil,were%20compressed%20and%20heated%20underground.
EPRI (Electric Power Research Institute). 2021. “Water & sustainability (Volume 4): U.S. electricity consumption for water supply & treatment-The next half century.” Accessed December 10, 2022. https://www.epri.com.
E Source Companies LLC. 2022. “Colleges and universities.” Accessed December 26, 2022. https://esource.bizenergyadvisor.com/article/colleges-and-universities.
Fang, D., and B. Chen. 2017. “Linkage analysis for the water–energy nexus of city.” Appl. Energy 189 (Apr): 770–779. https://doi.org/10.1016/j.apenergy.2016.04.020.
Goldstein, R., and W. Smith. 2002. “Water & sustainability (volume 4): U.S. electricity consumption for water supply & treatment-The next half century.” Accessed January 30, 2023. https://www.circleofblue.org/wp-content/uploads/2010/08/EPRI-Volume-4.pdf.
Gu, Y., H. Wang, Z. P. Robinson, X. Wang, J. Wu, X. Li, J. Xu, and F. Li. 2018. “Environmental footprint assessment of green campus from a food-water-energy nexus perspective.” Energy Procedia 152 (Oct): 240–246. https://doi.org/10.1016/j.egypro.2018.09.109.
Gu, Y., H. Wang, J. Xu, Y. Wang, X. Wang, Z. P. Robinson, F. Li, J. Wu, J. Tan, and X. Zhi. 2019. “Quantification of interlinked environmental footprints on a sustainable university campus: A nexus analysis perspective.” Appl. Energy 246 (Jul): 65–76. https://doi.org/10.1016/j.apenergy.2019.04.015.
Halder, P. K., N. Paul, M. U. H. Joardder, and M. Sarker. 2015. “Energy scarcity and potential of renewable energy in Bangladesh.” Renewable Sustainable Energy Rev. 51 (Nov): 1636–1649. https://doi.org/10.1016/j.rser.2015.07.069.
Hamiche, A. M., A. B. Stambouli, and S. Flazi. 2016. “A review of the water-energy nexus.” Renewable Sustainable Energy Rev. 65 (Nov): 319–331. https://doi.org/10.1016/j.rser.2016.07.020.
Hau, J. L., and B. R. Bakshi. 2004. “Promise and problems of emergy analysis.” Ecol. Modell. 178 (1–2): 215–225. https://doi.org/10.1016/j.ecolmodel.2003.12.016.
Huang, Y., J. Zhang, Z. Ren, W. Xiang, I. Sifat, W. Zhang, J. Zhu, and B. Li. 2023. “Next generation decentralized water systems: A water-energy-infrastructure-human nexus (WEIHN) approach.” Environ. Sci.: Water Res. Technol. 9 (Jun): 2446–2471. https://doi.org/10.1039/D3EW00506B.
IotaComm. 2020. “Benchmarking commercial building energy use per square foot.” Accessed December 26, 2022. https://www.iotacommunications.com/blog/benchmarking-commercial-building-energy-use-per-square-foot/.
Korsavi, S. S., R. V. Jones, P. A. Bilverstone, and A. Fuertes. 2021. “A longitudinal assessment of the energy and carbon performance of a Passivhaus university building in the UK.” J. Build. Eng. 44 (Dec): 103353. https://doi.org/10.1016/j.jobe.2021.103353.
Langer, R. 2022. “Heating Btu calculator—How many Btu per square foot do I need?” Accessed January 30, 2023. https://www.pickhvac.com/calculator/heating-btu/.
Larsen, M. A. D., and M. Drews. 2019. “Water use in electricity generation for water-energy nexus analyses: The European case.” Sci. Total Environ. 651 (Feb): 2044–2058. https://doi.org/10.1016/j.scitotenv.2018.10.045.
Li, R., R. Zhao, Z. Xie, L. Xiao, X. Chuai, M. Feng, H. Zhang, and H. Luo. 2022. “Water–energy–carbon nexus at campus scale: Case of North China university of water resources and electric power.” Energy Policy 166 (Jul): 113001. https://doi.org/10.1016/j.enpol.2022.113001.
Lundie, S., G. M. Peters, and P. C. Beavis. 2004. “Life cycle assessment for sustainable metropolitan water systems planning.” Environ. Sci. Technol. 38 (13): 3465–3473. https://doi.org/10.1021/es034206m.
Milone & Macbroom. 2020. “UConn water supply plan.” Accessed October 31, 2022. https://fo.uconn.edu/wp-content/uploads/sites/2782/2020/08/UConn-Water-Supply-Plan-website-version.pdf.
Modiri, M., A. H. Hasan, H. Z. Koloukhi, F. Rostami, S. M. Tafazzoli, and A. Avami. 2022. “Assessment of water-energy-emissions nexus in wastewater treatment plants using emergy analysis.” Environ. Dev. Sustainability 25 (10): 11905–11929. https://doi.org/10.1007/s10668-022-02559-1.
Mouri, G., and T. Oki. 2010. “Modelling the catchment-scale environmental impacts of wastewater treatment in an urban sewage system for emission assessment.” Water Sci. Technol. 62 (4): 972–984. https://doi.org/10.2166/wst.2010.373.
Nogueira, M., and J. Perrella. 2015. “Exploring the water-energy nexus in Brazil: The electricity use for water supply.” Energy 85 (Jun): 415–432. https://doi.org/10.1016/j.energy.2015.03.083.
Odum, H. 1996. Environmental accounting: Emergy and environmental decision making. New York: Wiley.
Odum, H. 2000. “Folio# 2: Emergy of global processes.” In Handbook of emergy evaluation. Gainesville, FL: Univ. of Florida.
Odum, H. 2007. Environment, power, and society for the twenty-first century: The hierarchy of energy. New York: Columbia University Press.
Olabisi, L. K. S., A. R. Kapuscinski, K. A. Johnson, P. B. Reich, B. Stenquist, and K. J. Draeger. 2010. “Using scenario visioning and participatory system dynamics modeling to investigate the future: Lessons from Minnesota 2050.” Sustainability 2 (8): 2686–2706. https://doi.org/10.3390/su2082686.
Olcan, C. 2015. “Multi-objective analytical model for optimal sizing of stand-alone photovoltaic water pumping systems.” Energy Convers. Manage. 100 (Aug): 358–369. https://doi.org/10.1016/j.enconman.2015.05.018.
Panagopoulos, A. 2021. “Water-energy nexus: Desalination technologies and renewable energy sources.” Environ. Sci. Pollut. Res. 28 (17): 21009–21022. https://doi.org/10.1007/s11356-021-13332-8.
Perković, L., T. Novosel, T. Pukšec, B. Ćosić, M. Mustafa, G. Krajačić, and N. Duić. 2016. “Modeling of optimal energy flows for systems with close integration of sea water desalination and renewable energy sources: Case study for Jordan.” Energy Convers. Manage. 110 (Feb): 249–259. https://doi.org/10.1016/j.enconman.2015.12.029.
Perrone, D., J. Murphy, and G. M. Hornberger. 2011. “Gaining perspective on the water-energy nexus at the community scale.” Environ. Sci. Technol. 45 (10): 4228–4234. https://doi.org/10.1021/es103230n.
Prouty, C., S. Mohebbi, and Q. Zhang. 2018. “Socio-technical strategies and behavior change to increase the adoption and sustainability of wastewater resource recovery systems.” Water Res. 137 (Jun): 107–119. https://doi.org/10.1016/j.watres.2018.03.009.
Rehan, R., M. A. Knight, C. T. Haas, and A. J. A. Unger. 2011. “Application of system dynamics for developing financially self-sustaining management policies for water and wastewater systems.” Water Res. 45 (16): 4737–4750. https://doi.org/10.1016/j.watres.2011.06.001.
Rodrigues, F., A. Silva-Afonso, A. Pinto, J. Macedo, S. António, and C. Pimentel-Rodrigues. 2020. “Increasing water and energy efficiency in university buildings: A case study.” Environ. Sci. Pollut. Res. 27 (Feb): 4571–4581. https://doi.org/10.1007/s11356-019-04990-w/Published.
Sanders, K. T., and M. E. Webber. 2012. “Evaluating the energy consumed for water use in the United States.” Environ. Res. Lett. 7 (3): 034034. https://doi.org/10.1088/1748-9326/7/3/034034.
Santhosh, A., A. M. Farid, and K. Youcef-Toumi. 2014. “Real-time economic dispatch for the supply side of the energy-water nexus.” Appl. Energy 122 (Jun): 42–52. https://doi.org/10.1016/j.apenergy.2014.01.062.
Scott, C. A., and Z. P. Sugg. 2015. “Global energy development and climate-induced water scarcity-Physical limits, sectoral constraints, and policy imperatives.” Energies 8 (8): 8211–8225. https://doi.org/10.3390/en8088211.
Shakib, S. E., S. R. Hosseini, M. Amidpour, and C. Aghanajafi. 2012. “Multi-objective optimization of a cogeneration plant for supplying given amount of power and fresh water.” Desalination 286 (Feb): 225–234. https://doi.org/10.1016/j.desal.2011.11.027.
Smaoui, M., A. Abdelkafi, and L. Krichen. 2015. “Optimal sizing of stand-alone photovoltaic/wind/hydrogen hybrid system supplying a desalination unit.” Sol. Energy 120 (Oct): 263–276. https://doi.org/10.1016/j.solener.2015.07.032.
Stanford University. 2013. “Water and energy nexus: A literature review.” Accessed December 26, 2022. https://waterinthewest.stanford.edu/sites/default/files/Water-Energy_Lit_Review.pdf.
Tidwell, V. C., and V. Pebbles. 2015. “The water-energy-environment nexus in the great lakes region: The case for integrated resource planning.” Energy Environ. Res. 5 (2): 1. https://doi.org/10.5539/eer.v5n2p1.
Tietjen, C. 2016. “MicroGrids and CHP.” Accessed October 31, 2022. https://aeenewengland.org/images/downloads/Past_Meeting_Presentations/chris_tietjen___uconn_central_utility_plant.pdf.
Tourigny, A., and Y. Filion. 2019. “Sensitivity analysis of an agent-based model used to simulate the spread of low-flow fixtures for residential water conservation and evaluate energy savings in a Canadian water distribution system.” J. Water Resour. Plann. Manage. 145 (1): 04018086. https://doi.org/10.1061/(ASCE)WR.1943-5452.0001015.
UConn Office of Sustainability. 2022. “Water conservation.” Accessed January 30, 2023. https://sustainability.uconn.edu/water-conservation/.
University of Connecticut. 2021a. “2020 Water quality report.” Accessed January 15, 2023. https://fo.uconn.edu/wp-content/uploads/sites/2782/2021/06/UCONN_CT0780021_-2020-CCR.pdf.
University of Connecticut. 2021b. “Cogeneration plant.” Accessed October 31, 2022. https://fo.uconn.edu/departments/facilities-energy-services/cogen/.
University of Connecticut. 2021c. “Reclaimed water facility.” Accessed December 26, 2022. https://ecohusky.uconn.edu/reclaimed-water-facility/.
University of Connecticut. 2022. “Water pollution control facility.” Accessed December 26, 2022. https://fo.uconn.edu/departments/facilities-energy-services/water-pollution-control-facility/.
Xie, H., Y. Huang, Y. Choi, and J. Shi. 2021. “Evaluating the sustainable intensification of cultivated land use based on emergy analysis.” Technol. Forecasting Social Change 165 (Apr): 120449. https://doi.org/10.1016/j.techfore.2020.120449.
Yazdani, S., E. Salimipour, and M. S. Moghaddam. 2020. “A comparison between a natural gas power plant and a municipal solid waste incineration power plant based on an emergy analysis.” 274 (Nov): 123158. https://doi.org/10.1016/j.jclepro.2020.123158.
Zhang, C., and L. D. Anadon. 2013. “Life cycle water use of energy production and its environmental impacts in China.” Environ. Sci. Technol. 47 (24): 14459–14467. https://doi.org/10.1021/es402556x.
Zhang, J., R. S. Srinivasan, and C. Peng. 2020. “Ecological assessment of clay brick manufacturing in China using emergy analysis.” Buildings 10 (11): 190. https://doi.org/10.3390/buildings10110190.
Information & Authors
Information
Published In

Journal of Construction Engineering and Management
Volume 150 • Issue 10 • October 2024
Copyright
This work is made available under the terms of the Creative Commons Attribution 4.0 International license, https://creativecommons.org/licenses/by/4.0/.
History
Received: Jan 31, 2023
Accepted: Mar 14, 2024
Published online: Aug 7, 2024
Published in print: Oct 1, 2024
Discussion open until: Jan 7, 2025
ASCE Technical Topics:
- Business management
- Colleges and universities
- Decision making
- Education
- Energy engineering
- Energy sources (by type)
- Human and behavioral factors
- Hydro power
- Practice and Profession
- Renewable energy
- Sustainable development
- Water and water resources
- Water management
- Water policy
- Water resources
- Water supply
- Water use
Authors
Metrics & Citations
Metrics
Citations
Download citation
If you have the appropriate software installed, you can download article citation data to the citation manager of your choice. Simply select your manager software from the list below and click Download.