Simple Procedure for Preliminary Estimation of the Permeability of Randomly Fractured Rock Masses
Publication: International Journal of Geomechanics
Volume 24, Issue 3
Abstract
A data-driven approach is used to show the significant discrepancy between the coefficients of permeability that are estimated through packer field tests and those back-calculated from the actual discharge pumped out of randomly fractured rock masses (i.e., masses that do not have predominate oriented fracture sets) using either dewatering or pumping well systems. The presented data, some of the richest of its kind, are used to develop a novel correlation between the estimated and back-calculated coefficients of permeability. A procedure is proposed to evaluate the permeability of the rock masses that considers two different but frequently encountered scenarios: (1) lack of any field permeability test data; or (2) only packer test results are available. Numerical examples are presented to illustrate how the suggested procedure could be used. It constitutes an advance in the state of practice because the commonly used procedures to estimate the permeability of randomly fractured rock masses employ the direct use of packer field test results, which, as the data shows, could be orders of magnitudes out. The proposed procedure could be particularly useful for practitioners when faced with cases where field pumping tests are not feasible due to budget, time constraints, or both. It gives them a simple and reliable approach (based on case histories) to produce preliminary designs of dewatering systems in randomly fractured rocks.
Introduction
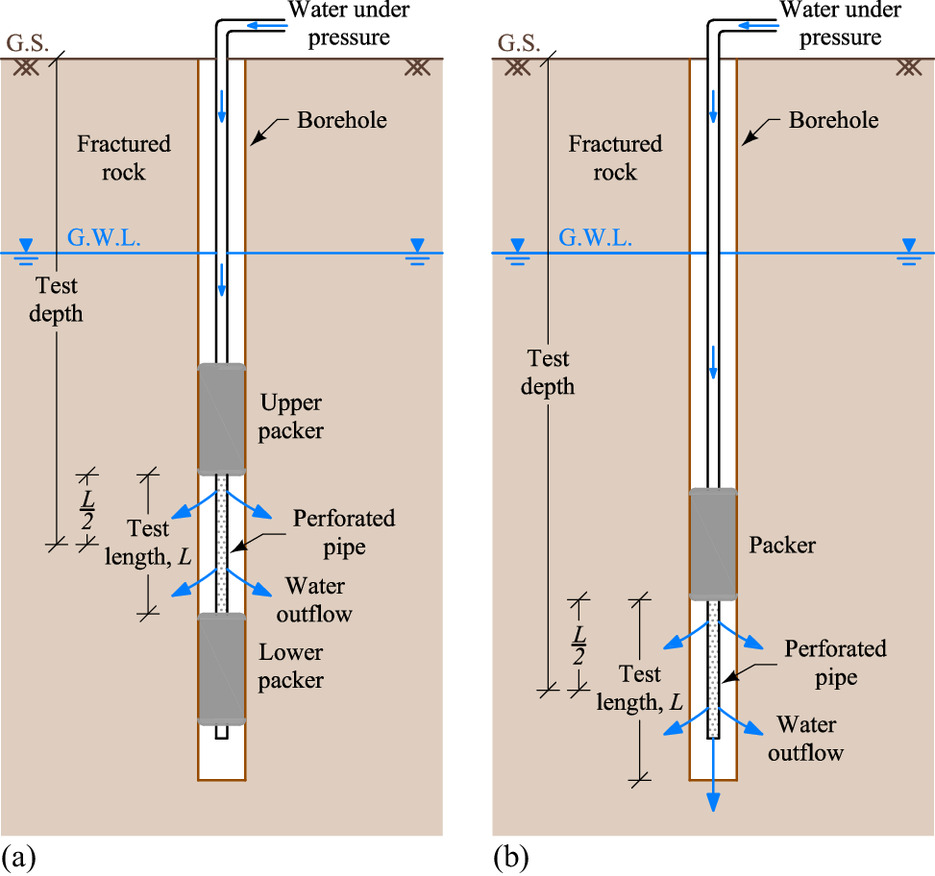
The coefficient of permeability (k) is a key parameter in the design and performance of dewatering systems that is required for many civil engineering projects. Permeability is the property that measures the ease with which water flows through soil or rock structures. In rock masses, permeability is difficult to evaluate from conventional site investigation works. Rock masses have a facility for water transmission along discontinuities, such as fissures and joints, through which water flows. Therefore, the permeability of rock mass is mainly controlled by the number and orientation of joint sets, the degree and connectivity of the fracturing, and the aperture of the fractures. Double and single packer tests are frequently conducted, particularly when tight financial and time constraints deem field pumping tests unfeasible. These field localized tests are shown in Fig. 1. In such tests, water is injected into the test length of rock that is bounded by two packers or a packer and borehole bottom in a double and single packer test, respectively. Permeability is estimated as a function of the water injecting rate of flow, pressure, or both in the test interval over time. Packer tests usually yield permeability values that are considerably different from those needed to effectively design the dewatering systems (e.g., Karagkounis et al. 2016 and Preene and Roberts 2017). Therefore, the observation method is typically used to design dewatering systems. These designs must be sufficiently flexible to meet certain requirements (Peck 1969; Roberts and Preene 1994). However, the observation method could have significant financial and environmental implications, particularly when the design has to devise solutions to all problems that could arise under the least favorable conditions on-site.
Several studies were conducted to estimate the permeability of rock masses that contained a well-defined set of continuous joints with specific spacing and aperture (e.g., Snow 1968, Hoek and Bray 1974, Attewell and Farmer 1976, Sen 1996, and Hamm et al. 2007). The correlations and charts that were developed in these studies to estimate the directional permeability of rock masses do not work practically for randomly fractured rock masses (i.e., rock masses that do not have predominant oriented fracture sets). The same applies to the use of methods that depend on complicated numerical simulations and advanced geological surveys when describing the features of the discontinuities (e.g., Oda 1985, Oda et al. 1996, Zhang et al. 1996, Chen and Bai 1998, Price and Indraratna 2003, Min et al. 2004, Ma et al. 2020, Tembely et al. 2021, and Yang et al. 2022). Similar to numerical simulations, mathematical modeling (both are physics-based models, because they should include constitutive models to govern the flow of the water in the rock mass) usually includes idealization of the fractures and matrix in rock blocks (Ma et al. 2021; Li et al. 2022; Alizadeh and Iraji 2023; Xue et al. 2023). When estimating the permeability of randomly fractured rocks, such idealizations could severely affect the accuracy of the estimation. In addition, both methods would require some validation, which takes us back to the importance of actual representative field data for water flow in the rock mass. In addition, mathematical modeling is usually developed as a function of the rock parameters that are not measured during typical site investigations, which additionally limits its practical applications.
The case of randomly fractured rock masses implies that the distribution of discontinuities is uncertain. Therefore, a probabilistic data-driven approach would be useful. However, field data (e.g., back-calculated values for the permeability), which is the main focus of this study, play a critical role in mitigating the uncertainties that are encountered in the probabilistic modeling.
As a field data-driven approach provides a more reliable method when estimating the permeability of randomly fractured rock masses, a large number of field case histories is utilized in this study to develop a simple and reliable procedure to estimate rock permeability. The procedure considers two scenarios that are frequently encountered in dewatering sites: (1) lack of field permeability test data; or (2) only packer test results are available. The procedure could be used for the preliminary design of dewatering systems in randomly fractured rock with budget, time constraints, or both and no field pumping permeability test results.
This study seizes the unique opportunity to develop the most extensive database available on the permeability of the randomly fractured rock and the performance of dewatering systems, to the best of the authors’ knowledge. It presents a very rarely found comparison between the back-calculated permeability [permeability calculated from the actual discharge pumped out of the rock mass using dewatering and field pumping tests (kBC)] and that estimated from the frequently conducted field localized tests (kTest). The comparison is used to account (reliably and practically without resorting to complex numerical models) for the effect of the fracture interconnectivity when estimating the permeability of rock mass.
Rock Lithology and Case Histories
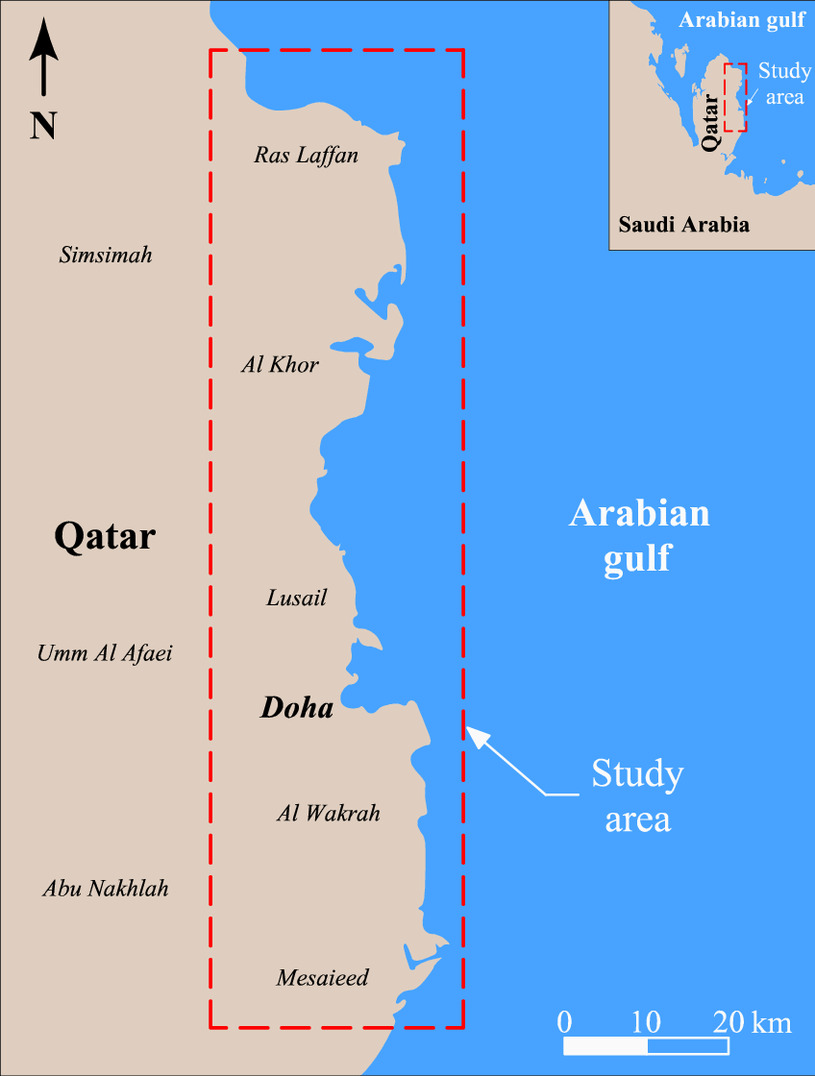
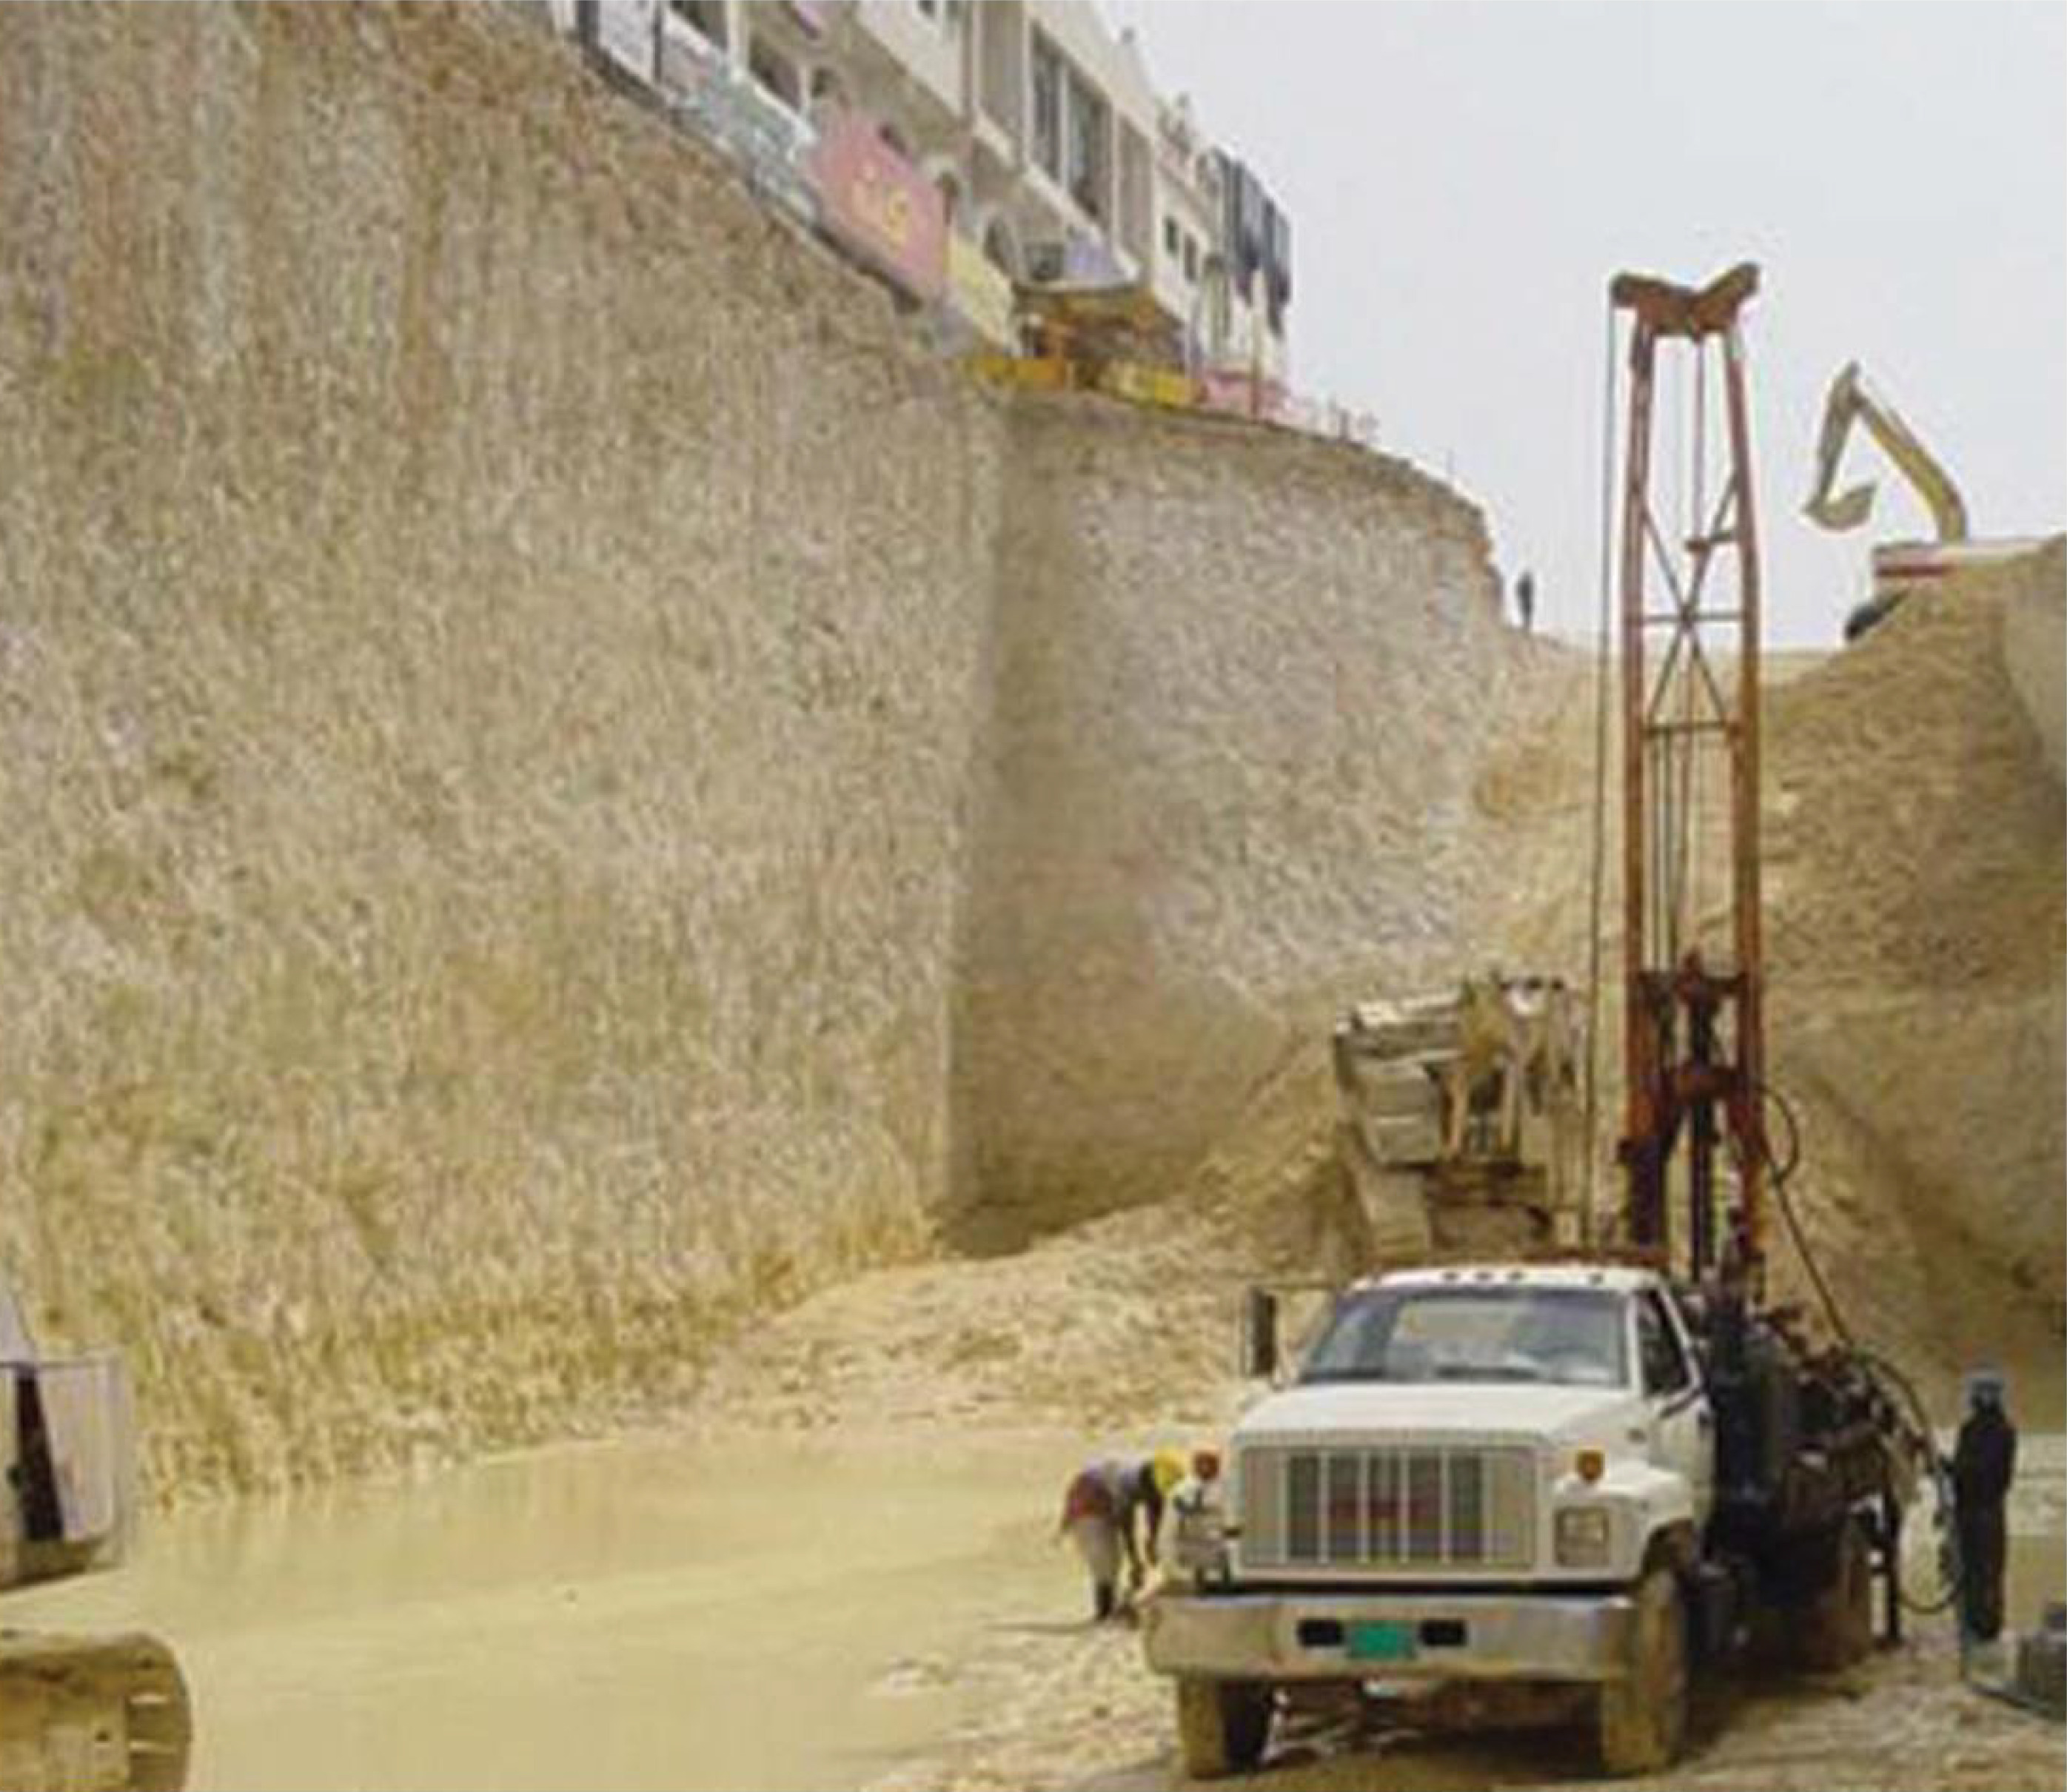
The case histories analyzed in this study included different construction dewatering projects and pumping wells that have been conducted for various construction activities and completed in the last two decades along 120 km of the east coast of the State of Qatar (Fig. 2). These construction activities covered a wide range of projects of different nature and dewatering depths, which included the FIFA 2022 World Cup stadiums, oil and gas pipelines, water and sewage systems, road and railway tunnels, and underground multistory basements. The typical subsurface stratification in this study area usually consists of an extended layer of randomly fractured limestone bedrock (Fig. 3). A general description of such rock given by Cavalier (1970) is a fine to medium grained off-white to pale brown and buff, poorly bedded, chalky crystalline calcareous and dolomitic limestone. The limestone is occasionally interrupted by a layer of highly indurated attapulgitic silty clay material, referred to locally as Midra shale. These limestone and shale layers do not exhibit any specific jointing system but are consistently and randomly fractured (Eid 2007).
In this study, a data set composed of 37 dewatering systems and eight pumping well tests (45 cases) was used to back-calculate the coefficient of permeability of randomly fractured rock mass (kBC). These values of kBC were considered the most reliable assessment for the actual permeability of fractured rock masses, because they reflect the mass behavior that includes the number, orientation, surface roughness, and lithology of the rock fractures. Therefore, many researchers have used this permeability as a benchmark for comparison (e.g., Burland et al. 1983, Leiper et al. 2000, and Bevan et al. 2010). A much larger data set of more than 100 dewatering and pumping well systems was made available and documented. Each case was checked against the following criteria.
1.
Was there a complete geometrical description of the dewatering system setup? If not, the case was not included in the subsequent analysis.
2.
Were vertical barriers (e.g., grouted walls) used on-site? These might affect the gravitational flow of water; therefore, such cases were not included in the analysis.
3.
Were the flow charts for water pumped out of the rock (which showed a clear, steady state condition) available? Cases with no flow rate charts were not included in the analysis.
4.
Did the case have geotechnical reports that comprise measured rock indexes? Cases with no geotechnical reports were not taken into account.
Then, following the previous criteria, 45 cases were considered in this study (Table 1), because they satisfied the conditions required for the reliable back-calculation of permeability coefficients. Table 1 presents a summary of the basic relevant information that was extracted from the documents of the analyzed case histories. The cases were numbered in ascending order based on the magnitude of the drawdown achieved on-site. In 26 cases, the coefficients of permeability that were measured from single and double packer tests (kTest) conducted in the dewatering zone were reported. The thickness of the dewatering zone was defined as the depth of the sump or rock aquifer below the original groundwater elevation.
| Case no. | Location (all in Doha, Qatar) | Drawdown (m) | Groundwater levela (m) | Excavation dimensions (B × L × D)b (m) | Steady state discharge (m3/s) | No. of packer tests | Average rock indices in dewatering zone (%) | ||
|---|---|---|---|---|---|---|---|---|---|
| RQD | SCR | TCR | |||||||
| 1 | Ras Abu Aboudc | 0.14 | 6.15 | NAd | 0.0013 | 4 | 34 | 49 | 82 |
| 2 | Meshaafc | 0.40 | 12.25 | NA | 0.0058 | —e | 76 | 83 | 98 |
| 3 | Meshaafc | 0.50 | 9.64 | NA | 0.0209 | — | 74 | 79 | 95 |
| 4 | Meshaafc | 0.89 | 10.63 | NA | 0.0058 | — | 77 | 81 | 97 |
| 5 | Bin Mahmoudc | 1.06 | 5.47 | NA | 0.0080 | 34 | 70 | 86 | 98 |
| 6 | Dafnac | 1.14 | 2.00 | NA | 0.0126 | 8 | 26 | 35 | 76 |
| 7 | Souq Waqifc | 1.63 | 3.26 | NA | 0.0095 | 18 | 41 | 49 | 78 |
| 8 | Bani Hajarf | 1.85 | 20.15 | 3.5 × 3.5 × 21 | 0.0050 | — | 42 | 68 | 94 |
| 9 | Ras Lafanf | 1.90 | 5.22 | 300 × 600 × 6.1 | 0.0880 | — | 30 | 69 | 91 |
| 10 | Al Khorf | 2.56 | 2.11 | 55 × 113 × 3.67 | 0.0200 | 5 | 32 | 49 | 76 |
| 11 | Al Kheesaf | 2.87 | 11.13 | 8 × 8 × 13 | 0.0150 | 1 | 12 | 28 | 73 |
| 12 | Bin Mahmoudf | 2.89 | 4.61 | 15 × 15 × 6.5 | 0.0160 | 10 | 69 | 86 | 99 |
| 13 | Education Cityf | 2.93 | 14.69 | 300 × 300 × 16.62 | 0.0400 | 2 | 22 | 46 | 85 |
| 14 | Bin Mahmoudf | 2.98 | 4.52 | 14 × 32 × 6.5 | 0.0360 | 10 | 67 | 83 | 99 |
| 15 | Industrial Areaf | 3.78 | 5.66 | 22 × 148 × 8.44 | 0.0250 | — | 72 | 84 | 95 |
| 16 | Lusailf | 4.00 | 6.00 | 56 × 80 × 9 | 0.0300 | — | 36 | 55 | 89 |
| 17 | Al Kheesaf | 4.87 | 11.13 | 8 × 8 × 15 | 0.0220 | 1 | 11 | 27 | 76 |
| 18 | Al Khorf | 6.00 | 4.90 | 8 × 8 × 9.9 | 0.0065 | — | 47 | 75 | 96 |
| 19 | Mesaieedf | 6.25 | 4.00 | 49 × 78 × 9.25 | 0.0420 | — | 7 | 14 | 64 |
| 20 | Al Duhailf | 6.62 | 11.20 | 11 × 11 × 16.82 | 0.0470 | 2 | 42 | 66 | 86 |
| 21 | Al Khorf | 6.75 | 7.52 | 8 × 8 × 13.27 | 0.0090 | — | 47 | 75 | 96 |
| 22 | Al Maamouraf | 7.50 | 4.50 | 34 × 109 × 11 | 0.0380 | — | 47 | 85 | 91 |
| 23 | Meshaafc | 8.48 | 9.77 | NA | 0.0250 | — | 80 | 88 | 98 |
| 24 | Al Kheesaf | 8.50 | 13.50 | 12 × 19 × 21 | 0.0280 | 3 | 16 | 29 | 77 |
| 25 | Bani Hajarf | 9.10 | 12.40 | 3.5 × 3.5 × 20.5 | 0.0035 | — | 40 | 65 | 92 |
| 26 | Lusailf | 9.11 | 7.29 | 73 × 884 × 15.4 | 0.4500 | — | 19 | 38 | 64 |
| 27 | Al Rayanf | 9.62 | 11.58 | 26 × 70 × 20.11 | 0.0770 | — | 27 | 43 | 69 |
| 28 | Al Kheesaf | 9.80 | 9.20 | 10 × 12 × 18 | 0.0400 | 4 | 19 | 32 | 75 |
| 29 | Lusailf | 10.80 | 2.42 | 46 × 96 × 12.02 | 0.1420 | — | 42 | 69 | 96 |
| 30 | Cornichef | 11.40 | 4.40 | 65 × 122 × 14.8 | 0.0530 | — | 33 | 44 | 85 |
| 31 | Al Kheesaf | 11.50 | 13.50 | 16 × 16 × 24 | 0.0300 | 3 | 11 | 24 | 78 |
| 32 | Al Kheesaf | 13.43 | 14.37 | 16 × 16 × 27 | 0.0300 | 4 | 30 | 46 | 94 |
| 33 | Ras Abu Aboudf | 13.90 | 3.10 | 41 × 140 × 16 | 0.1150 | 7 | 39 | 52 | 85 |
| 34 | Al Kheesaf | 14.35 | 16.65 | 16 × 18 × 30 | 0.0300 | 4 | 11 | 23 | 76 |
| 35 | Old Ghanimf | 14.70 | 4.55 | 30 × 54 × 18.25 | 0.0090 | — | 29 | 40 | 89 |
| 36 | Al Dayaanf | 16.50 | 4.85 | 66 × 106 × 15.5 | 0.0850 | 2 | 26 | 54 | 86 |
| 37 | Bani Hajarf | 18.63 | 9.37 | 8 × 11 × 27 | 0.0300 | 4 | 39 | 66 | 88 |
| 38 | Bani Hajarf | 18.98 | 9.52 | 3.5 × 3.5 × 27.5 | 0.0180 | 3 | 43 | 68 | 88 |
| 39 | Al Duhailf | 19.35 | 5.32 | 81 × 98 × 23.67 | 0.0430 | 3 | 48 | 69 | 87 |
| 40 | Lusailf | 20.15 | 2.35 | 61.2 × 88 × 21.5 | 0.0230 | — | 18 | 30 | 83 |
| 41 | Cornichef | 21.65 | 8.31 | 19 × 145 × 28.96 | 0.0330 | 39 | 57 | 67 | 87 |
| 42 | Al Sharqf | 22.31 | 6.49 | 9.44 × 11.94 × 27.8 | 0.0310 | 14 | 64 | 82 | 98 |
| 43 | Al Kheesaf | 23.20 | 16.73 | 16 × 18 × 30.5 | 0.0250 | 4 | 30 | 46 | 95 |
| 44 | Al Kheesaf | 25.24 | 10.26 | 16 × 18 × 34.5 | 0.0300 | 7 | 37 | 55 | 97 |
| 45 | Al Sharqf | 25.31 | 6.49 | 9.6 × 11.5 × 30.8 | 0.0310 | 13 | 65 | 83 | 98 |
Note: RQD = Rock quality designation; SCR = Solid core recovery; TCR = Total core recovery.
a
Below ground surface.
b
Dimensions: B = Width, L = Length, D = Depth.
c
Pumping well.
d
Not applicable.
e
No data
f
Dewatering project.
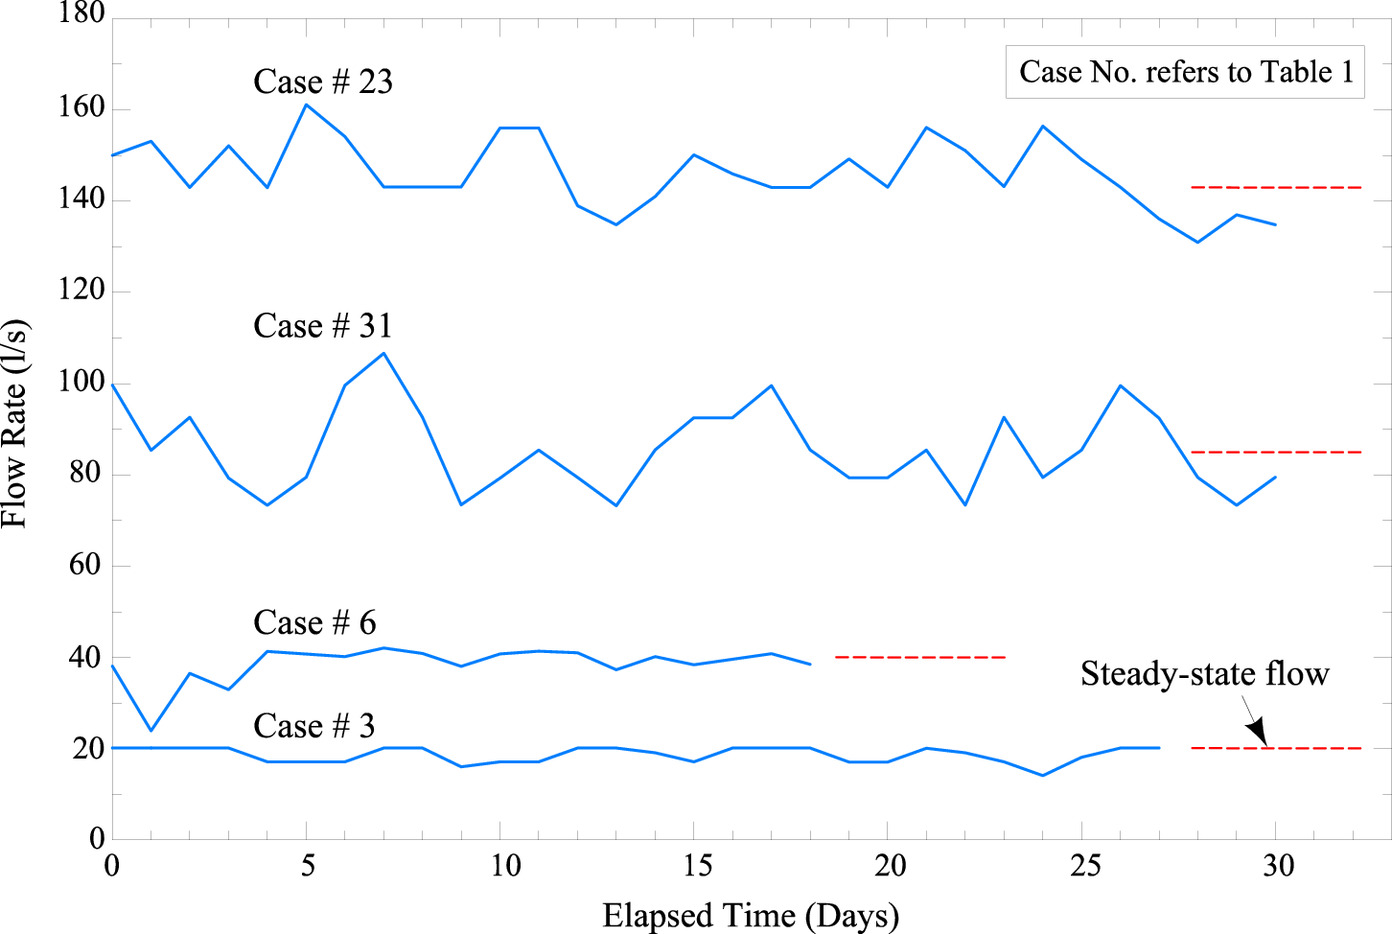
Fig. 4 shows examples of flow rate diagrams that were used to determine kBC for the case histories. The steady state flow rates [i.e., the flow rate required to maintain the drawdown in the long-term (q)] and the following commonly used equations of steady state flow for unconfined aquifers as described by Preene et al. (2016) were utilized to back-calculate the permeability of rock mass for dewatering projects and pumping well systems.
For pumping well systems:where h1 and h2 = lowered water table levels at two observation boreholes located at r1 and r2 from the center of the well.
(1)
For dewatering projects:where H = initial water table level in aquifer (m); hw = residual depth of aquifer (m); x = linear length of excavation; L0 = distance of influence calculated with the Sichardt formula [i.e., L0 = C (H − hw) (k)0.5 (m)]; and the empirical calibration factor (C) was taken as 1,750 following the recommendations of Mansur and Kaufman (1962).
(2)
Of note, two basic dewatering techniques were employed in the case histories. The first technique (sump and trench) permits the water to flow into trenches (ditches) dug along the excavation perimeter and then pumps it out from sumps that are connected to the trenches at the excavation corners and in the second, water is lowered through deep wells parallel to the two long sides of excavation. The choice between these systems depends mainly on the magnitude of the required drawdown of the groundwater level. Deep well systems are typically supplemented with a sump and trench system in the last phase of the excavation.
Data Analysis
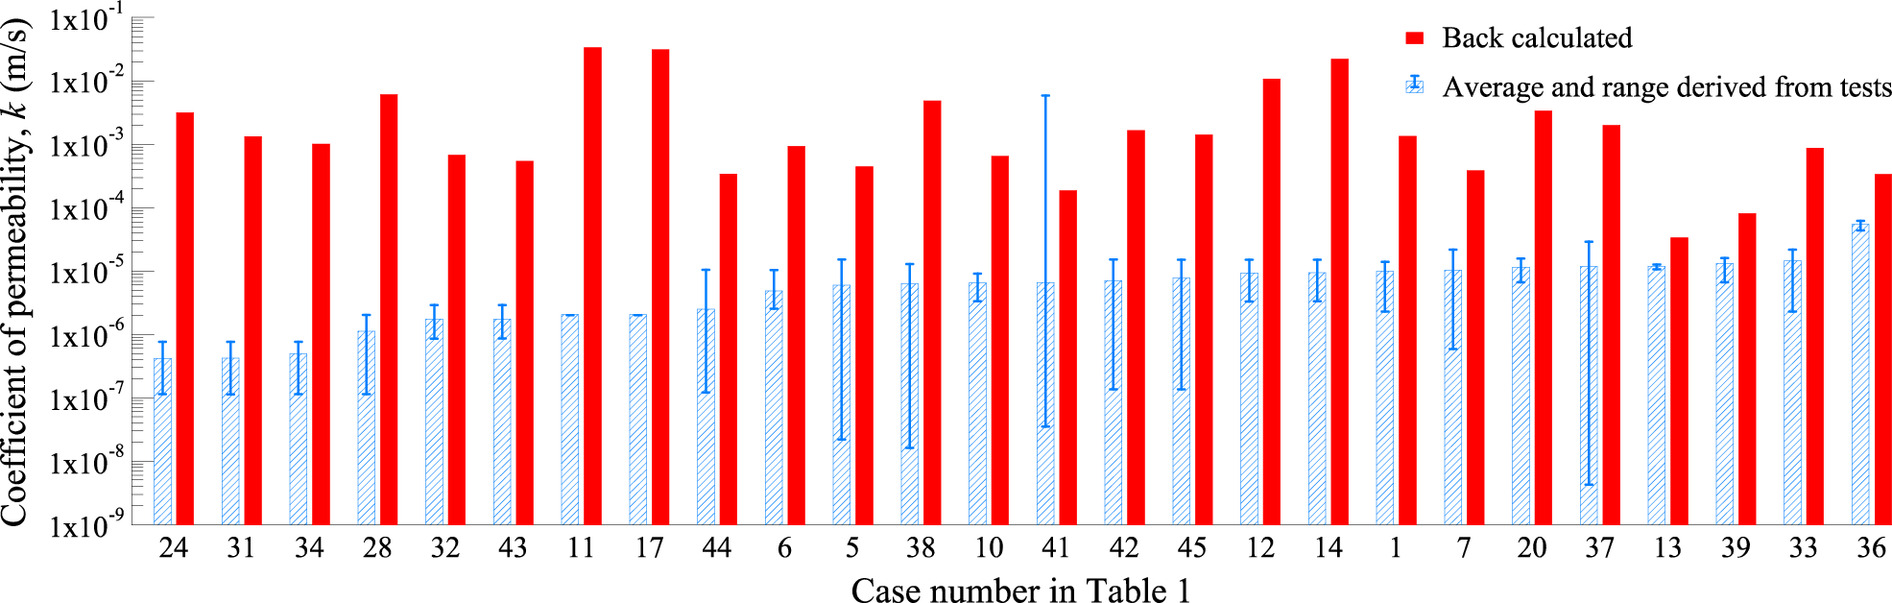
For each case history that was considered in this study, the average of the coefficients of permeability estimated through conducting packer tests in the dewatering zone [(kTest)Avg] was determined for comparison with the corresponding coefficient of permeability that was back-calculated from the actual discharge pumped out of rock masses. This comparison is shown in Fig. 5, where the cases are plotted in an ascending order based on their magnitude of (kTest)Avg. The comparison indicated a significant discrepancy between both permeability coefficients for all case histories. The back-calculated values were from 1 × 10⁻⁵ to 0.5 × 10⁻² m/s and could be up to five orders of magnitude larger than (kTest)Avg. This could be mainly attributed to the limited length or volume of the tested rock, which does not effectively reflect the fractures that govern the groundwater flow (i.e., multidirectional connectivity). The test length of packer tests used in the comparison varied between 0.5 and 3.0 m, with the vast majority being 1 or 2 m. The minimum and maximum values of the coefficients of permeability that were estimated by conducting packer tests in the dewatering zone of each case history are shown in Fig. 5. Underestimating the permeability of rock mass would be more drastic if the lowest values of the measured permeability (as opposed to the average values) were considered. This is not inconceivable in practice, particularly when conducting a limited number of packer tests.
An attempt was made to correlate the back-calculated coefficient of permeability to the index that is most standardized and frequently used to reflect the degree of rock fracturing [i.e., Rock Quality Designation (RQD)]. The RQD is the ratio between the cumulative length of recovered core cylinders longer than 10 cm and the length of the core run. The average of RQD values for rock in the dewatering zone of each case history [(RQD)DZ] was plotted against the corresponding back-calculated permeability, as shown in Fig. 6. The dispersed data shown in Fig. 6 indicates that the mass permeability of randomly fractured rocks is not directly correlated to the rock degree of fracturing as represented by the RQD. This might be because the RQD index only designates the degree of rock fracturing along the borehole depth and, consequently, does not adequately reflect the multidirectional connectivity of the fractures. However, an approximate correlation could be developed between the results of the double packer tests and the corresponding average of the RQD values that were measured along the tested length [(RQD)Test]. A correlation between the RQD and kTest could be interpreted based on the RQD definition that indicated the rock degree of fracturing along the tested length. This correlation is shown in Fig. 7, which uses the results of 420 double packer tests (376 in limestone and 44 in shale) that were conducted in more than 100 dewatering sites that were investigated in this study. The correlation benefits from more data because all the field data available was used in this study, not only the 45 cases. In addition, 231 data points that are available in the literature for different rock types (i.e., sandstone, limestone, and claystone) are shown in Fig. 7. More than 95% of the test results are encompassed in a band (with an average deviation of ± 1 log cycle from the mean kTest trendline) the width of which enlarged at higher values of (RQD)Test. The band and its represented general trendline showed a decrease in the estimated rock permeability with increasing (RQD)Test. Because of the dispersed data at high RQD values, the accuracy of the general trendline when representing the measured permeability decreased for rocks with a low degree of fracturing [higher (RQD)Test values]. Of note, similar levels of accuracy and general trends have been reported in the literature for correlations between kTest and RQD (e.g., El-Naqa 2001; Jiang et al. 2009; Qureshi et al. 2014, 2022; Kayabasi et al. 2015; Farid and Rizwan 2017). Correlations between kTest with fewer measured and less frequently reported rock indexes, such as geological strength index, rock mass rating, Q-system (Q), joint spacing (JS), and aperture (a), do not show a better accuracy (e.g., Kayabasi et al. 2015, Shahbazi et al. 2020, Dwinagara et al. 2021, Alizadeh and Iraji 2023, and Doan et al. 2023).
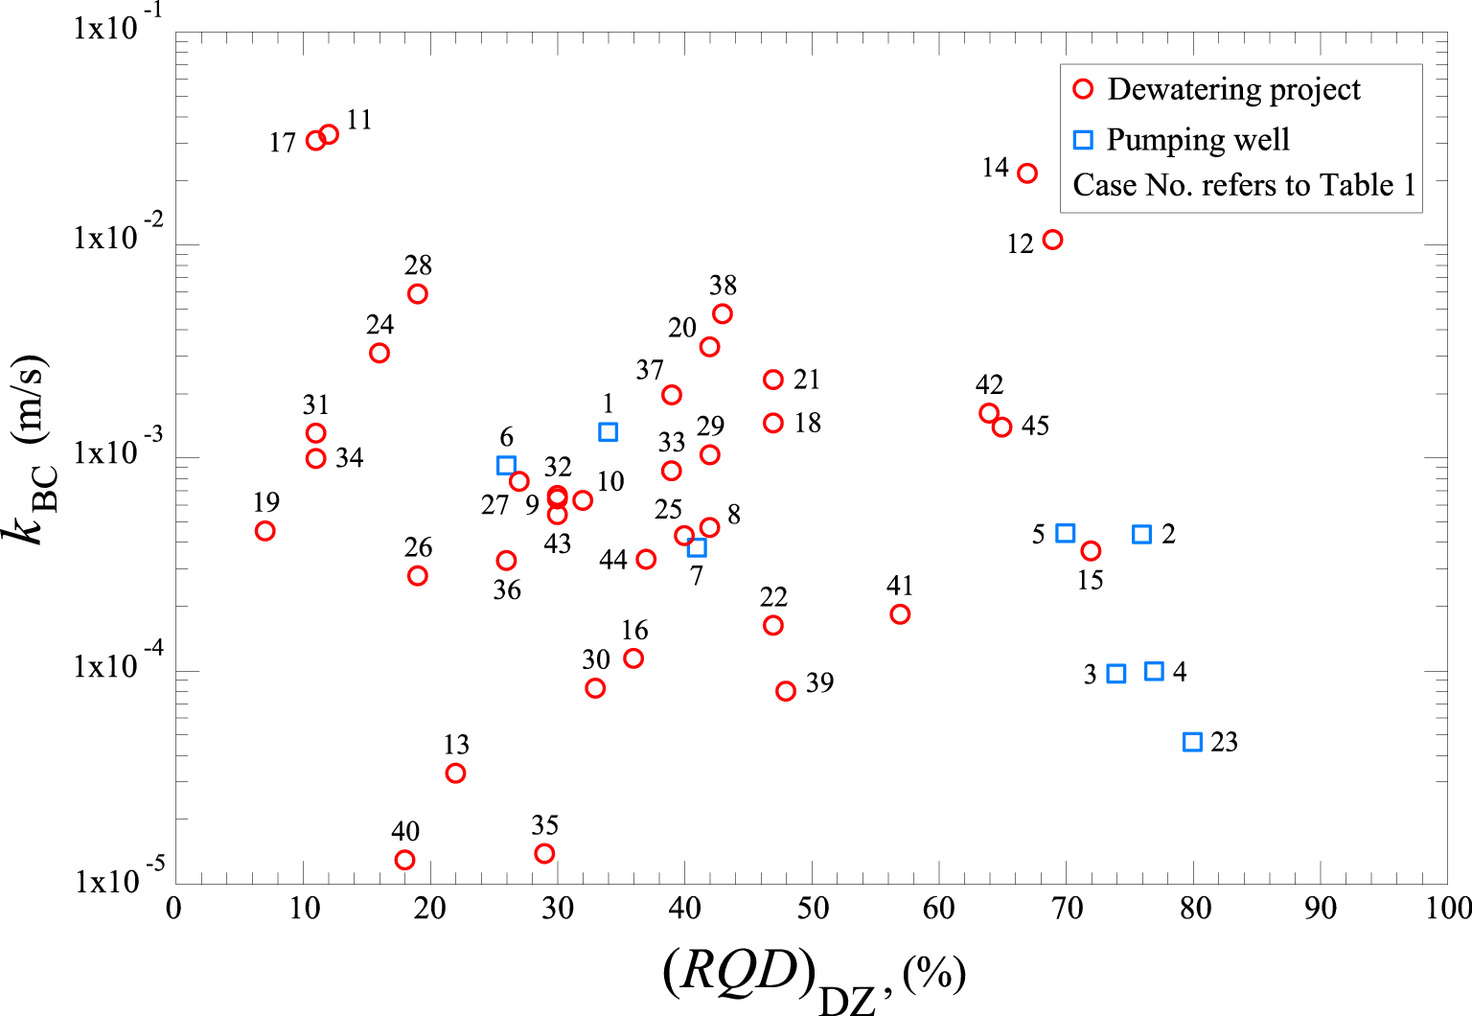
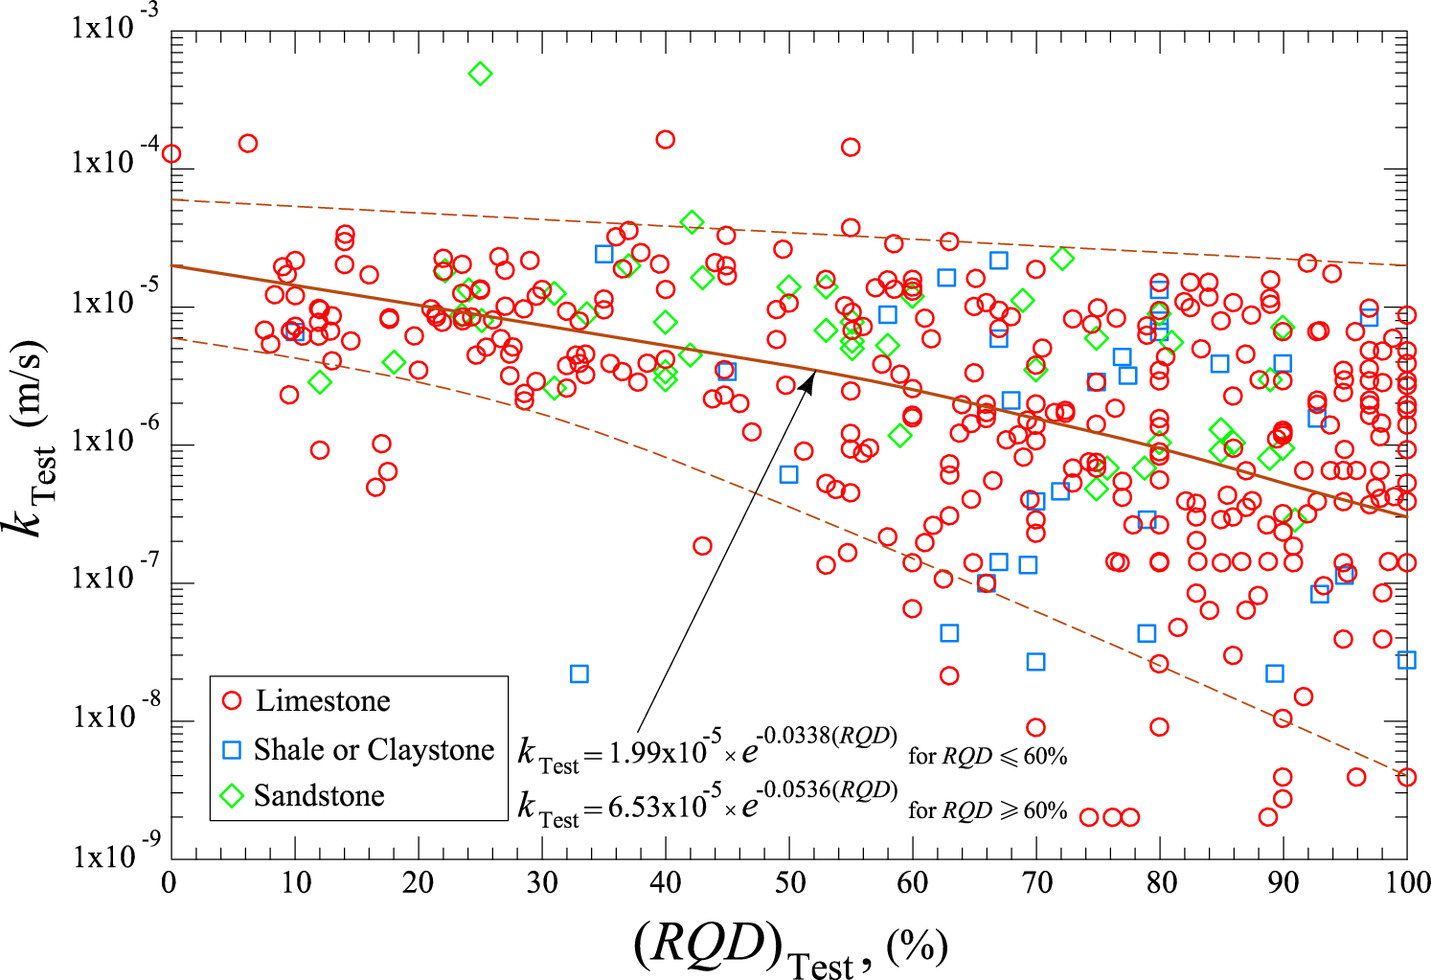
Fig. 7. Change in the coefficient of permeability yielded from double packer tests with th RQD at test elevation.
Fig. 7 shows that the type of formation has a minor effect on the measured permeability. This could be attributed to the dominant effect of the degree of fracturing over that of rock substance. In the absence of a direct correlation between kBC and RQD (Fig. 6), the trendline shown in Fig. 7 could be used as an intermediary in a procedure that provides a better reflection of the effect of the multidirectional connectivity of rock fractures to initially estimate the permeability of randomly fractured rock mass, as shown in the following section. The data shown in Fig. 7 for tests that were conducted at two extreme groups of test depth range (i.e., less than 40 m), which is usually used when estimating the permeability of rock mass for the design of dewatering systems, are shown in Fig. 8. For this depth range, the previously described general trend of decreasing measured permeability with the increase in the RQD values is not sensitive to the change in test depth. Therefore, the test depth (as an independent parameter that represents the change in effective vertical stress) is not included in the permeability estimation procedure described in the following section.
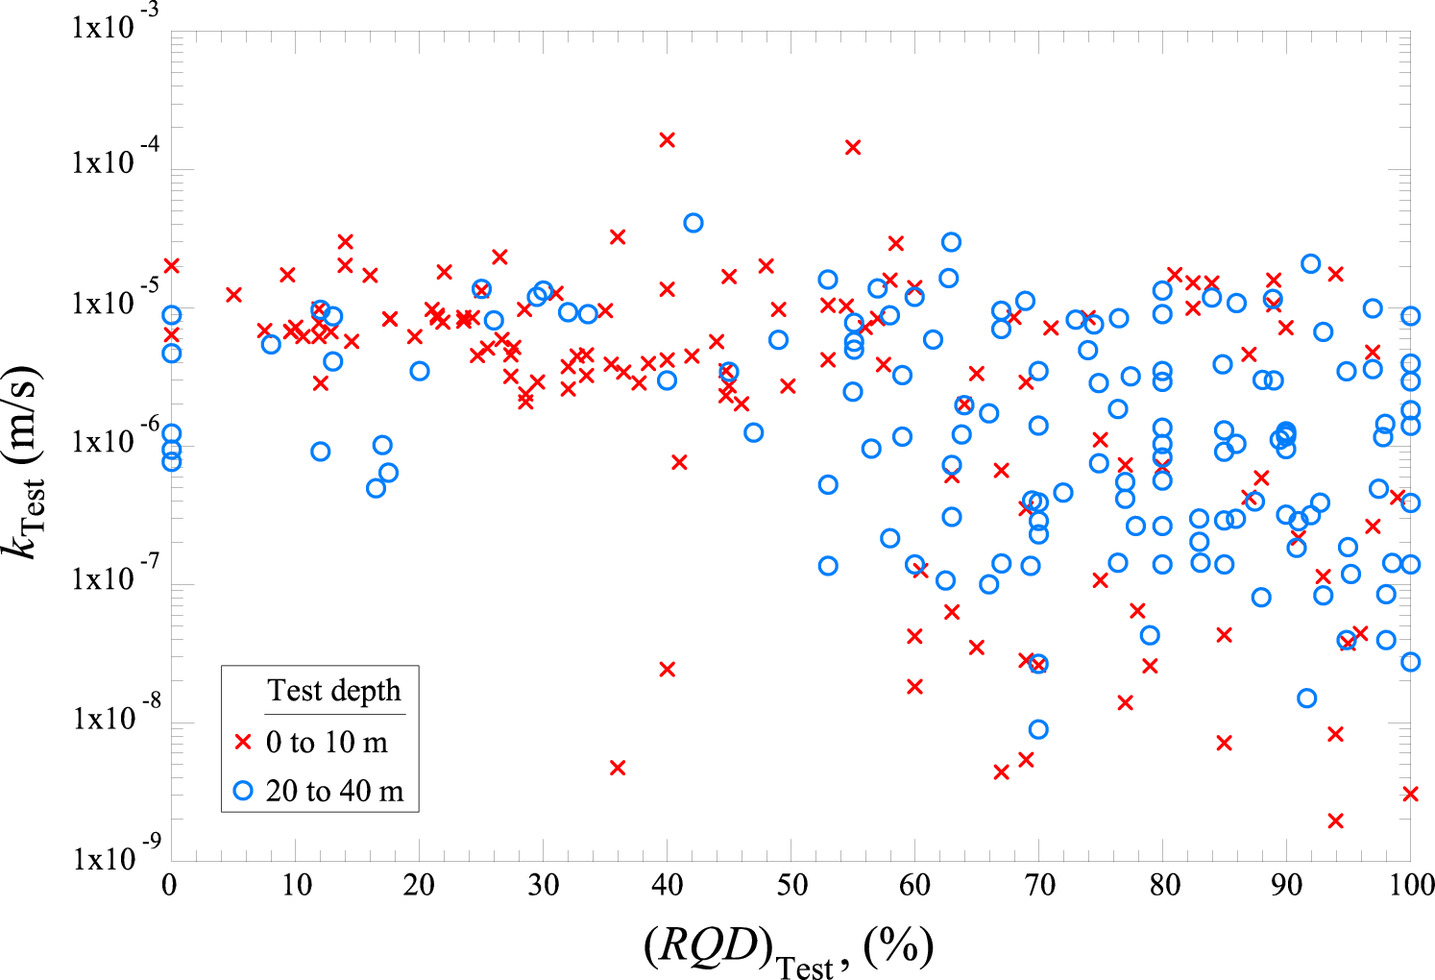
Fig. 8. Variation in the coefficient of permeability with RQD and ranges of double packer test depth.
Simple Procedure for Permeability Estimation
The comparisons between the measured and back-calculated permeabilities presented in the previous section suggested that two factors could play a significant role when providing a reliable estimate of the permeability of randomly fractured rock mass (i.e., determining the KEST) for construction dewatering. The first factor is the degree of fracturing of rock in the dewatering zone, which is represented in this study by the average RQD values reported for the boreholes conducted in the dewatering zone [(RQD)DZ]. The second factor is the fact that the multidirectional hydraulic interconnectivity of the fractures is poorly reflected in the results of packer tests.
To address the effect of the first factor, the average coefficient of permeability that would be derived if packer tests were conducted [i.e., (kTest)EST] could be determined as a function of (RQD)DZ, as shown in Fig. 7. This initial step in the estimation procedure would roughly cover the lack of field packer permeability testing. The effect of the second factor was addressed using an interconnectivity indicator (IC). The value of IC is defined in this study as the ratio between kBC and the average of the coefficients of permeability that was derived from packer field tests conducted in the dewatering zone [(kTest)Avg]. As shown in Fig. 9, such a ratio (i.e., magnitude of IC) generally increased with a decreasing value of (kTest)Avg. This could be attributed to the significant limitation of the considered field localized tests when reflecting the effects of fracture interconnectivity (i.e., multidirectional connectivity) on the measured permeability values, especially for rock masses with low measured permeabilities. Therefore, the permeability of randomly fractured rock mass is estimated by correcting the value of (kTest)EST as follows:
(3)
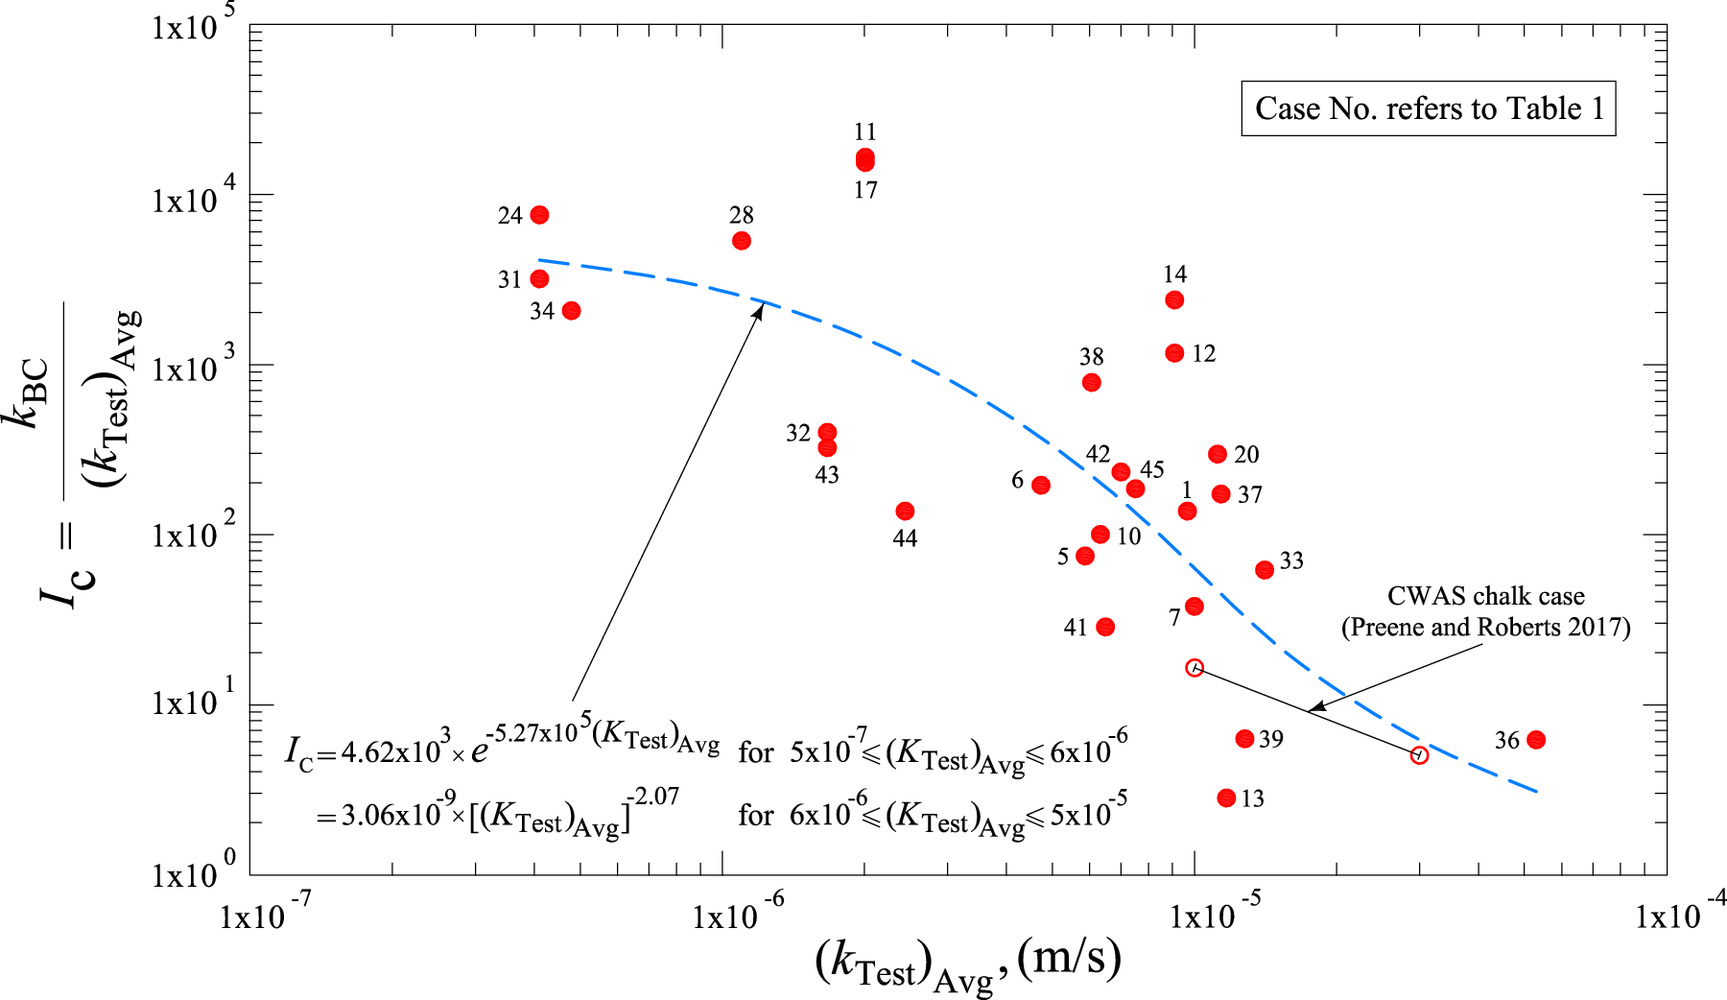
Of note, the information required to add more points (i.e., case histories with reported permeability back-calculated from actual discharge pumped out of randomly fractured rock masses and that derived from packer tests) shown in Fig. 9 is very rare in the literature. For example, the most comprehensive study published to date on the mass permeability of chalk (Preene and Roberts 2017) includes only one case history out of 49 reported cases for which the two permeabilities were reported. This case is for dewatering in chalk (i.e., relatively soft fissured limestone) at Crossrail’s Woolwich Arsenal Station (CWAS), London. As shown in Fig. 9, the data points from CWAS are in good agreement with the corresponding trendline developed in this study.
As previously explained, there are two different but frequently encountered scenarios experienced in dewatering sites: (1) lacking any field permeability test data (Scenario 1); or (2) only having adequate packer test results (Scenario 2). Therefore, the suggested estimation procedure would include two steps (i.e., addressing the first and second factors presented previously) when dealing with Scenario 1. Scenario 2 employs one step (i.e., addressing the second factor only). This is explained in detail in the following numerical examples.
Scenario 1 Example: No Permeability Test Results Available
As previously indicated, the estimation procedure involved Figs. 5 and 9. These figures are combined, as shown in Fig. 10, to simplify following the estimation steps. The average of the RQD values of rock in the dewatering zone of a site [i.e., (RQD)DZ] was assumed to be 47%. The estimation of the coefficient of permeability of rock mass (kEST) requires the information shown in Fig. 10(a) to read the (kTest)EST of 4.14 × 10⁻⁶ m/s. Using this value in Fig. 10(b), a value of IC = 520 was read, and consequently, the estimated coefficient of permeability of rock mass kEST = IC × (kTest)EST of 2.15 × 10⁻³ m/s was calculated.
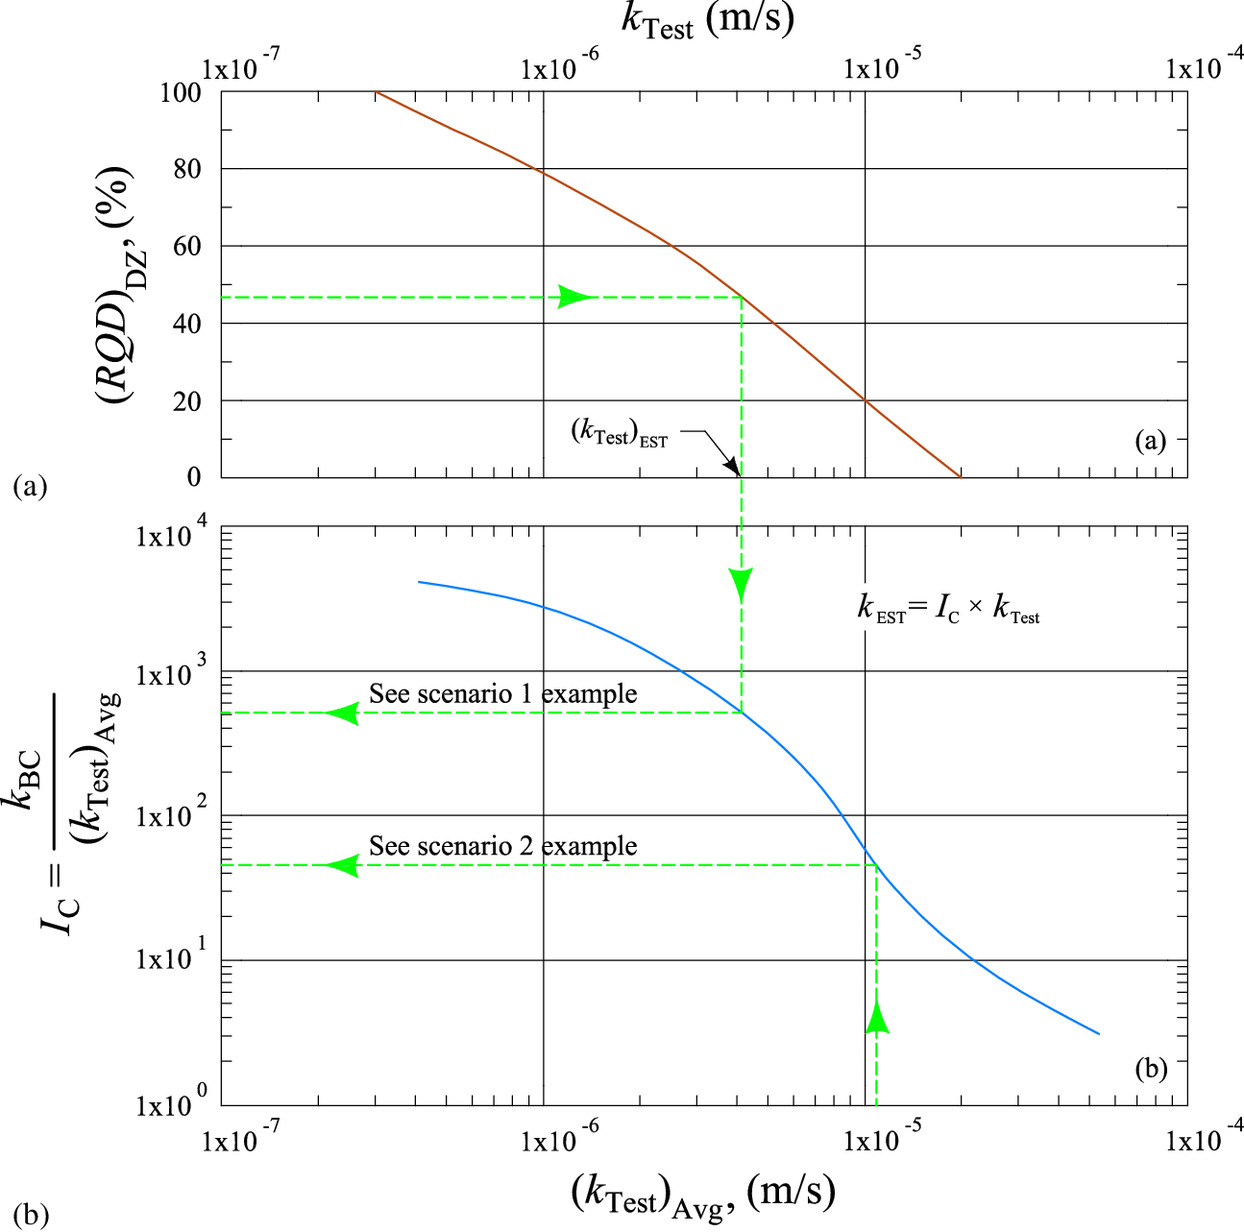
Scenario 2 Example: Only Packer Test Results Available
With the availability of test results, permeability estimation only requires addressing the effect of fracture interconnectivity. The average of the coefficient of permeability yielded from packer tests conducted in the dewatering zone [i.e., (kTest)Avg] was assumed to be 1.12 × 10⁻⁵. The estimation of the coefficient of permeability of rock mass (kEST) uses the information shown in Fig. 10(b) to read IC = 44 and consequently the estimated coefficient of permeability of rock mass kEST = IC × (kTest)Avg of 4.93 × 10⁻⁴ m/s was calculated.
Reliability of the Permeability Estimated Using the Proposed Procedure
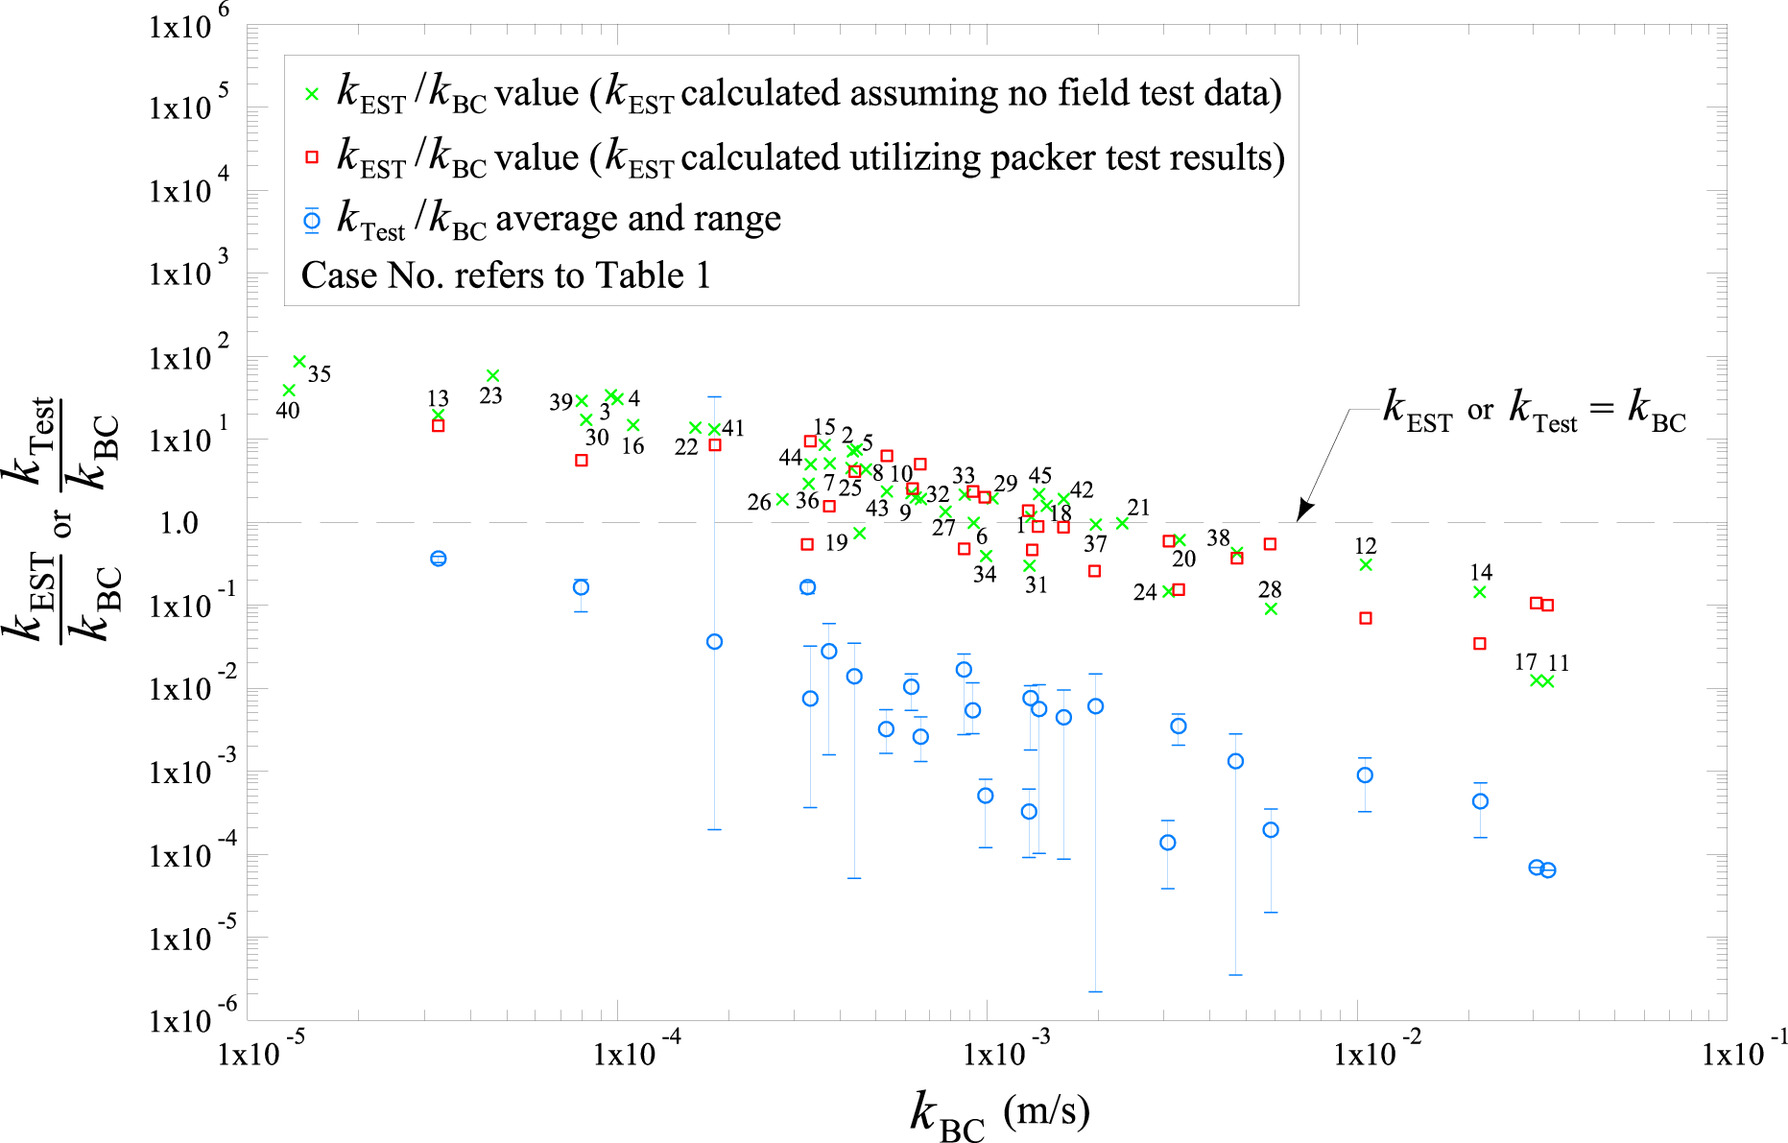
A comparison was made between the estimated and back-calculated permeabilities to evaluate the level of success of the estimation procedure proposed in this study. This was performed for the 45 case histories as a function of the ratios between these permeability values. All of the calculated ratios are shown in Fig. 11, along with the ratios of the average and ranges of the coefficient of permeability values that were derived from packer permeability tests (that were reported for 26 of the case histories). For almost all case histories, following the proposed procedure led to estimating the permeability of randomly fractured rock masses with a significantly improved accuracy regardless of the site condition scenarios. Such accuracy slightly decreased for rock masses with low permeability. However, for the vast majority of the considered case histories, the maximum deviation of the estimated permeability from the corresponding back-calculated permeability was less than one log cycle. Such a deviation was arguably tolerable, knowing: (1) that the coefficient of permeability had the widest range of magnitude among the other properties of ground materials; and (2) the extensive magnitude of permeability underestimation by the field localized tests commonly conducted in rock (e.g., packer tests).
When practitioners face financial and time constraints that rule out conducting field pumping tests, the procedure introduced in this study could be used to design dewatering systems in randomly fractured rock. The simple concept and steps of the proposed procedure mean that it could be applied to a wide range of other rock types despite being developed with data from dewatering and pumping well systems that were installed in randomly fractured limestone and shale. However, estimating the interconnectivity indicator for other rocks (e.g., sandstone) that used the trendline presented in this study (Fig. 9) should be treated cautiously. Further research in this direction is strongly recommended.
Conclusions
The results of packer permeability tests significantly underestimate the permeability of rock masses compared with those back-calculated from the actual discharge pumped out when dewatering or pumping well systems are used. Such underestimation increased with the increasing permeability of the rock mass. The mass permeability of randomly fractured rocks cannot be directly correlated to the rock degree of fracturing as represented by the RQD. However, an approximate correlation was developed between the results of double packer tests that were conducted in rocks and the corresponding average of the RQD values that were measured along the tested length, regardless of the difference in rock lithology and test depth. If any field permeability test results were absent (e.g., Scenario 1), and the trendline of this correlation was used as an intermediary in a proposed procedure that provided a better reflection of the effect of the multidirectional interconnectivity of rock fractures [represented in this study by the interconnectivity indicator (IC] when estimating the permeability of randomly fractured rock mass. With adequate packer test results (e.g., Scenario 2), the average of the permeability values that were derived from the tests could be directly used when determining the interconnectivity indicator and, therefore, estimate the mass permeability. Charts and numerical examples were provided to facilitate the use of this procedure, the reliability of which was checked with reasonable outcomes. Therefore, this procedure could be used for the preliminary design of dewatering systems in randomly fractured rock in cases where financial and time constraints do not permit field pumping tests to be conducted.
Data Availability Statement
All data, models, and codes generated or used during the study appear in the published article.
Acknowledgments
The funding provided by the Qatar National Research Fund, Qatar, under Project No: NPRP 12S-0314-190366, for this research work is deeply appreciated. The authors also acknowledge Dr. Reiner Stollberg of Fugro (Qatar) for providing some field data. The help of Alhassan Mahmoud and Omar Ibrahim, research assistants at Qatar University, in organizing the data and producing some of the paper’s charts is also appreciated.
Notation
The following symbols are used in this paper:
- H
- initial water table level in aquifer;
- hw
- residual depth of aquifer;
- h1, h2
- lowered water table levels at two observation boreholes at distances r1 and r2 from the center of pumping well;
- IC
- interconnectivity factor;
- k
- coefficient of permeability;
- kBC
- coefficient of permeability back-calculated from the actual discharge pumped out of rock mass using dewatering or pumping well systems;
- kEST
- coefficient of permeability of rock mass estimated using the procedure suggested in this study;
- kTest
- coefficient of permeability measured with packer field tests;
- (kTest)EST
- estimated coefficient of permeability measured with packer field tests;
- (kTest)Avg
- average of the coefficients of permeability measured from packer field tests conducted in dewatering zone;
- L0
- distance of influence in a dewatering system;
- q
- steady state flow rate pumped out of randomly fractured rock masses using dewatering or pumping well systems;
- RQD
- rock quality designation;
- (RQD)DZ
- average of RQD values for rock in the dewatering zone;
- (RQD)Test
- average of RQD values measured along the length involved in packer test; and
- x
- linear length of dewatered excavation (depends on the type of dewatering system and arrangement of deep wells).
References
Alizadeh, S. M., and A. Iraji. 2023. “Application of soft computing and statistical methods to predict rock mass permeability.” Soft Comput. 27 (9): 5831–5853. https://doi.org/10.1007/s00500-022-07586-8.
Attewell, P. B., and I. W. Farmer. 1976. Principles of engineering geology. London: Chapman and Hall.
Bevan, M. A., W. Powrie, and T. O. L. Roberts. 2010. “Influence of large-scale inhomogeneities on a construction dewatering system in chalk.” Géotechnique 60 (8): 635–649. https://doi.org/10.1680/geot.9.P.010.
Burland, J. B., R. J. Hancok, and J. May. 1983. “A case history of a foundation problem on soft chalk.” Géotechnique 33 (3): 385–395. https://doi.org/10.1680/geot.1983.33.4.385.
Cavalier, C. 1970. Geological description of the Qatar peninsula (Arabian Gulf). Paris: Government of Qatar, Dept. of Petroleum Affairs and Bureau of Recharches Geologique et Minieres.
Chen, M., and M. Bai. 1998. “Modeling of subsidence and stress-dependent hydraulic conductivity for intact and fractured porous media.” Int. J. Rock Mech. Min. Sci. 35 (8): 1113–1119. https://doi.org/10.1016/S0148-9062(98)00167-3.
Doan, L. T. A., M. Karakus, G. D. Nguyen, S. Smith, C. Chester, and R. Hawker. 2023. “Estimating the hydraulic conductivity of jointed rock mass using genetic programming.” IOP Conf. Ser.: Earth Environ. Sci. 1124: 012001. https://doi.org/10.1088/1755-1315/1124/1/012001.
Dwinagara, B., P. Wijaya, O. W. Lusantono, I. H. Rekinagara, and S. R. Haq. 2021. “Permeability value estimation based on rock mass rating.” AIP Conf. Proc. 2363: 030021. https://doi.org/10.1063/5.0061588.
Eid, H. T. 2007. “A technique for estimating permeability of a randomly fractured rock mass.” Acta Geotech. 2 (2): 97–102. https://doi.org/10.1007/s11440-007-0029-9.
El-Naqa, A. 2001. “The hydraulic conductivity of the fractures intersecting Cambrian sandstone rock masses, Central Jordan.” Environ. Geol. 40: 973–982. https://doi.org/10.1007/s002540100266.
Farid, A. T., and M. Rizwan. 2017. “Prediction of in situ permeability for limestone rock using rock quality designation index.” Int. J. Geotech. Geol. Eng. 11 (10): 948–951.
Hamm, S.-Y., M. Kim, J.-Y. Cheong, J.-Y. Kim, M. Son, and T.-W. Kim. 2007. “Relationship between hydraulic conductivity and fracture properties estimated from packer tests and borehole data in a fractured granite.” Eng. Geol. 92: 73–87. https://doi.org/10.1016/j.enggeo.2007.03.010.
Hoek, E., and J. W. Bray. 1974. Rock slope engineering. London: Institution of Mining and Metallurgy.
Jiang, X.-W., L. Wan, X.-S. Wang, X. Wu, and X. Zhang. 2009. “Estimation of rock mass deformation modulus using variations in transmissivity and RQD with depth.” Int. J. Rock Mech. Min. Sci. 46 (8): 1370–1377. https://doi.org/10.1016/j.ijrmms.2009.05.004.
Karagkounis, N., B. Latapie, K. Sayers, and S. R. Mulinti. 2016. “Geology and geotechnical evaluation of Doha rock formations.” Geotech. Res. 3 (3): 119–136. https://doi.org/10.1680/jgere.16.00010.
Kayabasi, A., N. Yesiloglu, and C. Gokceoglu. 2015. “Use of non-linear prediction tools to assess rock mass permeability using various discontinuity parameters.” Eng. Geol. 185: 1–9. https://doi.org/10.1016/j.enggeo.2014.12.007.
Leiper, Q., T. Roberts, and D. Russell. 2000. “Geotechnical engineering for the Medway tunnel and approaches.” Proc. Inst. Civ. Eng. Transp. 141 (1): 35–42. https://doi.org/10.1680/tran.2000.141.1.35.
Li, D., R. S. Faradonbeh, A. Lv, X. Wang, and H. Roshan. 2022. “A data-driven field-scale approach to estimate the permeability of fractured rocks.” Int. J. Min. Reclam. Environ. 36 (10): 671–687. https://doi.org/10.1080/17480930.2022.2086769.
Ma, G., Z. Chao, and K. He. 2021. “Predictive models for permeability of cracked rock masses based on support vector machine techniques.” Geotech. Geol. Eng. 39 (2): 1023–1031. https://doi.org/10.1007/s10706-020-01542-9.
Ma, K., L. Wang, Y. Peng, L. Long, S. Wang, and T. Chen. 2020. “Permeability characteristics of fractured rock mass: A case study of the Dongjiahe coal mine.” Geomatics Nat. Hazards Risk 11 (1): 1724–1742. https://doi.org/10.1080/19475705.2020.1811403.
Mansur, C. I., and R. I. Kaufman. 1962. “Dewatering.” In Foundation engineering, edited by G. A. Leonards, 241–350. New York: McGraw-Hill.
Min, K.-B., J. Rutqvist, C.-F. Tsang, and L. Jing. 2004. “Stress-dependent permeability of fractured rock masses: A numerical study.” Int. J. Rock Mech. Min. Sci. 41 (7): 1191–1210. https://doi.org/10.1016/j.ijrmms.2004.05.005.
Oda, M. 1985. “Permeability tensor for discontinuous rock masses.” Géotechnique 35 (4): 483–495. https://doi.org/10.1680/geot.1985.35.4.483.
Oda, M., M. Kanamaru, and K. Iwashita. 1996. “The effect of crack geometry on hydrodynamic dispersion in cracked media.” Soils Found. 36 (2): 69–80. https://doi.org/10.3208/sandf.36.2_69.
Peck, R. B. 1969. “Advantages and limitations of the observational method in applied soil mechanics.” Géotechnique 19 (2): 171–187. https://doi.org/10.1680/geot.1969.19.2.171.
Preene, M., and T. O. L. Roberts. 2017. “Construction dewatering in chalk.” Proc. Inst. Civ. Eng. Geotech. Eng. 170 (4): 367–390. https://doi.org/10.1680/jgeen.16.00142.
Preene, M., T. O. L. Roberts, and W. Powrie. 2016. Groundwater control: Design and practice. CIRIA C750. 2nd ed. London: CIRIA Publications.
Price, J. R., and B. Indraratna. 2003. “Saturated steady state flow in rough rock fractures using discrete element modeling.” In Vol. 1 of Proc., 12th Asian Regional Conf. on Soil Mechanics and Geotechnical Engineering, 933–936. Singapore: World Scientific Publishing.
Qureshi, M. U., Z. Mahmood, and A. M. Rasool. 2022. “Using multivariate adaptive regression splines to develop relationship between rock quality designation and permeability.” J. Rock Mech. Geotech. Eng. 14 (4): 1180–1187. https://doi.org/10.1016/j.jrmge.2021.06.011.
Qureshi, M. U., K. Muzaffar Khan, N. Bessaih, K. Al-Mawali, and K. Al-Sadrani. 2014. “An empirical relationship between in-situ permeability and RQD of discontinuous sedimentary rocks.” Electron. J. Geotech. Eng. 19: 4781–4790.
Roberts, T. O. L., and M. Preene. 1994. “The design of groundwater control systems using the observational method.” Géotechnique 44 (4): 727–734. https://doi.org/10.1680/geot.1994.44.4.727.
Sen, Z. 1996. “Theoretical RQD-porosity-conductivity-aperture charts.” Int. J. Rock Mech. Min. Sci. Geomech. Abstr. 33 (2): 173–177. https://doi.org/10.1016/0148-9062(95)00059-3.
Shahbazi, A., A. Saeidi, and R. Chesnaux. 2020. “A review of existing methods used to evaluate the hydraulic conductivity of a fractured rock mass.” Eng. Geol. 265: 105438. https://doi.org/10.1016/j.enggeo.2019.105438.
Snow, D. T. 1968. “Rock fracture spacings, openings, and porosities.” J. Soil Mech. Found. Div. 94 (1): 73–91. https://doi.org/10.1061/JSFEAQ.0001097.
Tembely, M., A. M. AlSumaiti, and W. S. Alameri. 2021. “Machine and deep learning for estimating the permeability of complex carbonate rock from X-ray micro-computed tomography.” Energy Rep. 7: 1460–1472. https://doi.org/10.1016/j.egyr.2021.02.065.
Xue, K., Z. Zhang, Y. Jiang, and Y. Luo. 2023. “Estimating the permeability of fractured rocks using topological characteristics of fracture network.” Comput. Geotech. 157: 16.
Yang, E., D. H. Kang, T. Ahn, J. Y. Lee, and T. S. Yun. 2022. “Construction of reliable flow simulation domain and estimation of permeability based on nuclear magnetic resonance and 3D X-ray computed tomography for reservoir carbonate rocks.” Transp. Porous Media 143 (3): 739–763. https://doi.org/10.1007/s11242-022-01807-2.
Zhang, X., D. J. Sanderson, R. M. Harkness, and N. C. Last. 1996. “Evaluation of the 2-D permeability tensor for fractured rock masses.” Int. J. Rock Mech. Min. Sci. Geomech. Abstr. 33 (1): 17–37. https://doi.org/10.1016/0148-9062(95)00042-9.
Information & Authors
Information
Published In

International Journal of Geomechanics
Volume 24 • Issue 3 • March 2024
Copyright
This work is made available under the terms of the Creative Commons Attribution 4.0 International license, https://creativecommons.org/licenses/by/4.0/.
History
Received: Mar 2, 2023
Accepted: Aug 8, 2023
Published online: Dec 18, 2023
Published in print: Mar 1, 2024
Discussion open until: May 18, 2024
Authors
Metrics & Citations
Metrics
Citations
Download citation
If you have the appropriate software installed, you can download article citation data to the citation manager of your choice. Simply select your manager software from the list below and click Download.