Assessing the Institutional- and Project-Level Determinants of Corruption in Infrastructure Projects: Evidence from World Bank–Funded Projects
Publication: ASCE OPEN: Multidisciplinary Journal of Civil Engineering
Volume 2, Issue 1
Abstract
To successfully deliver infrastructure projects, it is essential to prevent corruption—i.e., the act of offering, giving, receiving, or soliciting anything of value, directly or indirectly, with the intention of improperly influencing the actions of another party in the procurement of financed projects. However, there is little to no research exploring the institutional- and project-level determinants of corruption in infrastructure projects. To fill this gap, this research develops a conceptual model that shows the effects of contract size, repeat winners, and public sector corruption on project corruption. Using data collected from the World Bank and Varieties of Democracy (V-Dem) database, 330 projects located in 61 countries between 2000 and 2018 were analyzed using multilevel logistic regression models. The results show the average contract size and the number of repeat winners in a project are important determinants of corruption risk in infrastructure projects. Higher levels of corruption in the public sector also significantly magnify the likelihood that increases in contract value will result in project corruption. This research deepens our understanding of corruption in infrastructure projects across diverse institutional environments and shows project managers and policymakers how different project characteristics influence the likelihood of corruption occurring in these localized settings.
Introduction
The construction industry is consistently ranked as one of the biggest contributors to gross domestic product (GDP) worldwide (Hosseini et al. 2020; Yu et al. 2019). However, corruption remains a significant issue, causing an estimated 10%–30% of lost value in global construction output (WEF 2016). In addition, corrupt practices often lead to delays and cost overruns in projects (Asiedu and Adaku 2019; Damoah et al. 2018; Locatelli et al. 2017), making corruption one of the most serious problems in the construction industry (Bowen et al. 2012; Chan and Owusu 2017; Zhang et al. 2017). Consequently, project management scholars have recently intensified their investigations into the dark side of projects (Locatelli et al. 2022), recognizing the urgency to address this problem.
While researchers acknowledge that controlling corruption in projects requires an understanding of why corruption occurs, most studies only explore correlations with corruption and do not empirically investigate the pathways leading to corruption (Hosseini et al. 2020; Owusu et al. 2019; Zhang et al. 2017). Among the factors that have been associated with corruption, project characteristics appear to be a particularly important determinant (Locatelli et al. 2017). Because not all projects are the same, these bespoke features make them more or less susceptible to corruption (Stansbury 2005). Yet, the current literature does not adequately examine these project-level determinants.
Furthermore, the extant literature on corruption is replete with institutional analyses, but many of these studies are concerned with the effects of institutional factors on corruption at a country or firm level (Alon and Hageman 2017; Dimant and Tosato 2018). However, there appear to be no frameworks that document the influence of institutional factors on project-level corruption. This gap in the literature is problematic for both project managers and policymakers because the institutional- and project-level determinants of project corruption remain relatively unknown.
A comprehensive and in-depth analysis at the project level is therefore needed to better understand the intricate relationship between institutional factors and corruption within projects, as well as the interplay between institutional factors and project characteristics in shaping corruption. To address this gap, this paper documents the mixed effects of project characteristics and institutional factors on project corruption using an integrated framework and expands previous empirical evidence in the following ways. First, we focus on how project characteristics such as contract size and repeat winners influence project corruption. In doing so, we show how different project characteristics may favor or prevent corrupt practices (Locatelli et al. 2017). Second, we examine how institutional factors influence project corruption by comparing the extent of public sector corruption in 61 countries. Third, we investigate the interactive effects of project characteristics and institutional factors on project corruption. Taken together, this research deepens our understanding of corruption in infrastructure projects across diverse institutional environments and shows project managers and policymakers how different project characteristics influence the likelihood of corruption occurring in these localized settings.
The rest of this paper is organized as follows. First, we review the extant literature pertaining to project corruption and propose a set of hypotheses. Next, we describe our data and empirical strategy. Then, we present our empirical results. We specifically highlight the relationship between project characteristics (i.e., contract size and repeat winners) and project corruption as well as the moderating effect of public sector corruption. Finally, we conclude by discussing the implications of this research, especially our theoretical and practical contributions.
Literature Review and Hypotheses
The World Bank defines corruption as offering, giving, receiving, or soliciting, directly or indirectly, anything of value to improperly influence the actions of another party in the procurement of financed projects (World Bank 2014a, b; 2018). For example, a supplier agrees to pay a kickback to a senior government official whose influence over the bid evaluation committee can steer the award of the contract. This supplier builds in the kickback amount as a percentage of the contract value and pays for it from the funds it receives for a World Bank Group-supported project. Project financing costs are artificially inflated by these practices, and the supplier recovers costs by providing less expensive and lower quality goods (Presidency 2023). Project corruption can occur in various forms (Chan and Owusu 2017; Le et al. 2014) and at different phases of the project lifecycle (Owusu et al. 2019; Tabish and Jha 2012), but scholars are often most concerned about corruption in the procurement stage (FIDIC 2016; Locatelli et al. 2017; Tabish and Jha 2011, 2012; Zhang et al. 2017). As an example, Ameyaw et al. (2017) found that kickbacks, bribery, collusion, bid-rigging, and fraud were the most common forms of corruption in practice. Similarly, Le et al. (2014) summarized that bribery, fraud, bid-rigging, misappropriation of funds, kickbacks, conflicts of interest, dishonest and unfair practices, extortion, shell companies, and nepotism are common forms of corruption in engineering projects. Research on project corruption mainly focuses on four key aspects: (1) types of corruption in a project (Ameyaw et al. 2017; Chan and Owusu 2017; Hosseini et al. 2020); (2) causes of project corruption (Brown and Loosemore 2015; Owusu et al. 2019; Zhang et al. 2017); (3) the impact of corruption on projects (Damoah et al. 2018; Jiménez et al. 2017, 2020; Uhlenbruck et al. 2006); and (4) anticorruption strategies in projects (Aduwo et al. 2020; Owusu et al. 2020; Sohail and Cavill 2008; Tabish and Jha 2018).
Although some scholars note that identifying the causes of corruption is necessary for anticorruption strategies to work (Owusu et al. 2019, 2020), the existing literature currently does not explore the extent to which various factors, such as organizational, regulatory, project, and statutory causes, impact project corruption. Moreover, projects operate within exceedingly complex institutional environments (Casady et al. 2020; Casady 2021, 2023; Scott 2012); therefore, regardless of the type of corruption, the impact on the project and effectiveness of anticorruption measures will vary depending on the institutional setting in which the project is located (Jiménez and Bayraktar 2020; Kingsford Owusu and Chan 2019; Sharma et al. 2019). In addition, there are a large number of studies that illustrate the impact of institutional factors on corruption at the country level and firm level (Alon and Hageman 2017; Dimant and Tosato 2018; Goel and Budak 2006; Pillay and Kluvers 2014; Rose-Ackerman and Palifka 2016; Sanyal 2005), but they neglect the project level. The most important institutional factor affecting project corruption is the degree of public sector corruption, which is defined as the abuse of public office for private gain (Boylan and Long 2003) in the country where the project is located (Cavalieri et al. 2018; Uhlenbruck et al. 2006). In addition to the aforementioned points, scholars have not adequately addressed whether the effects of these factors remain consistent across different scales of corruption.
Moreover, each project has different characteristics that expose them to different types of corruption (Stansbury 2005). Hence, it is crucial to understand which project characteristics increase or decrease the likelihood of corruption (Locatelli et al. 2017). Traditionally, project size tends to be the most important feature because it is easier to hide bribes and inflated claims in larger projects than smaller projects (Locatelli et al. 2017; Stansbury 2005). The underlying logic of this view suggests the amount of bribes is generally calculated as a proportion of the total capital value—i.e., the larger the total expenditures for a project, the greater room there is for bribes (Søreide 2002). However, because the whole project is divided into different contracts, the final bribe amount is often hidden in each of these contracts (Tabish and Jha 2011). Hence, we argue that contract size may be a more important determinant of project corruption than project size. Since the impacts of project characteristics on project corruption will also vary in different institutional environments, we also investigate what project characteristics are more likely to attract corruption in different institutional settings.
Public Sector Corruption and Project Corruption
In countries with high levels of public sector corruption, there is also an increased likelihood of project corruption because public officials often wield significant influence in the procurement process (Rustiarini et al. 2019), and procured contracts offer lucrative opportunities for the extraction of rents (Pashev 2011). Apart from being subject to possible cancellations (Casady et al. 2023), the procurement phase also serves as the most fertile ground for corruption (Hosseini et al. 2020; Signor et al. 2016). Public sector employees can use their discretionary power to manipulate a project’s procurement process in a variety of ways (Williams-Elegbe 2012), especially in unsolicited proposals (Casady and Baxter 2022). For instance, public sector officials may leak specific confidential details about the project to a contractor or shorten the time for a tender announcement to obtain a bribe or kickback from a contractor. Bribes or kickbacks may be made for insider information or tailor-made bidding specifications (Rose-Ackerman and Palifka 2016). This increases the likelihood that companies involved in bribery will secure bidding opportunities. In addition, projects typically involve numerous government agencies and multiple levels of approval (Uhlenbruck et al. 2006), leading to broken agency (Casady et al. 2019; Henisz et al. 2012). For instance, in countries with a higher degree of corruption in the public sector, bureaucrats may actively create regulatory barriers so firms are more likely to buy reductions in red-tape or contract awards (Hobbs 2005). By contrast, countries with low levels of corruption in the public sector tend to have stricter accountability measures, thereby reducing the chance of public sector employees acting corruptly. Previous studies have demonstrated the relationship between regulation and project corruption. For example, Owusu et al. (2019) identify that regulatory-specific and statutory-specific factors are significant casual factors for project corruption. Zhang et al. (2017) reveal that flawed regulation systems are a major underlying causal dimension of business-to-government corruption in projects. These empirical evidences suggest that regulatory and accountability systems can reduce the level of corruption in a country’s public sector, thereby reducing the risk of corruption in projects. Therefore, projects conducted in countries with a low degree of public sector corruption are less prone to project corruption. This yields our first hypothesis:
H1: Higher degrees of public sector corruption increase the likelihood of project corruption.
Project Characteristics and Project Corruption
Contract Size and Project Corruption
Next, we argue larger contract awards to a single bidder increases the likelihood of project corruption. The reason is both corrupt government officials and bidders are motivated to increase the contract size. On the one hand, the amount of bribes that government officials usually receive is related to the size of the contract (Søreide 2002). For example, Kisunko and Knack (2014) show that bidders make informal payments estimated to an average of 15% of the contract value in the Russian Federation. In this way, corrupt government officials are paid more for corruption if the value of a single contract is larger, so government officials have an incentive to award larger contracts to bidders who bribe them. On the other hand, the work scope and complexity will also increase in relation to the size of the contract. This means larger contracts are more likely to be split into different subcontracts (GIACC 2020). The additional size and complexity of the contract therefore makes it easier to provide subcontractors with an opportunity to profit from claims. Contractors usually calculate their profits as a fixed percentage of the contract amount, in addition to earning profits through change orders and claims. As a result, a larger contract size translates into a higher potential profit for them. As a result, both corrupt government officials and bidders have an incentive to increase the contract size. This yields our second hypothesis:
H2: Larger contract sizes increase the likelihood of project corruption.
Repeat Winners and Project Corruption
The probability of corruption is also expected to be higher in projects if there are more repeat winners—i.e., bidders that are awarded more than one contract within the same project. Previous studies have found that corruption is negatively correlated with market competition (Gurgur and Shah 2005; Iwasaki and Suzuki 2012). Shortening the bidding process (Fazekas and Kocsis 2020) and reducing the number of bidders (David-Barrett et al. 2017) are two typical ways market competition is reduced. This improves the likelihood of certain firms winning contracts in a less competitive bidding process (Della Porta and Vannucci 2002; Kenny and Musatova 2011). However, even if the supervision of these processes is strengthened, corrupt officeholders often have considerable scope to respond strategically by shifting their manipulations to other procedural phases (David-Barrett and Fazekas 2020). It is precisely because repeat winners and corrupt government officials establish good working relationships in the procurement stage that they can also engage in corruption in other ways later in the project. For example, in the project implementation phase, repeat winners may propose more changes or unreasonable changes that are accepted by corrupt government officials, and this part of the benefit will also become part of the bribe to corrupt government officials. Previous research also demonstrates that repeat winners are associated with corruption risk in procurement (David-Barrett and Fazekas 2020). This leads to our third hypothesis:
H3: Higher degrees of repeat winners increase the likelihood of project corruption.
Public Sector Corruption, Project Characteristics, and Project Corruption
Lastly, the interactive effects of a project’s context and characteristics on corruption must also be considered (Locatelli et al. 2017). Theoretical accounts of corruption in the public sector are largely dependent on the manipulation of the procurement framework (Williams-Elegbe 2018). For instance, public sector officials can restrict the process of getting permits or licenses by adding red tape. Contractors may be willing to reduce transaction costs from this regulatory burden by paying bribes to government officials. As for contract size, in countries with high public sector corruption, there tend to be more restrictions on normal business activities. Therefore, contractors need to spend more money to bribe officials to get things done. In addition, more officials will be involved in corrupt practices, so contractors have to offer bribes to more officials. Since the amount of the bribe is linked to the total size of the contract, when more bribes must be paid, the contractor will inevitably demand a larger contract sum, consequently increasing the likelihood of corruption in projects with a larger contract. Moreover, corrupt officials may actively pursue projects that are unnecessarily large to maximize their opportunity for bribes (Hobbs 2005). This means officials receive more bribes with ever-increasing contract values. Conversely, in countries with low public sector corruption, there is less red tape and fewer corrupt officials. Consequently, contractors pay fewer bribes. Hence, contractors have no need to increase the number of bribes associated with a contract. In addition, officials face stronger accountability, and the procurement process is better monitored. Even if the contract value increases, it will not increase the officials’ incentives for bribes. Thus, our hypothesis is as follows:
H4: Public sector corruption moderates the relationship between contract size and project corruption. The relationship between contract size and project corruption will be stronger in countries with higher public sector corruption versus in those with low public sector corruption.
As for repeat winners, in countries with high public sector corruption, contractors need to pay out more bribes. If there is a cap on the amount of money in a single contract, then getting multiple contracts is another attractive (and in some cases inevitable) option. In this instance, corrupted government officials may form relational contracts with repeat winners, thereby promoting opportunistic behavior such as corruption (Yakovlev et al. 2016). By contrast, repeat winners in countries with low public sector corruption can only gain legitimacy by reducing corrupt practices. This produces our final hypothesis:
H5: Public sector corruption moderates the relationship between repeat winners and project corruption. The relationship between repeat winners and project corruption will be stronger in countries with higher public sector corruption versus in those with low public sector corruption.
Our conceptual model showing the effects of contract size, repeat winners, and public sector corruption on project corruption is summarized in Fig. 1.

Methodology
Research Data
To test the aforementioned hypotheses, information on infrastructure projects was obtained from annual reports published by the World Bank Integrity Vice Presidency (INT) between 2014 and 2019. These reports provide a summary of corruption in projects funded by the World Bank, which the World Bank has investigated and addressed in each fiscal year. The reports provide information of each fiscal year for countries with sanctioned enterprises, projects involving corruption, and so on. Combining the list of Ineligible Firms and Individuals published by the World Bank, Decisions published by the Sanction Board, and Determinants published by the Office of Suspension and Debarment, the names of projects containing corruption were identified. The list contains ineligible enterprises that will not be awarded a World Bank-financed contract because of sanctions, company addresses, countries of origin, and sanction durations. Since the list is updated every 3 h and the World Bank releases companies from the list that meet its compliance requirements, projects with corruption analyzed in this research come from the list provided in the annual reports.
Decisions and Determinants are issued by the Sanction Board and Office of Suspension and Debarment, respectively, which belong to the sanction system of the World Bank. These two files provide relevant evidence as to which projects were affected and what entities were sanctioned for. When combined with the four parts of the aforementioned material, this allowed us to obtain information on the names of sanctioned projects. Then, detailed project information was obtained through the World Bank Project and Operations database (World Bank 2020). This data set includes basic information such as project title, country, project ID, sector, themes, commitment amount, product line, and financing from 1947 to the present.
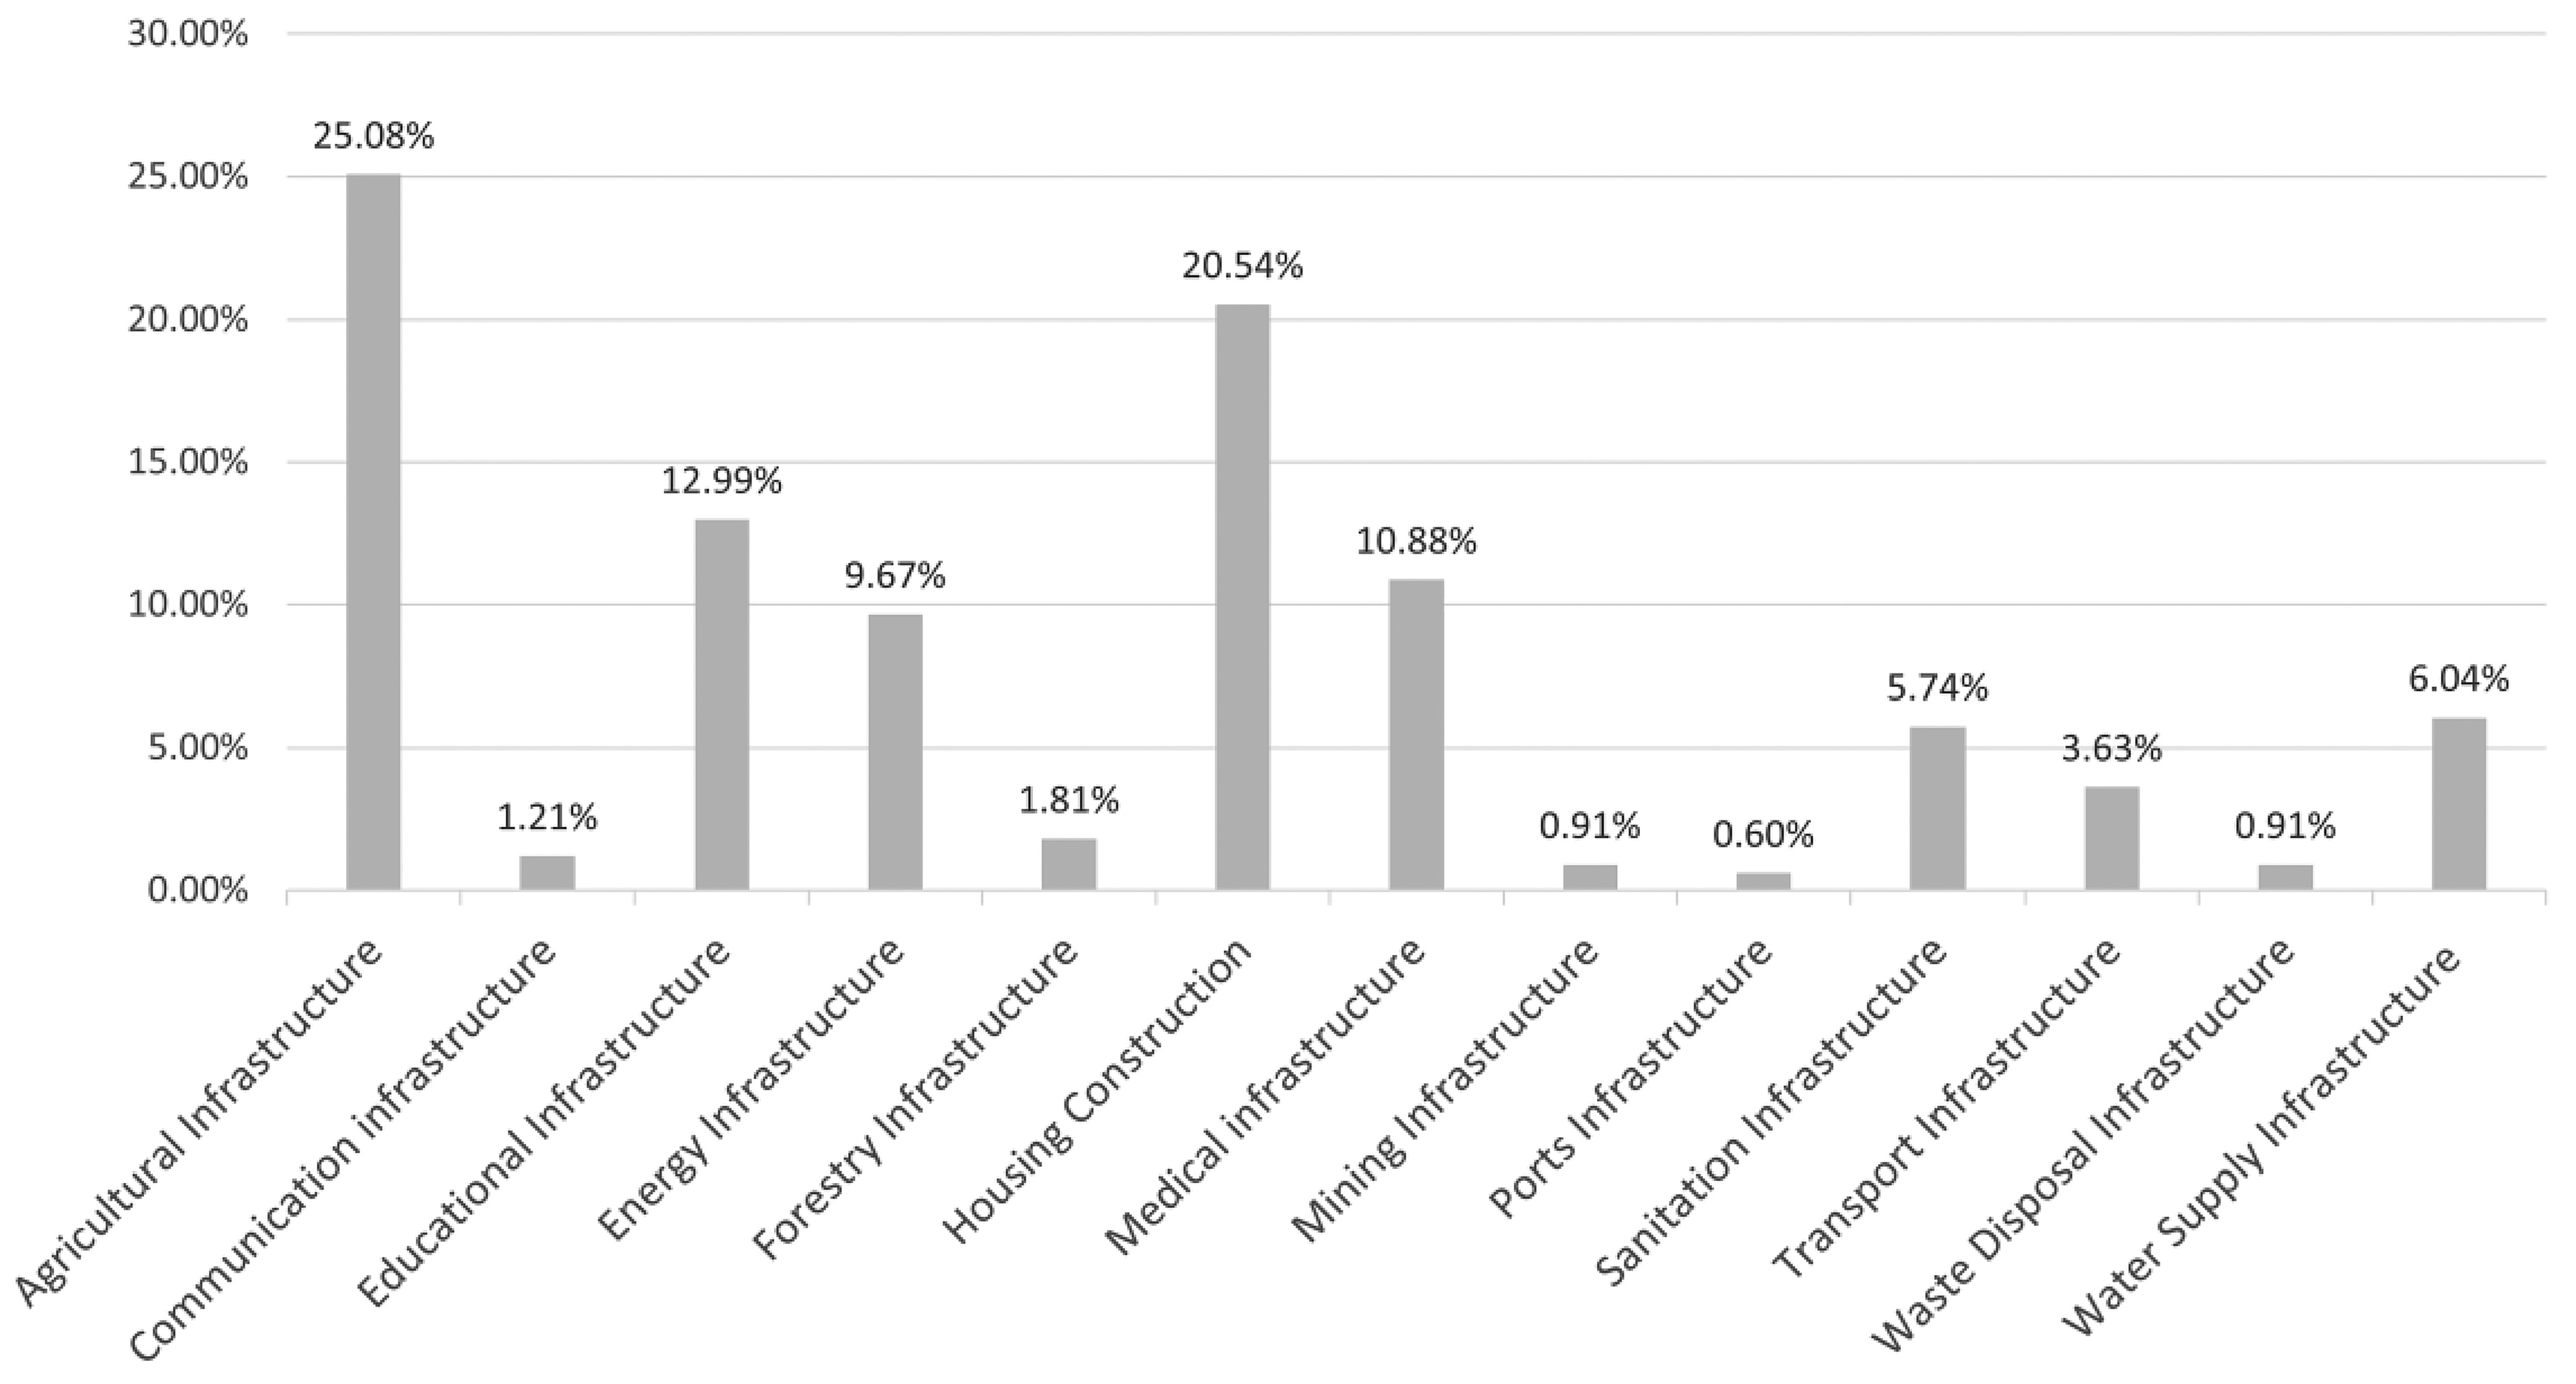
Information about the countries where the projects are located was obtained from the Varieties of Democracy (V-Dem) (2023) database at the University of Gothenburg and the World Bank’s Worldwide Governance Indicators (WGI). The V-Dem database has indicators related to democracy for 202 countries from 1789 to 2018. The Worldwide Governance Indicators consist of six broad dimensions of governance for over 215 countries and territories over the period 1996 to 2018. At this point, we obtained detailed information on 114 projects involving corruption, and then conducted random samples of projects from the Project and Operations database that did not involve corruption to ensure that at least 5 projects were sampled in each project country. After data cleaning, the full sample included 330 projects (114 projects with corruption and 216 projects without corruption), located across 61 countries between 2000 and 2018. Hence, our sample comprises data from 61 countries across 6 global regions, including 18 countries from Africa, 8 from East Asia and the Pacific, 14 from Eastern Europe and Central Asia, 11 from Latin America and the Caribbean, 5 from the Middle East and North Africa, and 5 from South Asia. The regional distribution of countries in the sample is shown in Fig. 2. The distribution of infrastructure types across the entire sample is shown in Fig. 3. Within the sample of infrastructure projects analyzed, agricultural infrastructure had the highest frequency, accounting for 25.08% of all project types, while port infrastructure had the lowest frequency, accounting for only 0.60%.

Measurements
The specific measurement and sources of the studied variables are provided in Table 1. In this study, the dependent variable is project corruption. For the most part, existing studies measure project corruption based on the individual’s perceived level of corruption (Shan et al. 2017; Zhang et al. 2017). The rating report may be influenced by subjective factors such as social desirability and expectation (Nederhof 1985), which may not reflect actual experience (Rose and Peiffer 2012). Therefore, we measure project corruption as a binary variable indicating whether a project involves corruption or not.
| Variables | Measurement | Source |
|---|---|---|
| Dependent variable | ||
| Project corruption | Project corruption is a dichotomous variable. 0 means there are no firms and individuals in the project that have been sanctioned for corruption. The value of 1 means there are firms and individuals in the project who have been sanctioned for corruption. | INT Annual Report (World Bank 2019) |
| Independent variables | ||
| Public sector corruption (PSC) | Public sector corruption was measured using the public sector corruption index that documents to what extent public sector employees grant favors in exchange for bribes, kickbacks, or other material inducements, and how often they steal, embezzle, or misappropriate public funds or other state resources for personal or family use. The lower scores indicate a normatively better situation and higher scores, a normatively worse situation. | V-Dem (V-Dem 2023) |
| Contract size (CS) | The average amount of each contract in the project | Project and Operation data set (World Bank 2022) |
| Repeat winner (RW) | The extent to which a contractor has obtained multiple contracts in the project | Project and Operation data set (World Bank 2022) |
| Control variables | ||
| Number of procurement method (NPM) | Number of procurement methods is calculated by summarizing the procurement methods used in all contracts of a project | Project and Operation data set (World Bank 2022) |
| Cost overrun (CO) | Cost overrun is calculated by dividing the total contract amount of the project by the project cost | Project and Operation data set (World Bank 2022) |
| Political stability (PS) | Political stability combines several indicators that measure perceptions of the likelihood that the government in power will be destabilized or overthrown by possibly unconstitutional and/or violent means, including domestic violence and terrorism | World Bank Governance Indicators (World Bank 2023) |
| Rule of law (ROL) | Rule of law was measured by the rule of law index, which measures to what extent laws are transparently, independently, predictably, impartially, and equally enforced, and to what extent the actions of government officials comply with the law | V-Dem (V-Dem 2023) |
| Government effectiveness (GE) | Government effectiveness combines into a single grouping the quality of public service provision, the quality of the bureaucracy, the competence of civil servants, the independence of the civil service from political pressures, and the credibility of the government’s commitment to policies | World Bank Governance Indicators (World Bank 2023) |
The independent variables are public sector corruption, contract size, and repeat winner. We also considered the number of procurement methods, project cost overruns, rule of law, political stability, and government effectiveness as control variables. It is worth noting that the variables of contract size, repeat winner, number of procurement methods, and cost overruns are calculated from the raw values in the Project and Operations database. The contract size is calculated by dividing the total contract value by the total number of contracts in the project. Repeat winners are the number of contractors awarded multiple contracts in the project divided by the total number of contracts for the project. The number of procurement methods is calculated using the number of procurement methods used for all contracts in the project. Cost overruns are calculated by dividing project costs by the total contract value of the project. The variables obtained from V-Dem and WGI are the raw values provided directly in each respective database.
Data Analysis Strategy
To test the proposed hypotheses, we used multilevel logistic regression. The rationale behind using this method is as follows. In this research, projects are nested within countries (Fleta-Asín et al. 2019). Hence, multilevel models can control for specificities that may be present in each country. In addition, the dependent variable is binary. Therefore, multilevel logistic regression can estimate relationships between predictors and the binary outcome because variables span different levels of analysis (Liu 2015). Using multilevel logistic regression, this paper considers two levels of analysis—i.e., the project level and country level—and allows the effects of project-level variables to vary among countries while controlling for the country effect on project-level variables. We also applied a logarithmic transformation to the independent variables because: (1) the units of these variables differ; and (2) our study examines how the degree of change in these independent variables impacts the probability of corruption in infrastructure projects.
To test the applicability of this multilevel technique, the variability in the intercepts across countries was assessed by conducting a null model that contains no predictors at either level but includes a random intercept (Bliese 2002). The results of the null model show that the variance of the random intercept is significant (β = 1.41, p < 0.001). It indicates that variability in the intercepts across countries is statistically significant. We then calculated the intraclass correlation coefficient (ICC). With an ICC of 0.30, this indicates 30% of the total variance in project corruption is explained by variations between countries where projects are located. According to Cohen (2013), ICC > 0.138 suggests a high degree of spatial heterogeneity. Since ICC is larger than 0.138 and the variance of the random intercept is statistically significant, we were able to use this multilevel modeling technique to analyze the data (Wang et al. 2011).
Results
Descriptive statistics and Pearson correlations for the variables are reported in Table 2. Across all three models presented in Table 3, the maximum variance inflation factor (VIF) is 5.00, which falls well within the acceptable range (< 10) and indicates that multicollinearity is unlikely to be a concern (Tabachnick and Fidell 2007). Yet, it is worth noting that a VIF of 5 is the borderline between moderate and high levels of multicollinearity (Stevens 2002). In Table 3, Model 1 is presented with control variables. At the project level, the number of procurement methods and cost overruns has a positive statistical relationship with project corruption. At the country level, rule of law, political stability, and government effectiveness have no significant relationship with project corruption.
| Variables | Mean | SD | 1 | 2 | 3 | 4 | 5 | 6 | 7 | 8 | 9 |
|---|---|---|---|---|---|---|---|---|---|---|---|
| 1. Project corruption | 0.34 | 0.48 | 1.00 | — | — | — | — | — | — | — | — |
| 2. Number of procurement methods | 4.98 | 2.44 | 0.27*** | 1.00 | — | — | — | — | — | — | — |
| 3. Cost overrun | 0.91 | 0.09 | 0.38*** | 0.41*** | 1.00 | — | — | — | — | — | — |
| 4. Repeat winner | 0.18 | 0.19 | 0.27*** | 0.41*** | 0.32*** | 1.00 | — | — | — | — | — |
| 5. Contract size | 13.30 | 1.80 | 0.36*** | −0.05 | 0.53*** | 0.06 | 1.00 | — | — | — | — |
| 6. Rule of law | 0.40 | 0.23 | −0.00 | −0.13** | −0.07 | −0.04 | −0.01 | 1.00 | — | — | — |
| 7. Political stability | −0.72 | 0.78 | 0.00 | 0.09* | −0.03 | −0.10* | −0.11** | 0.26*** | 1.00 | — | — |
| 8. Government effectiveness | −0.53 | 0.49 | 0.06 | −0.14** | −0.08 | −0.03 | 0.09* | 0.51*** | 0.43*** | 1.00 | — |
| 9. Public sector corruption | 0.67 | 0.20 | 0.04 | 0.14** | 0.07 | 0.08 | −0.01 | −0.88*** | −0.35*** | −0.57*** | 1.00 |
Note: ***p < 0.01, **p < 0.05, and *p < 0.1.
| Variable | Model 1 | Model 2 | Model 3 | |||
|---|---|---|---|---|---|---|
| Coef. | OR | Coef. | OR | Coef. | OR | |
| Intercept | −1.35*** (0.30) | 0.26*** (0.08) | −1.46*** (0.32) | 0.23*** (0.07) | −1.58*** (0.34) | 0.21*** (0.07) |
| NPM | 0.29** (0.10) | 1.33** (0.13) | 0.31** (0.11) | 1.36** (0.15) | 0.33** (0.11) | 1.39** (0.16) |
| CO | 14.15*** (2.92) | 1,396,233.95*** (4,075,111.42) | 8.26* (3.62) | 3,858.77* (13,957.69) | 8.56* (3.78) | 5,204.15* (19,685.76) |
| ROL | −0.54 (1.24) | 0.59 (0.72) | 3.86+ (2.28) | 47.57+ (108.25) | 4.12+ (2.37) | 61.75+ (146.57) |
| PS | −0.18 (0.34) | 0.84 (0.28) | −0.22 (0.36) | 0.80 (0.29) | −0.26 (0.38) | 0.77 (0.29) |
| GE | 0.59 (0.63) | 1.80 (1.13) | 0.75 (0.69) | 2.11 (1.45) | 0.55 (0.72) | 1.74 (1.24) |
| CS | — | — | 0.40* (0.17) | 1.49* (0.25) | 0.52** (0.18) | 1.68** (0.31) |
| RW | — | — | 1.88+ (1.07) | 6.57+ (7.00) | 2.03+ (1.11) | 7.60+ (8.41) |
| PSC | — | — | 5.89* (2.70) | 360.24* (972.23) | 4.83+ (2.80) | 124.98+ (349.68) |
| CS × PSC | — | — | — | — | 1.97** (0.75) | — |
| RW × PSC | — | — | — | — | 6.16 (5.58) | — |
| Random intercept | 2.76*** | 3.09*** | 3.44*** | |||
| Log likelihood | −165.01*** | −157.77*** | −153.53*** | |||
| Observations | 330 | 330 | 330 | |||
| Groups | 61 | 61 | 61 | |||
Note: ***p < 0.001, **p < 0.01, *p < 0.05, +p < 0.1 ; Coef. = Unstandardized regression coefficient; OR = Odds ratio; --- = Odds ratio is not available because it does not convey a meaningful metric when analyzing interactions. Standard errors are displayed in parentheses.
Main Effects
In Table 3, Model 2 contains the results of the main effects. The results reported in Model 2 indicate that public sector corruption has a statistically significant positive association with project corruption (OR = 360.24, p < 0.05), supporting H1. More specifically, a 1-unit increase in public sector corruption corresponds to a 360.24-point increase in the odds of a project involving corruption. This means that when public sector corruption increases by one unit, the probability of corruption occurring in the project is 358.5 times higher than before. H2 posits that a bigger contract size is likely to elicit corruption in the project. The results in Model 2 support H2 (OR = 1.49, p < 0.05), indicating that projects with a bigger contract size tended to increase the likelihood that the project will involve corruption. For instance, a 1-unit increase in contract size corresponds to a 1.49-point increase in the odds of a project involving corruption. In other words, when the contact size increases by one unit, the probability of corruption occurring in the project increases by 49%. H3 suggests that with more repeat winners, corruption is more likely in projects. The results displayed in Model 2 support H3 (OR = 6.57, p < 0.1), which indicates that repeat winners tend to increase the likelihood that a project will have corruption. More specifically, a 1-unit increase in the likelihood of a contractor getting more contracts corresponds to a 6.57-point increase in the odds of a project containing corruption. That is to say, when the repeat winner increases by one unit, the probability of corruption occurring in the project increases to 6.6 times the original probability.
Interaction Effects
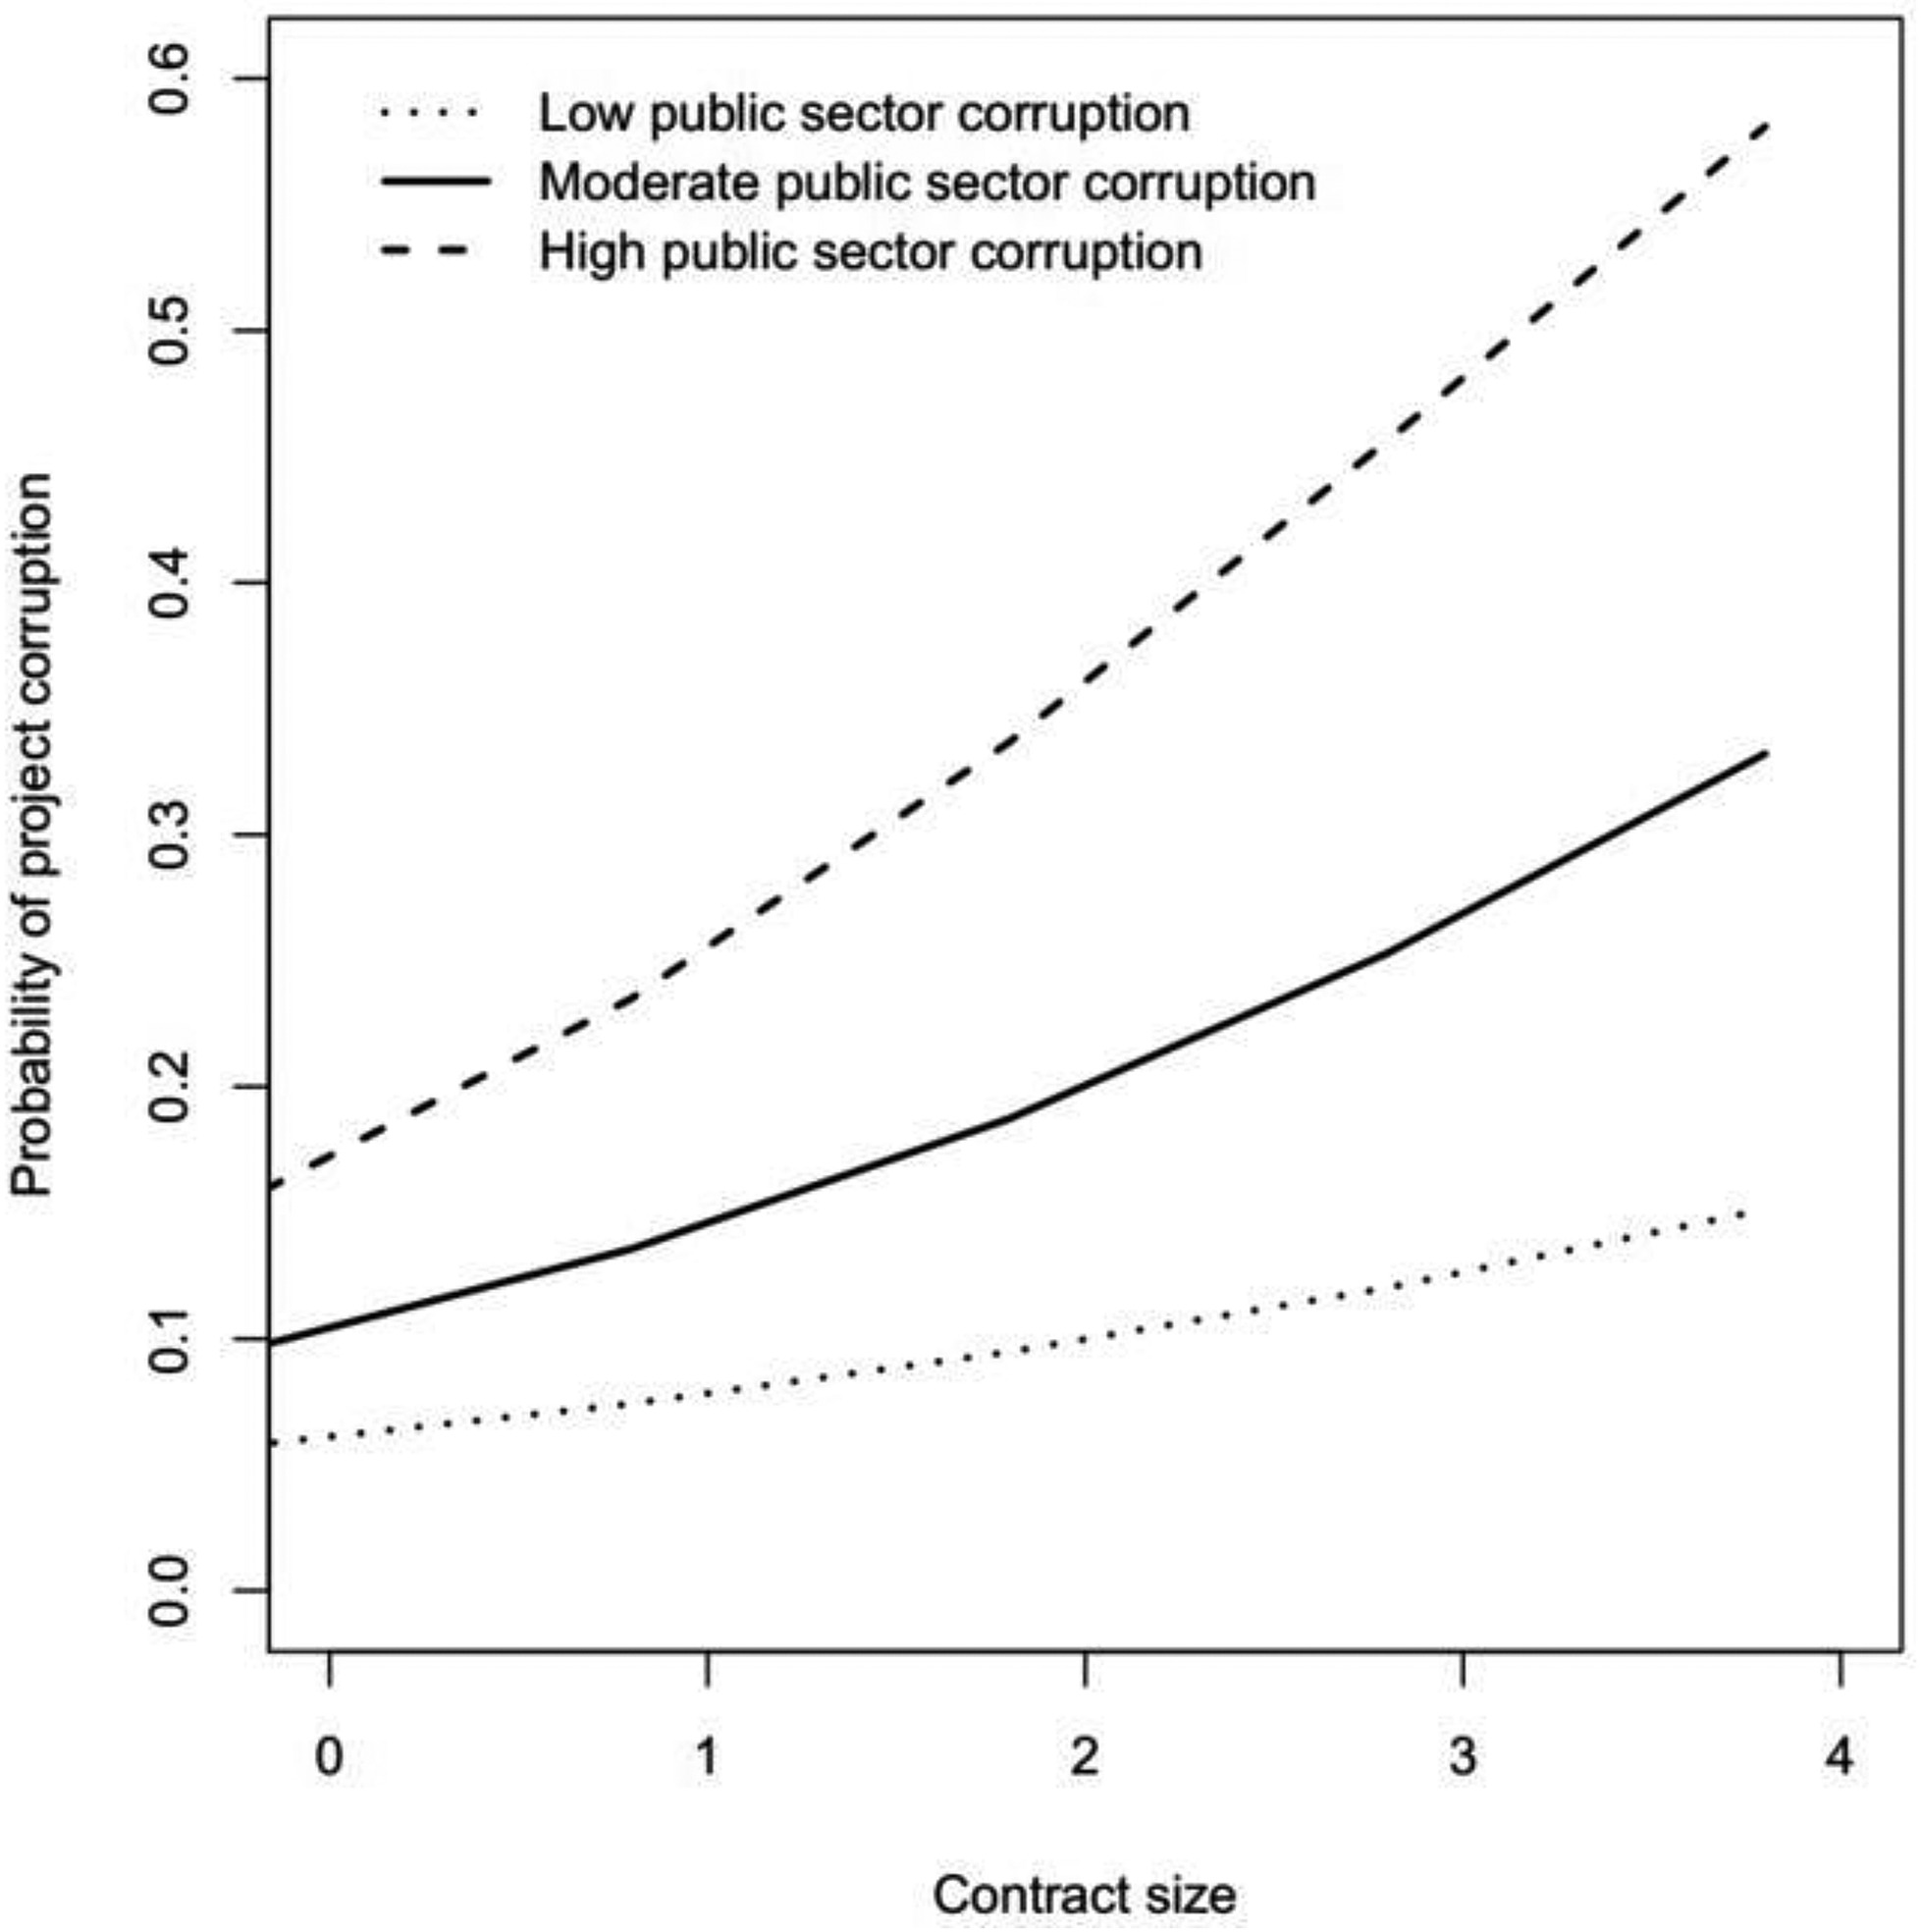
The results in Model 3 and Fig. 4 illustrate that the impact of contract size on project corruption depends on the level of public sector corruption, an overarching institutional factor. H4 assumes that higher levels of corruption in a country’s public sector increase the likelihood that projects with bigger contract sizes will involve corruption. The results in Model 3 support H4 (Coef. = 1.97, p < 0.01). In H5, we predict that higher levels of corruption in a country’s public sector also increase the likelihood that projects with more repeat winners will involve corruption. The results in Model 3 do not support this hypothesis (Coef. = 6.16, p > 0.1).
Discussion
This study investigates the impact of contract size and repeat winners on project corruption within institutional contexts that exhibit diverse levels of public sector corruption. Our analysis reveals a statistically significant positive association between contract size and project corruption, as well as between repeat winners and project corruption. Furthermore, public sector corruption moderates the relationship between contract size and project corruption.
Our research findings on the relationship between contract size and project corruption indicate that contract size has a positive impact on project corruption. These results are consistent with the previous research findings (Fazekas and Kocsis 2020; Dastidar and Mukherjee 2014). From our point of view, larger contracts have the potential to create more opportunities for rent-seeking behavior among the parties involved, including contractors, subcontractors, and government officials, which may lead to corrupt practices and further exacerbate corruption problems in project implementation. Additionally, larger contracts often entail more complex and diverse project activities, which can increase the complexity of the auditing process, making it more challenging to effectively track and scrutinize all aspects of the project and thereby heightening the risk of undetected or unreported corruption.
Our findings also indicate that there is a positive correlation between repeat winners and project corruption, implying that the phenomenon of repeat winners is associated with a higher likelihood of corrupt practices in the project implementation process. The finding aligns with the research conclusions of David-Barrett and Fazekas (2020), indicating a similar relationship between repeat winners and project corruption. The phenomenon of repeat winners implies a reduction in the degree of competition, as the same contractors repeatedly win contracts and potentially limit the number of new bidders in the market. As Fazekas et al. (2015) pointed out, the repetition of contract awards to the same contractors may decrease competition in the bidding process, which can result in less scrutiny and oversight, potentially creating more opportunities for corrupt practices to occur. In addition, repeat winners can also be an indication of nepotism. Government officials may prefer certain contractors, resulting in repeat contract awards. This preference can be due to personal connections, past successful projects, or other factors. However, if contract awards are based on favoritism rather than merit, it can lead to corruption.
Our research results offer two important contributions to the body of literature on project corruption. First, this study integrates the literature on corruption into the field of project management. Existing research argues the extent to which anticorruption strategies are effective hinges upon analyses of corruption causes (Owusu et al. 2019, 2020). However, although certain factors influencing corruption have been identified in the past (and reintroduced in this study), there is limited empirical evidence documenting the interactive effects of these variables on project corruption. This study fills this gap by empirically examining the impact of contract size, repeat winners, and public sector corruption on project corruption. Our results suggest that projects are more likely to be corrupt when contract values are larger. This is due to the fact that bribes are often determined by the percentage of the contract (Hobbs 2005; Søreide 2002). In other words, the larger the contract value, the greater room there is for corruption. This conclusion is consistent with previous research (Dastidar and Mukherjee 2014; Ferwerda et al. 2017). When it comes to repeat winners, any corrupt agreement is illegal, and its participants cannot go to court or use other conflict resolution methods to resolve obligations that are not kept. This problem can be solved by splitting bribes into tranches—with a certain portion of the payment occurring in advance while the main reward is disbursed after the service is rendered (Yakovlev et al. 2016). Repeat winners thus benefit both the demand and supply side of corruption. This means the likelihood for corruption in a project is higher when there are more repeat winners. As for public sector corruption, our empirical results suggest that public sector employees may seek more bribes from contractors in countries with high degrees of public sector corruption. Contractors will consequently pay bribes to public sector officials to obtain contracts, survive, and grow in the market (Mahmood 2010).
This research also links the project corruption literature to institutional theory by demonstrating the moderating effect of public sector corruption on the relationship between project characteristics and project corruption. Our results highlight that the presence of public sector corruption can magnify the effects of contract size on project corruption. This means, in more corrupt institutional environments, larger contract sizes are more likely to lead to project corruption. In less corrupt settings, increases in contract size may be due to other technical requirements associated with the project, rather than corruption. This supports Locatelli et al.’s (2017) contention that it is not easy to change the environment in which a project is situated. Therefore, when projects are nested in environments with higher levels of public sector corruption, it is more important to pay attention to the contract size. Because operating in corrupt environments is sometimes unavoidable, it may only be possible to manage corruption at the project level by monitoring the contracts themselves.
The outputs of this research also have practical significance. These results may be able to help practitioners more effectively manage corruption in these infrastructure projects, especially policymakers at the World Bank who finance these projects. When focusing on corruption at the project level, these decision makers cannot consider only factors influencing corruption at the national level, such as political stability and government effectiveness (Brewer et al. 2007; Campante et al. 2009). Instead, they should focus on the culture of a country’s public sector. Because corruption most often occurs in the procurement phase of a project, our findings provide a more specific indicator of institutional risk for financiers, such as the World Bank, so they can protect themselves against project corruption.
Moreover, out results suggest that multilaterals, such as the World Bank, should set the appropriate size for project contracts to limit scope for corruption. The scale for corruption is usually defined as a percentage of the contract value, so excessive contract values create additional opportunities for corruption. But sometimes, for technical and/or business reasons, some contracts are bound to be large. Under these circumstances, it is important to pay extra attention to corruption risks. Our results show that repeat winners also have a significant influence on the occurrence of corruption in projects. Corrupt parties may choose to divvy up large contracts to avoid additional scrutiny that comes with large contract values. Organizations like the World Bank should thus be concerned about whether these contract splits are justified for technical or managerial reasons. In many situations, a preoccupation with corruption can be costly, both in terms of resources spent to control corruption and the benefits accrued. We therefore offer two important insights to help decision makers and project managers mitigate project corruption more effectively.
Conclusion
Corruption in infrastructure projects has received growing scholarly attention, but limited research has investigated how institutional settings and project characteristics interact to affect project corruption. We study the impact of the most important institutional factor affecting project corruption—i.e., public sector corruption—and two project characteristics—i.e., contract size and repeated winners. The results show that public sector corruption, contract size, and repeat winners all have important impacts on project corruption. Also, public sector corruption amplifies the impact of contract size on project corruption. By revealing how institutional settings influence at the project level, this research expands the scope of corruption research from the national level and the firm level to the project level. Practically, this study emphasizes the need to strengthen the supervision of contract size and repeat winners, especially in countries with corrupt public sectors.
However, this research does have its limitations. First, we focus on the impact of contract size and repeat winners on project corruption during the procurement phase. Yet, recent research shows that the characteristics of various project phases affect project corruption differently (Owusu et al. 2020). Hence, future research should identify how different influencing factors at varying stages of the project impact project corruption. Secondly, this study does not discuss the effectiveness of anticorruption strategies in the procurement stage, and how these strategies impact the relationship between project characteristics and project corruption. This should be empirically tested in future research. Thirdly, although we measured corruption in projects using real-world data, our measurement did not provide a degree of corruption but rather used a binary variable to represent the occurrence of corruption. Moreover, we did not adequately contextualize the relationship between independent variables and project corruption using the units of the variables. In future research, it would be beneficial to develop methods for measuring the degree of corruption using big data techniques. Additionally, more real-world data with variables that have units could be used to explain the degree of corruption in projects, resulting in research findings that are more contextually interpretable. Fourthly, our study did not take into account the comparability of corruption scale. In other words, we did not consider whether the influencing factors are the same for corruption of different magnitudes or if the impact of the same factor varies for different levels of corruption. Finally, the projects in our data are all World Bank projects located in low- and middle-income countries, meaning that the projects are financed from a single source. Hence, future work should discuss how corruption differs in projects with different funding and financing sources.
Acknowledgments
This work was supported by the National Natural Science Foundation of China (Grant Numbers 72301019 and 72304051), the National Social Science Foundation of China (Grant Number 20BGL131), and Project no. 2023CDJXY-001 supported by the Fundamental Research Funds for the Central Universities, Beijing University of Civil Engineering and Architecture Young Teachers’ Research Ability Enhancement Program (X22020).
References
Aduwo, E., E. Ibem, A. Afolabi, A. Oluwunmi, P. Tunji-Olayeni, E. Ayo-Vaughan, U. Uwakonye, and A. Oni. 2020. “Exploring anti-corruption capabilities of e-procurement in construction project delivery in Nigeria.” Constr. Econ. Build. 20 (1): 56–76. https://doi.org/10.5130/AJCEB.v20i1.6964.
Alon, A., and A. M. Hageman. 2017. “An institutional perspective on corruption in transition economies.” Corporate Governance: Int. Rev. 25 (3): 155–166. https://doi.org/10.1111/corg.12199.
Ameyaw, E. E., E. Pärn, A. P. C. Chan, D.-G. Owusu-Manu, D. J. Edwards, and A. Darko. 2017. “Corrupt practices in the construction industry: Survey of Ghanaian experience.” J. Manage. Eng. 33 (6): 05017006. https://doi.org/10.1061/(ASCE)ME.1943-5479.0000555.
Asiedu, R. O., and E. Adaku. 2019. “Cost overruns of public sector construction projects: A developing country perspective.” Int. J. Managing Projects Bus. 13 (1): 66–84. https://doi.org/10.1108/IJMPB-09-2018-0177.
Bliese, P. D. 2002. “Multilevel random coefficient modeling in organizational research: Examples using SAS and S-PLUS.” In Measuring and analyzing behavior in organizations, edited by F. Drasgow and N. Schmitt, 401–445. San Francisco: Jossey-Bass.
Bowen, P. A., P. J. Edwards, and K. Cattell. 2012. “Corruption in the South African construction industry: A thematic analysis of verbatim comments from survey participants.” Construct. Manage. Econ. 30 (10): 885–901. https://doi.org/10.1080/01446193.2012.711909.
Boylan, R. T., and C. X. Long. 2003. “Measuring public corruption in the American states: A survey of state house reporters.” State Polit. Policy Q. 3 (4): 420–438. https://doi.org/10.1177/153244000300300405.
Brewer, G. A., Y. Choi, and R. M. Walker. 2007. “Accountability, corruption and government effectiveness in Asia: An exploration of World Bank governance indicators.” Int. Public Manage. Rev. 8 (2): 204–225.
Brown, J., and M. Loosemore. 2015. “Behavioural factors influencing corrupt action in the Australian construction industry.” Eng. Constr. Archit. Manage. 22 (4): 372–389. https://doi.org/10.1108/ECAM-03-2015-0034.
Campante, F. R., D. Chor, and Q. A. Do. 2009. “Instability and the incentives for corruption.” Econ. Polit. 21 (1): 42–92. https://doi.org/10.1111/j.1468-0343.2008.00335.x.
Casady, C. B. 2021. “Examining the institutional drivers of public–private partnership (PPP) market performance: A fuzzy set qualitative comparative analysis (fsQCA).” Public Manage. Rev. 23 (7): 981–1005. https://doi.org/10.1080/14719037.2019.1708439.
Casady, C. B. 2023. “A time differencing qualitative comparative analysis (QCA) of public–private partnership (PPP) market maturity.” Public Manage. Rev. 1–23. https://doi.org/10.1080/14719037.2023.2177328.
Casady, C. B., and D. Baxter. 2022. “Procuring healthcare public–private partnerships (PPPs) through unsolicited proposals during the COVID-19 pandemic.” J. Public Procure. 22 (1): 6–16. https://doi.org/10.1108/JOPP-07-2020-0061.
Casady, C. B., K. Eriksson, R. E. Levitt, and W. R. Scott. 2019. “(Re)assessing public–private partnership governance challenges: An institutional maturity perspective.” In Public–private-partnerships for infrastructure development: Finance, stakeholder alignment, governance, edited by R. E. Levitt, W. R. Scott, and M. Garvin, 188–204. Cheltenham, UK: Edward Elgar.
Casady, C. B., K. Eriksson, R. E. Levitt, and W. R. Scott. 2020. “(Re)defining public–private partnerships (PPPs) in the new public governance (NPG) paradigm: An institutional maturity perspective.” Public Manage. Rev. 22 (2): 161–183. https://doi.org/10.1080/14719037.2019.1577909.
Casady, C. B., O. H. Petersen, and L. Brogaard. 2023. “Public procurement failure: The role of transaction costs and government capacity in procurement cancellations.” Public Manage. Rev. 1–28. https://doi.org/10.1080/14719037.2023.2231945.
Cavalieri, M., C. Guccio, and I. Rizzo. 2018. “Does corruption and the institutional characteristics of the contracting authorities affect the execution of healthcare infrastructures? An empirical investigation for Italy.” J. Public Procure. 18 (2): 148–164. https://doi.org/10.1108/JOPP-06-2018-010.
Chan, A. P. C., and E. K. Owusu. 2017. “Corruption forms in the construction industry: Literature review.” J. Constr. Eng. Manage. 143 (8): 04017057. https://doi.org/10.1061/(ASCE)CO.1943-7862.0001353.
Cohen, J. 2013. Statistical power analysis for the behavioral sciences. New York: Academic Press.
Damoah, I. S., C. A. Akwei, I. O. Amoako, and D. Botchie. 2018. “Corruption as a source of government project failure in developing countries: Evidence from Ghana.” Project Manage. J. 49 (3): 17–33. https://doi.org/10.1177/8756972818770587.
Dastidar, K. G., and D. Mukherjee. 2014. “Corruption in delegated public procurement auctions.” Eur. J. Polit. Econ. 35: 122–127. https://doi.org/10.1016/j.ejpoleco.2014.05.003.
David-Barrett, E., and M. Fazekas. 2020. “Anti-corruption in aid-funded procurement: Is corruption reduced or merely displaced?” World Dev. 132: 105000. https://doi.org/10.1016/j.worlddev.2020.105000.
David-Barrett, E., M. Fazekas, O. Hellmann, L. Mark, and C. McCorley. 2017. Controlling corruption in development aid: New evidence from contract-level data. Brighton, UK: Sussex Centre for the Study of Corruption.
Della Porta, D., and A. Vannucci. 2002. “Corruption and public contracts: Some lessons from the Italian case.” In Corrupt exchanges: Empirical themes in the politics and political economy of corruption, edited by D. D. Porta and S. R. Acerman, 1–196. Baden-Baden, Germany: Nomos Verlagsgesellschaft.
Dimant, E., and G. Tosato. 2018. “Causes and effects of corruption: What has past decade's empirical research taught us? A survey.” J. Econ. Surv. 32 (2): 335–356. https://doi.org/10.1111/joes.12198.
Fazekas, M., and G. Kocsis. 2020. “Uncovering high-level corruption: Cross-national objective corruption risk indicators using public procurement data.” Br. J. Polit. Sci. 50 (1): 155–164. https://doi.org/10.1017/S0007123417000461.
Fazekas, M., P. A. Lukács, and I. J. Tóth. 2015. “The political economy of grand corruption in public procurement in the construction sector of Hungary.” In Government favouritism in Europe the anticorruption report, edited by A. Mungiu-Pippidi, 53–68. Berlin: Germany: Barbara Budrich Publishers.
Ferwerda, J., I. Deleanu, and B. Unger. 2017. “Corruption in public procurement: Finding the right indicators.” Eur. J. Crim. Policy Res. 23 (2): 245–267. https://doi.org/10.1007/s10610-016-9312-3.
FIDIC (International Federation of Consulting Engineers). 2016. Business integrity, corruption. Geneva: FIDIC.
Fleta-Asín, J., F. Muñoz, and J. Rosell-Martínez. 2019. “Public–private partnerships: Determinants of the type of governance structure.” Public Manage. Rev. 22 (10): 1489–1514. https://doi.org/10.1080/14719037.2019.1637014.
GIACC (Global Infrastructure Anti-Corruption Centre). 2020. “How corruption occurs.” Accessed February 28, 2023. https://giaccentre.org/how-corruption-occurs/.
Goel, R. K., and J. Budak. 2006. “Corruption in transition economies: Effects of government size, country size and economic reforms.” J. Econ. Finance 30 (2): 240–250. https://doi.org/10.1007/BF02761489.
Gurgur, T., and A. Shah. 2005. Localization and corruption: Panacea or Pandora’s box? World Bank Policy Research Working Paper. Washington, DC: World Bank.
Henisz, W. J., R. E. Levitt, and W. R. Scott. 2012. “Toward a unified theory of project governance: Economic, sociological and psychological supports for relational contracting.” Eng. Project Organ. J. 2 (1–2): 37–55. https://doi.org/10.1080/21573727.2011.637552.
Hobbs, N. 2005. Corruption in World Bank financed projects: Why bribery is a tolerated anathema? Washington, DC: World Bank.
Hosseini, M. R., I. Martek, S. Banihashemi, A. P. Chan, A. Darko, and M. Tahmasebi. 2020. “Distinguishing characteristics of corruption risks in Iranian construction projects: A weighted correlation network analysis.” Sci. Eng. Ethics 26: 205–231. https://doi.org/10.1007/s11948-019-00089-0.
Iwasaki, I., and T. Suzuki. 2012. “The determinants of corruption in transition economies.” Econ. Lett. 114 (1): 54–60. https://doi.org/10.1016/j.econlet.2011.08.016.
Jiménez, A., and S. Bayraktar. 2020. “Political risk in private participation projects: The effects of political discretionality and corruption.” Thunderbird Int. Bus. Rev. 62 (2): 149–160. https://doi.org/10.1002/tie.22120.
Jiménez, A., S. Bayraktar, J. C. Puche-Regaliza, and A. Herrero. 2020. “Corruption and private participation infrastructure projects: The influence of vicarious experience and national animosity.” Can. J. Administrative Sci. 37 (4): 513–527. https://doi.org/10.1002/cjas.1569.
Jiménez, A., M. Russo, J. M. Kraak, and G. F. Jiang. 2017. “Corruption and private participation projects in central and Eastern Europe.” Manage. Int. Rev. 57 (5): 775–792. https://doi.org/10.1007/s11575-017-0312-4.
Kenny, C., and M. Musatova. 2011. “‘Red flags of corruption’ in World Bank projects: An analysis of infrastructure contracts.” In International handbook on the economics of corruption, edited by S. Rose-Ackerman and T. Søreide. Chletenham, UK: Edward Elgar.
Kingsford Owusu, E., and A. P. C. Chan. 2019. “Barriers affecting effective application of anticorruption measures in infrastructure projects: Disparities between developed and developing countries.” J. Manage. Eng. 35 (1): 04018056. https://doi.org/10.1061/(ASCE)ME.1943-5479.0000667.
Kisunko, G., and S. Knack. 2014. “Russian federation: National and regional trends in regulatory burden and corruption.” In Proc., Wealth, Income Inequalities, and Demography: The Long-Term Policy View, edited by L. Paganetto. 45–104. Cham, Switzerland: Springer.
Le, Y., M. Shan, A. P. C. Chan, and Y. Hu. 2014. “Overview of corruption research in construction.” J. Manage. Eng. 30 (4): 02514001. https://doi.org/10.1061/(ASCE)ME.1943-5479.0000300.
Liu, X. 2015. Applied ordinal logistic regression using Stata: From single-level to multilevel modeling. Los Angeles: Sage.
Locatelli, G., E. Konstantinou, J. Geraldi, and T. Sainati. 2022. The dark side of projects: Uncovering slavery, corruption, criminal organizations, and other uncomfortable topics. Los Angeles: Sage.
Locatelli, G., G. Mariani, T. Sainati, and M. Greco. 2017. “Corruption in public projects and megaprojects: There is an elephant in the room!.” Int. J. Project Manage. 35 (3): 252–268. https://doi.org/10.1016/j.ijproman.2016.09.010.
Mahmood, S. A. I. 2010. “Public procurement and corruption in Bangladesh confronting the challenges and opportunities.” J. Public Adm. Policy Res. 2 (6): 103–111.
Nederhof, A. J. 1985. “Methods of coping with social desirability bias: A review.” Eur. J. Social Psychol. 15 (3): 263–280. https://doi.org/10.1002/ejsp.2420150303.
Owusu, E. K., A. P. C. Chan, and M. Shan. 2019. “Causal factors of corruption in construction project management: An overview.” Sci. Eng. Ethics 25 (1): 1–31. https://doi.org/10.1007/s11948-017-0002-4.
Owusu, E. K., A. P. C. Chan, J. Yang, and E. Pärn. 2020. “Towards corruption-free cities: Measuring the effectiveness of anti-corruption measures in infrastructure project procurement and management in Hong Kong.” Cities 96: 102435. https://doi.org/10.1016/j.cities.2019.102435.
Pashev, K. V. 2011. “Corruption and accession: Evidence from public procurement in Bulgaria.” Public Manage. Rev. 13 (3): 409–432. https://doi.org/10.1080/14719037.2011.553270.
Pillay, S., and R. Kluvers. 2014. “An institutional theory perspective on corruption: The case of a developing democracy.” Financ. Account. Manage. 30 (1): 95–119. https://doi.org/10.1111/faam.12029.
Presidency, I. V. 2023. “What can the World Bank Group’s Integrity Vice Presidency (INT) investigate?” Accessed July 4, 2023. https://www.worldbank.org/en/about/unit/integrity-vice-presidency/What-can-the-World-Bank-Groups-INT-investigate.
Rose, R., and C. Peiffer. 2012. “Paying bribes to get public services: A comparative guide to concepts and measures.” CSPP Studies in Public Policy No. 494. Amsterdam, Netherlands: Elsevier.
Rose-Ackerman, S., and B. J. Palifka. 2016. Corruption and government: Causes, consequences, and reform. Cambridge, UK: Cambridge University Press.
Rustiarini, N. W., T. Sutrisno, N. Nurkholis, and W. Andayani. 2019. “Why people commit public procurement fraud? The fraud diamond view.” J. Public Procure. 19 (4): 345–362.
Sanyal, R. 2005. “Determinants of bribery in international business: The cultural and economic factors.” J. Bus. Ethics 59 (1–2): 139–145. https://doi.org/10.1007/s10551-005-3406-z.
Scott, W. R. 2012. “The institutional environment of global project organizations.” Eng. Project Organ. J. 2 (1–2): 27–35. https://doi.org/10.1080/21573727.2011.634546.
Shan, M., Y. Le, K. T. W. Yiu, A. P. C. Chan, and Y. Hu. 2017. “Investigating the underlying factors of corruption in the public construction sector: Evidence from China.” Sci. Eng. Ethics 23 (6): 1643–1666. https://doi.org/10.1007/s11948-016-9865-z.
Sharma, S. K., A. Sengupta, and S. C. Panja. 2019. “Mapping corruption risks in public procurement: Uncovering improvement opportunities and strengthening controls.” Public Perform. Manage. Rev. 42 (4): 947–975. https://doi.org/10.1080/15309576.2018.1535984.
Signor, R., P. E. D. Love, and O. Olatunji. 2016. “Determining overpricing in Brazilian infrastructure projects: A forensic approach.” J. Constr. Eng. Manage. 142 (9): 06016001. https://doi.org/10.1061/(ASCE)CO.1943-7862.0001156.
Sohail, M., and S. Cavill. 2008. “Accountability to prevent corruption in construction projects.” J. Constr. Eng. Manage. 134 (9): 729–738. https://doi.org/10.1061/(ASCE)0733-9364(2008)134:9(729).
Søreide, T. 2002. “Corruption in public procurement.” In Causes, consequences and cures. Bergen, Norway: Chr Michelsen Institute.
Stansbury, N. 2005. “Exposing the foundations of corruption in construction.” In Global corruption report 2005, edited by D. Rodriguez, G. Waite and T. Wolfe, 36–55. London: Transparency International.
Stevens, J. P. 2002. Applied multivariate statistics for the social sciences. 4th ed. Mahwah, NJ: Lawrence Erlbaum Associates Publishers.
Tabachnick, B. G., and L. S. Fidell. 2007. Using multivariate statistics. 5th ed. Boston: Allyn and Bacon.
Tabish, S. Z. S., and K. N. Jha. 2011. “Analyses and evaluation of irregularities in public procurement in India.” Construct. Manage. Econ. 29 (3): 261–274. https://doi.org/10.1080/01446193.2010.549138.
Tabish, S. Z. S., and K. N. Jha. 2012. “The impact of anti-corruption strategies on corruption free performance in public construction projects.” Construct. Manage. Econ. 30 (1): 21–35. https://doi.org/10.1080/01446193.2011.654128.
Tabish, S. Z. S., and K. N. Jha. 2018. “Beyond the iron triangle in public construction projects.” J. Constr. Eng. Manage. 144 (8): 04018067. https://doi.org/10.1061/(ASCE)CO.1943-7862.0001517.
Uhlenbruck, K., P. Rodriguez, J. Doh, and L. Eden. 2006. “The impact of corruption on entry strategy: Evidence from telecommunication projects in emerging economies.” Organ. Sci. 17 (3): 402–414. https://doi.org/10.1287/orsc.1060.0186.
V-Dem (Varieties of Democracy) Project. 2023. V-Dem codebook v 13. Gothenburg, Sweden: V-Dem Institute.
Wang, J., H. Xie, and J. F. Fisher. 2011. Multilevel models: Applications using SAS. Boston: Walter de Gruyter.
Williams-Elegbe, S. 2012. Fighting corruption in public procurement: A comparative analysis of debarment measures. Oxford, UK: Hart.
Williams-Elegbe, S. 2018. “Systemic corruption and public procurement in developing countries: Are there any solutions?” J. Public Procure. 18 (2): 131–147. https://doi.org/10.1108/JOPP-06-2018-009
WEF (World Economic Forum). 2016. “This is why construction is so corrupt.” Accessed April 1, 2020. https://www.weforum.org/agenda/2016/02/why-is-the-construction-industry-so-corrupt-and-what-can-we-do-about-it/.
World Bank. 2014a. Guidelines procurement of goods, works, and non-consulting services under IBRD loans and IDA credits and grants by World Bank borrowers. Washington, DC: World Bank.
World Bank. 2014b. Guidelines selection and employment of consultants under IBRD loans and IDA credits and grants by World Bank borrowers. Washington, DC: World Bank.
World Bank. 2018. World bank procurement regulations for investment project financing borrowers. Washington, DC: World Bank.
World Bank. 2019. World Bank group sanctions system annual report FY19. Washington, DC: World Bank.
World Bank. 2020. Warning signs of fraud and corruption in procurement. Washington, DC: World Bank.
World Bank. November 21, 2022. “World Bank data catalog.” Accessed February 28, 2023. www.worldbank.org. https://datacatalog.worldbank.org/search/dataset/0037800.
World Bank. October 19, 2023. “Worldwide governance indicators.” Accessed February 28, 2023. www.worldbank.org.https://www.worldbank.org/en/publication/worldwide-governance-indicators.
Yakovlev, A., O. Vyglovsky, O. Demidova, and A. Bashlyk. 2016. “Incentives for repeated contracts in public sector: Empirical study of gasoline procurement in Russia.” Int. J. Procure. Manage. 9 (3): 272–289. https://doi.org/10.1504/IJPM.2016.076305.
Yu, Y., I. Martek, M. R. Hosseini, and C. Chen. 2019. “Demographic variables of corruption in the Chinese construction industry: Association rule analysis of conviction records.” Sci. Eng. Ethics 25 (4): 1147–1165. https://doi.org/10.1007/s11948-018-0024-6.
Zhang, B., Y. Le, B. Xia, and M. Skitmore. 2017. “Causes of business-to-government corruption in the tendering process in China.” J. Manage. Eng. 33 (2): 05016022. https://doi.org/10.1061/(ASCE)ME.1943-5479.0000479.
Information & Authors
Information
Published In

ASCE OPEN: Multidisciplinary Journal of Civil Engineering
Volume 2 • Issue 1 • April 2024
Copyright
This work is made available under the terms of the Creative Commons Attribution 4.0 International license, https://creativecommons.org/licenses/by/4.0/.
History
Received: Mar 2, 2023
Accepted: Jan 5, 2024
Published online: Apr 15, 2024
Published in print: Apr 15, 2024
Discussion open until: Sep 15, 2024
Authors
Metrics & Citations
Metrics
Citations
Download citation
If you have the appropriate software installed, you can download article citation data to the citation manager of your choice. Simply select your manager software from the list below and click Download.