Diffusion or Polarization in Intercity Property Markets after the Completion of Intercity Metro Line
Publication: Journal of Urban Planning and Development
Volume 149, Issue 4
Abstract
As an important intercity commuting approach, the intercity metro line is expected to increase the housing choices of residents in core cities and then change the price difference between property markets in two connected cities. This study has investigated the influence of the Guangzhou–Foshan Metro Line and the related network on local residential property markets. Based on the property transaction records and point of interest (POI) location information, a significant polarization effect is detected in most regions in Guangzhou because of this metro line. However, a diffusion effect is also found only in the regions within 500 m from stations. The distance to stations is proven to be a crucial determinant for the polarization/ diffusion effect in property markets. For cross border regions, the city premium disappears in a sample region through which the Guangzhou–Foshan Line passes. By contrast, a large city premium persists in another sample region through which the line does not run. The intercity metro line only partially narrows the gap of property values in a few regions but enlarges the price difference in most regions between the two cities. City planners should be aware of the polarization effect by the intercity metro line network, especially for the excessive supply in property markets in noncore cities.
Introduction
The metro line has become one of the most important urban public transportation modes in large cities. Compared with buses and private cars, metro lines belong to mass passenger transport systems and have better performance in the reduction of air pollution and energy consumption (Li et al. 2019). These advantages promote the large-city governments to develop other metro stations and lines to release the traffic congestion on the road. Consequently, the accessibility to metro stations also becomes an attractive condition for large-city residents in housing markets. The accessibility to the metro line service has a significant influence on property market values, although this influence can be either positive or negative (Landis et al. 1995; Bowes and Ihlanfeldt 2001; Bae et al. 2003; Hess and Almeida 2007; Liang et al. 2007; Dai et al. 2016).
The intercity rail transit service is also becoming an important transportation mode for intercity travel. According to the China Statistical Yearbook, the number of passengers by railway increased from 1.68 billion in 2010 to 3.37 billion in 2018. Whereas the number of passengers by highway dropped from 30.53 billion to 13.62 billion in the same period. The decreasing amount of total intercity travel passengers and the increasing amount of railway passengers enhance the fact that the newly built intercity high-speed railway has affected some residents’ travel choices during this period. Apart from high-speed rail (HSR), the intercity metro line has changed some residents’ travel patterns, and it incurs complicated influence on the property markets. The intercity metro line provides additional choices for residents who cannot afford the high property prices in core cities by reducing the commuting cost between core cities and surrounding cities. This scenario can at least increase the short-term housing demand and may promote the long-term property demand in surrounding cities, when these cities can supply attractive living environments to those who work in core cities.
Previous studies focused on the impact of HSR on property markets in nearby cities (Chen and Haynes 2015; Zhang and Zhang 2018; Liu et al. 2018) or the direct effect from rail transit stations on neighborhood property prices (Andersson et al. 2010; Yang et al. 2015; Kim and Lahr 2013; Zhang et al. 2016; Pan et al. 2014; Zhang et al. 2016; Zhong and Li 2016; Wagner et al. 2017). Discussions have scarcely been conducted regarding the influence of intercity metro line on property markets along the line. To fill this research gap, this study focuses on the case of the Guangzhou–Foshan Metro Line, the first metro line which connects two prefectural-level cities in China, to investigate its comprehensive impact on Guangzhou and Foshan property market prices, especially for the diffusion/ polarization effect.
The concept of diffusion and polarization effect comes from Growth Pole Theory. A core city will attract the production factors from neighborhood noncore cities. This polarization effect enlarges the difference. Later, the core city may spread its investment to nearby regions and make them benefit from the growth of the core city. This diffusion effect narrows the gap. Similar effects in the residential property market come from the inflow and outflow of the labor force between core cities and noncore cities. Polarization (diffusion) effect in economics increases the housing demand in core cities faster (slower) than that in noncore cities and generates the polarization (diffusion) effect in property markets. Moreover, residents who cannot afford the housing cost in core cities will also prefer nearby noncore cities and will contribute to the diffusion.
The contributions of this study are twofold. First, this study focuses on whether the intercity metro line has promoted the polarization or diffusion effect across the property markets in different cities along the lines. Similar topics have been discussed along the HSR lines in previous studies based on the macro property market data (Hong and Li 2011; Chen and Haynes 2015; Zhang and Zhang 2018; Liu et al. 2018). This study applies the micro market information, that is, the transaction records in two adjacent cities, to investigate the influence from the intercity metro line. Second, this study separates the price impact from the accessibility to a metro line station and the polarization/ diffusion effect across property markets in two cities due to the intercity metro line. Previous studies only focused on the accessibility premium from stations, transit-oriented development central business district (CBD), job opportunities, retail activity in market prices (John and Sirmans 1996; Bowes and Ihlanfeldt 2001; Agostini and Palmucci 2008; Duncan 2011; Xu et al. 2016), or the diffusion/ polarization effect across different macro property markets. Spatial regression models based on the Hedonic Pricing model with the interaction terms between the city difference and the accessibility to metro line stations are adopted to analyze the accessibility premium and polarization/ diffusion effect simultaneously. The Guangzhou–Foshan Metro Line, which connects two adjacent cities in a similar culture, is adopted as the study subject. By comparing the property market values around the Guangzhou–Foshan Line and other regions in these two cities, the question whether the intercity metro line has promoted the diffusion effect or polarization effect on the cross boundary regions in two cities can be answered.
The structure of this article is detailed as follows. The Literature Review section provides a brief literature review on the impact of rail transit service on urban development. After a background description of property markets in two cities and a description of Guangzhou–Foshan Metro Line, the Methodology section presents and explains the major hypotheses about the polarization/ diffusion effect, and introduces the spatial models adopted in this study. The Data Description section demonstrates the research region with the intercity metro line, and the research period. Then, empirical results based on the Hedonic Pricing model and spatial models will be conducted to test the hypotheses followed by the discussion of results. Conclusions will include the major findings and suggestions to policy makers.
Literature Review
For the property market, the contribution of intercity rail transit systems is typically linked to the factors on the demand side of the property market, such as the changes in land use and the regional expansion (Sung and Oh 2011; Ratner and Goetz 2013; Liu et al. 2014; Tan et al. 2017; Li et al. 2018), the population mobility, and the redistribution of different industries. Wang et al. (2019) have investigated how the HSR system influences the population mobility and urbanization in the Yangtze River Delta. The service of the HSR significantly increases short-term population mobility but decreases long-term migration. Cities with HSR have an insignificantly lower urbanization rate than those without HSR. Shao et al. (2017) confirmed the significant impact of HSR on the agglomeration of the producer service industry but an insignificant impact on the agglomeration of the consumer service or public service industry in the same region. A diffusion effect was also detected on the service industry of median and small cities along the HSR. This redistribution further encourages the population to migrate to the new areas. The general polarization effect or diffusion effect of HSR on the regional economy is also detected (Lu et al. 2013; Monzón et al. 2013; Li 2015; Qin et al. 2015; Chen and Haynes 2015). The trends of economic growth of cities nearby the HSR are usually related to the distribution of jobs and then the demand of property markets. These phenomena are the indirect influence of the intercity rail transit network on the nearby property markets.
The rail transit system not only plays an important indirect role in the property market changes but also shows significant direct impacts on values of residential properties which are located close to rail stations. The relationship between accessibility to stations and housing prices can be explained by the theory of value of time. People are willing to pay for the opportunity cost, that is, travel time, in the form of housing expenditure within their affordability. The impacts of the accessibility to metro line stations on residential property values have earlier been discussed in many studies in two aspects, that is, the impact on values of properties in the same city and the impact on property values across multiple cities.
Alquhtani and Anjomani (2019) and Li et al. (2019) have summarized the existing studies on how the rail transit stations influence the nearby property values. Zhang et al. (2016) investigated the panel data for 35 Chinese cities and found a positive relationship between rail transit infrastructure and property values. Significant positive effects for proximity to nearby rail stations are found in Beijing, China (Zhang et al. 2016), Shanghai, China (Pan et al. 2014), Hudson and Bergen, New Jersey (Kim and Lahr 2013), and Charlotte, North Carolina (Yan et al. 2012). Conversely, some scholars found decreasing property values due to negative externalities, such as the cases in Hampton Roads, Virginia (Wagner et al. 2017), Los Angeles, California (Zhong and Li 2016), Beijing, China (Dai et al. 2016), and Bogota, Columbia (Munoz-Raskin 2007). In some studies, positive and negative effects are detected in different areas, such as the high- and low-income areas in Buffalo, New York (Hess and Almeida 2007) and different areas at different distances from downtown (Bowes and Ihlanfeldt 2001). Additionally, minor or negligible effects of the accessibility to rail transit were detected in some cities (Andersson et al. 2010; Camins-Esakov and Vandegrift 2018; Kim and Zhang 2005). The influence of rail transit on property values varies in different cities.
In the case of the intercity rail transit service, recent studies focus on the impact of the newly built high-speed railway in China. For cities along the Beijing–Shanghai HSR Line, the impact on housing prices in medium and small cities was found to be more substantial than that in capital cities (Chen and Haynes 2015). A similar diffusion effect can be detected along the Wuhan–Guangzhou HSR. Large cites obtained less appreciation in housing prices than the median and small cities (Zhang and Zhang 2018). However, Liu et al. (2018) investigated 250 prefectural-level cities in China and found that the large cities and cities close to these large cities had more appreciation in housing prices than other cities along the HSR. Haynes (1997) found that the opening of the HSR between Paris and Le Mans would raise the land price in Le Mans. Diffusion effects appear in the small cities which are located in the economic circles of large cities. However, polarization effects appear between cities inside and outside these economic circles. Chang and Diao (2022) compared the residential property prices around the metro line stations in Shenzhen before and after the opening of the HSR between Hangzhou and Shenzhen. They proved that the negative externalities from the HSR line would restrain the growth of housing prices next to the HSR station and the metro line stations near the HSR terminal. Meanwhile, the HSR has a network effect through the metro network on the residential properties near the metro line stations. The opening of this HSR line contributed to an additional increase in the property prices near these stations from 15 min of metro travel time to the Shenzhen North Station. In other words, the metro line network has spread the rise of property prices.
The aforementioned studies summarized how the rail transit system, especially the HSR system, promotes the diffusion and polarization effects on urban economics and property markets. However, the study on how the intercity metro line shows impacts on property markets in two cities has two characteristics different from these studies. First, the impact of the intercity metro line focuses on the property market in two adjacent cities. To demonstrate the range of influence from the metro line stations accurately, micro market data, such as the transaction records with location information, should be adopted. Comparatively, the polarization/ diffusion effect from HSR on nearby property markets usually focuses on the change in the macro market trend. Second, in the micro aspect, the accessibility effect to metro line stations, central business district (CBD), primary schools, and other major facilities should be estimated separately from the polarization/ diffusion effect. The accessibility effect to metro line stations can explain the value of time cost and the externalities of the metro line service. However, whether the intercity metro line reduces or increases the difference in the market value in two cities cannot be captured directly from this accessibility effect. An interaction term between the city difference and the accessibility to metro line stations is introduced to evaluate how the metro line increases or decreases the market value of properties in the core city compared with the noncore city. Third, the research of polarization/ diffusion effect on macro property markets in a region adopts the centrality, density, and accessibility coefficients to measure the accessibility of each city in the HSR network. In this case of a micro market, several cross border regions around the intercity metro line are adopted to demonstrate the accessibility to this line for each property.
Methodology
Hypotheses on the Polarization and Diffusion Effect
According to the Hedonic Pricing Model (Rosen 1974; Tse 2002; Hui et al. 2007; Choy et al. 2007), the characteristics of property contain structural factors, location factors, and accessibility factors (or neighborhood factors). Structural factors include the number of rooms/ toilets/ kitchens/ stories, building age, direction, area, lift, and other building characteristics. Location factors include the region information of the property and the distance to the CBD or other city centers. Accessibility/ neighborhood factors include the accessibility to transportation, education, health care, catering, and other living service facilities. They are defined by the distance from housing units to the facilities. The polarization/ diffusion effect can be measured by the difference in coefficients of location factors. In this study, location factors include the city where the property is located.
Notably, the polarization/ diffusion effect describes the change in difference in property markets between core cities and noncore cities. If the structural characteristics, the accessibility to different kinds of services, and the distance to CBD are already included in the quantitative model to explain the property value, an additional variable can be introduced to capture the residents’ evaluation on the difference in value which is explained by “which city the property locates,” that is, the city premium. The latter is a premium in property values between the core city and the noncore city. Then, the increase or decrease in this city premium can represent the polarization effect and diffusion effect in the property market.
To measure the change in city premium due to the intercity metro line, the interaction terms between the city premium and the accessibility to metro line stations are adopted in this model. Positive interaction terms indicate that the property units near the stations in Guangzhou have higher values than those in Foshan when the city premium and the other location/ accessibility factors are controlled. In other words, the intercity metro line causes the polarization effect through the metro line networks. By contrast, negative interaction terms indicate that the diffusion effect exists.
This study investigates the following three questions. First, would the intercity metro line cause the polarization effect or the diffusion effect between two property markets in a core city and a noncore city? In this study, the property markets in Guangzhou and Foshan are examined. Second, does the polarization/ diffusion effect depend on the accessibility to the stations? For example, the property units with a distance in the ranges of 0–500, 500–1,000, and 1,000–1,500 m from the stations may be affected by different polarization/ diffusion effects. Third, can the intercity metro line in the cross border region eliminate the city premium between two markets?
In the traditional research of the diffusion and polarization effects, annual average housing prices in two cities are usually adopted for difference-in-difference analysis before and after the construction of HSR (or other railway service). However, China’s residential property market has experienced a rapid increasing trend since 2000. Cities with the highest GDP levels have an even larger appreciation in property values, regardless of whether the urban integration is promoted or not in these cities. If we adopt the annual average housing prices to evaluate the two effects in the residential market, we will encounter difficulties to exclude the increasing trend in the whole market and the higher increasing trend in the property market of the core city. The influence of the intercity metro line may be concealed by these two trends.
Instead, we will adopt the residential transaction records in a specific period when the property market is stable to exclude the disturbance of market trends. As the rail transit system has been attributed to promote the diffusion or polarization effect in metropolitan areas (Chen and Haynes 2015; Chen and Haynes 2015; Li 2015; Liu et al. 2018; Lu et al. 2013; Monzón et al. 2013; Qin et al. 2015; Shao et al. 2017; Wang et al. 2019; Zhang and Zhang 2018), the interaction term between the city premium and the accessibility to metro line stations are included; the goal is to test whether the diffusion or polarization effect is significant. Additionally, the residential market in Guangzhou is divided into two submarkets based on the districts which are adjacent or not to Foshan. As the metro line network can spread the influence of the intercity line to properties near the stations in the network (Chang and Diao 2022), we can compare the price difference in the adjacent and nonadjacent submarkets between Guangzhou and Foshan. This process can further explain the detailed influence from the intercity metro line on property markets between two cities.
The third question focuses on the cross border region, as the comparison between adjacent/ nonadjacent submarkets in Guangzhou and in Foshan cannot cover the impacts on property market prices by metro line networks. An additional investigation of the cross border regions in two cities is necessary. In this study, the Fangcun–Guicheng Region and New Transportation Station Region around the Guangzhou South Station are chosen to discuss the influence from the metro line network. The Guangzhou–Foshan Metro Line passes through the Fangcun–Guicheng Region, but no metro line connects the part belonging to Foshan in the New Transportation Station Region which is around the Guangzhou South Station.
Spatial Models in This Study
To investigate the above questions, this study adopts the spatial error model and spatial autoregressive model based on the Hedonic Pricing Model (Rosen 1974). This decision is due to the spatial correlation of housing transaction prices. The spatial correlation of housing prices was first discovered by Holmans (1990) in the UK study from the 1960s to 1990s, and supported by other scholars in the UK (MacDonald and Taylor 1993; Alexander and Barrow 1994). Meen (1996, 1999) described this phenomenon as the spatial aggregation and spatial dependence and discussed the two major reasons, that is, the spatial patterns in the determinants of house prices and the spatial arbitrage in an insufficient market. Housing markets were found to have regional differences in response to the changes in national coefficients, for example, interest rate, income, consumption, and unemployment rate. Additionally, nearby numerous amenities are usually shared by neighborhood properties (Basu and Thibodeau 1998; Militino et al. 2004), which may not be completely captured as variables. Then, consumers tend to refer to nearby property values, which lead to spatial correlations. The spatial correlation is also found in the US (Holly et al. 2010), Australia (Luo et al. 2007), New Zealand (Shi et al. 2009), and China (Ding and Ni 2015). Hence, spatial econometric models should be adopted to analyze the housing markets instead of the ordinary least squares (OLS) models.
As the original dataset contains too many variables, the first step is to build a regression model with the stepwise method to select the influential factors:P is the transaction price. City is a dummy variable which records the city where the property is located. The coefficient of this dummy variable can represent the city premium between two cities. Dist is the distance between this property and the CBD in the core city. Metro is a set of dummy variables which record the distance between the property and the metro line station. Stru includes the structural variables of this property. Acce includes the accessibility variables, which are defined by the distance to the facilities. CCHI is the value of price index when the transaction occurs to control the price changes due to the market trend.
The stepwise method can identify the factors which do not contribute to the housing price. After the removal of these factors, the spatial error model and spatial autoregressive model are adopted in the second step to estimate the influence of the rest factors on housing prices with the spatial correlation effect controlled. The spatial weight matrix is constructed based on the latitude and longitude information of the housing estates where the units are located. Here, the spatial weight matrix is converted from the spatial adjacent matrix based on the Delaunay triangularization network. Only the properties in the same housing estates and in the nearby housing estates with adjacent relations in the Delaunay triangularization network are weighted in the matrix. The rest are set as zero. This methodology is suggested by Pace and Barry (1997) and Lesage (1999) in the spatial statistics toolbox for Matlab.
The formula of the spatial error model (SEM) in this study is as follows:
The formula of the spatial autoregressive model (SAR) in this study iswhere the parameter ρ is the coefficient of the spatial autoregressive term.
These two models can reduce the disturbance from spatial correlation on the regression results. Further tests will be conducted to compare the value of log-likelihood or Akaike information criterion (AIC) with that in the OLS model to prove that these spatial models are superior to the OLS model.
Data Description
Descriptions of the Guangzhou–Foshan Intercity Metro Line
The Guangzhou–Foshan Metro Line is the first metro line which connects two prefectural-level cities in China. The first phase was completed in November 2010. The last phase in Guangzhou was completed in December 2018. More than 300,000 passengers commute by the Guangzhou–Foshan Metro Line every day.
This metro line passes through the Nanhai District, Chanchen District, and Shunde District in Foshan. This line runs through the downtown district, that is, Chanchen District in Foshan. It also passes through the Guangdong High Tech Service Zone for Financial Institutions in the Nanhai District, which is the only provincial-level financial service zone in Guangdong. This zone has become a new CBD in Foshan. As a result, the downtown region and CBD region in Foshan are both near this metro line.
The Guangzhou–Foshan Metro Line passes through the Liwan District and Haizhu District in Guangzhou. Although these two districts belong to downtown districts in Guangzhou, this metro line does not directly pass through the most mature regions in these two districts. However, this metro line has four interchange stations which connect Lines 1, 2, 3, and 8. Most mature regions in the Guangzhou downtown can be achieved within one interchange from the Guangzhou–Foshan Metro Line. This line has shortened the commute time of residents who live in Foshan downtown and work in Guangzhou downtown.
Since the Guangzhou–Foshan Metro Line opened to traffic in 2010, the commuting population between Guangzhou and Foshan started to increase every year. From 2014 to 2018, the number of average daily passengers increased by 32.9% on all lines and 119.8% on the Guangzhou–Foshan Line.
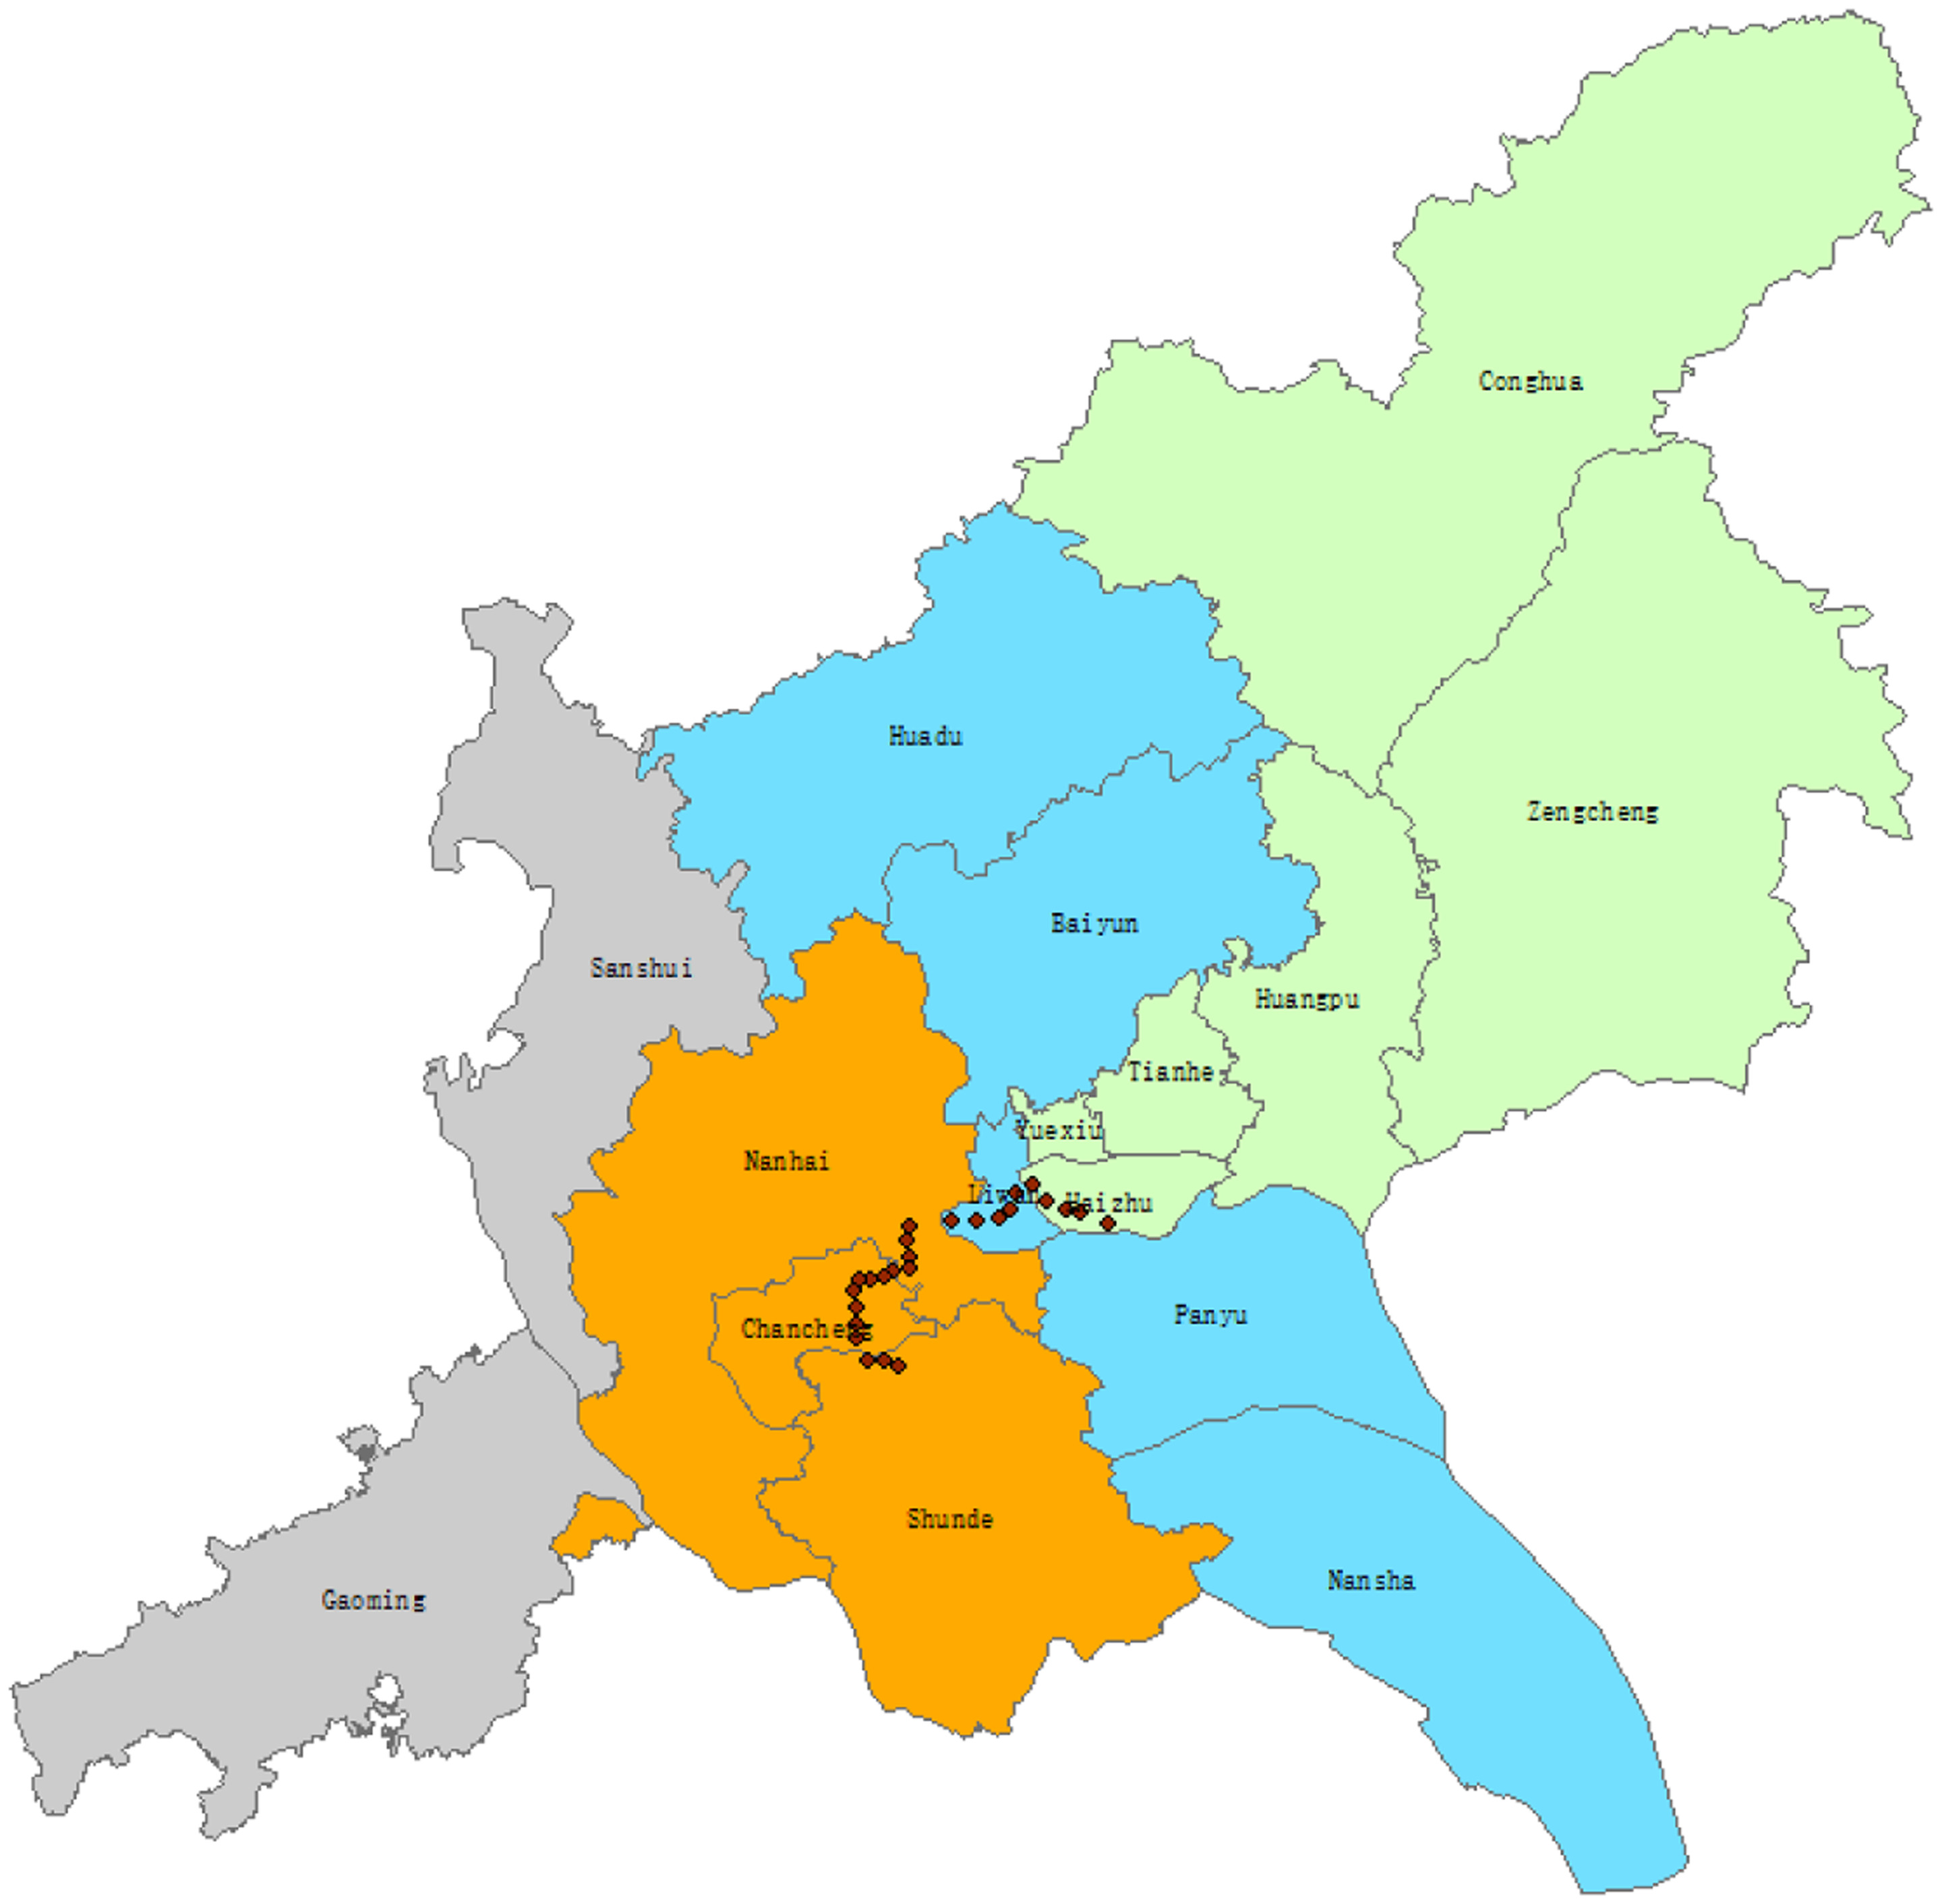
Fig. 1 is the map of Guangzhou and Foshan. This map includes the location of stations on the Guangzhou–Foshan Metro Line and the location of the CBD (Tianhe District). In this figure, two different submarkets in Guangzhou and the sampling regions in Foshan are also colored.
Research Period and Research Regions
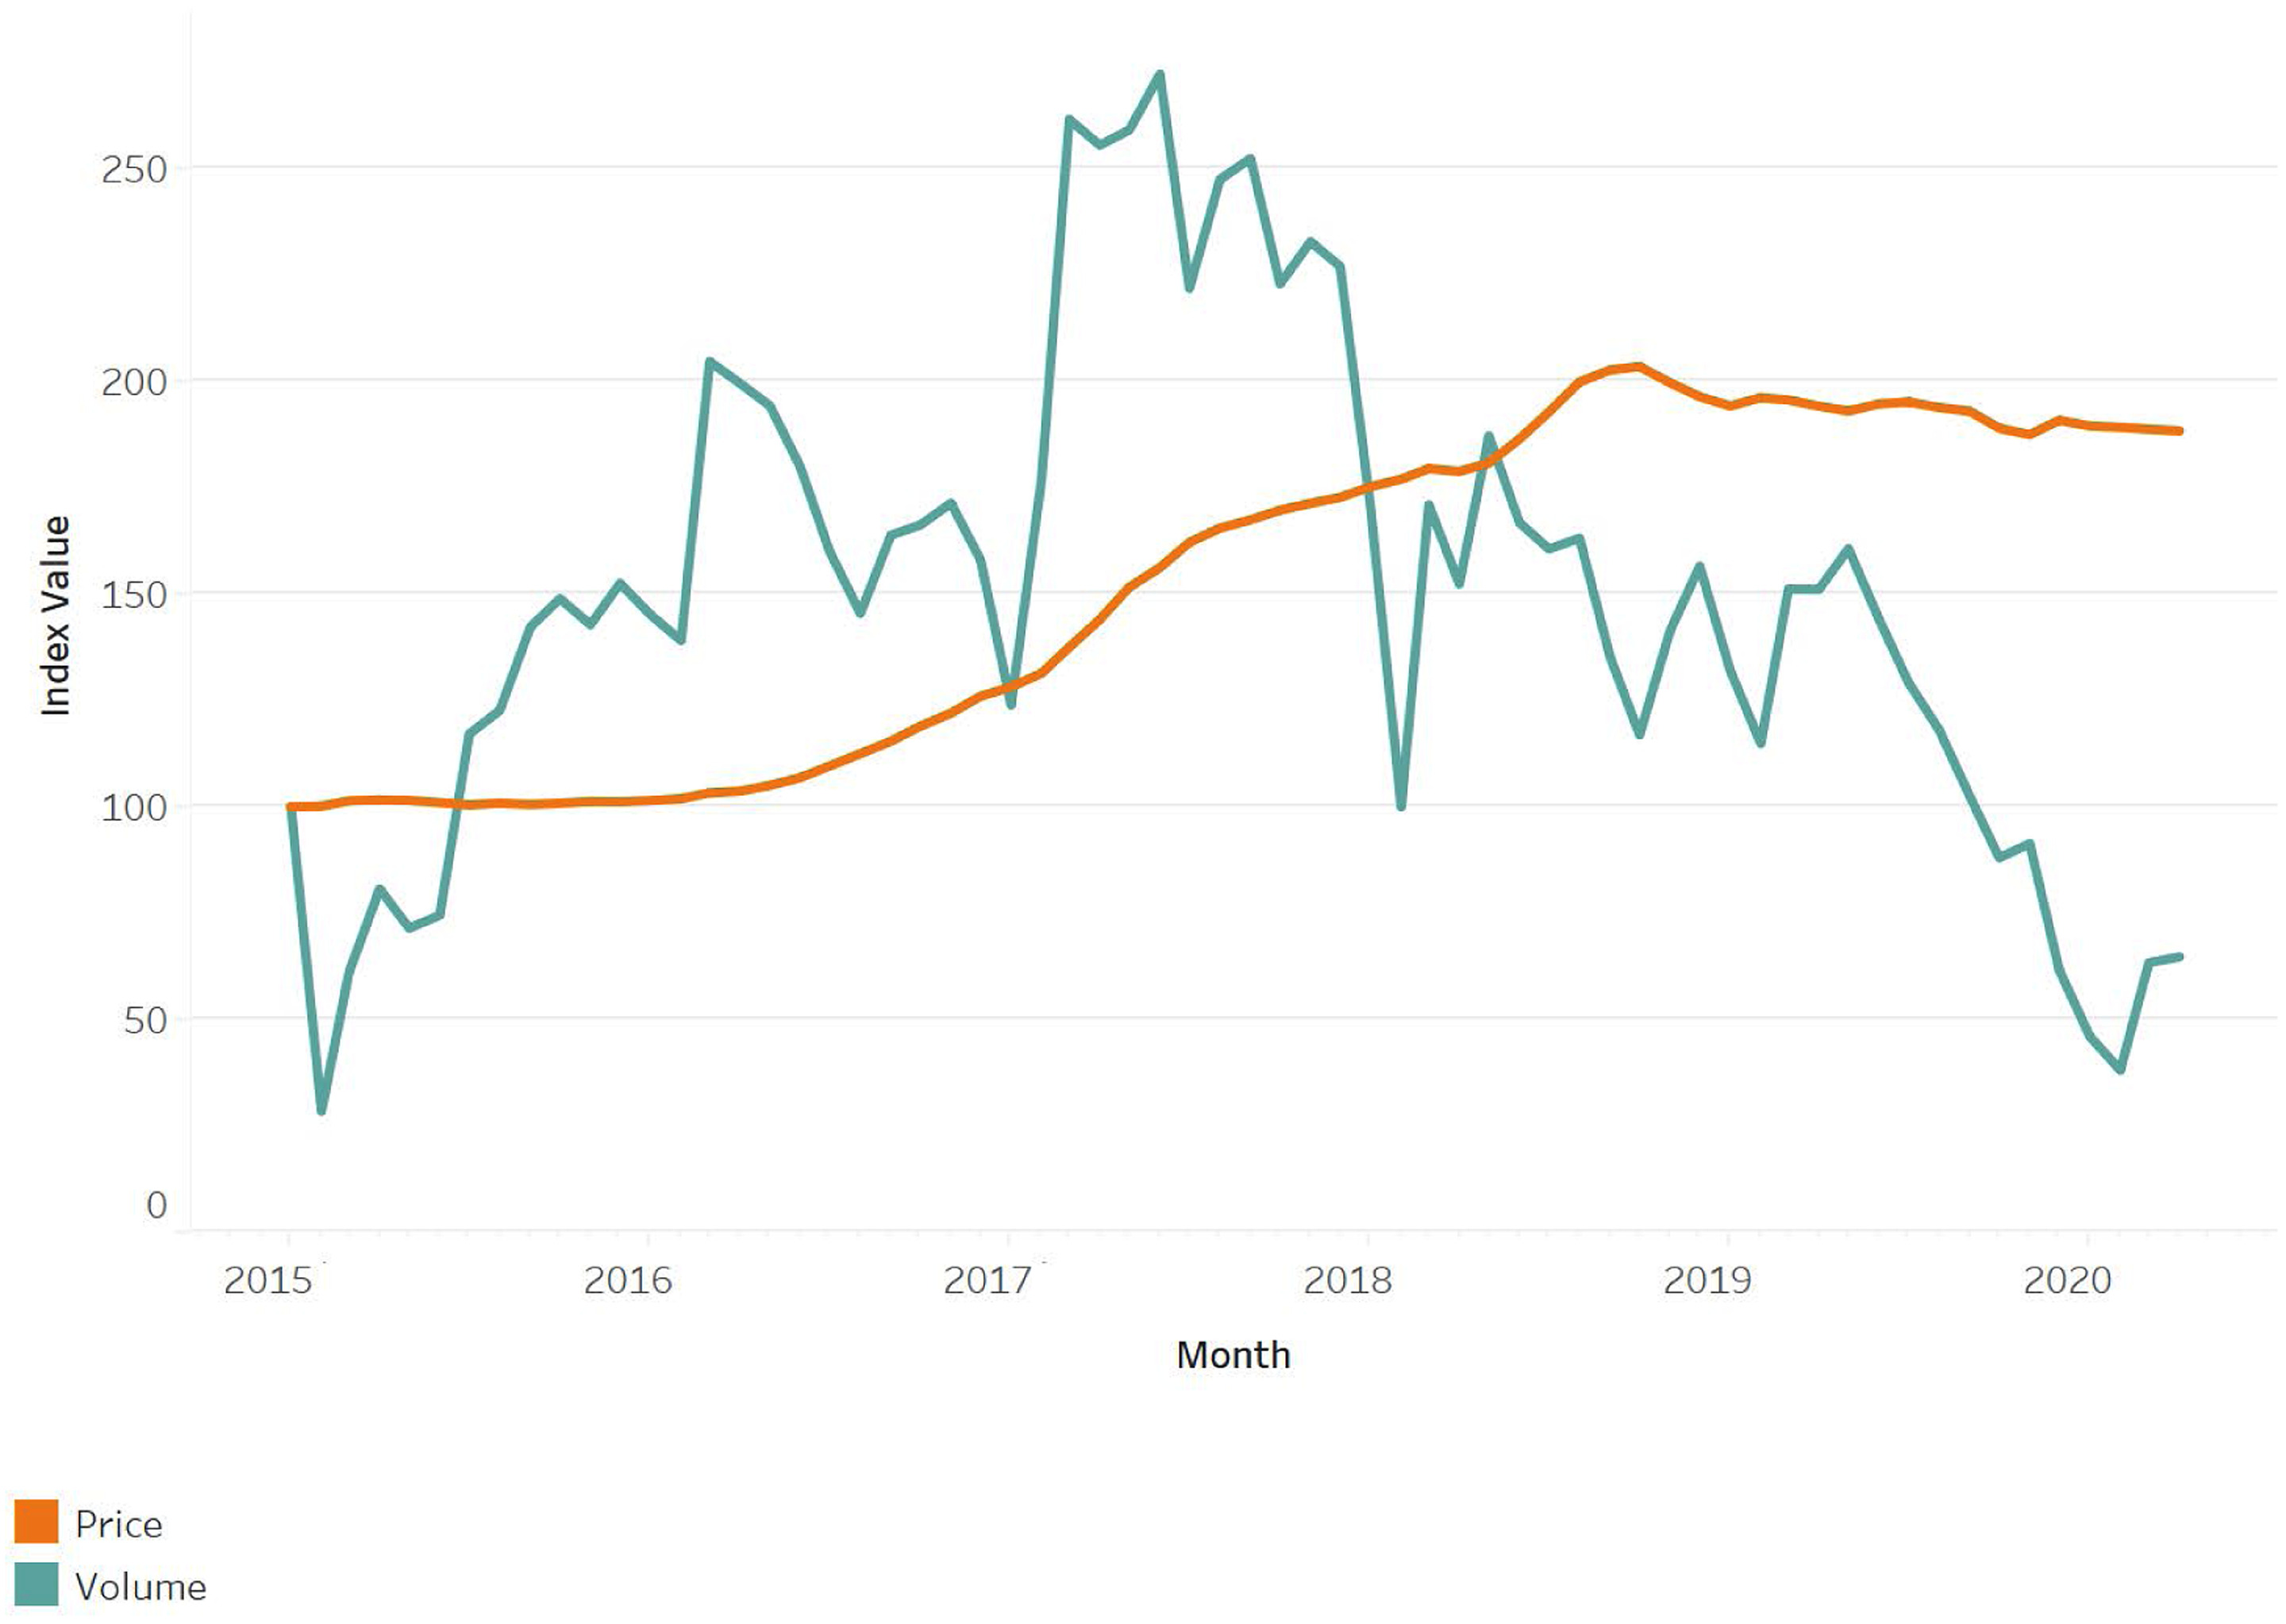
Property transaction records were collected from Lianjia, a large property agency company in China. Second-hand transaction records in 2018–2019 in Guangzhou and Foshan were adopted. The selection of this period is supported for three reasons. First, the market trend of second-hand properties was stable between 2018 and 2019. Fig. 2 depicts the China city housing index in Guangzhou between January 2015 and April 2020. The observation results in 2018–2019 were more stable than in 2015–2017. Second, governments in two cities agreed to promote the integration in March 2009, close to 10 years before the observation period. The analysis results are good responses to the governments’ efforts within this decade. Third, the Guangzhou–Foshan Metro Line in Foshan City was totally completed in December 2016. The influence of this new transportation system was assimilated by the property market in the observation period. In this study, only the transaction records in the Chancheng, Nanhai, and Shunde Districts are included as samples in Foshan in the regression analysis. The other two districts have no metro lines during the sample period. The research region covers all the urban core and fringe areas in two cities (Huang et al. 2016).
According to the adjacent relationship, the administrative districts in Guangzhou can be divided into two submarkets. The adjacent submarket (Submarket 1) includes Huadu District, Baiyun District, Liwan District, Panyu District, and Nansha District. The nonadjacent submarket (Submarket 2) includes the Yuexiu District, Haizhu District, Tianhe District, Huangpu District, Conghua District, and Zengcheng District.
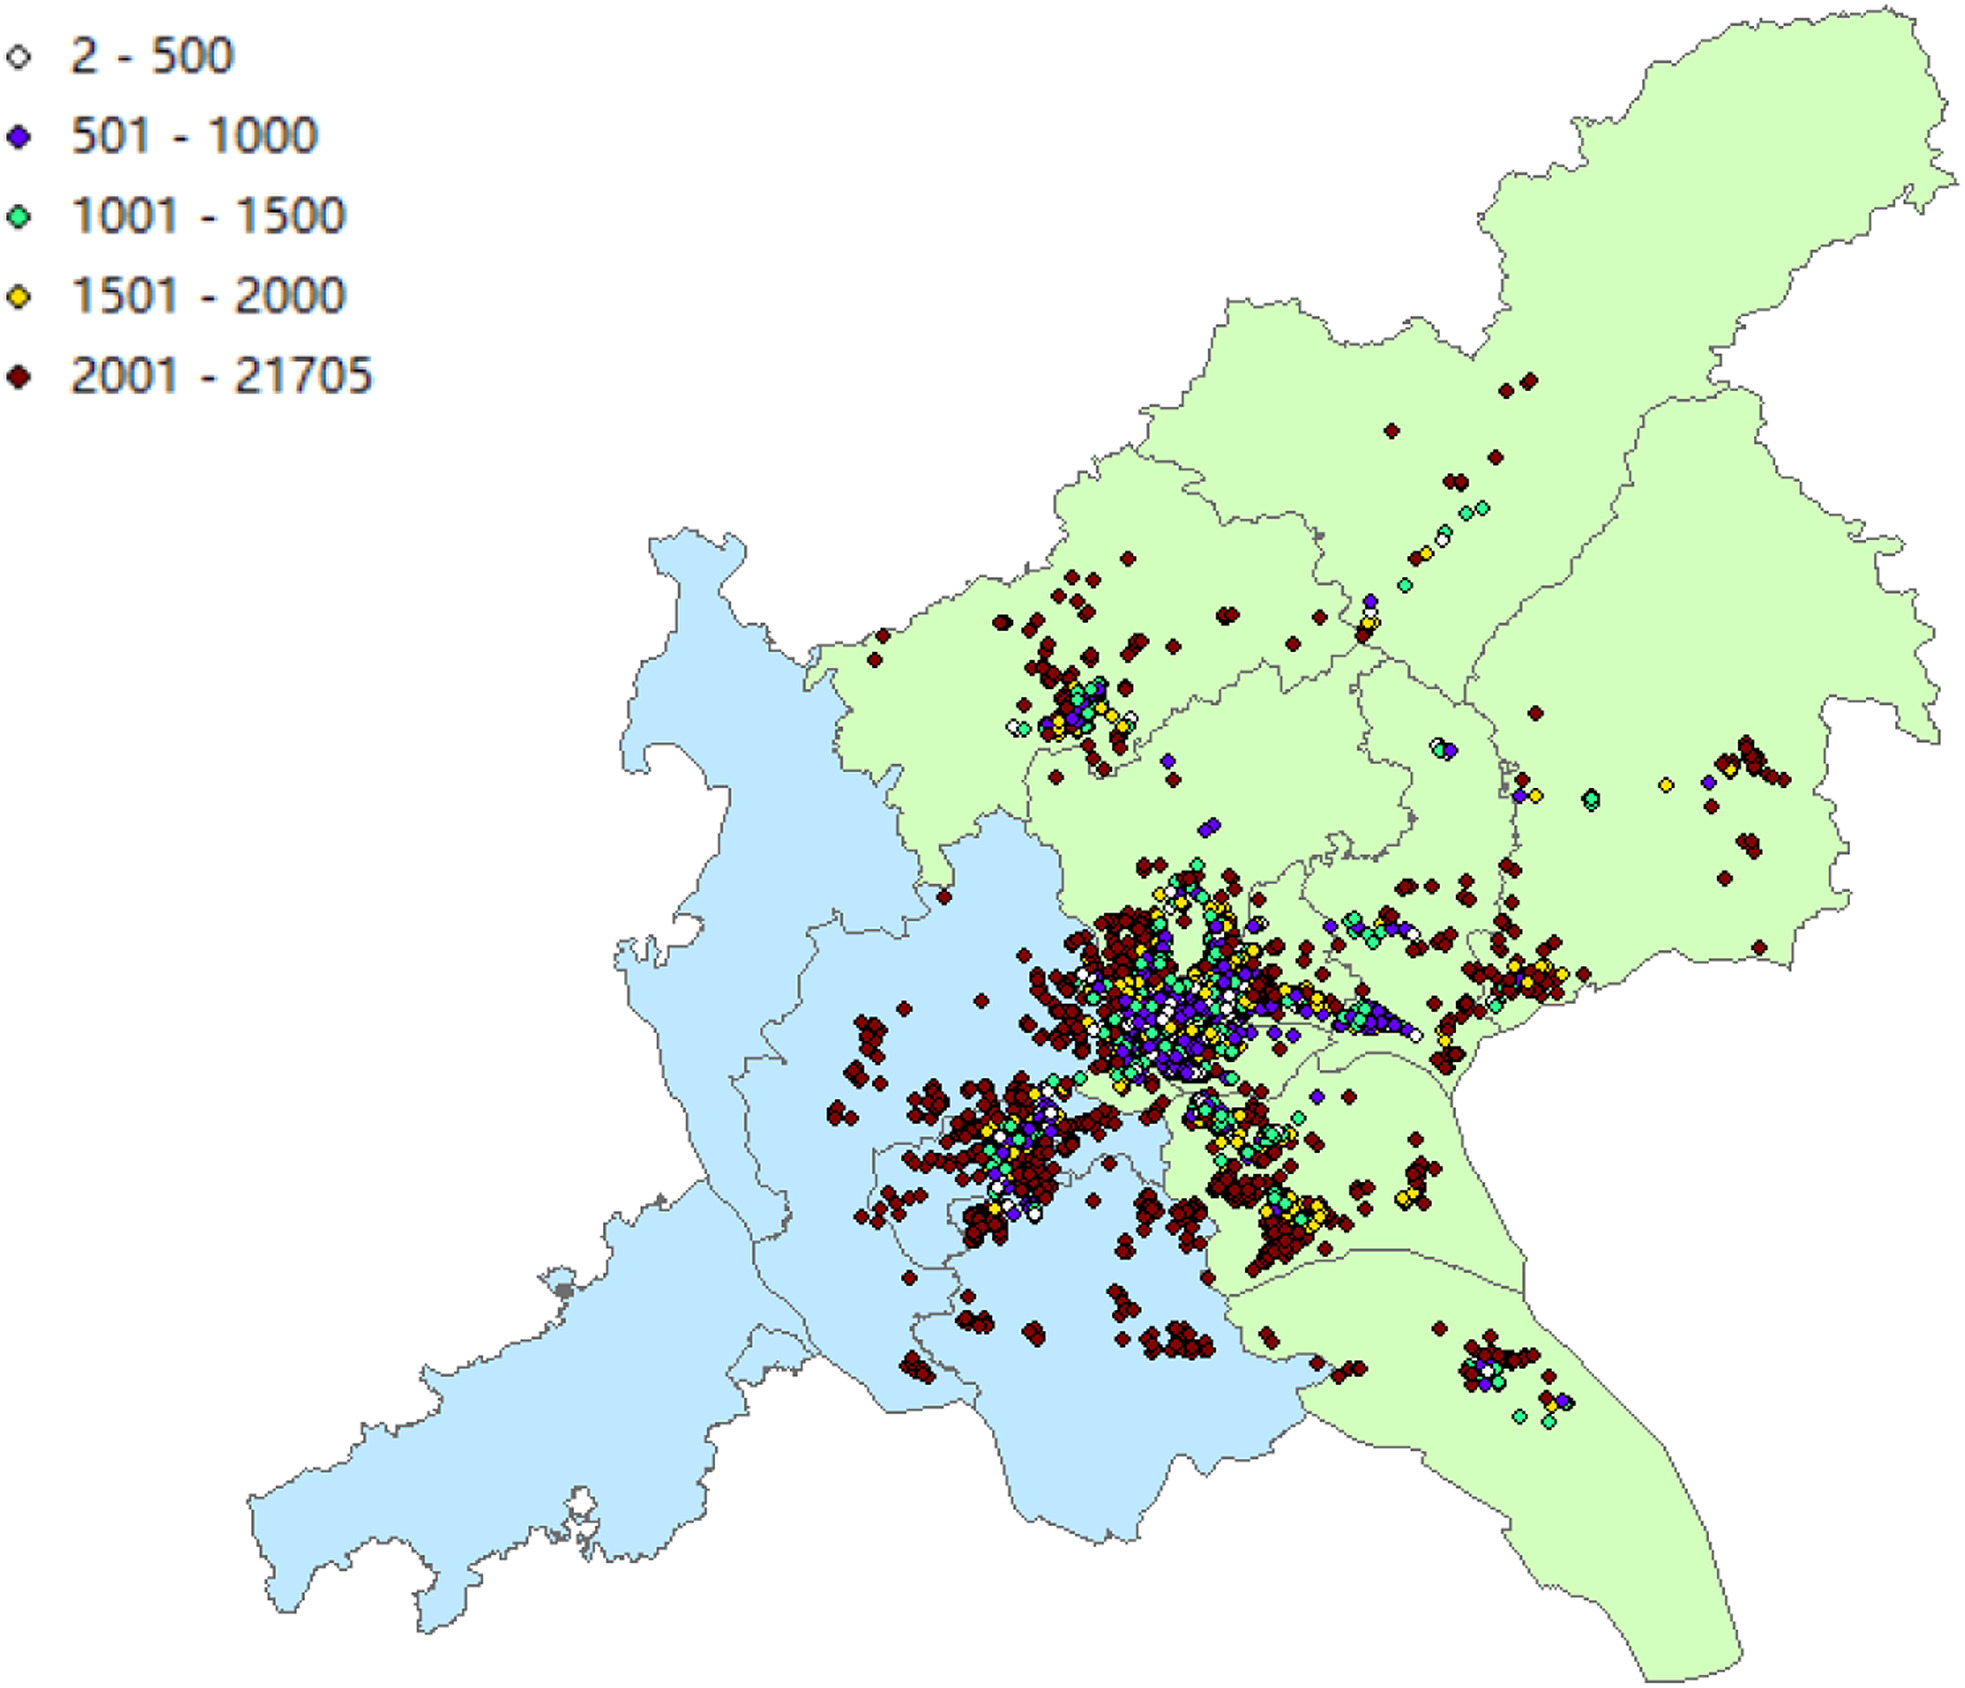
A total of 17,000 transaction records in these two cities were generated from Lianjia during 2018–2019. The coordinate information of the housing estates, primary schools, and metro line stations was collected from Amap. Additionally, point of interest (POI) information of the food and beverage shops, medicine shops, high-rise buildings, parks, and bus stops was collected from Amap. Finally, the price information of selected housing estates was linked to their coordinate information after data cleaning. Then, their distance to primary schools, metro line stations, POIs, and the CBD were calculated in ArcGIS 10.6 based on the WGS84 coordinate system. The accessibility to these facilities was then generated from ArcGIS. Each housing estate unit contains the following variables in Table 1. As the major concerned parameter, Fig. 3 visualizes the distance to metro line stations for each housing estate.
| Variable name | Description |
|---|---|
| Area (square meters) | The building area of this unit. |
| Room | The number of rooms in this unit. |
| Hall | The number of halls in this unit. |
| Washroom | The number of washrooms in this unit. |
| Kitchen | The number of kitchens in this unit. |
| South | Value 1 if this unit faces south, southeast, or southwest, otherwise 0. |
| Age (year) | The building age of this unit in the transaction record. |
| Lift | Value 1 if this unit is located in a building with a lift, otherwise 0. |
| High floor | Value 1 if this unit is located in the upper floor when the building has 11–20 floors; or located in the median or upper floor when the building has at least 21 floors, otherwise 0. |
| CCHI | The value of China City Housing Index in the month when this unit was transacted. This variable is adopted to explain the housing market changes during the whole sampling period. |
| Provincial_500/ City_500 | Value 1 if at least one Grade 1 primary school in provincial level or in city level is within 500 m from this housing estate in a beeline, otherwise 0. |
| Hospital_2000 | Value 1 if at least one 3A hospital is within 2,000 m from this housing estate, otherwise 0. |
| Station_500/ Station_1000/ Station_1500 | Value 1 if at least one station is within 500/ 500–1,000/1,000–1,500 m from this housing estate in a beeline, otherwise 0. |
| City Premium | Value 1 when the housing estate is located in Guangzhou, and 0 when it is located in Foshan. This term measures the city premium. |
| Sta_500/ Sta_1000/ Sta_1500 × city_p | The interaction terms in the aforementioned two types of variables. |
| Food_1000 | The number of catering shops which are located within 1,000 m from this housing estate. |
| Building_2000 | The number of high-rise buildings which are located within 2,000 m from this housing estate. |
| Bus_1000 | The number of bus stops which are located within 1,000 m from this housing estate. |
| Park_1000 | The number of parks which are located within 1,000 m from this housing estate. |
| Park_2000 | The number of parks which are located within 2,000 m from this housing estate. |
| Medicine_1000 | The number of medicine shops which are located within 1,000 m from this housing estate. |
| Time to CBD (minute) | The travel time from this housing estate to the Huacheng Road Station by metro line, including the walking time to a station. |
| Distance to CBD (meter) | The distance to Huacheng Square (in the center of Pearl River New Town, Tianhe District) in a beeline. |
Empirical Results
Stepwise Regression Results
As the independent variables are over 25, adopting the stepwise regression is necessary to determine which variables are kept or abandoned. Both the backward and forward stepwise regressions are conducted in the comparison on the whole market and two submarkets, and their results are very similar in each case. Table 2 only shows the backward stepwise regression results. Here, Model (1) belongs to the whole market. Model (2) belongs to the adjacent submarket. Model (3) belongs to the nonadjacent submarket. In all models, the property units located in Guangzhou all have higher price premiums (i.e., the city premium) than those located in Foshan. Although the Guangzhou–Foshan Metro Line has been completed for nearly ten years, the housing price increase caused by intercity commuting still does not shorten the city premium between Foshan and Guangzhou.
| Variable | (1) lnprice | (2) lnprice | (3) lnprice |
|---|---|---|---|
| CCHI | −0.0006* (0.0129) | −0.0004 (0.1685) | −0.0012*** (0.0002) |
| Area | 0.0112*** (0.0000) | 0.0106*** (0.0000) | 0.0112*** (0.0000) |
| Age | −0.0104*** (0.0000) | −0.0122*** (0.0000) | −0.0114*** (0.0000) |
| Room | 0.0693*** (0.0000) | 0.0849*** (0.0000) | 0.0687*** (0.0000) |
| Hall | 0.1470*** (0.0000) | 0.1458*** (0.0000) | 0.1532*** (0.0000) |
| Kitchen | 0.1324*** (0.0000) | 0.0755*** (0.0000) | 0.1364*** (0.0000) |
| Washroom | −0.0670*** (0.0000) | −0.0612*** (0.0000) | −0.0598*** (0.0000) |
| Lift | 0.1505*** (0.0000) | 0.1262*** (0.0000) | 0.1207*** (0.0000) |
| High_floor | 0.0486*** (0.0000) | 0.0331*** (0.0000) | 0.0487*** (0.0000) |
| Distance_to_CBD | −0.0000*** (0.0000) | −0.0000*** (0.0000) | −0.0000*** (0.0000) |
| Time_to_CBD | −0.0040*** (0.0000) | −0.0034*** (0.0000) | −0.0039*** (0.0000) |
| Provincial_500 | 0.0101 (0.0551) | ||
| City_500 | −0.0455*** (0.0000) | −0.0543*** (0.0000) | −0.0388*** (0.0000) |
| Hospital_2000 | 0.0572*** (0.0000) | 0.0640*** (0.0000) | 0.0340*** (0.0000) |
| Station_500 | 0.0958*** (0.0000) | 0.1299*** (0.0000) | 0.1255*** (0.0000) |
| Station_1000 | 0.0385** (0.0039) | 0.0604*** (0.0000) | 0.0601*** (0.0000) |
| Station_1500 | −0.0502** (0.0012) | −0.0300 (0.0513) | |
| City_premium | 0.3443*** (0.0000) | 0.3556*** (0.0000) | 0.4014*** (0.0000) |
| Sta500*City_p | −0.0417 (0.0934) | −0.0626** (0.0081) | |
| Sta1000*City_p | 0.0396** (0.0055) | ||
| Sta1500*City_p | 0.0897*** (0.0000) | 0.0385*** (0.0000) | 0.0638*** (0.0002) |
| Food_1000 | −0.0005*** (0.0003) | −0.0002* (0.0387) | |
| Building_2000 | 0.0012*** (0.0000) | −0.0003 (0.1478) | 0.0016*** (0.0000) |
| Bus_1000 | 0.0004*** (0.0003) | 0.0011*** (0.0000) | 0.0011*** (0.0000) |
| Park_1000 | −0.0130*** (0.0000) | −0.0154*** (0.0000) | −0.0068** (0.0024) |
| Park_2000 | 0.0109*** (0.0000) | −0.0019 (0.0992) | |
| Medicine_1000 | −0.0022*** (0.0000) | −0.0027*** (0.0000) | −0.0016*** (0.0000) |
| Constants | 13.5798*** (0.0000) | 13.5814*** (0.0000) | 13.6364*** (0.0000) |
| N | 17,968 | 11,433 | 10,386 |
| R-sq | 0.8416 | 0.8227 | 0.8748 |
| adj. R-sq | 0.8414 | 0.8223 | 0.8745 |
| AIC | −1,773.61 | −1,360.48 | −1,497.33 |
Note: p-values in parentheses.
Model (1) include the transaction in Guangzhou and Foshan. Model (2) include the transaction in Foshan and the districts adjacent to Foshan in Guangzhou.
Model (3) include the transaction in Foshan and the districts NOT adjacent to Foshan in Guangzhou.
*p < 0.05; **p < 0.01; and ***p < 0.001.
The regression coefficients of the China City Housing Index (CCHI) prove that the property market in Guangzhou and Foshan does not undergo substantial fluctuations during the sample period. Although negative coefficients are found in the whole market and the nonadjacent submarket, this phenomenon indicates that the increasing speed in these two markets is slower than the adjacent submarket. This data analysis has included the CCHI to control the influence of market trend on property values.
For the accessibility variables, the primary schools, hospitals, and POIs have covered most basic demands of daily life, such as education, health care, shopping, and catering. These factors are control variables. The adoption of these factors tends to demonstrate the accessibility to residents’ different kinds of living demands as much as possible in the POI database at that time. This scenario can minimize the disturbance to the estimation of city premium. The coefficients of these variables are consistent with common sense.
The distance to the metro line stations is divided into three intervals: the walking distance is within 500 m; between 500 and 1,000 m; and between 1,000 and 1,500 m. This study only discusses the distance to the metro line stations within 1,500 m because the residents have to take a 20-min walk for 1,500 m. A longer distance is usually not treated as an advantage on transportation.
In the comparison between Foshan and the whole market in Guangzhou or between Foshan and each submarket in Guangzhou, the influences of the walking distance to metro line stations are consistent in all three models. The largest positive impact appears within 500 m, followed by 500–1,000 m. In the range between 1,000 and 1,500 m, a negative impact is observed in the whole market only. No significant influence is detected in the two submarkets. The amount that residents are willing to pay for the accessibility to stations drops sharply as the distance increases. This phenomenon is the direct influence from the accessibility to metro line stations on housing prices.
Except for the aforementioned three variables, the significance of three interaction terms which describe the different impacts from the nearby metro line stations on property values in two cities is also tested. The signs of coefficients remain consistent among the three models, but not all the interaction terms are included in the stepwise regression models. For the distance within 500 m from the stations, the negative interactive impact is only found significantly in Model (3) and insignificantly in Model (2). Within 500–1,000 m, no significant impacts are detected for the two submarkets. When the distance is extended to 1,000–1,500 m from the stations, the interactive impacts become positive. Although the signs of the coefficients for these interactive terms are the same in the two submarkets, the values of these dummy variables are significantly different, which indicates that the division of adjacent submarket and nonadjacent submarket in Guangzhou is necessary.
The direct impacts from the metro line stations and the interaction terms between accessibility and city premium show opposite trends as the distance from the stations increases. The direct impacts are consistent with traditional opinions, which explain that people are willing to pay more for the accessibility to metro line stations. For the interaction terms, negative coefficients indicate that the accessibility to metro line stations bridges the gap of housing prices between Guangzhou and Foshan or a diffusion effect within 500 m from the stations. By contrast, positive coefficients support the fact that the accessibility to metro line stations enlarges the price difference between two cities or a polarization effect within 1,000–1,500 m from the stations. In the OLS models, both the diffusion effect and the polarization effect are larger in the nonadjacent submarket than in the adjacent submarket.
Spatial Model Results
To control the spatial correlation, the spatial error model (SEM) and spatial autoregressive model (SAR) are both adopted in these markets. The values of AIC in Table 3 suggest that the SEM is a more suitable choice. Most results on the accessibility to stations, city premium, and the interaction terms in these spatial models are consistent with those in the OLS models, including the signs of coefficients and the changing trend as the distance increases. A smaller distance to stations will provide a higher housing price premium. However, a lower price difference is also detected between two cities when the housing units are located closer to the stations. As the distance increases, the diffusion effect will turn to the polarization effect between housing units in two cities.
| Variable | Model (4) | Model (5) | Model (6) | Model (7) | Model (8) | Model (9) |
|---|---|---|---|---|---|---|
| CCHI | 0.0625*** (0.0000) | 0.0634*** (0.0000) | 0.0623*** (0.0000) | 0.0633*** (0.0000) | 0.0633*** (0.0000) | 0.0641*** (0.0000) |
| Area | 0.0120*** (0.0000) | 0.0121*** (0.0000) | 0.0115*** (0.0000) | 0.0115*** (0.0000) | 0.0116*** (0.0000) | 0.0117*** (0.0000) |
| Age | −0.0041*** (0.0000) | −0.0048*** (0.0000) | −0.0072*** (0.0000) | −0.0080*** (0.0000) | −0.0074*** (0.0000) | −0.0082*** (0.0000) |
| Room | 0.0639*** (0.0000) | 0.0561*** (0.0000) | 0.0844*** (0.0000) | 0.0753*** (0.0000) | 0.0773*** (0.0000) | 0.0700*** (0.0000) |
| Hall | 0.1768*** (0.0000) | 0.1772*** (0.0000) | 0.1932*** (0.0000) | 0.1915*** (0.0000) | 0.1712*** (0.0000) | 0.1705*** (0.0000) |
| Kitchen | 0.5101*** (0.0000) | 0.5114*** (0.0000) | 0.4155*** (0.0000) | 0.4182*** (0.0000) | 0.3963*** (0.0000) | 0.3948*** (0.0000) |
| Washroom | −0.0254* (0.0209) | −0.0167 (0.1332) | −0.0377** (0.0042) | −0.0271* (0.0421) | −0.0103 (0.4739) | −0.0053 (0.7137) |
| Lift | 0.1702*** (0.0000) | 0.1767*** (0.0000) | 0.1063*** (0.0000) | 0.1094*** (0.0000) | 0.1080*** (0.0000) | 0.1188*** (0.0000) |
| High_floor | 0.0983*** (0.0000) | 0.1035*** (0.0000) | 0.0837*** (0.0000) | 0.0846*** (0.0000) | 0.1153*** (0.0000) | 0.1234*** (0.0000) |
| Distance_to_CBD | −0.0000*** (0.0000) | −0.0000*** (0.0000) | −0.0000*** (0.0000) | −0.0000*** (0.0000) | −0.0000*** (0.0000) | −0.0000*** (0.0000) |
| Time_to_CBD | 0.0047*** (0.0000) | 0.0034*** (0.0000) | 0.0064*** (0.0000) | 0.0051*** (0.0000) | 0.0035*** (0.0000) | 0.0025*** (0.0000) |
| City_500 | −0.0459*** (0.0002) | −0.0420*** (0.0004) | −0.0171 (0.3370) | −0.0259 (0.1309) | −0.0647*** (0.0003) | −0.0606*** (0.0004) |
| Hospital_2000 | 0.1007*** (0.0000) | 0.0862*** (0.0000) | 0.0655*** (0.0000) | 0.0592*** (0.0000) | 0.0777*** (0.0000) | 0.0671*** (0.0000) |
| Station_500 | 0.1692*** (0.0007) | 0.1777*** (0.0003) | 0.1951*** (0.0001) | 0.2059*** (0.0000) | 0.1591** (0.0016) | 0.1602** (0.0012) |
| Station_1000 | −0.0396 (0.1844) | −0.0297 (0.3026) | −0.0110 (0.7145) | −0.0033 (0.9085) | −0.0513 (0.0930) | −0.0464 (0.1159) |
| Station_1500 | −0.1024** (0.0033) | −0.0839* (0.0125) | −0.0353 (0.3185) | −0.0168 (0.6231) | −0.1085** (0.0023) | −0.1035** (0.0027) |
| City_Premium | 0.6324*** (0.0000) | 0.5793*** (0.0000) | 0.6671*** (0.0000) | 0.6084*** (0.0000) | 0.6321*** (0.0000) | 0.5989*** (0.0000) |
| Sta500*City_p | −0.0630 (0.2261) | −0.0844 (0.0985) | −0.1116* (0.0454) | −0.1433** (0.0091) | −0.0780 (0.1536) | −0.0780 (0.1455) |
| Sta1000*City_p | 0.1201*** (0.0002) | 0.1066*** (0.0006) | 0.0553 (0.1122) | 0.0337 (0.3177) | 0.1337*** (0.0001) | 0.1396*** (0.0000) |
| Sta1500*City_p | 0.1426*** (0.0001) | 0.1189*** (0.0008) | 0.0826* (0.0318) | 0.0576 (0.1224) | 0.1554*** (0.0001) | 0.1484*** (0.0001) |
| Food_1000 | −0.0007*** (0.0001) | −0.0005** (0.0027) | −0.0016*** (0.0000) | −0.0013*** (0.0000) | −0.0009*** (0.0001) | −0.0005*** (0.0190) |
| Building_2000 | 0.0025*** (0.0000) | 0.0017*** (0.0000) | −0.0006 (0.1926) | −0.0009* (0.0488) | 0.0028*** (0.0000) | 0.0018*** (0.0000) |
| Bus_1000 | 0.0014*** (0.0000) | 0.0016*** (0.0000) | 0.0028*** (0.0000) | 0.0031*** (0.0000) | 0.0032*** (0.0000) | 0.0025*** (0.0000) |
| Park_1000 | −0.0147*** (0.0002) | −0.0163*** (0.0000) | −0.0224*** (0.0000) | −0.0240*** (0.0000) | −0.0105 (0.0511) | −0.0141** (0.0049) |
| Park_2000 | 0.0067*** (0.0001) | 0.0059*** (0.0003) | 0.0237*** (0.0000) | 0.0232*** (0.0000) | 0.0094*** (0.0006) | 0.0090*** (0.0004) |
| Medicine_1000 | 0.0009* (0.0352) | −0.0001 (0.7357) | 0.0017* (0.0219) | −0.0002 (0.8234) | 0.0015** (0.0045) | 0.0009 (0.0859) |
| lambda | 0.5000*** (0.0000) | 0.5080*** (0.0000) | 0.4800*** (0.0000) | |||
| rho | 0.0146*** (0.0000) | 0.0140*** (0.0000) | 0.0144*** (0.0000) | |||
| Log−likelihood | 6,754.869 | −6,861.03 | 4,248.464 | −4,334.03 | 3,969.915 | −4,019.1 |
| AIC | −13,455.7 | 13,776.06 | −8,442.93 | 8,722.06 | −7,885.83 | 8,092.2 |
Note: Models (4), (6), (8) are SEM results. Models (5), (7), (9) are SAR results.
Models (4), (5) include the transaction in Guangzhou and Foshan. Models (6), (7) include the transaction in Foshan and the districts adjacent to Foshan in Guangzhou.
Models (8), (9) include the transaction in Foshan and the districts NOT adjacent to Foshan in Guangzhou.
*p < 0.05; **p < 0.01; and ***p < 0.001.
Additionally, the geographically weighted regression (GWR) model is also attempted to investigate the local influence of the accessibility to the metro line stations within 1,500 m. To reduce the dummy variables in the GWR estimation, the accessibility to stations is replaced by the walking distance to stations, and the accessibilities to primary schools/ Grade 3A hospitals are replaced by the number of these facilities within a fixed distance. The rest of the variables are kept the same as the OLS model. Unfortunately, the reported AICc and R-square are much lower than those in the OLS model. Hence, the detailed results of coefficients are omitted in this study.
In general, the results in the OLS, SEM, and SAR models support that a weak diffusion effect is caused by the metro line networks for two markets in a close distance within 500 m. However, when the housing units are outside the range of 1,000 m from the stations, a strong polarization effect is detected between two markets. A weak polarization effect is found in the range of 500 and 1,000 m between two cities; however, some models report insignificant coefficients. Only when the residents can reach the stations within a 500-meter walk will they benefit from the diffusion effect from Guangzhou to Foshan. In most cases, the metro line network still enlarges the price difference between Guangzhou and Foshan.
This polarization effect suggests that compared with the urban regions in Foshan, most urban regions in Guangzhou are still more attractive for the labor force. Some factors which may affect the property values are not completely considered in the transaction dataset, such as entertainment facilities, small business districts, office buildings, and so on. The density of these facilities is still different between the two cities. Residents in Guangzhou still enjoy more services and goods than those in Foshan. Unfortunately, except for the office buildings that can be captured partially by the variable “Building_2000,” capturing the rest of the POIs is difficult in the dataset during 2018–2019. Moreover, the introduction of the regional specific fixed effect cannot substitute for these omitted facilities. Policies for residents in different districts within the same city are indeed the same. Prices and costs of services and goods are not affected by districts in which they are provided. Hence, residents may prefer a facility close to their home in another district than a facility far from their home in the same district. In other words, residents seldom consider the total number of facilities and the macroeconomic factors in a district to choose their home.
Additionally, the proportion of the tertiary industry in Guangzhou is ascending in 2008–2018. This tertiary industry will usually experience a polarization phenomenon and concentrate in large cities as the intercity high-speed railway develops (Dai et al. 2018; Shao et al. 2017). Hence, most opportunities in the tertiary industry also concentrate in Guangzhou. This potential is determined by the scale effect in the tertiary industry, as some service industries can only develop in large cities whose population is over a certain level. For the labor force in these areas, they have to live in Guangzhou to receive related industry and career information and achieve other opportunities. Some service industries have flexible working hours, which make it difficult for the workers to consider the intercity commute. Then, the related labor force has no opportunity to choose to live in Foshan. The limitation in these positions does not distract the housing demand of this part of the labor force from Guangzhou to Foshan but attracts more workers from nearby cities to look for better opportunities in the tertiary industry, which raise the housing demand in the central city. In contrast, the diffusion effect is limited within 500 m from the stations. Only those who can afford a property unit close to stations in Foshan can consider the intercity commute as a better choice than living in Guangzhou. The first and the second questions have been answered.
Additional Research in two Typical Cross Border Regions
For the third question, two typical regions around the Guangzhou–Foshan border are selected to compare the influence of the Guangzhou–Foshan Metro Line. These two regions are chosen from the employment and residence center in cross border regions based on mobile phone signaling data, which can track the population inflow and outflow at the commuting time (Li et al. 2020). One region is the Fangcun–Guicheng Region which is around the Guangzhou–Foshan Line, including the Fangcun Subdistrict (Liwan District) in Guangzhou and Guicheng Subdistrict (Nanhai District) in Foshan. The other region is the New Passenger Station Region, including the Dashi, Shawan, and Zhongcun Subdistricts (Panyu District) in Guangzhou; and Beijiao and Chencun Subdistricts (Shunde District) in Foshan. Similar stepwise regression analyses are conducted on the transaction records in these two regions (Table 4).
| Variable | (10) lnprice | (11) lnprice | (12) lnprice | (13) lnprice |
|---|---|---|---|---|
| CCHI | −0.0033* (0.0250) | −0.0027 (0.0712) | ||
| Area | 0.0061*** (0.0000) | 0.0063*** (0.0000) | 0.0105*** (0.0000) | 0.0105*** (0.0000) |
| Age | −0.0145*** (0.0000) | −0.0126*** (0.0001) | −0.0131*** (0.0000) | −0.0134*** (0.0000) |
| Room | 0.1724*** (0.0000) | 0.1554*** (0.0000) | 0.0709*** (0.0000) | 0.0711*** (0.0000) |
| Hall | 0.1344*** (0.0000) | 0.1479*** (0.0000) | 0.1278*** (0.0000) | 0.1300*** (0.0000) |
| Kitchen | 0.1031* (0.0410) | 0.1010* (0.0469) | ||
| Washroom | −0.0488* (0.0161) | −0.0428* (0.0345) | ||
| South | 0.0315 (0.1942) | |||
| Lift | 0.1558*** (0.0000) | 0.2064*** (0.0000) | 0.0465* (0.0306) | |
| High_floor | 0.0438* (0.0367) | |||
| Distance_to_CBD | <−0.0001*** (0.0000) | <−0.0001*** (0.0000) | <0.0001*** (0.0009) | <0.0001*** (0.0000) |
| Time_to_CBD | −0.0104* (0.0157) | |||
| Provincial_500 | −0.2030** (0.0023) | 0.0976** (0.0036) | 0.1059** (0.0019) | |
| City_500 | −0.1727* (0.0410) | 0.0636* (0.0201) | 0.0858** (0.0037) | |
| Hospital_2000 | −0.1384** (0.0032) | 0.0956* (0.0374) | ||
| station_500 | 0.2254*** (0.0000) | 0.1716** (0.0014) | ||
| Station_1000 | −0.0884 (0.1058) | 0.0920* (0.0257) | ||
| Station_1500 | −0.2398*** (0.0005) | 0.0741* (0.0122) | ||
| City_premium | 0.3457*** (0.0000) | 0.3217*** (0.0000) | ||
| Sta1000*City_p | 0.4884*** (0.0000) | 0.2100** (0.0026) | ||
| Sta1500*City_p | 0.2257* (0.0139) | |||
| food_1000 | −0.0004 (0.7726) | |||
| Bus_1000 | 0.0058 (0.0634) | 0.0063*** (0.0001) | 0.0095*** (0.0000) | |
| Building_2000 | 0.0071 (0.0539) | 0.0215*** (0.0000) | 0.0193*** (0.0000) | |
| Park_1000 | 0.0470* (0.0164) | 0.0244 (0.0721) | −0.0288* (0.0175) | −0.0391*** (0.0008) |
| Park_2000 | 0.0224* (0.0117) | 0.0257** (0.0082) | ||
| Medicine_1000 | −0.0077** (0.0011) | −0.0068*** (0.0000) | −0.0044 (0.0639) | |
| _cons | 14.6624*** (0.0000) | 15.0407*** (0.0000) | 12.4259*** (0.0000) | 12.3603*** (0.0000) |
| N | 170 | 170 | 607 | 607 |
| R-sq | 0.9386 | 0.9343 | 0.8280 | 0.8252 |
| adj. R-sq | 0.9317 | 0.9292 | 0.8221 | 0.8199 |
| AIC | −170.48 | −168.97 | −386.69 | −380.97 |
Note: p-values in parentheses.
Models (10), (12) are backward stepwise results. Models (11), (13) are forward stepwise results.
Models (10), (11) include the transaction in the Fangcun–Guicheng region. Models (12), (13) include the transaction in the New Passenger Station region.
*p < 0.05; ** p < 0.01; and *** p < 0.001
In the comparison within the Fangcun–Guicheng Region, the price premium caused by city difference disappears. The term of city premium is insignificant and excluded from the stepwise regressions. Only the accessibility to stations in the range of 500–1,500 m shows the positive impacts on property units between two cities. Although the housing price difference is not entirely eliminated, people do not consider living in Guangzhou and in Foshan as a significant different choice in this region. The price difference between two cities has been diminished by the intercity metro line.
In the comparison within the New Passenger Station Region, the part in Foshan excludes a metro line station. The price difference between two cities is significant at the 0.1% level. The part in Guangzhou belongs to the Panyu District, which is not even a downtown district. As another region along the Guangzhou–Foshan border, the coefficient of the city premium is in marked contrast to the Fangcun–Guicheng Region. Although the metro line network contributes to the polarization effect on nearby property units between the two cities, the lack of metro line service in Foshan will lead to a further difference in the cross border region between Guangzhou and Foshan.
Distinct from the case in multiple districts, the ranges of the Fangcun–Guicheng Region and that of the New Passenger Station are much smaller than an administrative district. In each region, only hundreds of transactions exist in two years. The accessibility to omitted facilities can be viewed nearly the same for all properties. The SEM and SAR results either record a negative log-likelihood value (i.e., a positive AIC) or insignificant spatial terms. Hence, they provide no better results than the OLS model. The OLS model can provide a reasonable approximation in these two regions.
According to the explanation in the work by Li et al. (2020), the population in the Fangcun–Guicheng Region tends to commute to Guangzhou as the intercity commuters. The intention to diversify the housing demand in Guangzhou through the construction of intercity metro lines is achieved in this region. The New Passenger Station region tends to promote the related industries as the transportation hub. When no intercity metro line is built to connect the part in Foshan, the transportation hub in the part in Guangzhou would only amplify the price difference in property markets between two cities. The regional integration in the Fangcun–Guicheng Region is the most successful case in the cross border regions between Guangzhou and Foshan (Li et al. 2020). This study further supports the previous opinion through the analysis of micro property markets and the partial integration between two cities (Ye 2014; Li et al. 2016; Lin and Wu 2019).
Conclusions
An intercity metro line which connects two or more prefecture-level cities has shortened the commute time for intercity workers, especially for residents who live in the noncore city and work in the core city. Hence, the existence of an intercity metro line should have some diffusion or polarization effects on the residential property markets in two adjacent cities.
This study adopts the second-hand transaction records in Lianjia and discusses the dominant effect (diffusion effect or polarization effect) promoted by the Guangzhou–Foshan Metro Line on the residential markets in two cities. Only three major urban districts, that is, the Chancheng, Shunde, and Nanhai Districts, are included as the sample regions in Foshan. The administrative districts in Guangzhou are separated as two submarkets based on whether the district is adjacent to the border between two cities. The comparison results based on the forward and backward stepwise regression models prove that significant city premiums exist between Guangzhou and Foshan and between each submarket and Foshan, even after the completion of the Guangzhou–Foshan Metro Line Phase 1 in 2010. To control the spatial relationship, the results of the spatial error model and spatial autoregressive model for these datasets are also examined, and the aforementioned phenomenon still holds. As one economic growth pole in Pearl River Delta, Guangzhou City continues to attract the people and capital resource in this region and keeps a significant city premium in the property market compared with Foshan.
The influence of the accessibility to a metro line station is generally limited in the range of 1,500 m by walking. In the comparisons between Guangzhou and Foshan and between each submarket and Foshan, the property units have different accessibility premiums to stations depending on the distance. For the direct impact, a housing unit within a smaller distance to stations would be more expensive than one within a larger distance when other conditions are fixed. For the interactive impact between accessibility and city premium, residents will only pay a smaller premium for two housing units within 500 m from stations in two cities, indicating a diffusion effect. However, residents will prefer to pay a larger premium for two housing units with 1,000–1,500 m from the stations in Guangzhou than in Foshan, indicating a polarization effect. The intercity metro line network can only bridge the price gap in a small region around the stations. In most cases, the housing price difference becomes even larger after an intercity metro line is constructed.
Additionally, this study compares the city premiums, the accessibility premiums to stations, and their interaction terms in the Fangcun–Guicheng and New Passenger Station Regions. In the Fangcun–Guicheng Region through which the Guangzhou–Foshan Line passes, the city premium and most accessibility premiums to stations become insignificant. As the most integrated regions in the border, the property markets in two cities are also merged through intercity commuting. For New Passenger Station region where no metro line passes through the part in Foshan, the city premium remains large. The development of a transportation hub cannot shorten the difference between two markets.
The above analysis results demonstrate the complicated influences on the two property markets from the intercity metro line. In general, the property market in the core city still has high city premium and benefits from the polarization effect. Only in the cross border region where the metro line crosses is the city premium diminished, as many intercity commuters take advantage of the convenient transportation conditions. Only a few regions have achieved the original target that the intercity metro line can promote the integration of the property markets in two cities.
This study can help the decision-makers understand the influence on local property markets after an intercity metro line is completed, especially for the developing countries where the intercity transportation network is expanding. Core cities would usually attract more housing demand from noncore cities and experience a polarization effect. Noncore cities would even lose some residents and have excessive housing supply. For properties in noncore cities, only the regions close to metro line stations will significantly appreciate. Policy makers should not expect the intercity transportation to balance the housing demand between core and noncore cities.
Data Availability Statement
Some or all data, models, or code that support the findings of this study are available from the corresponding author upon reasonable request.
Acknowledgments
This study is funded by National Natural Science Foundation of China (Youth Programme) (No. 42001177).
References
Agostini, C. A., and G. A. Palmucci. 2008. “The anticipated capitalisation effect of a new metro line on housing prices.” Fisc. Stud. 29 (2), 233–256. https://doi.org/10.1111/j.1475-5890.2008.00074.x.
Alexander, C., and M. Barrow. 1994. “Seasonality and cointegration of regional house prices in the UK.” Urban Stud. 31 (10): 1667–1689. https://doi.org/10.1080/00420989420081571.
Alquhtani, S., and A. Anjomani. 2019. “Do rail transit stations affect housing value changes? The Dallas Fort-Worth metropolitan area case and implications.” J. Trans. Geog. 79: 102463. https://doi.org/10.1016/j.jtrangeo.2019.102463.
Andersson, D. E., O. F. Shyr, and J. Fu. 2010. “Does high-speed rail accessibility influence residential property prices? Hedonic estimates from southern Taiwan.” J. Transp. Geogr. 18 (1): 166–174. https://doi.org/10.1016/j.jtrangeo.2008.10.012.
Bae, C.-H. C., M.-J. Jun, and H. Park. 2003. “The impact of Seoul's subway Line 5 on residential property values.” Transp. Policy 10 (2): 85–94. https://doi.org/10.1016/S0967-070X(02)00048-3.
Basu, S., and T. G. Thibodeau. 1998. “Analysis of spatial autocorrelation in house prices.” J. Real Estate Finance Econ. 17: 61–85. https://doi.org/10.1023/A:1007703229507.
Bowes, D. R., and K. R. Ihlanfeldt. 2001. “Identifying the impacts of rail transit stations on residential property values.” J. Urban Econ. 50 (1): 1–25. https://doi.org/10.1006/juec.2001.2214.
Camins-Esakov, J., and D. Vandegrift. 2018. “Impact of a light rail extension on residential property values.” Res. Transp. Econ. 67: 11–18. https://doi.org/10.1016/j.retrec.2017.04.004.
Chang, Z., and M. Diao. 2022. “Inter-city transport infrastructure and intra-city housing markets: Estimating the redistribution effect of high-speed rail in Shenzhen, China.” Urban Stud. 59 (4): 870–889. https://doi.org/10.1177/00420980211017811.
Chen, Z., and K. E. Haynes. 2015. “Impact of high speed rail on housing values: An observation from the Beijing–Shanghai line.” J. Transp. Geogr. 43: 91–100. https://doi.org/10.1016/j.jtrangeo.2015.01.012.
Choy, L. H. T, S. W. K. Mak, and W. K. O. Ho, 2007. “Modeling Hong Kong real estate prices.” J. Housing Built Environ. 22 (4), 359–368. https://doi.org/10.1007/s10901-007-9089-2.
Dai, X., X. Bai, and M. Xu. 2016. “The influence of Beijing rail transfer stations on surrounding housing prices.” Habitat Int. 55: 79–88. https://doi.org/10.1016/j.habitatint.2016.02.008.
Dai, X., M. Xu, and N. Wang. 2018. “The industrial impact of the Beijing-Shanghai high-speed rail.” Travel Behav. Soc. 12: 23–29. https://doi.org/10.1016/j.tbs.2018.03.002.
Ding, R., and P. Ni. 2015. “Regional spatial linkage and spillover effect of house prices of China’s cities.” [In Chinese.] Finance Trade Econ. 403 (6): 136–150. https://doi.org/10.19795/j.cnki.cn11-1166/f.2015.06.012.
Duncan, M. 2011. “The impact of transit-oriented development on housing prices in San Diego, CA.” Urban Stud. 48 (1): 101–127. https://doi.org/10.1177/0042098009359958.
Haynes, K. E. 1997. “Labor markets and regional transportation improvements: the case of high-speed trains An introduction and review: An introduction and review.” Ann. Reg. Sci. 31: 57–76. https://doi.org/10.1007/s001680050039.
Hess, D. B., and T. M. Almeida. 2007. “Impact of proximity to light rail rapid transit on station-area property values in Buffalo, New York.” Urban Stud. 44 (5–6): 1041–1068. https://doi.org/10.1080/00420980701256005.
Hong, G., and X. Li. 2011. “Border effect of inner city: Research based on spatial spillover of real estate price.” [In Chinese.] Acta Geogr. Sin. 66 (4): 468–476. https://doi.org/10.11821/xb201104004.
Holly, S., M. H. Pesaran, and T. Yamagata. 2010. “A spatio-temporal model of house prices in the USA.” J. Econom. 158 (1): 160–173. https://doi.org/10.1016/j.jeconom.2010.03.040.
Holmans, A. E. 1990. House prices: Changes through time at national and sub-national level. London: Dept. of the Environment.
Huang, J., Q. Zhou, and Z. Wu. 2016. “Delineating urban fringe area by land cover information entropy—An empirical study of Guangzhou-foshan metropolitan area, China.” ISPRS Int. J. Geo-Inf. 5 (5): 59. https://doi.org/10.3390/ijgi5050059.
Hui, E. C. M., C. K. Chau, L. Pun, and M. Y. Law. 2007. “Measuring the neighboring and environmental effects on residential property value: Using spatial weighting matrix.” Build. Environ. 42: 2333–2343. https://doi.org/10.1016/j.buildenv.2006.05.004.
John, B., and G. S. Sirmans. 1996. “Mass transportation, apartment rent and property values.” J. Real Estate Res. 12 (1): 1–8. https://doi.org/10.1080/10835547.1996.12090830.
Kim, J., and M. Zhang. 2005. “Determining transit’s impact on Seoul commercial land values: An application of spatial econometrics.” Int. Real Estate Rev. 8 (1): 1–26. https://doi.org/10.53383/100058.
Kim, K., and M. L. Lahr. 2013. “The impact of hudson-bergen light rail on residential property appreciation.” Pap. Reg. Sci. 93 (1): S79–S97.
Landis, J., S. Guhathakurta, W. Huang, M. Zhang, and B. Fukuji. 1995. Rail transit investments, real estate values, and land use change: A comparative analysis of five California rail transit systems. IURD Monograph Series. Berkeley: The Institute of Urban and Regional Development, University of California.
Lesage, J. P. 1999. “Applied econometrics using MATLAB.” Online publication. Accessed August 22, 2023. https://www.researchgate.net/publication/266455497_Applied_Econometrics_using_MATLAB.
Li, F., J. Zhong, S. Xie, and X. Li. 2016. “Modeling urban population densities in city integration areas: A case study of Guangzhou and Foshan.” [In Chinese.] Trop. Geogr. 36 (4): 600–609. https://doi.org/10.13284/j.cnki.rddl.002866.
Li, S., L. Chen, and P. Zhao. 2019. “The impact of metro services on housing prices: A case study from Beijing.” Transportation 46 (4): 1291–1317. https://doi.org/10.1007/s11116-017-9834-7.
Li, S., X. Liu, Z. Li, Z. Wu, Z. Yan, Y. Chen, and F. Gao. 2018. “Spatial and temporal dynamics of urban expansion along the Guangzhou–Foshan inter-city rail transit corridor, China.” Sustainability 10 (3): 593. https://doi.org/10.3390/su10030593.
Li, Y. 2015. “Impacts of high speed railway station on non-metropolitan cities in China: A case study of Wuhan-Guangzhou line.” Master's thesis, Faculty of Architecture, Planning and Preservation, Columbia Univ.
Li, Y., T. Chen, X. Li, W. Xu, and W. Lang. 2020. “Identification and patterns of employment and residential centers in a cross-border region based on mobile phone signaling data: A case study of Guangzhou and foshan.” [In Chinese.] Trop. Geogr. 40 (2): 206–216. https://doi.org/10.13284/j.cnki.rddl.003211.
Liang, Q., L. Kong, and W. Deng. 2007. “Impact of URT on real estate value: The case of Beijing metro line 13.” [In Chinese.] Econ. Geogr. 40: 98–103.
Lin, J., and W. Wu. 2019. “Investigating the land use characteristics of urban integration based on remote sensing data: Experience from Guangzhou and Foshan.” Geocarto Int. 34 (14): 1608–1620. https://doi.org/10.1080/10106049.2018.1506505.
Liu, S. Q., J. Guo, R. X. Li, and L. I. Q. 2014. “Analysis of land use around typical rail transport stations in Beijing.” [In Chinese.] Urban Dev. Stud. 21 (4): 66–71.
Liu, X., H. Zhang, and Y. Cheng. 2018. “The impact of high-speed railway on the price of urban real estste- A study based on the difference-in-difference model.” [In Chinese.] Inq. Econ. Issues 39 (8): 28–38.
Lu, J., J. Song, Y. Liang, and J. Xu. 2013. “The simulation of spatial distribution patterns of China’s HSR-economic zones based on the 2D time-space map.” [In Chinese.] Acta Geographica Sinica 68 (2): 147–158. https://doi.org/10.11821/xb201302001.
Luo, Z. Q., C. Liu, and D. Picken. 2007. “Housing price diffusion pattern of Australia's state capital cities.” Int. J. Strategic Property Manage. 11 (4): 227–242. https://doi.org/10.3846/1648715X.2007.9637571.
MacDonald, R., and M. P. Taylor. 1993. “Regional house prices in Britain: Long-run relationships and short-run dynamics.” Scott. J. Political Econ. 40 (1): 43–55. https://doi.org/10.1111/j.1467-9485.1993.tb00636.x.
Meen, G. 1996. “Spatial aggregation, spatial dependence and predictability in the UK housing market.” Housing Stud. 11 (3): 345–372. https://doi.org/10.1080/02673039608720862.
Meen, G. 1999. “Regional house prices and the ripple effect: A new interpretation.” Housing Stud. 14 (6): 733–753. https://doi.org/10.1080/02673039982524.
Militino, A. F., M. D. Ugarte, and L. Garcia-Reinaldos. 2004. “Alternative models for describing spatial dependence among dwelling selling prices.” J. Real Estate Fin. Econ. 29: 193–209. https://doi.org/10.1023/B:REAL.0000035310.20223.e9.
Monzón, A., E. Ortega, and E. López. 2013. “Efficiency and spatial equity impacts of high-speed rail extensions in urban areas.” Cities 30: 18–30. https://doi.org/10.1016/j.cities.2011.11.002.
Munoz-Raskin, R. C. 2007. Walking accessibility to bus rapid transit in Latin America: Does it affect property values? The case of Bogotá, Colombia. Washington DC: Transportation Research Board.
Pace, R. K., and R. Barry. 1997. “Quick computation of spatial autoregressive estimators.” Geogr. Anal. 29 (3): 232–247. https://doi.org/10.1111/j.1538-4632.1997.tb00959.x.
Pan, Q., H. Pan, M. Zhang, and B. Zhong. 2014. “Effects of rail transit on residential property values: Comparison study on the rail transit lines in Houston, Texas, and Shanghai, China.” Trans. Res. Rec. 2453 (1): 118–127. https://doi.org/10.3141/2453-15.
Qin, C., N. Huo, and Z. Chong. 2015. “Intercity rail transit and integrated development of the pearl river delta urban cluster: Based on the perspective of network analysis.” Chin. J. Urban Environ. Stud. 3 (3): 1–15. https://doi.org/10.1142/S2345748115500244.
Ratner, K. A., and A. R. Goetz. 2013. “The reshaping of land use and urban form in Denver through transit-oriented development.” Cities 30: 31–46. https://doi.org/10.1016/j.cities.2012.08.007.
Rosen, S. 1974. “Hedonic prices and implicit markets: Product differentiation in pure competition.” J. Polit. Econ. 82: 34–55. https://doi.org/10.1086/260169.
Shi, S., M. Young, and B. Hargreaves. 2009. “The ripple effect of local house price movements in New Zealand.” J. Property Res. 26 (1): 1–24. https://doi.org/10.1080/09599910903289880.
Shao, S., Z. Tian, and L. Yang. 2017. “High speed rail and urban service industry agglomeration: Evidence from China's Yangtze River Delta region.” J. Trans. Geog. 64: 174–183. https://doi.org/10.1016/j.jtrangeo.2017.08.019.
Sung, H., and J.-T. Oh. 2011. “Transit-oriented development in a high-density city: Identifying its association with transit ridership in Seoul, Korea.” Cities 28 (1): 70–82. https://doi.org/10.1016/j.cities.2010.09.004.
Tan, Z., S. Li, X. Li, X. Liu, Y. Chen, and W. Li. 2017. “Spatio-temporal effects of urban rail transit on complex land-use change.” [In Chinese.] Acta Geogr. Sinica 72: 850–862. https://doi.org/10.11821/dlxb201705007.
Tse, R. Y. C. 2002. “Estimating neighbourhood effects in house prices: Towards a new hedonic model approach.” Urban Stud. 39 (7): 1165–1180. https://doi.org/10.1080/00420980220135545.
Wagner, G. A., T. Komarek, and J. Martin. 2017. “Is the light rail “Tide” lifting property values? Evidence from Hampton Roads, VA.” Reg. Sci. Urban Econ. 65: 25–37. https://doi.org/10.1016/j.regsciurbeco.2017.03.008.
Wang, F., X. Wei, J. Liu, L. He, and M. Gao. 2019. “Impact of high-speed rail on population mobility and urbanisation: A case study on Yangtze River Delta urban agglomeration, China.” Transp. Res. Part A Policy Pract. 127: 99–114. https://doi.org/10.1016/j.tra.2019.06.018.
Xu, T., M. Zhang, and P. T. Aditjandra. 2016. “The impact of urban rail transit on commercial property value: New evidence from Wuhan, China.” Trans. Res. Part A: Policy Pract. 91: 223–235. https://doi.org/10.1016/j.tra.2016.06.026.
Yan, S., E. Delmelle, and M. Duncan. 2012. “The impact of a new light rail system on single-family property values in Charlotte, North Carolina.” J. Trans. Land Use 5 (2): 60–67. https://doi.org/10.5198/jtlu.v5i2.261.
Yang, J., X. Lin, and Y. Xie. 2015. “Intercity transportation planning in China: Case of the Guangzhou–Foshan metropolitan area.” Urban Plann. Int. 30 (4): 101–108. https://doi.org/10.3141/2512-09.
Ye, L. 2014. “State-led metropolitan governance in China: Making integrated city regions.” Cities 41: 200–208. https://doi.org/10.1016/j.cities.2014.03.001.
Zhang, J., and Y. Zhang. 2018. “Research on the impact of high-speed railway construction on urban housing price-Take the Wuhan-Guangzhou high-speed railway as an example.” [In Chinese.] Price: Theory Pract. 7: 139–142. https://doi.org/10.19851/j.cnki.cn11-1010/f.2018.07.035.
Zhang, X., X. Liu, J. Hang, D. Yao, and G. Shi. 2016. “Do urban rail transit facilities affect housing prices? Evidence from China.” Sustainability 8 (4): 380. https://doi.org/10.3390/su8040380.
Zhong, H., and W. Li. 2016. “Rail transit investment and property values: An old tale retold.” Transp. Policy 51: 33–48. https://doi.org/10.1016/j.tranpol.2016.05.007.
Information & Authors
Information
Published In
Journal of Urban Planning and Development
Volume 149 • Issue 4 • December 2023
Copyright
This work is made available under the terms of the Creative Commons Attribution 4.0 International license, https://creativecommons.org/licenses/by/4.0/.
History
Received: Jul 25, 2022
Accepted: Jun 26, 2023
Published online: Sep 12, 2023
Published in print: Dec 1, 2023
Discussion open until: Feb 12, 2024
ASCE Technical Topics:
- Buildings
- Business management
- Commute
- Contracts and subcontracts
- Infrastructure
- Interurban travel
- Practice and Profession
- Pricing
- Rail transportation
- Residential buildings
- Structural engineering
- Structures (by type)
- Subways
- Traffic engineering
- Transportation engineering
- Travel modes
- Urban and regional development
- Urban areas
Authors
Metrics & Citations
Metrics
Citations
Download citation
If you have the appropriate software installed, you can download article citation data to the citation manager of your choice. Simply select your manager software from the list below and click Download.