Commercial Building Recovery Methodology for Use in Community Resilience Modeling
Abstract
Commercial businesses in an area affected by a natural hazard can have significant interruption and disruption because of damage and impeding factors including financing delays. The recovery of commercial buildings is a necessary but not solely sufficient condition for owners to reopen their businesses. At the community-level modeling scale for planning, the ability to model commercial recovery across the entire community, including short-term business operation disruption, is critical to understanding the interdependent recovery across engineering, economics, and social science. This study proposes a probabilistic commercial building recovery model to predict the recovery of commercial buildings over time following a hazard event and considers two critical types of downtime: (1) impeding factors such as financing delays, and (2) the repair process. A typical recovery resource portfolio available to business owners was developed and quantitatively incorporated into the proposed probabilistic commercial building recovery model. The ability to model commercial building recovery will inform decision makers of the entire recovery process for upcoming business recovery and community resilience metrics related to physical services stability, thereby improving community resilience planning.
Introduction
Community resilience modeling requires the analyst to model the physical infrastructure, social institutions, households, and the economy. Key to the resilience modeling process and related planning for decision support is the ability to model interdependent recovery, which includes the recovery of commercial businesses. The number of operational or recovered businesses in a hazard-affected area is one of the most important metrics toward this end (e.g., Marshall and Schrank 2014; Stevenson et al. 2018; Xiao and Van Zandt 2012). However, business recovery following natural hazard events is a complex process (e.g., Aghababaei et al. 2021), which depends on many factors (Zhang et al. 2009), such as physical property damage (Yang et al. 2016), loss of utility services (e.g., Dahlhamer and Tierney 1998), supplier disruption (e.g., Lee 2019), mitigation strategies employed by business owners such as the existence of an emergency plan (e.g., Xiao and Peacock 2014), and the use of backup technologies and resources (e.g., Cremen et al. 2020), as well as on ecological and socioeconomic factors (e.g., Dietch and Corey 2011; Dahlhamer and Tierney 1998).
Some businesses are highly vulnerable to physical damage to the building and interior contents and inventory, including retail stores, service businesses, and hotels, due to their reliance on physical premises for walk-in customers, product storage, and specialized equipment (Lee 2019). In addition, physical property damage affects the approach a business utilizes to finance its building recovery (Watson 2021; Lee 2019). Property damage can lead to a vicious cycle in business recovery (Watson 2021), where the resulting downtime leads to lost revenue, which reduces resources that are needed for repair, and can also make incurring debt from recovery loans more hazardous as time increases postdisaster (Dahlhamer and Tierney 1998). Prolonged business closure is then interdependent with overall community recovery (Watson et al. 2020b; Xiao and Van Zandt 2012). Employees lose work and dislocate due to damaged homes, and customers go elsewhere for goods and services and may not return when the business does reopen (Alesch et al. 2001).
Over the last several decades, quantitative analyses of impeding factors impacting business recovery have mainly focused on empirical analysis and regression analysis (e.g., Corey and Deitch 2011), such as logistic regression (e.g., Dahlhamer and Tierney 1998; Khan and Sayem 2013; Orhan 2016; Wasileski et al. 2011) and probit regression (e.g., Lee 2019; Torres et al. 2019; McDonald et al. 2014). The data for these analyses are often based on survey methods, which collect business population information on company/industry type, franchise status, and number of employees, and postevent information on business operational status, property damage dollars, financing arrangements, and government aid (e.g., Cremen et al. 2020; Lee 2019; Corey and Deitch 2011). However, despite long-term recovery of businesses after disaster events depending on both the recovery of commercial buildings as well as the recovery of households as customers and employees (Watson et al. 2020b; Xiao and Van Zandt 2012), limited previous studies performed a probabilistic quantitative analysis of commercial buildings’ recovery as an essential input for business recovery.
Furthermore, planning for and implementing recovery activities requires funding resources from public, private, and semiprivate entities. Understanding the types and amounts of resources available to business owners is critical to identifying how alternative funding sources impact the postevent business recovery process. Given the multiscale and multiagency nature of different management systems, many challenges are associated with tracking resilience resources. Therefore, real-world funding resource data used for community resilience–related research in previous studies are relatively scarce (e.g., Karamouz et al. 2018; Salignac et al. 2019).
In order to more accurately track resilience resources, an iterative combination of approaches is appropriate. A top-down analysis of federal budgets and domestic assistance acts as a scoping review of types of disaster programs, their funding mechanisms, and their eligible recipients (Watson et al. 2020a). From there, content analysis of all documents related to the identified funding streams can track the management, amount, and timing of funds from their appropriation to final disbursement (Berd and Watson 2020). Individual case studies and survey data can then illustrate how programs are translated in real-world events, which businesses receive assistance, the types of local programs implemented, and how recovery is financed at the individual business level. The collected resilience resources for case communities can be integrated as a resilience resource portfolio, including different financing resources available to business owners, and then integrated into the probabilistic commercial building recovery modeling.
The study presented in this paper develops a probabilistic commercial building recovery model to enable business recovery modeling to be integrated into a broader community resilience model. Downtime because of delays and repairs are two critical steps for the proposed model. A typical recovery resource portfolio for business owners was developed using the proposed methodology and using survey data from Galveston, Texas, following Hurricane Ike in 2008 for a case community. The expected financing methodologies for business owners to repair their commercial buildings were identified based on the recovery resource portfolio and the estimated financial loss for damaged commercial buildings. The proposed financing methodologies enabled the probabilistic commercial building recovery model to directly link one of the significant delay impeding factors, financing delay, to commercial building damage states with other impeding factors resulting in delay, as explained subsequently.
The probabilistic commercial building recovery models proposed in this study can model the recovery for each commercial building in a community-level model following a hazard event. The novelties of this study are (1) the development of a commercial building recovery model with the ability to fully propagate uncertainty for business recovery modeling; and (2) the integration of postdisaster funding resources into a quantitative probabilistic analysis for community resilience assessment to track commercial building recovery.
Commercial Building Recovery Model
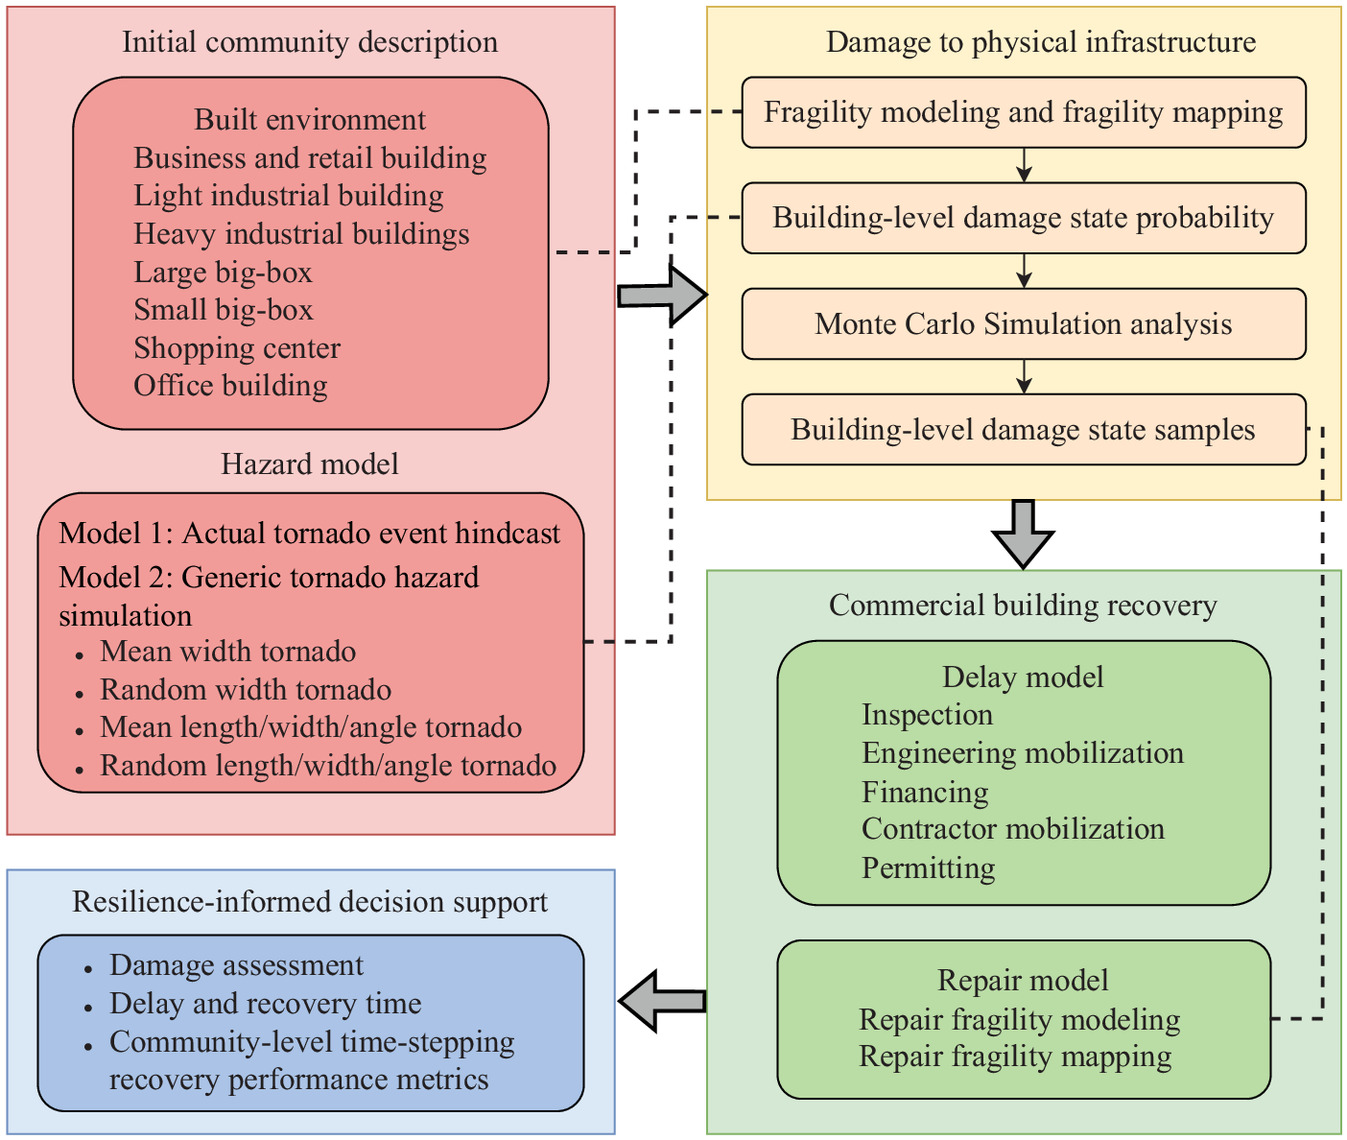
Table 1 presents the building portfolio developed for wind-induced events (Memari et al. 2018), and buildings can be grouped by residential, commercial, and so on, according to their occupancy classifications. This paper focuses on the recovery of commercial buildings. Fig. 1 shows the conceptual framework of the commercial building recovery model proposed in this study. The preliminary step to implementing the commercial building recovery model is to first produce the building damage results determined from fragility-driven damage models and Monte Carlo simulation (MCS) (Wang et al. 2021, 2022a; Pang and Wang 2021). The fragility-driven damage models of the community buildings used in this study were determined by component-level and further building-level reliability analysis, where the statistics of the building component resistance were referenced from previous extensive literature (Koliou et al. 2017; Memari et al. 2018). The methodology can use both actual tornado event hindcast and idealized tornado models (Standohar-Alfano and van de Lindt 2015; Attary et al. 2018) developed based on the gradient technique from historical tornado reports as hazard models but is not provided herein for brevity. However, the hazard models can be expanded to a general sense for any hazard events (Wang and van de Lindt 2021; Lin and Wang 2017).
| Archetypes | Building description | Occupancy classification |
|---|---|---|
| T1 | Residential wood building, small rectangular plan, gable roof, 1 story | Residential |
| T2 | Residential wood building, small square plan, gable roof, 2 stories | Residential |
| T3 | Residential wood building, medium rectangular plan, gable roof, 1 story | Residential |
| T4 | Residential wood building, medium rectangular plan, hip roof, 2 stories | Residential |
| T5 | Residential wood building, large rectangular plan, gable roof, 2 stories | Residential |
| T6 | Business and retail building (strip mall) | Commercial |
| T7 | Light industrial building | Commercial |
| T8 | Heavy industrial building | Commercial |
| T9 | Elementary/middle school (unreinforced masonry) | Social institutions |
| T10 | High school (reinforced masonry) | Social institutions |
| T11 | Fire/police station | Social institutions |
| T12 | Hospital | Social institutions |
| T13 | Community center/church | Social institutions |
| T14 | Government building | Social institutions |
| T15 | Large big-box store | Commercial |
| T16 | Small big-box store | Commercial |
| T17 | Mobile home | Residential |
| T18 | Shopping center | Commercial |
| T19 | Office building | Commercial |
More specifically, most delay-impeding factors, except financial delay, in the delay module described subsequently are assumed to be widely applicable to determine the time needed for any hazard-induced commercial buildings that will experience various delays to initiate the repair. This is mainly due to the lack of any available data and thus may be able to be improved upon over the decades with the data revolution in full progress. Financial delay needs to depend on the funding resources that homeowners, business owners, and others can access for a specific hazard. The main difference by hazard is not in the delays or impeding factors, but in the repair portion of the analysis which needs to be applied by having a full set of building repair fragility functions for a specific hazard event (e.g., earthquakes, tornadoes, or floods).
Delay Module
FEMA developed a seismic performance assessment methodology for buildings that combined earthquake hazard assessment, structural response, damage estimation, and cost estimation (e.g., repair cost and repair time) of individual buildings [FEMA P-58-1 (FEMA 2018)]. Upon this methodology, the resilience-based earthquake design initiative (REDi) downtime assessment framework was developed by Arup (2017) to convert repair times from a FEMA P-58-1 assessment into building downtime through consideration of delays to the initiation of repairs and milestones along the path to full recovery of a building (Paul et al. 2018). Several delays can occur and impede the ability to initiate repairs. This commercial building recovery model considered typical impeding factors, which include inspection, engineering mobilization, financing, contractor mobilization, and permitting following the methodology of the REDi framework (Almufti and Willford 2013). Arup developed the impeding factors in the REDi downtime assessment framework based on information provided by experts in various fields (including engineers, building owners, contractors, cost estimators, and bankers) and data collected from reconnaissance efforts in previous major disasters (Almufti and Willford 2013; Arup 2017).
The impeding factors calculated based on earthquake events and then expanded to any hazard events are presented in the form of lognormal cumulative distribution functions and have a relatively high degree of uncertainty, as illustrated in Table 2. Delay impeding factors were assumed to follow the delay phases introduced by Lin and Wang (2017). Wang and van de Lindt (2021) have given more details about the description of each impeding factor and the approach to assembling all impeding factors and determining the modeled delay time.
| Sequence | Delay time impeding factor | Building specific conditions | Median | Standard deviation | Distribution |
|---|---|---|---|---|---|
| Delay Phase 1 | Inspection | Slight | 0 | 0 | Lognormal |
| Above slight | 0.5 | 0.54 | Lognormal | ||
| Delay Phase 2 | Engineering mobilization and review/redesign | Slight | 6 | 0.40 | Lognormal |
| Moderate/extensive | 12 | 0.40 | Lognormal | ||
| Complete | 50 | 0.32 | Lognormal | ||
| Financing | Personal savings/business revenue | 1 | 0.54 | Lognormal | |
| Commercial property insurance | 6 | 1.11 | Lognormal | ||
| US SBA physical disaster loans | 28.1 | 20.9 | Normal | ||
| US SBA EIDL | 19.3 | 9.7 | Normal | ||
| US EDA revolving loan fund | 163.6 | 34.4 | Normal | ||
| US HUD CDBG-DR loan | 146.9 | 2.7 within 2 months | Normal | ||
| Local recovery program | 33.7 | 8.0 within 6 months | Normal | ||
| Bank bridge loans | 7.7 | 4.0 within 3 months | Normal | ||
| Other | 48 | 0.65 | Lognormal | ||
| Contractor mobilization | Slight | 7 | 0.60 | Lognormal | |
| Above slight | 19 | 0.38 | Lognormal | ||
| Delay Phase 3 | Permitting | Slight | 1 | 0.86 | Lognormal |
| Above slight | 8 | 0.32 | Lognormal |
Unlike other impeding factors such as inspection and permitting, which are directly related to building-specific conditions after an event (Lin and Wang 2017), financing delay depends on the funding resource that the owners of each building can procure. For residential structures damaged by hazard events, households can claim the insurance depending on the hazard and their homeowner’s policy/coverage, apply for all public/private loans, or even spend their savings for building repairs (Wang and van de Lindt 2021). Funding resources for the repair of commercial buildings such as strip malls and shopping centers fall in broadly similar categories: personal savings, insurance, Small Business Administration (SBA) loans, and other recovery programs play an essential role that cannot be neglected.
Commercial property insurance is a crucial coverage for business owners, which can pay repair or replacement costs for buildings as well as for damage to the contents inside, such as furnishings, equipment, and machinery, if business properties are damaged or destroyed due to fire, wind, hailstorm, and other covered events (e.g., Vaughan and Vaughan 2007). Shopping centers, strip malls, office buildings, and manufacturing properties are typical business properties requiring commercial property insurance to protect the buildings and contents (General liability 2021a, b, c). Entrepreneurs may choose to finance recovery activities from personal savings before receiving the approval of insurance claims (Morrish and Jones 2020) or when the losses from damage do not meet the insurance deductible.
Several federal programs can support business recovery, as well. The SBA, a US government agency and the largest federal provider of business disaster assistance, provides debt financing to small businesses and private nonprofit organizations to (1) repair or replace damaged components via the physical disaster loan program, or (2) cover working capital or normal expenses through the economic injury disaster loan (EIDL) program (e.g., Lindsay 2010; Wang and van de Lindt 2021; Lee 2019; Ravid et al. 2021; SBA 2021a, b).
The US Department of Housing and Urban Development (HUD) Community Development Block Grant-Disaster Recovery (CDBG-DR) funds, supported by US Congress, have been another way for businesses to recover from major disasters, such as floods and tornadoes over the last decades. Congress has typically allocated CDBG funds specifically for long-term business recovery, such as business recovery loans, infrastructure improvements, and small-firm attraction/retention grants, to encourage renters/owners to stay in a particular area (e.g., Gotham 2014). The US Economic Development Administration (EDA) revolving loan funds (RLFs) can also be established after disasters through economic adjustment assistance programs to provide businesses with gap financing (e.g., Chell 1992; US Economic Development Administration 2021).
From the private side, local community banks may also provide gap financing or bridge loans, commonly structured as a short-term interest-free loans and designed to service loans to affected credit-worthy small businesses, essentially providing them the necessary cash flow for repair and reinvestment expenses (e.g., Weaver and Vozikis 2010). Local government grant programs through chambers of commerce and economic development organizations also exist to help small businesses and nonprofits as needed (Ferrier 2021). Hundreds of thousands of dollars are often donated through the American Red Cross and local churches to help local businesses affected by disaster events (Farrow 2012). Donations and other approaches such as corporate assistance and borrowing money from family/friends were aggregated into “other funding resources” in the commercial building recovery modeling and not proposed separately due to their relative uncertainty for each affected business.
In order to quantitatively simulate financing resources and financing delays following hazard events, this study developed a recovery resource portfolio based on real-world data collected in Galveston, Texas, after Hurricane Ike. Surveys of disaster-affected businesses were performed to document the business recovery process and the resources available (Watson 2014). Owners and managers of individual businesses were asked to put percentages by resources categories to show how they funded their recovery expenses (each survey response should add up to 100%). These responses were summarized across the sample to show how businesses financed their recovery overall across the community (Table 3).
| Index | Funding resources | Percentage of surveyed businesses utilizing resource (%) | Amount of overall recovery financed | |||
|---|---|---|---|---|---|---|
| Mean (%) | Standard deviation (%) | Minimum (%) | Maximum (%) | |||
| 1 | Business revenue | 47 | 24.9 | 37 | 0 | 100 |
| 2 | Personal savings | 44 | 23.3 | 37 | 0 | 100 |
| 3 | Commercial property insurance | 29 | 20.2 | 35 | 0 | 100 |
| 4 | SBA loans | 18 | 9.1 | 23 | 0 | 100 |
| 5 | Credit card | 24 | 6.2 | 14 | 0 | 60 |
| 6 | Donations | 11 | 3.0 | 15 | 0 | 100 |
| 7 | Other | 9 | 2.4 | 9 | 0 | 40 |
| 8 | Local recovery program | 13 | 1.9 | 5 | 0 | 20 |
| 9 | Local bank bridge loan program | 4 | 1.8 | 9 | 0 | 60 |
| 10 | Grants | 4 | 1.8 | 11 | 0 | 70 |
| 11 | Commercial bank loans | 9 | 1.7 | 8 | 0 | 50 |
| 12 | Friends or family | 7 | 1.6 | 6 | 0 | 30 |
| 13 | Corporate assistance | 2 | 0.7 | 5 | 0 | 31 |
| 14 | US HUD CDBG-DR loan | 2 | 0.2 | 1 | 0 | 10 |
| 15 | Crowdfunding | 0 | 0.0 | 0 | 0 | 0 |
| 16 | US EDA Revolving Loan Fund | 0 | 0.0 | 0 | 0 | 0 |
Source: Data from Watson (2014).
The data input derives from text analysis of program documents, including the Catalog of Federal Domestic Assistance, two Galveston newspapers, documents disseminated by the aid programs, including loan application materials and marketing notices, and reports from the Government Accountability Office, the Congressional Research Service, and the Office of the Inspector General. This data were synthesized to determine the number of businesses supported by each program, the average days to fund disbursement, and the total funding size for each program, as illustrated in Table 4.
| Index | Business recovery programs | Average days to funding | Size of fund | Loan amount | |
|---|---|---|---|---|---|
| 1 | US SBA physical disaster loans | 216 | $72.35 million | Maximum $2 million | 499 |
| 2 | US SBA EIDL | 135 | $1.7 million | Maximum $2 million | 20 |
| 3 | US EDA revolving loan fund | 1,145 | $10 million | $30,000–$150,000 (maximum $350,000) | 10 |
| 4 | US HUD CDBG-DR loan | 1,028 | $2.5 million | Average $35,000 (maximum $50,000) | 63 |
| 5 | Local recovery program | 236 | $300,000–$400,000 | $10,000–$40,000 | 7 |
| 6 | Bank bridge loans | 54 | $40 million | Varied |
Source: Data from Watson et al. (2019).
The average days of financing delay that was determined for all programs in Table 4 then replaced the original values shown in the REDi framework (Table 2). The standard deviations of the financial delay time for government grants from Watson et al. (2019) were applied in the present analysis. All the other financial delay statistics (i.e., personal savings/business revenue, commercial property insurance, and others) were jointly referenced from Almufti and Willford (2013), Lin and Wang (2017), and Wang and van de Lindt (2021).
The present study assumed the statistical distributions could generalize actual conditions for financing delays during the commercial building recovery process in a typical community impacted by a natural hazard. The survey data following Hurricane Ike used in this study were mainly used to develop a recovery resource portfolio to estimate the statistical distributions of the financial delay times. This study assumed that funding resource support to business owners from various sources (e.g., insurances, savings, and government grants) following Hurricane Ike were similar to other events. However, this assumption was separate from other delay factors (e.g., inspection and permitting) and the repair time itself by a contractor.
These funding distributions were averaged and applied to the business population as a whole, rather than broken into subgroups by sector or size of the business. However, research has shown that businesses are more likely to apply for, be approved for, and use funds in their recovery across these characteristics (Watson 2021). Although these differences are in part captured through the different commercial building types, there is an opportunity for future research to more directly integrate differences in funding composition with commercial building types and characteristics of the businesses occupying those structures.
It is important to mention that the methodology developed in Table 5 displays the recovery resource portfolio incorporating the survey data given in Tables 3 and 4, which was further used in the commercial building recovery model. The developed recovery resource portfolio can inform how businesses fund their recovery from all available approaches (e.g., personal savings, insurance, or government grants) when they suffer damage/disruption from a hazard event. The percentage of recovery financed by personal savings/business revenue, reimbursed by commercial property insurance, and funded by commercial bank/bridge loans, are consistent with the values summarized from the Galveston survey (Table 3). The percentage of financing support paid by credit cards, accepted from donations, received as support from friends/family/corporate assistance, and supplied by other approaches detailed in Table 3 were aggregated to “other approaches” illustrated in Table 5.
| Index | Business recovery programs | Restoration financial resources | ||
|---|---|---|---|---|
| Mean (%) | Standard deviation (%) | Distribution | ||
| 1 | Personal savings/business revenue | 48.2 | 37 | Normal |
| 2 | Commercial property Insurance | 20.2 | 35 | |
| 3 | US SBA physical disaster loans | 11.8 | 23 | |
| 4 | US SBA EIDL | 0.3 | 23 | |
| 5 | US EDA revolving loan fund | 1.6 | 0 | |
| 6 | US HUD CDBG-DR loan | 0.4 | 1 | |
| 7 | Local recovery program | 0.1 | 5 | |
| 8 | Bank loan | 3.5 | 9 | |
| 9 | Other | 13.9 | 15 | |
The percentage of recovery financed by each government program for business recovery was developed based on the proportion of the total fund size that businesses/firms received from different resources, as given in Table 4. It was assumed that the uncertainty of the percentage of restoration financial resources fit a normal distribution. It was also assumed that all the types of commercial buildings have the same opportunity to access different financial resources.
The time to access financing is considered the most uncertain impeding factor (Almufti and Willford 2013). Based on the REDi framework, the time associated with the longest delay should be the impeding factor if multiple funding sources are used. For example, if the regular operating budget of the facility is sufficient to cover the financial costs, and the estimated financial costs are less than the insurance deductible, then the impeding factor for personal savings is used. If available funds are sufficient to cover the insurance deductible, then the impeding factor for insurance can be used. If the insurance cannot solely cover the financial losses, and funding needs to be sought from other approaches such as bank loans and SBA-backed loans, then the impeding factor for other approaches should be used.
However, the original REDi framework did not consider government grants as possible funding sources due to the uncertainty in securing these funds (Almufti and Willford 2013), even though government grants would be a major source of postdisaster funding for medium to large-size businesses. Based on the statistical results determined from personal surveys (Table 5), the percentage of recovery financed through government grants accounted for 2% of the total, which, although small, cannot be neglected because this may vary depending on the event. The improved REDi framework incorporating government grant programs and the original programs (e.g., personal savings, insurance, and loans) is presented in Table 2.
If considering the longest delay time following the REDi framework, the estimated delay time to obtain approval of the US EDA Revolving Loan Fund is 163.6 weeks, but this program’s fund size only accounts for 1.5%. Thus, the authors felt it to be unreasonable to consider the longest delay time as the unique criterion to control the impeding factor if incorporating various government grants as funding resources for businesses. Defining the estimated financial costs and then choosing the expected method of financing for businesses after natural hazard events is a more appropriate, although challenging, approach.
This methodology in this study proposes to select the expected method of financing for commercial buildings based on their building-specific conditions (i.e., damage states at slight, moderate, extensive, and complete levels) following damage from a natural hazard, as illustrated in Table 6. Memari et al. (2018) has given the description of different damage states corresponding to different types of commercial buildings. The financial costs under different damage states were estimated by the building replacement cost multiplied by the loss ratio affected by tornado hazards (in the present study). The building replacement cost considers both the cost of structural component damage and the value of interior damaged components, including nonstructural components and building contents (Koliou and van de Lindt 2020; Pilkington et al. 2020).
| Damage states | Funding resources | ||
|---|---|---|---|
| Personal savings/business revenue | Commercial property insurance | Government grants/others | |
| Slight | Yes | — | — |
| Moderate | Yes | Yes | — |
| Extensive | Yes | Yes | Yes |
| Complete | Yes | Yes | Yes |
The loss ratio is defined as the value of the loss divided by the insured value of the building. The definition of loss ratio has been comprehensively applied to visualize and compare the building losses (e.g., single-family residential buildings) under different natural hazards such as hurricanes, tornadoes, floods, and rainfall from the last several decades (e.g., Pant and Cha 2019; FEMA 2012; Vickery et al. 2006; Friedland and Levitan 2011; Li et al. 2012; Wang et al. 2018). The loss ratio associated with tornado-induced damage states for commercial buildings used in this study followed the work by Pilkington et al. (2020). If this estimated loss ratio was greater than 50%, the building was considered a total loss that needed to be rebuilt entirely, consistent with the insurance industry.
In reality, for financial costs at different damage levels, building owners may choose the expected method of financing differently. Table 7 presents the damage state description of a typical commercial building, a light industrial building (T7 presented in Table 1), as an example (Memari et al. 2018). Most insurance policies for commercial buildings typically require a deductible of 5% to 10% of the building value at a minimum (Almufti and Willford 2013), which is significantly greater than the financial costs for the slight damage. Therefore, building owners would likely spend their savings to perform slight repairs to, for example, their roof covering or other construction materials and/or replacing broken windows. Building owners may claim insurance and be reimburse from their insurance companies if their commercial buildings have roof covering failures over a relatively large area and/or the exterior walls are damaged from flying debris which is the description of moderate damage. In such cases, building owners may still need to use their savings to pay for the insurance deductible and coinsurance depending on the deductible requirements and/or coinsurance clauses written in their commercial property insurance policy.
| Damage states | Roof covering (%) | Window/door | Exterior wall (%) | Garage door | Roof structure |
|---|---|---|---|---|---|
| Slight | and | 1 or 2 | and | No | No |
| Moderate | and | or 2 and | and | Yes | No |
| Extensive | and | Typically yes | No | ||
| Complete | Typically | Typically | Typically yes | Yes |
When extreme damage occurs, such as exterior wall collapse, termed extensive or complete damage, the loss ratio exceeds 0.5. Although building owners may have property insurance coverage based on the value of their buildings and contents inside, they still need to access financial resources such as government grants (e.g., SBA-backed loans, but they are limited to $2 million for business) to finance their postdisaster events. For example, if the loss analysis revealed significant structural damage to many components, this may require an engineer to completely redesign the building, which may not be paid by the insurance reimbursement. At this level of damage, the financing delay time is calculated by combining the percentage of all types of government grants, bridge loans, and other approaches and their specified delay time considering uncertainty.
Repair and Recovery Module
The repair time was developed based on the repair estimates following isolated component damage, presented as the repair fragility functions assembling from building component levels to system levels. The isolated component damage analysis herein used the FEMA P-58-1 approach. Table 8 presents tornado repair fragility functions of commercial buildings damaged at different damage states (DS) (i.e., slight to complete, presented as DS1–DS4), as mentioned previously, to reach full functionality (Koliou and van de Lindt 2020).
| Archetypes | Building description | DS1 | DS2 | DS3 | DS4 | ||||
|---|---|---|---|---|---|---|---|---|---|
| T6 | Business and retail building (strip mall) | 2.18 | 0.66 | 3.78 | 0.61 | 4.51 | 0.55 | 5.05 | 0.6 |
| T7 | Light industrial building | 2.15 | 0.58 | 3.28 | 0.54 | 4.69 | 0.51 | 5.55 | 0.53 |
| T8 | Heavy industrial building | 2.11 | 0.53 | 3.25 | 0.51 | 4.52 | 0.55 | 5.55 | 0.53 |
| T15 | Large big-box store | 2.28 | 0.51 | 3.62 | 0.51 | 4.49 | 0.55 | 5.23 | 0.52 |
| T16 | Small big-box store | 2.28 | 0.51 | 3.62 | 0.51 | 4.49 | 0.55 | 5.23 | 0.52 |
| T18 | Shopping center | 2.15 | 0.49 | 3.83 | 0.55 | 4.57 | 0.55 | 5.18 | 0.55 |
| T19 | Office building | 1.45 | 0.55 | 3.74 | 0.52 | 4.8 | 0.52 | 5.32 | 0.55 |
Note: Units: ln (days); and (days).
The recovery module can be combined to represent the two stages, namely delay and repair, and was consistent with the methodology for residential structures explained by Wang and van de Lindt (2021). Fig. 2 explains the integration of the delay and repair modules through the multilayer MCS implemented in the model. Boxes on the right side shown in Fig. 2 show an example of analytical results after running the commercial building recovery model impacted by an Enhanced Fujita 5 (EF5) tornado event.
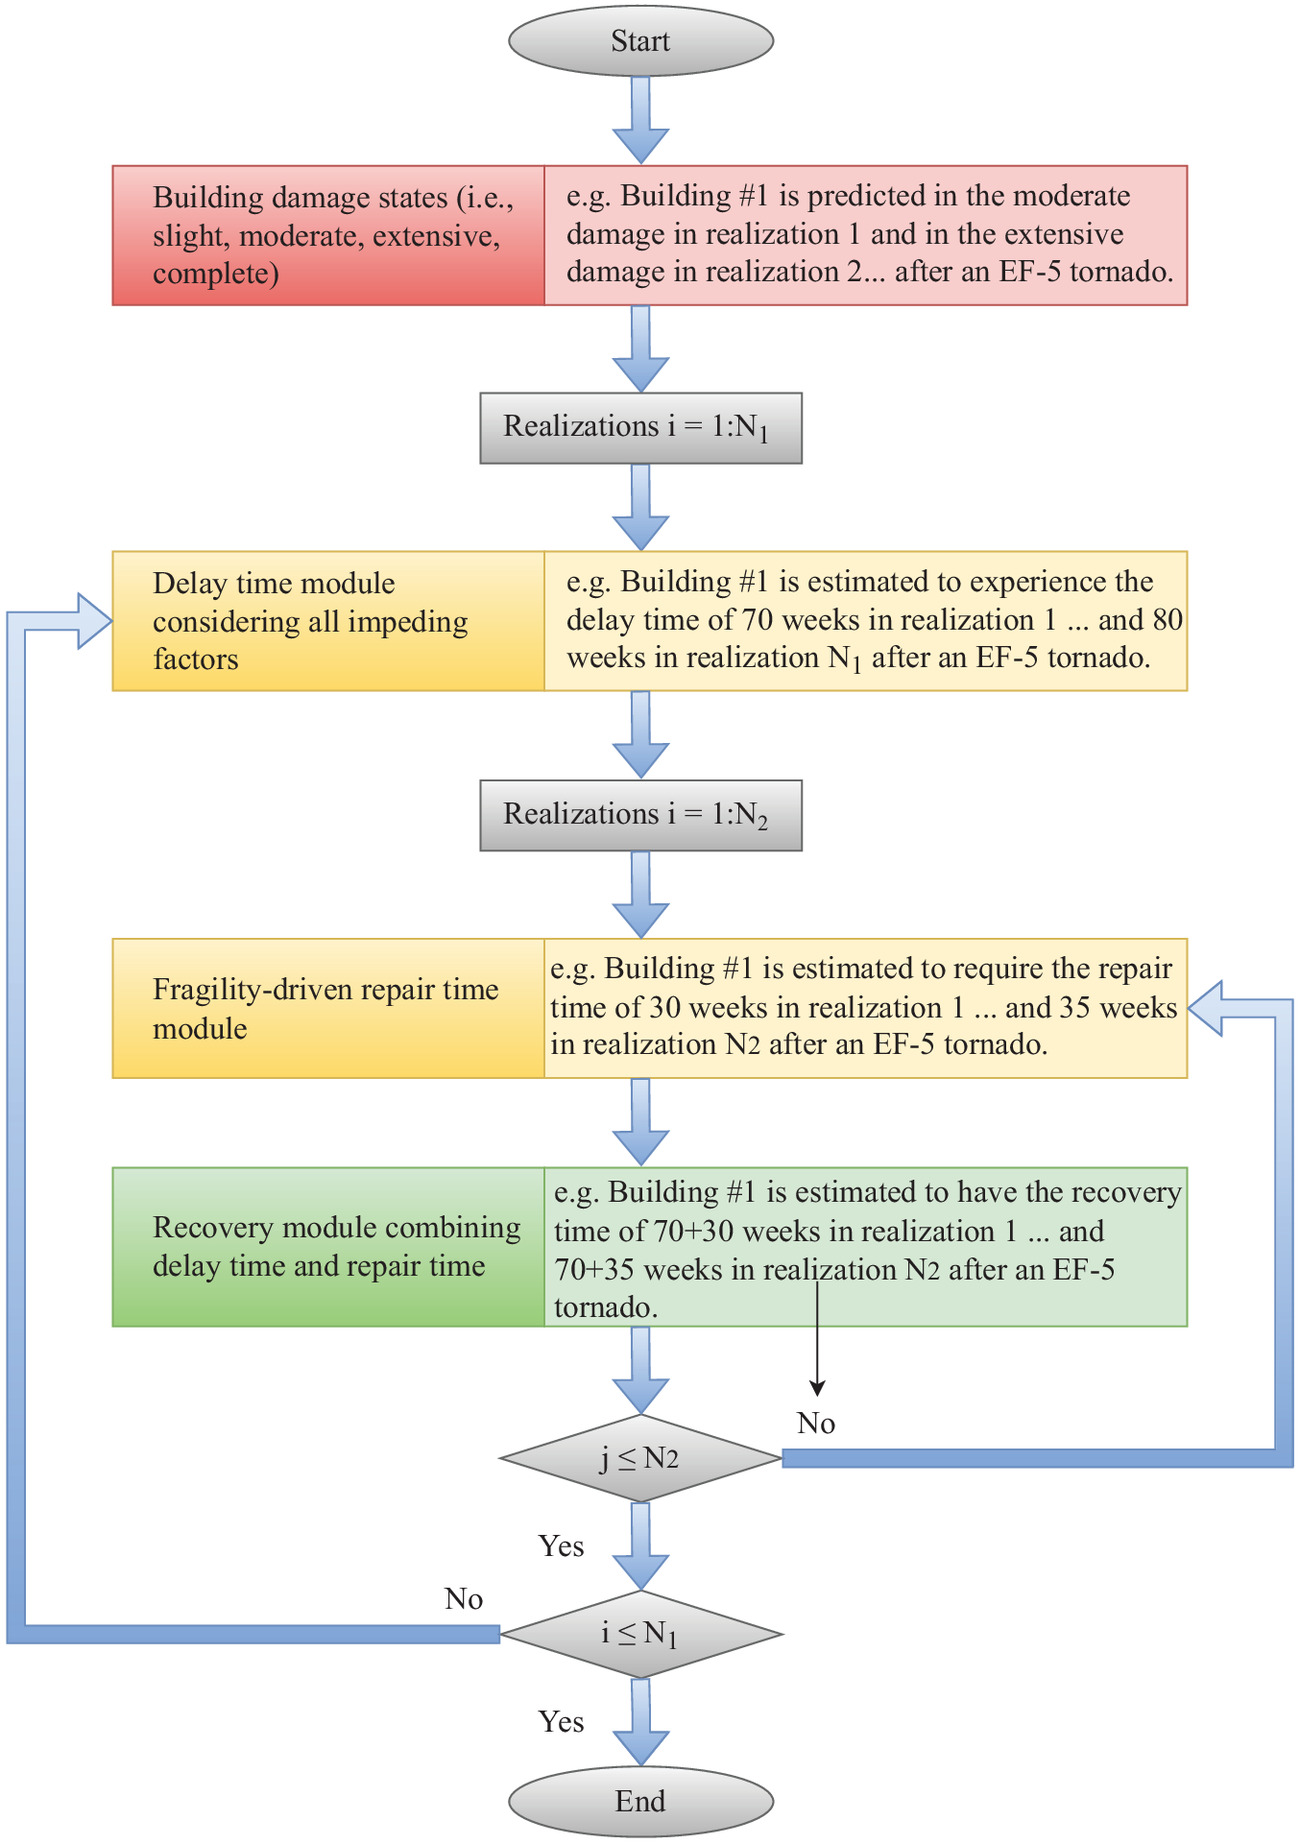
The first layer of the MCS within realizations is associated with the delay module. In each MCS realization of this layer, the delay time of assembling all impeding factors needed for each commercial building can be determined. Then, the repair time of each commercial building damaged from any estimated damage states to fully restored can be computed within realizations, which is the second layer of MCS. Therefore, the methodology proposed in this study can predict the recovery time for each commercial building and then commercial building recovery performance probability over the entire community times in the simulation.
Illustrative Example Using Joplin Testbed for Tornado Hazards
As low-probability, high-consequence events, tornado hazards can result in catastrophic physical damage to buildings and distributed infrastructure and with subsequent socioeconomic losses (e.g., Lombardo et al. 2015; Prevatt et al. 2012; Wang et al. 2018). Previous studies have focused on the infrastructure damage (e.g., buildings and lifeline systems), economic losses, and household disruption impacted by tornado hazards (e.g., Roueche and Prevatt 2013; Pilkington et al. 2020; Wang et al. 2021, 2022a, b).
Businesses located in commercial properties within a community are also severely impacted by tornadoes, resulting in significant business interruption and disruption (e.g., Masoomi and van de Lindt 2018; Smith and Sutter 2013). For example, following the 2011 Joplin, Missouri, tornado, more than 500 businesses were destroyed and had to close their doors, at least temporarily, resulting in loss of sales, loss of customers, and lost employee income. Less than 4 months after the tornado, it was reported that 69% of the damaged businesses reopened or were open at a temporary location or were rebuilding. Some large corporations such as Walgreens, Home Depot, Walmart, and Chick-fil-A were rebuilding within 8 months (Smith and Sutter 2013).
Therefore, it is critical to be able to model the business recovery process in a broader community-level resilience model to enable community planning for resilience including decision-support for policymakers. Commercial building recovery is the key factor for business owners to reopen their businesses following a hazard event, which in turn will influence decision makers during recovery. This illustrative example is provided to demonstrate implementation of the commercial building recovery model for a community impacted by a simulated tornado scenario. This illustrative example aims to determine the statistics of the recovery time needed for each commercial building to be fully restored and the mean recovery time with uncertainties for commercial buildings tracked through a time-stepping community-level recovery algorithm. The city of Joplin, located in southwest Missouri, was selected based on prior work with this community as a testbed. Joplin is a typical small to medium-size community in the Midwest of the United States and is used in this illustrative example.
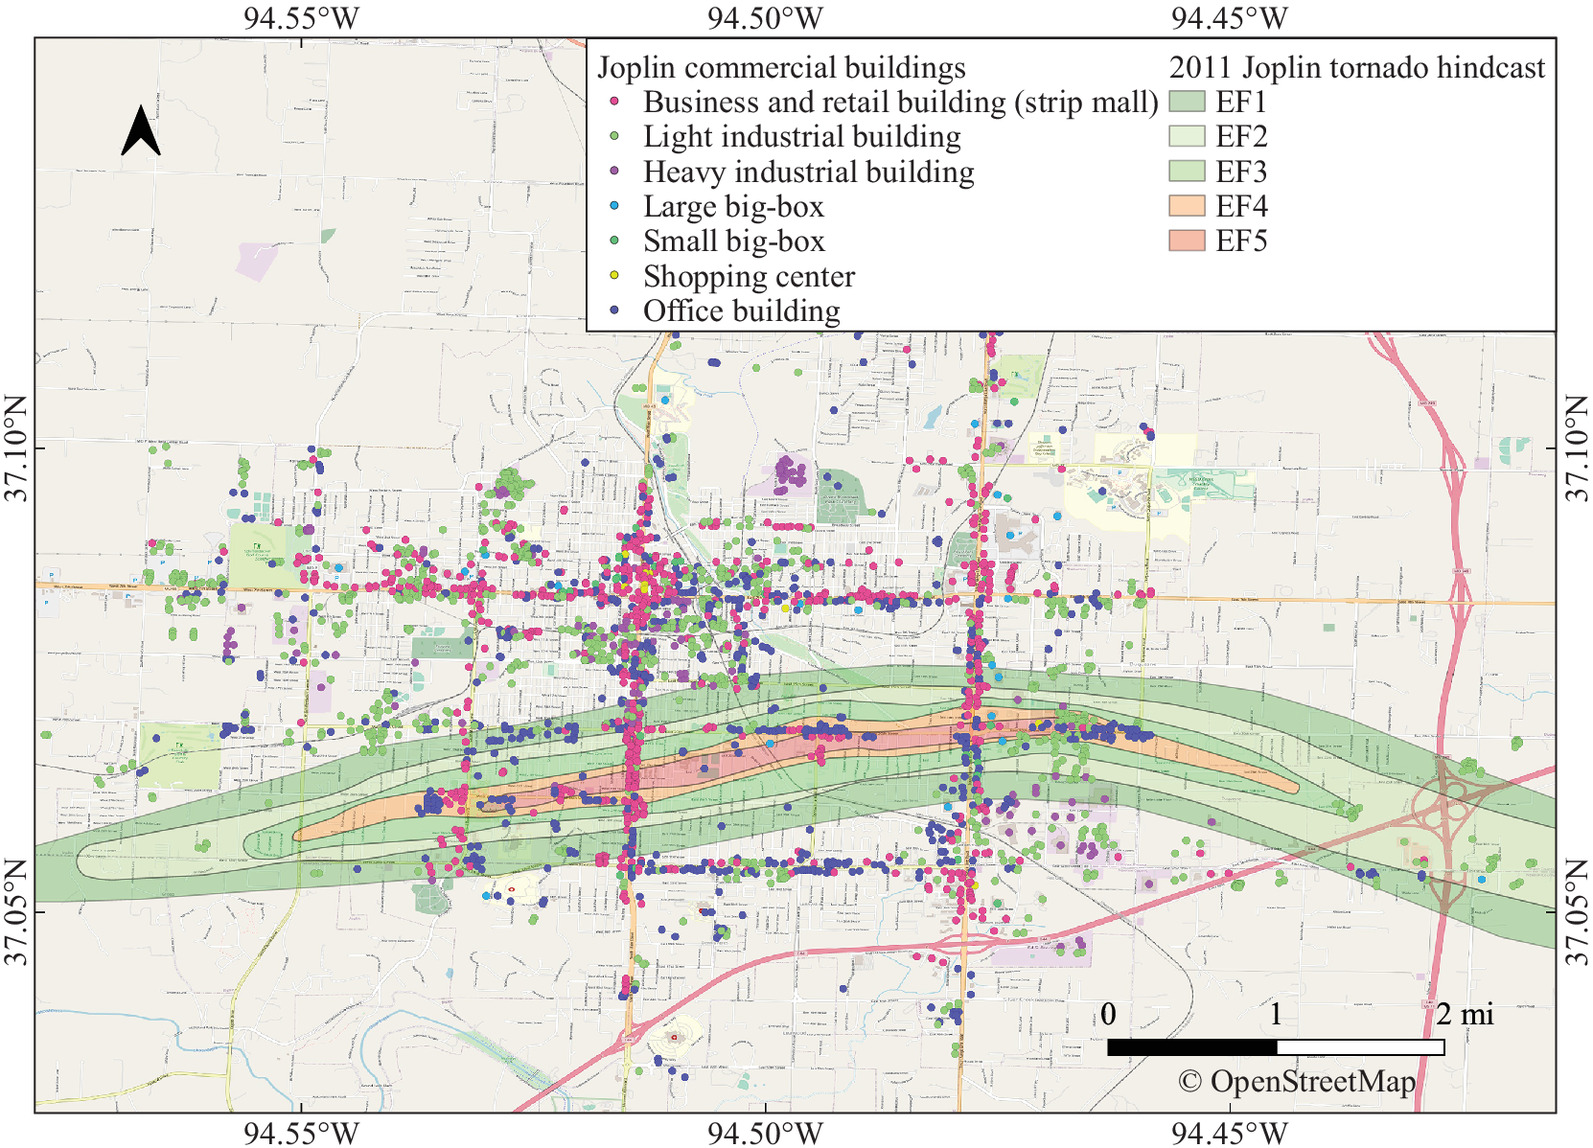
The 2011 Joplin tornado hindcast (McDonald and Mehta 2004; Wang et al. 2021) was used in this study to directly impact the built environment in Joplin. Fig. 3 shows the overlay of the built environment of commercial buildings and the tornado simulation. As expected, most commercial buildings are located along several main streets in the community. Table 9 illustrates the different types of commercial buildings and the number of commercial buildings falling within the simulated tornado path. Building damage results need to be determined preliminarily to then apply the new commercial building recovery model as mentioned previously. Combining the building damage model, fragility functions, and hazard model, the probability of buildings exceeding each damage states is then determined (Wang and van de Lindt 2022).
| Archetypes | Building description | Joplin builidngs | Buildings within the tornado path | |||||
|---|---|---|---|---|---|---|---|---|
| EF1 | EF2 | EF3 | EF4 | EF5 | Total | |||
| T6 | Business and retail building (strip mall) | 736 | 45 | 32 | 37 | 37 | 35 | 186 |
| T7 | Light industrial building | 963 | 46 | 39 | 27 | 21 | 13 | 146 |
| T8 | Heavy industrial building | 155 | 14 | 2 | 2 | 0 | 2 | 20 |
| T15 | Large big-box store | 21 | 1 | 1 | 0 | 2 | 1 | 5 |
| T16 | Small big-box store | 30 | 1 | 2 | 1 | 0 | 1 | 5 |
| T18 | Shopping center | 10 | 0 | 0 | 0 | 0 | 1 | 1 |
| T19 | Office building | 701 | 84 | 16 | 21 | 74 | 41 | 236 |
| Total | 2,616 | 191 | 92 | 88 | 134 | 94 | 599 | |
MCS generated sufficient randomized samples and determined the damage states for each commercial building within each MCS realization. Table 10 presents typical building-level hazard exposure and damage results, where each building was tracked using a globally unique identifier (GUID). The limit state (LS) probability at different levels (i.e., LS1–LS3) presented in Table 10 are the probabilities shown in the fragility curves at different damage levels at a specified intensity measure in terms of a 3-s gust wind speed.
| GUIDs | Archetypes | Hazard exposure | Wind speed () | Limit states | MCS samples | |||
|---|---|---|---|---|---|---|---|---|
| LS1 | LS2 | LS3 | Sample 1 | Sample 2 | ||||
| GUID1 | T7 | EF1 | 38.56 | 0.33 | 0.09 | 0.02 | DS1 | DS2 |
| GUID2 | T19 | EF2 | 53.98 | 0.99 | 0.78 | 0.15 | DS2 | DS3 |
| GUID3 | T6 | EF3 | 70.81 | 1.00 | 0.99 | 0.81 | DS3 | DS4 |
| GUID4 | T15 | EF4 | 89.29 | 1.00 | 0.99 | 0.98 | DS4 | DS4 |
| GUID5 | T16 | EF5 | 109.58 | 1.00 | 1.00 | 0.99 | DS4 | DS4 |
After applying the commercial building recovery model described in this paper, Fig. 4 shows the histograms of delay time () and recovery time () from MCS for a typical commercial building in this study, which appears to fit a lognormal distribution well. For a typical building within the EF3 region of the EF5 path, the mean delay time and mean recovery time is 67 and 95 weeks, respectively.
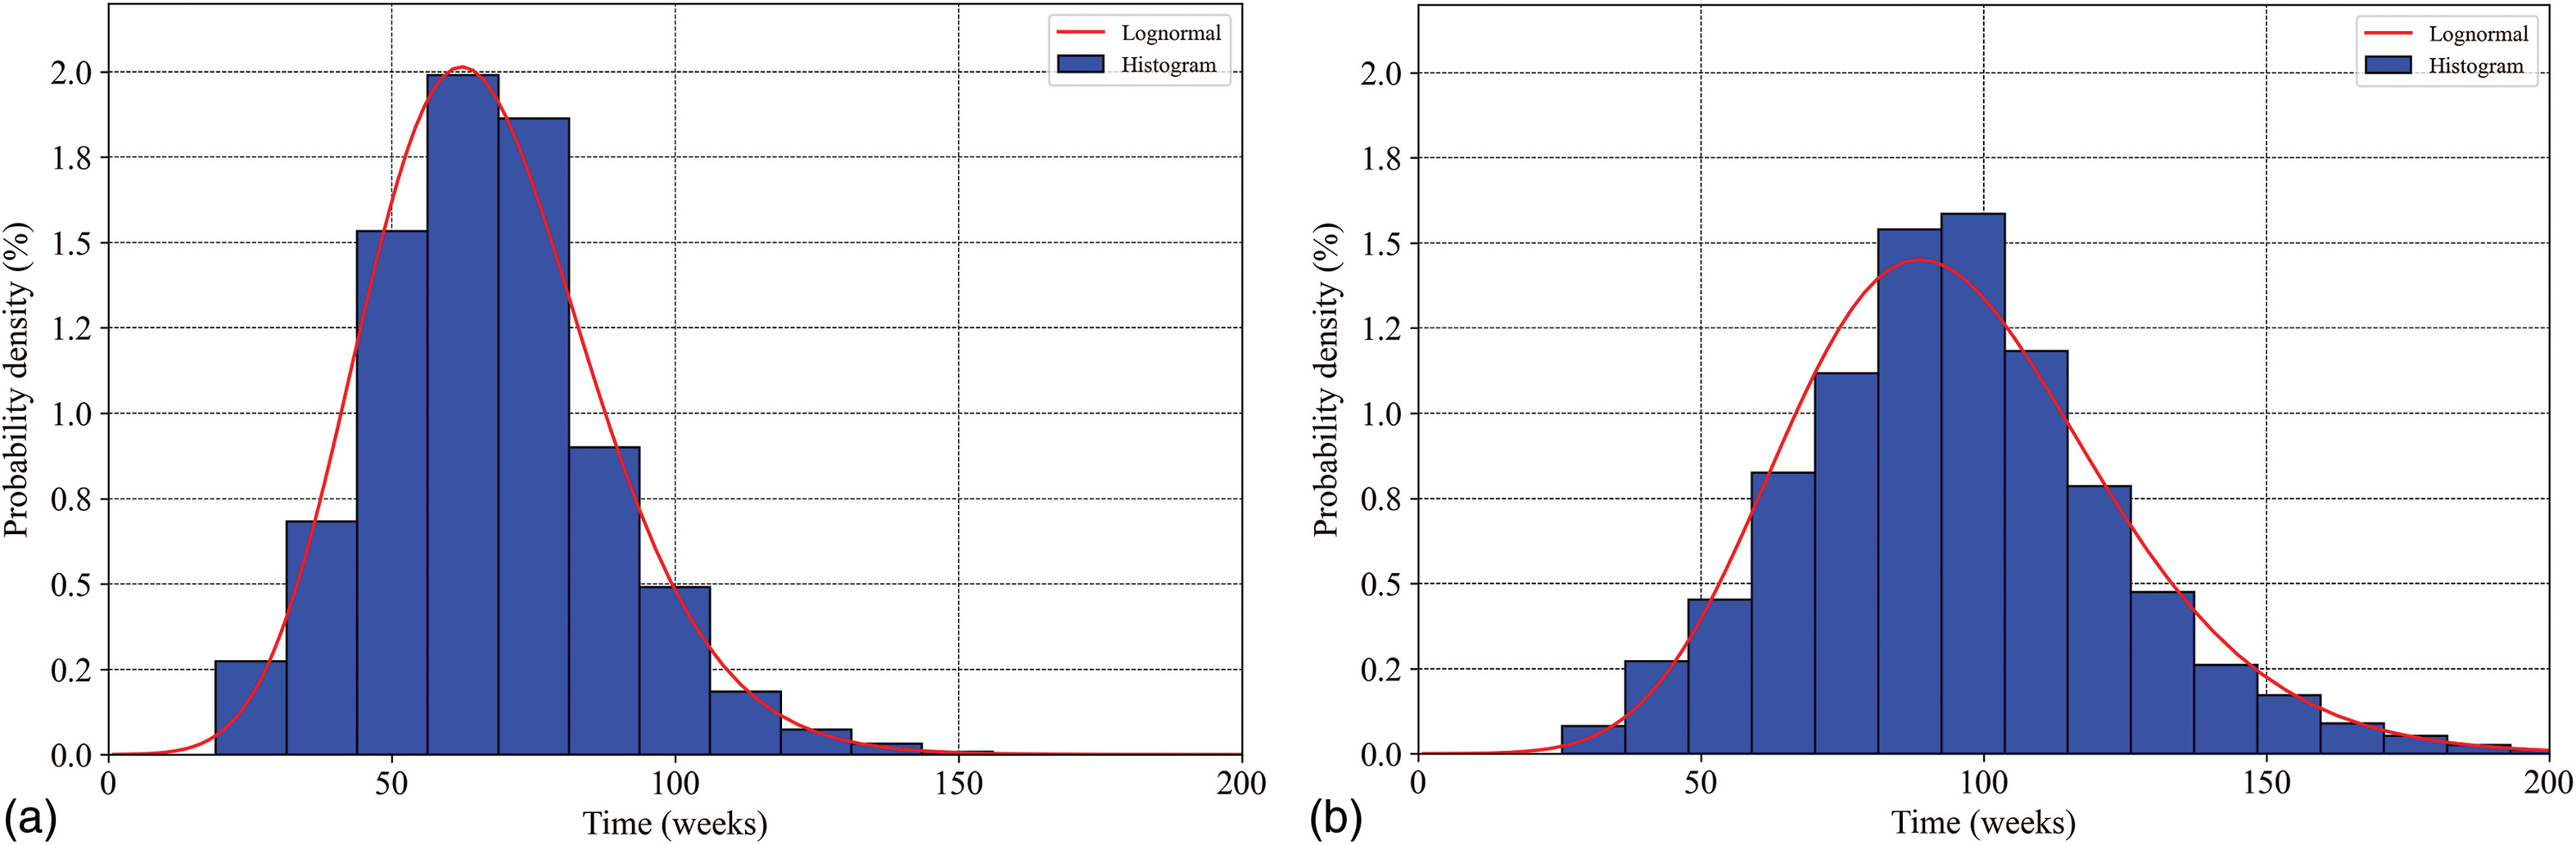
Fig. 5 illustrates the average delay and recovery time with uncertainties for all commercial buildings within the tornado path, grouped by different tornado intensity regions. Overall, the average recovery time for commercial buildings within the regions from EF1 to EF5 is 45, 86, 97, 101, and 102 weeks. It can be observed that only commercial buildings within the EF1 region can realistically recover in approximately 1 year.
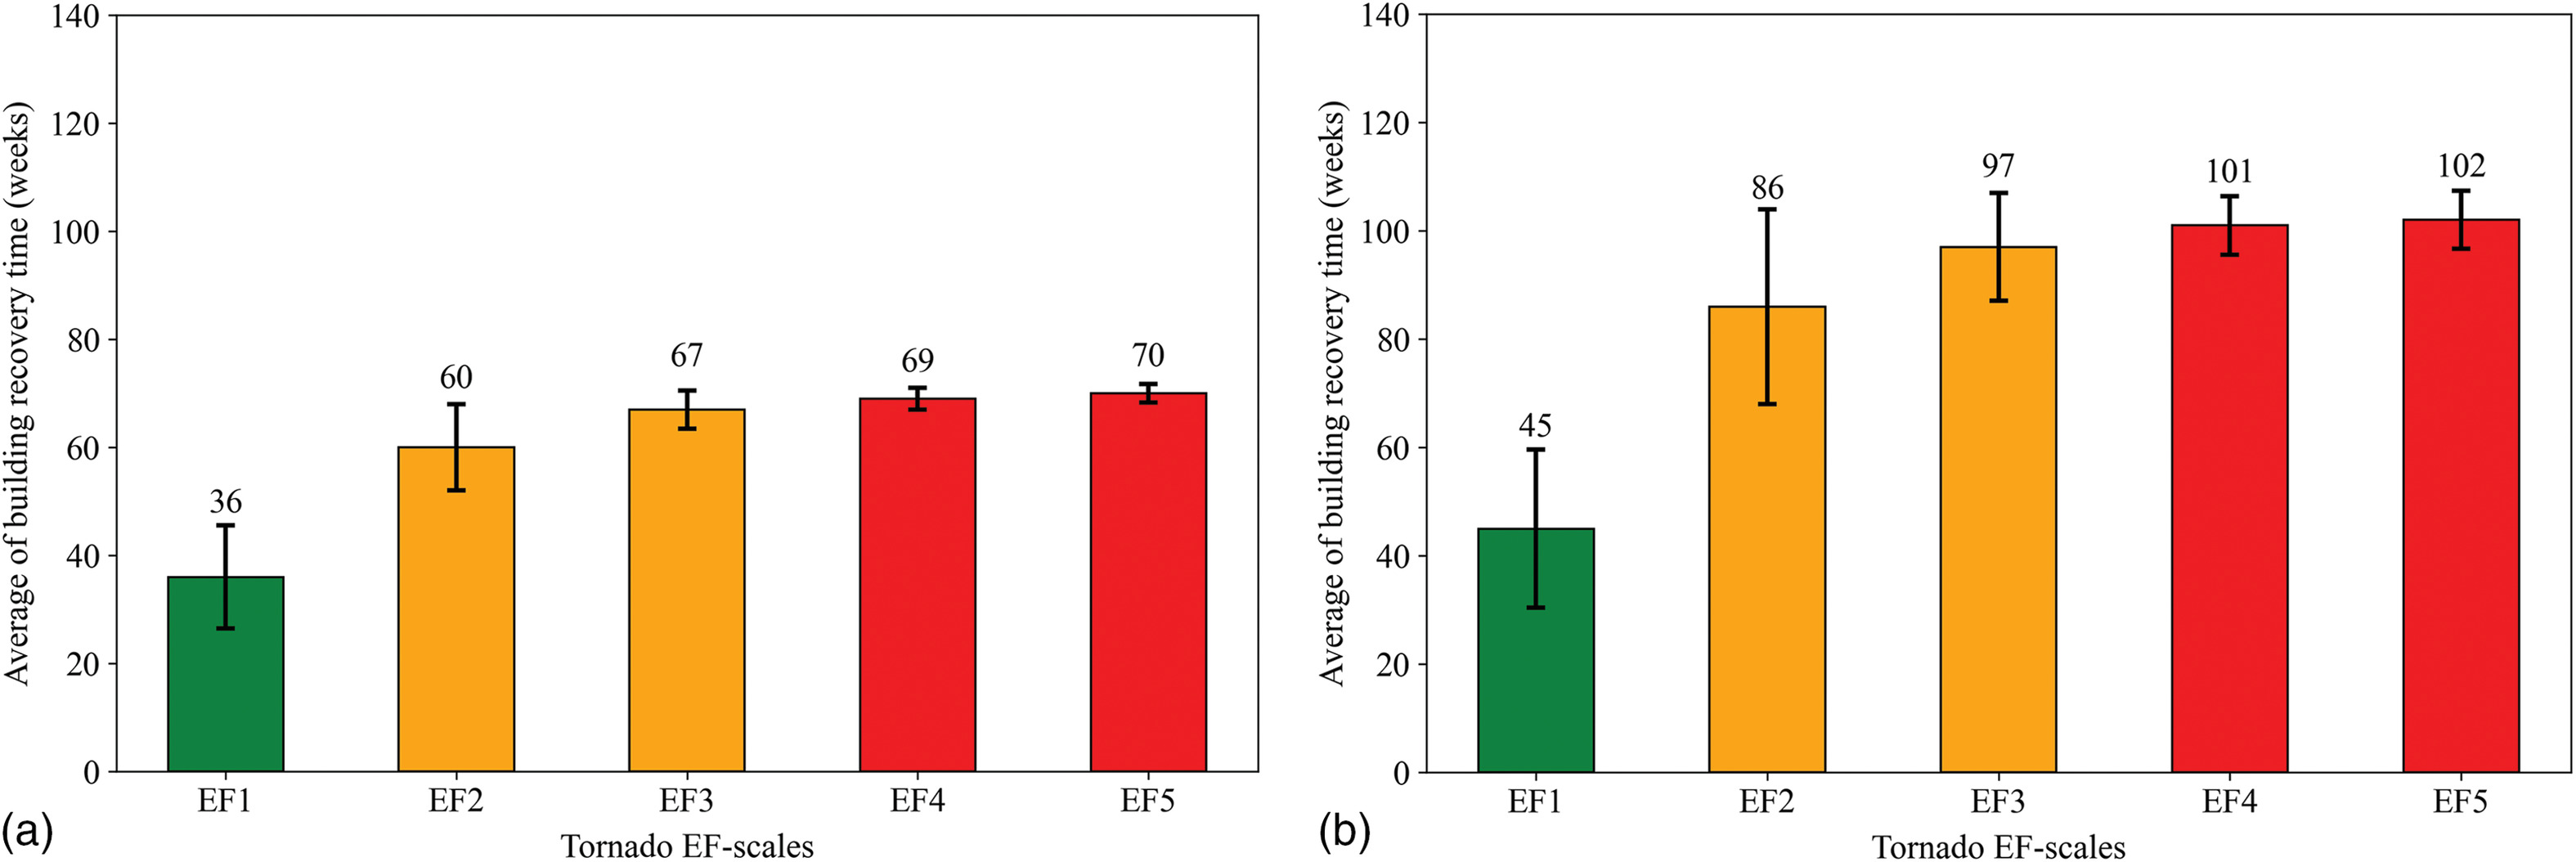
Because the delay time for all the impeding factors presented in this study directly rely on building-specific conditions impacted by tornado hazard, buildings within the EF1 region have a high possibility of slight damage, but buildings within the EF3 region or higher are commonly damaged to a complete level. Therefore, the uncertainties of delay time for buildings within EF1 and EF2 regions are relatively higher than those within other regions. Building recovery time has a full uncertainty propagation throughout the multilayer MCS realizations, aggregated by the combination of delay time and repair time. Therefore, as expected, building recovery time has a higher uncertainty than building delay time.
The average delay and recovery time for buildings in the EF3 region or higher do not significantly differ, although the uncertainties of delay and recovery time for buildings in the EF3 region are slightly higher than those in the EF4 and EF5 regions. The delay time and recovery time of buildings presented in Fig. 4 are color-coded by EF region. The recovery process can be shortened through mitigation strategies applied to buildings, such as the component-level improvement (e.g., connections) for buildings in EF1 region, the system-level improvement (e.g., shear walls) for buildings in EF2 and EF3 regions, and providing alternate approaches (e.g., safe rooms) for buildings in EF4 and EF5 regions (van de Lindt et al. 2013).
In order to track the time-stepping commercial building trajectory over the entire community, Eq. (1) presents the concept of the binary commercial building recovery performance indicator, , of the th building at the th quarter in the th realization. is the time by quarters, and is the calculated recovery time of buildings as thresholds. Eqs. (2) and (3) illustrate the time-stepping commercial building performance recovery probability and the average of the percentage of buildings fully recovered , respectively. Wang and van de Lindt (2021) have given more details
(1)
(2)
(3)
Fig. 6 shows the building postdisaster recovery performance probability at a community level over time. As expected, the recovery performance probability for most commercial buildings in the EF1 region varied from 0.8 to 1.0 at 1 year after the tornado, and those in the EF3 region or higher were still in the recovery process at 2 years, which generally match the analytical results of recovery time needed for buildings in each EF region shown in Fig. 4. Based on a public report following the 2011 Joplin tornado, more than 500 businesses were destroyed or severally damaged, which validates our commercial building damage results that has 599 commercial buildings (Table 9) falling within the 2011 Joplin tornado path. As of April 1, 2014 (almost 3 years after the tornado event), 500 businesses have opened or were reopening, and 30 businesses have indicated that they would not rebuild/open (Economic Development Administration 2014; Fact Sheet 2021).
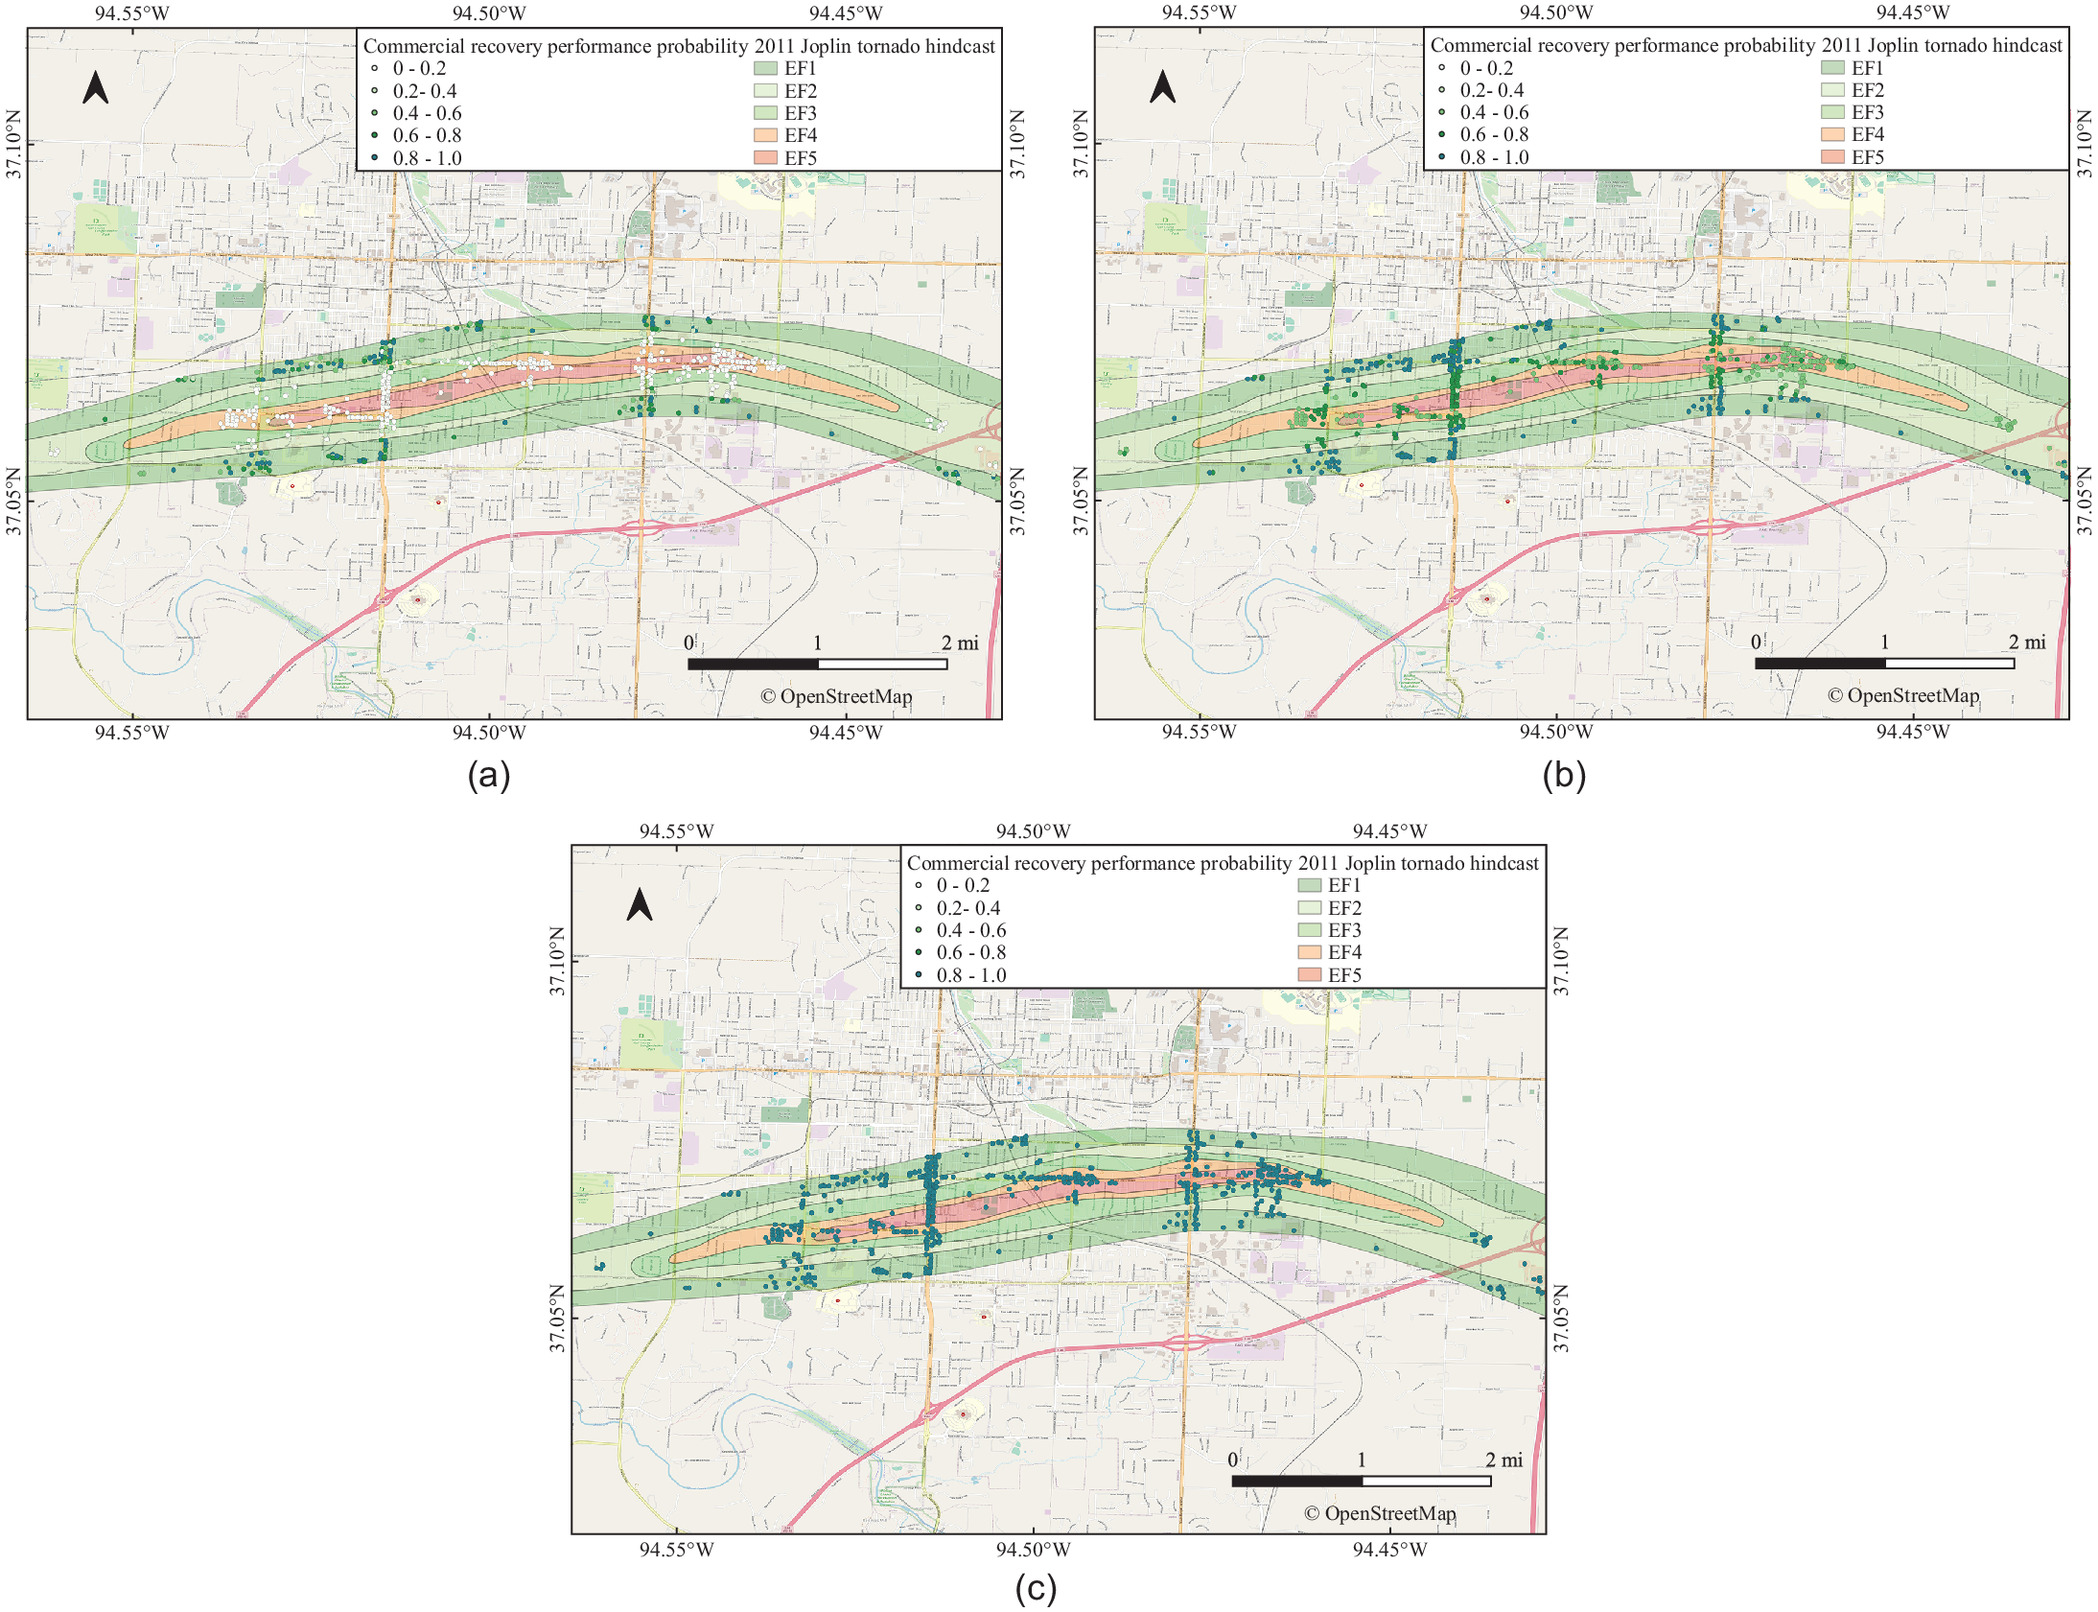
The analytical results determined from the commercial building recovery model show that all the buildings can be fully repaired after 3 years, as shown in Figs. 5(b) and 6(c). Table 11 presents the average percentage for different buildings fully recovered at the short-term, intermediate-term, and long-term phases (NIST 2020) after the tornado, as an essential resilience recovery metric from the perspective of physical service stability. The recovery process of different buildings depends on building damage states based on their locations with tornado intensities, financial resources available to business owners, and other impeding factors resulting in delay before repair initiation. Overall, in this illustrative example, the community began to have a small number of buildings fully recovered at the intermediate phase, and more than half of buildings completed the recovery process around 2 years in the long-term phase.
| Buildings | Design hazard performance | ||||||||
|---|---|---|---|---|---|---|---|---|---|
| Phase 1: short-term (%) | Phase 2: intermediate (%) | Phase 3: long-term (%) | |||||||
| Days | Weeks | Months | |||||||
| 0 | 1–3 | 3–7 | 1–4 | 4–8 | 8–12 | 3–12 | 12–24 | 24+ | |
| Business and retail building (strip mall) | 0 | 0 | 0 | 0 | 0.5 | 1.7 | 24.6 | 77.6 | 100 |
| Light industrial building | 0 | 0 | 0 | 0 | 1.2 | 4.8 | 19.5 | 59.2 | 100 |
| Heavy industrial building | 0 | 0 | 0 | 0 | 0.9 | 2.8 | 62.6 | 86.3 | 100 |
| Large big-box store | 0 | 0 | 0 | 0 | 0 | 0 | 29.5 | 75.6 | 100 |
| Small big-box store | 0 | 0 | 0 | 0 | 0.1 | 0.6 | 48.4 | 84.0 | 100 |
| Shopping center | 0 | 0 | 0 | 0 | 0 | 0 | 0.1 | 63.4 | 100 |
| Office building | 0 | 0 | 0 | 0 | 2.0 | 5.4 | 31.5 | 73.9 | 100 |
Summary and Conclusions
Commercial properties/businesses in a hazard-affected area can have a substantial impact on the overall community recovery. Therefore, business recovery is one of the more critical requirements serving as a necessary (although not sufficient) condition to improve resilience. In this paper, a probabilistic commercial building recovery model was proposed to track the recovery trajectory for commercial buildings over time following a hazard event and measure typical recovery resilience metrics. Based on the work presented herein, the following conclusions can be drawn:
•
A recovery resource portfolio available to business owners was developed based on real-world available project survey data collected following Hurricane Ike in 2008 from the associated statistical analysis. The three significant funding resources are personal savings/business revenue, commercial property insurance, and government grants/others. Business owners must choose a single or multiple financial methodologies to support their postdisaster events depending on the specific conditions of their commercial buildings.
•
The average recovery time for commercial buildings in the tornado example in this study varied from as little as averaging 45 weeks in slightly damaged regions (DS1 and DS2) to as much as an average of 102 weeks at the centerline of the tornado path. The uncertainties in recovery time for buildings in the EF1 and EF2 wind regions were higher than those in other tornado regions.
•
The recovery process for different commercial building types depends on building damage affected by hazard events, financial resources available to business owners, and other impeding factors. Overall, very few commercial buildings were fully recovered within a year of the hazard event, and, in general, more than 50% were fully restored after approximately 2 years.
The methodology proposed in this study has several limitations and assumptions, which need to be addressed in future studies. First, the methodology assumed business owners would not select a new location to rebuild their commercial buildings but schedule repair of the original buildings no matter how damaged they were. Second, this study mainly considered the recovery of physical buildings without considering the complex personal decision-making processes of business owners, managers, and commercial landlords. For example, business owners are also often residents of the community, homeowners, and heads-of-household. If their residential buildings were damaged, they may have dislocated or even out-migrated from the community, which would impede or eliminate their commercial building recovery plan. Lastly, the proposed methodology incorporating real-world funding resource data to estimate the financial delay was based on previous statistics but needs empirical field study data related to commercial building recovery and business reopening for validation.
In summary, the resilience-based methodology proposed in this study can quantitatively incorporate a recovery resource portfolio into the probabilistic community resilience model and help the community understand and guide the recovery process for commercial buildings. Such a methodology, even with some assumptions and limitations, will be beneficial for business recovery modeling because no model at the building-level currently exists.
Data Availability Statement
Some data (e.g., community building data set, survey data), models, or codes that support the findings of this study are available from the corresponding author upon reasonable request.
Acknowledgments
The Center for Risk-Based Community Resilience Planning is a NIST-funded Center of Excellence; and the Center is funded through a cooperative agreement between the US National Institute of Standards and Technology and Colorado State University (NIST Financial Assistance Award Nos. 70NANB15H044 and 70NANB20H008). The views expressed are those of the presenter and may not represent the official position of the National Institute of Standards and Technology or the US Department of Commerce.
References
Aghababaei, M., M. Koliou, M. Watson, and Y. Xiao. 2021. “Quantifying post-disaster business recovery through Bayesian methods.” Struct. Infrastruct. Eng. 17 (6): 838–856. https://doi.org/10.1080/15732479.2020.1777569.
Alesch, D. J., J. N. Holly, E. Mittler, and R. Nagy. 2001. “Organizations at risk: What happens when small businesses and not-for-profits encounter natural disasters.” Accessed January 30, 2023. http://www.chamberofecocommerce.com/images/Organizations_at_Risk.pdf.
Almufti, I., and M. Willford. 2013. “RED rating system: Resilience-based earthquake design initiative for the next generation of buildings.” Arup Co. Accessed January 30, 2023. https://www.slideshare.net/DISSIPATOR/redi-resiliency-rating.
Arup. 2017. “Seismic resilience study: Seismic risk assessment and recommended resilience strategy.” Accessed August 17, 2017. https://vpfo-facilities.sites.olt.ubc.ca/files/2020/03/UBC-Seismic-Risk-Assessment-and-Resilience-Strategy-Issue-2_Aug2017.pdf.
Attary, N., J. W. van de Lindt, H. Mahmoud, S. Smith, C. M. Navarro, Y. W. Kim, and J. S. Lee. 2018. “Hindcasting community-level building damage for the 2011 Joplin EF5 tornado.” Nat. Hazards 93 (3): 1295–1316. https://doi.org/10.1007/s11069-018-3353-5.
Berd, A., and M. Watson. 2020. “Follow the money: Using content analysis to understand disaster spending.” DesignSafe. https://doi.org/10.17603/ds2-2na8-am90.
Chell, M. A. 1992. “Economic development administration revolving loan funds.” Econ. Dev. Re. 10 (2): 31.
Corey, C. M., and E. A. Deitch. 2011. “Factors affecting business recovery immediately after Hurricane Katrina.” J. Contingencies Crisis Manage. 19 (3): 169–181. https://doi.org/10.1111/j.1468-5973.2011.00642.x.
Cremen, G., E. Seville, and J. W. Baker. 2020. “Modeling post-earthquake business recovery time: An analytical framework.” Int. J. Disaster Risk Reduct. 42 (Jan): 101328. https://doi.org/10.1016/j.ijdrr.2019.101328.
Dahlhamer, J. M., and K. J. Tierney. 1998. “Rebounding from disruptive events: Business recovery following the Northridge earthquake.” Sociological Spectrum 18 (2): 121–141. https://doi.org/10.1080/02732173.1998.9982189.
Dietch, E. A., and C. M. Corey. 2011. “Predicting long-term business recovery four years after Hurricane Katrina.” Manage. Res. Rev. 34 (3): 311–324. https://doi.org/10.1108/01409171111116321.
Economic Development Administration. 2014. “Joplin, Missouri, regional disaster and economic recovery and resiliency strategy.” Accessed January 30, 2023. https://joplincdbg.com/DocumentCenter/View/42/2014-Economic-Recovery-Strategy-PDF.
Fact Sheet. 2021. “Joplin, Missouri Hit by EF-5 Tornado on May 22, 2011.” Accessed May 22, 2021. https://www.joplinmo.org/DocumentCenter/View/1985/Joplin_Tornado_factsheet?bidId=.
Farrow, C. 2012. “Joplin tornado relief efforts raise $39 million.” Accessed July 26, 2021. https://philanthropynewsdigest.org/news/joplin-tornado-relief-efforts-raise-39-million.
FEMA. 2012. Multi-hazard loss estimation methodology, hurricane model: Hazus-MH 2.1 technical manual. Washington, DC: FEMA.
FEMA. 2018. Seismic performance assessment of buildings. Volume 1-methodology. FEMA P-58-1. Washington, DC: FEMA.
Ferrier, P. 2021 “Fort Collins launches $1.5M small business recovery fund with coronavirus relief money.” The Coloradoan. Accessed July 26, 2021. https://www.coloradoan.com/story/news/2020/09/08/covid-19-relief-fort-collins-launches-small-business-recovery-fund/5747986002/.
Friedland, C. J., and M. L. Levitan. 2011. “Development of a loss-consistent wind and flood damage scale for residential buildings.” In Solutions to coastal disasters 2011, 666–677. Reston, VA: ASCE.
General Liability. 2021a. “Manufacturing and mercantile rental property insurance.” Accessed July 26, 2021. https://generalliabilityinsure.com/small-business/manufacturing-mercantile-rental-property-insurance.html.
General Liability. 2021b. “Office buildings insurance.” Accessed July 26, 2021. https://generalliabilityinsure.com/small-business/office-buildings-insurance.html.
General Liability. 2021c. “Shopping center and strip mall insurance.” Accessed July 26, 2021. https://generalliabilityinsure.com/small-business/shopping-center-strip-mall-insurance.html.
Gotham, K. F. 2014. “Reinforcing inequalities: The impact of the CDBG program on post-Katrina rebuilding.” Hous. Policy Debate 24 (1): 192–212. https://doi.org/10.1080/10511482.2013.840666.
Karamouz, M., E. Rasoulnia, M. A. Olyaei, and Z. Zahmatkesh. 2018. “Prioritizing investments in improving flood resilience and reliability of wastewater treatment infrastructure.” J. Infrastruct. Syst. 24 (4): 04018021. https://doi.org/10.1061/(ASCE)IS.1943-555X.0000434.
Khan, M. A. U., and M. A. Sayem. 2013. “Understanding recovery of small enterprises from natural disaster.” Environ. Hazards 12 (3–4): 218–239. https://doi.org/10.1080/17477891.2012.761593.
Koliou, M., H. Masoomi, and J. W. van de Lindt. 2017. “Performance assessment of tilt-up big-box buildings subjected to extreme hazards: Tornadoes and earthquakes.” J. Perform. Constr. Facil. 31 (5): 04017060. https://doi.org/10.1061/(ASCE)CF.1943-5509.0001059.
Koliou, M., and J. W. van de Lindt. 2020. “Development of building restoration functions for use in community recovery planning to tornadoes.” Nat. Hazards Rev. 21 (2): 04020004. https://doi.org/10.1061/(ASCE)NH.1527-6996.0000361.
Lee, J. 2019. “Business recovery from Hurricane Harvey.” Int. J. Disaster Risk Reduct. 34 (Mar): 305–315. https://doi.org/10.1016/j.ijdrr.2018.12.004.
Li, Y., J. W. van de Lindt, T. Dao, S. Bjarnadottir, and A. Ahuja. 2012. “Loss analysis for combined wind and surge in hurricanes.” Nat. Hazards Rev. 13 (1): 1–10. https://doi.org/10.1061/(ASCE)NH.1527-6996.0000058.
Lin, P., and N. Wang. 2017. “Stochastic post-disaster functionality recovery of community building portfolios II: Application.” Struct. Saf. 69 (Nov): 106–117. https://doi.org/10.1016/j.strusafe.2017.05.004.
Lindsay, B. R. 2010. SBA disaster loan program: Overview and possible issues for congress. Washington, DC: Congressional Researcher Service.
Lombardo, F. T., D. B. Roueche, and D. O. Prevatt. 2015. “Comparison of two methods of near-surface wind speed estimation in the 22 May, 2011 Joplin, Missouri Tornado.” J. Wind Eng. Ind. Aerodyn. 138 (Mar): 87–97. https://doi.org/10.1016/j.jweia.2014.12.007.
Marshall, M. I., and H. L. Schrank. 2014. “Small business disaster recovery: A research framework.” Nat. Hazards 72 (2): 597–616. https://doi.org/10.1007/s11069-013-1025-z.
Masoomi, H., and J. W. van de Lindt. 2018. “Restoration and functionality assessment of a community subjected to tornado hazard.” Struct. Infrastruct. Eng. 14 (3): 275–291. https://doi.org/10.1080/15732479.2017.1354030.
McDonald, J. R., and K. C. Mehta. 2004. “A recommendation for an ENHANCED FUJITA SCALE (EF-Scale).” Accessed January 30, 2023. https://www.spc.noaa.gov/faq/tornado/ef-ttu.pdf.
McDonald, T. M., R. Florax, and M. I. Marshal. 2014. Informal and formal financial resources and small business resilience to disasters. No. 329-2016-12746. St. Louis: Federal Reserve Bank of St. Louis.
Memari, M., N. Attary, H. Masoomi, H. Mahmoud, J. W. van de Lindt, S. F. Pilkington, and M. R. Ameri. 2018. “Minimal building fragility portfolio for damage assessment of communities subjected to tornadoes.” J. Struct. Eng. 144 (7): 04018072. https://doi.org/10.1061/(ASCE)ST.1943-541X.0002047.
Morrish, S. C., and R. Jones. 2020. “Post-disaster business recovery: An entrepreneurial marketing perspective.” J. Bus. Res. 113 (Mar): 83–92. https://doi.org/10.1016/j.jbusres.2019.03.041.
NIST. 2020. Community resilience planning guide for buildings and infrastructure systems: A playbook. Gaithersburg, MD: NIST.
Orhan, E. 2016. “Lessons learned from businesses to ensure community level recovery in a postdisaster period: Case from Adapazari, Turkey.” Nat. Hazards Rev. 17 (1): 05015002. https://doi.org/10.1061/(ASCE)NH.1527-6996.0000191.
Pang, Y., and X. Wang. 2021. “Cloud-IDA-MSA conversion of fragility curves for efficient and high-fidelity resilience assessment.” J. Struct. Eng. 147 (5): 04021049. https://doi.org/10.1061/(ASCE)ST.1943-541X.0002998.
Pant, S., and E. J. Cha. 2019. “Wind and rainfall loss assessment for residential buildings under climate-dependent hurricane scenarios.” Struct. Infrastruct. Eng. 15 (6): 771–782. https://doi.org/10.1080/15732479.2019.1572199.
Paul, N., I. Almufti, M. Mieler, and J. S. Lee. 2018. “Estimation of post-earthquake recovery on a university campus using REDi methodology.” In Proc., 11th US National Conf. on Earthquake Engineering. Los Angeles: Earthquake Engineering Research Institute.
Pilkington, S. F., H. Mahmoud, J. W. van de Lindt, M. Koliou, and S. Smith. 2020. “Hindcasting loss and evaluating implications of track location for the 2011 Joplin, Missouri Tornado.” ASME J. Risk Uncertainty Eng. Syst. Part B: Mech. Eng. 6 (2): 020902. https://doi.org/10.1115/1.4046326.
Prevatt, D. O., W. Coulbourne, A. J. Graettinger, S. Pei, R. Gupta, and D. Grau. 2012. Joplin, Missouri, Tornado of May 22, 2011: Structural damage survey and case for Tornado-resilient building codes. Reston, VA: ASCE.
Ravid, S. A., K. John, B. S. Gill, and J. J. Choi. 2021. “Polls, politics and disaster relief: Evidence from Federal SBA loan programs.” Accessed March 22, 2021. https://papers.ssrn.com/sol3/papers.cfm?abstract_id=3797341.
Roueche, D. B., and D. O. Prevatt. 2013. “Residential damage patterns following the 2011 Tuscaloosa, AL and Joplin, MO tornadoes.” J. Disaster Res. 8 (6): 1061–1067. https://doi.org/10.20965/jdr.2013.p1061.
Salignac, F., A. Marjolin, R. Reeve, and K. Muir. 2019. “Conceptualizing and measuring financial resilience: A multidimensional framework.” Soc. Indic. Res. 145 (1): 17–38. https://doi.org/10.1007/s11205-019-02100-4.
SBA (US Small Business Administration). 2021a. “Economic injury disaster loans.” Accessed August 25, 2021. https://www.sba.gov/funding-programs/disaster-assistance/economic-injury-disaster-loans.
SBA (US Small Business Administration). 2021b. “Physical damage loans.” Accessed August 25, 2021. https://www.sba.gov/funding-programs/disaster-assistance/physical-damage-loans.
Smith, D. J., and D. Sutter. 2013. “Response and recovery after the Joplin tornado: Lessons applied and lessons learned.” Independent Rev. 18 (2): 165–188.
Standohar-Alfano, C. D., and J. W. van de Lindt. 2015. “Empirically based probabilistic tornado hazard analysis of the United States using 1973–2011 data.” Nat. Hazards Rev. 16 (1): 04014013. https://doi.org/10.1061/(ASCE)NH.1527-6996.0000138.
Stevenson, J. R., C. Brown, E. Seville, and J. Vargo. 2018. “Business recovery: An assessment framework.” Disasters 42 (3): 519–540. https://doi.org/10.1111/disa.12261.
Torres, A. P., M. I. Marshall, and S. Sydnor. 2019. “Does social capital pay off? The case of small business resilience after Hurricane Katrina.” J. Contingencies Crisis Manage. 27 (2): 168–181. https://doi.org/10.1111/1468-5973.12248.
US Economic Development Administration. 2021. “Revolving loan fund program.” Accessed August 25, 2021. https://www.eda.gov/rlf/.
van de Lindt, J. W., S. Pei, T. Dao, A. Graettinger, D. O. Prevatt, R. Gupta, and W. Coulbourne. 2013. “A dual-objective-based tornado design philosophy.” J. Struct. Eng. 139 (2). https://doi.org/10.1061/(ASCE)ST.1943-541X.0000622.
Vaughan, E. J., and T. Vaughan. 2007. Fundamentals of risk and insurance. New York: John Wiley & Sons.
Vickery, P. J., P. F. Skerlj, J. Lin, L. A. Twisdale Jr., M. A. Young, and F. M. Lavelle. 2006. “HAZUS-MH hurricane model methodology. II: Damage and loss estimation.” Nat. Hazards Rev. 7 (2): 94–103. https://doi.org/10.1061/(ASCE)1527-6988(2006)7:2(94).
Wang, W., J. W. van De Lindt, N. Rosenheim, H. Cutler, B. Hartman, J. Sung Lee, and D. Calderon. 2021. “Effect of residential building wind retrofits on social and economic community-level resilience metrics.” J. Infrastruct. Syst. 27 (4): 04021034. https://doi.org/10.1061/(ASCE)IS.1943-555X.0000642.
Wang, W. L., and J. W. van de Lindt. 2021. “Quantitative modeling of residential building disaster recovery and effects of pre-and post-event policies.” Int. J. Disaster Risk Reduct. 59 (Jun): 102259. https://doi.org/10.1016/j.ijdrr.2021.102259.
Wang, W. L., and J. W. van de Lindt. 2022. “Quantifying the effect of improved school and residential building codes for tornadoes in community resilience.” Resilient Cities Struct. 1 (1): 65–79. https://doi.org/10.1016/j.rcns.2022.04.001.
Wang, W. L., J. W. van De Lindt, B. Hartman, H. Cutler, J. L. Kruse, T. P. McAllister, and S. Hamideh. 2022a. “Determination of individual building performance targets to achieve community-level social and economic resilience metrics.” J. Struct. Eng. 148 (5): 04022045. https://doi.org/10.1061/(ASCE)ST.1943-541X.0003338.
Wang, X., R. K. Mazumder, B. Salarieh, A. M. Salman, A. Shafieezadeh, and Y. Li. 2022b. “Machine learning for risk and resilience assessment in structural engineering: Progress and future trends.” J. Struct. Eng. 148 (8): 03122003. https://doi.org/10.1061/(ASCE)ST.1943-541X.0003392.
Wang, Y., N. Wang, P. Lin, B. Ellingwood, H. Mahmoud, and T. Maloney. 2018. “De-aggregation of community resilience goals to obtain minimum performance objectives for buildings under tornado hazards.” Struct. Saf. 70 (May): 82–92. https://doi.org/10.1016/j.strusafe.2017.10.003.
Wasileski, G., H. Rodríguez, and W. Diaz. 2011. “Business closure and relocation: A comparative analysis of the Loma Prieta earthquake and Hurricane Andrew.” Disasters 35 (1): 102–129. https://doi.org/10.1111/j.1467-7717.2010.01195.x.
Watson, M. 2014. “Business recovery financing: Galveston, TX after Hurricane Ike.” Master’s thesis, Dept. of Landscape Architecture and Urban Planning, Texas A&M Univ.
Watson, M. 2021. “Disaster assistance winners and losers: Do small businesses benefit?” J. Am. Plann. Assoc. 88 (3): 305–318. https://doi.org/10.1080/01944363.2021.1980086.
Watson, M., S. Alaffa, A. Farquhar, P. Li, I. Rahmadina, C. Southerland, and B. Stephens. 2020a. “Federal disaster spending: Trends and observations between 2010-2019.” DesignSafe. https://doi.org/10.17603/ds2-pmds-kk73.
Watson, M., P. H. Thornton, and Y. Xiao. 2019. “Time will tell: Sequencing institutional logics to aid business recovery after natural disasters.” In Vol. 2019 of Proc., Academy of Management. Briarcliff Manor, NY: Academy of Management.
Watson, M., Y. Xiao, J. Helgeson, and M. Dillard. 2020b. “Importance of households in business disaster recovery.” Nat. Hazards Rev. 21 (4): 05020008. https://doi.org/10.1061/(ASCE)NH.1527-6996.0000393.
Weaver, K. M., and G. S. Vozikis. 2010. “The economic impacts of a hurricane disaster bridge loan program in southern Louisiana: The aftermath of Hurricanes Katrina and Rita.” J. Appl. Bus. Econ. 10 (4): 63.
Xiao, Y., and W. G. Peacock. 2014. “Do hazard mitigation and preparedness reduce physical damage to businesses in disasters? Critical role of business disaster planning.” Nat. Hazards Rev. 15 (3): 04014007. https://doi.org/10.1061/(ASCE)NH.1527-6996.0000137.
Xiao, Y., and S. Van Zandt. 2012. “Building community resiliency: Spatial links between household and business post-disaster return.” Urban Stud. 49 (11): 2523–2542. https://doi.org/10.1177/0042098011428178.
Yang, L., Y. Kajitani, H. Tatano, and X. Jiang. 2016. “A methodology for estimating business interruption loss caused by flood disasters: Insights from business surveys after Tokai heavy rain in Japan.” Supplement, Nat. Hazard. 84 (S1): 411–430. https://doi.org/10.1007/s11069-016-2534-3.
Zhang, Y., M. K. Lindell, and C. S. Prater. 2009. “Vulnerability of community businesses to environmental disasters.” Disasters 33 (1): 38–57. https://doi.org/10.1111/j.1467-7717.2008.01061.x.
Information & Authors
Information
Published In

Natural Hazards Review
Volume 24 • Issue 4 • November 2023
Copyright
This work is made available under the terms of the Creative Commons Attribution 4.0 International license, https://creativecommons.org/licenses/by/4.0/.
History
Received: Aug 2, 2022
Accepted: Mar 27, 2023
Published online: Jul 12, 2023
Published in print: Nov 1, 2023
Discussion open until: Dec 12, 2023
ASCE Technical Topics:
- Buildings
- Business management
- Commercial buildings
- Construction engineering
- Construction methods
- Disaster risk management
- Disasters and hazards
- Engineering fundamentals
- Engineering materials (by type)
- Facilities (by type)
- Financial management
- Financing
- Materials engineering
- Mathematics
- Models (by type)
- Natural disasters
- Owners
- Personnel (type)
- Personnel management
- Practice and Profession
- Probability
- Recycling
- Scale models
- Structural engineering
- Structures (by type)
Authors
Metrics & Citations
Metrics
Citations
Download citation
If you have the appropriate software installed, you can download article citation data to the citation manager of your choice. Simply select your manager software from the list below and click Download.
Cited by
- Maria Watson, Yu Xiao, Jennifer Helgeson, Using Disaster Surveys to Model Business Interruption, Natural Hazards Review, 10.1061/NHREFO.NHENG-1807, 25, 1, (2024).
- Wanting “Lisa” Wang, John W. van de Lindt, Blythe Johnston, P. Shane Crawford, Guirong Yan, Thang Dao, Trung Do, Katie Skakel, Mojtaba Harati, Tu Nguyen, Robinson Umeike, Silvana Croope, Andre R. Barbosa, Application of Multidisciplinary Community Resilience Modeling to Reduce Disaster Risk: Building Back Better, Journal of Performance of Constructed Facilities, 10.1061/JPCFEV.CFENG-4650, 38, 3, (2024).