Exploring Equity Challenges within Deeply Uncertain Water Supply Investment Pathways in the Federal District of Brazil
Publication: Journal of Water Resources Planning and Management
Volume 150, Issue 8
Abstract
Cities in South America face many of the urban water supply challenges experienced globally including increasingly extreme future hydroclimatic conditions and rapid population growth. These challenges are further exacerbated by historical socioeconomic inequity, informal land occupation, and poor water services management. In recent years, decision support tools that aid in structuring water supply management and infrastructure pathway policies that remain robust under deeply uncertain future scenarios have been developed. However, within the context of developing countries, failing to acknowledge the complex social and institutional dynamics and stark differences in residents’ experiences of climate extremes may lead to uneven adaptation capacities across socioeconomic strata. Toward this end, our study extends the deeply uncertain pathways framework by applying multiobjective optimization, disaggregated service area-level assessments of performance and vulnerability across time, and exploratory visual analytics in the Federal District of Brazil (FDB). We highlight the performance and robustness disparities between two water supply service areas in the FDB that differ in socioeconomic standing to reveal the impacts of deeply uncertain future hydroclimatic and socioeconomic scenarios on vulnerable populations. We further show that historical inequity renders poorer residents significantly more vulnerable to deeply uncertain future conditions without urgent and significant infrastructure investments. Overall, the outcomes of our study are largely applicable to urban water utilities in regions with high levels of historical regional inequity seeking to develop water management and infrastructure planning policies that are robust, adaptive, and equitable.
Introduction
The International Panel on Climate Change estimates that half of the world’s population experiences severe water scarcity for at least part of the year (IPCC 2022). Aptly, the United Nations Sustainable Development Goal 6 reflects this widespread international concern over water scarcity: “to ensure availability and sustainable management of water and sanitation for all” (United Nations 2015). Yet, providing water supply reliability in urban areas is a growing challenge (World Bank 2018). Recent studies estimate that one in four cities around the globe currently faces water stress, and the global urban population facing seasonal water shortages will grow to 1.9 billion by 2050 (McDonald et al. 2011; Mc Donald 2014; World Bank 2018). The transition to sustainable urban water supply is further challenged by socioeconomic inequity. In many countries, the accessibility to basic water supply among the richest population quantile is at least twice as high as the poorest quantile (WHO 2019).
Cities in South America exemplify many global urban water supply challenges. South America, the most urbanized region in the world, is home to more than 150 million people living in highly water-scarce areas (World Bank 2022). Rapid population growth marked by socioeconomic inequity, widespread informal occupation, and weak urban services management—particularly in the water and sanitation sector—characterizes many of the region’s urban centers (Carrera et al. 2018). Urban areas in Brazil—a country that contributes 48% of the South American Gross Domestic Product (GDP) and contains nearly 50% of the continent’s population (IMF 2023; United Nations 2022)—have recently grappled with severe water supply crises. Droughts in São Paulo from 2014 to 2016 and in the Federal District of Brazil from 2016 to 2018 have limited the water supplies for millions of residents and increased the price of water for economically disadvantaged communities (Escobar 2015; ADASA et al. 2018). The crisis in the Federal District of Brazil represents the many challenges that modern urban spaces face in the global south: increasingly frequent extreme climate events, rapid and unregulated urban growth, uncoordinated land occupation, economic and political uncertainties, and changes in water and sanitation regulation. The drivers underlying these challenges cause the evolution of these urban water systems to be deeply uncertain—when decision-makers are unable to identify or agree upon the system boundaries, outcomes of interest, and probability distributions of uncertainties that drive risk in urban water supply systems (Lempert et al. 2003; Walker et al. 2013; Kwakkel et al. 2016).
In the past decade, the literature on decision-making under deep uncertainty (DMDU) has significantly advanced decision support tools incorporating planned adaptation, risk management, and vulnerability assessment. This set of tools focuses on exploring system dynamics, discovering consequential scenarios, and finding robust strategies that perform acceptably in a wide range of possible futures (Marchau et al. 2019). DMDU frameworks such as robust decision-making (Lempert et al. 2006), many-objective robust decision-making (Kasprzyk et al. 2013), info-gap (Ben-Haim 2006), and decision scaling (Brown et al. 2012) have been widely applied in water supply planning contexts (for recent examples, see Miro et al. 2022; Housh and Aharon 2021; and Ray et al. 2020). In long-term water supply planning, the deeply uncertain pathways (DU Pathways) framework has been shown to be capable of aiding decision-makers seeking to develop robust and adaptive infrastructure investment and management policies (Trindade et al. 2019; Gorelick et al. 2022; Gold et al. 2023).
DU Pathways develops robust and adaptive water supply policies by using state-aware rule systems to trigger adaptive decisions, employing many-objective optimization to explore tradeoffs between conflicting objectives, and facilitating the exploration of scenarios that give rise to water supply vulnerability (Trindade et al. 2019). Building off Zeff et al. (2016), Trindade et al. (2019) first introduced the DU Pathways framework to support water supply planning in the Southeastern United States (US). Gold et al. (2022) expanded DU Pathways by contributing methodology to evaluate power dynamics in regional water supply systems, demonstrating the expanded framework on a hypothetical group of US water utilities. Gorelick et al. (2023) contributed to the development of DU Pathways by evaluating alternative financial agreement structures within water supply partnerships in the US. Gold et al. (2023) and Lau et al. (2023) further expanded DU Pathways, contributing new methodology to explore implementation uncertainty, equitable contract design, and time-evolving vulnerability.
Although DMDU approaches such as DU Pathways are increasingly applied in water supply planning contexts (Lempert et al. 2011; Steinschneider et al. 2015; Groves et al. 2019), incorporating equity considerations remains a core challenge (Fletcher et al. 2022). Many water supply management models and decision-support processes treat regional systems as homogeneous spaces and lack the ability to assess the influence of internal political, social, and economic inequities on vulnerable populations (Savelli et al. 2022). By simplifying or ignoring complex social dynamics, decision support frameworks can generate policies that may lead to or aggravate uneven adaptation capacities across actors within the system and different experiences of water crisis among its population (Zeitoun et al. 2016; Savelli et al. 2021). In developing countries such as Brazil, the path-dependent legacies of historical development of urban water supplies significantly influence current infrastructure access inequities, especially in sanitation and access to safe drinking water (de Jesus et al. 2023).
In recent literature, there are a limited number of published applications of DMDU frameworks on water supply applications in the global south. Taner et al. (2019) apply decision scaling to stress-test four candidate dam designs for a water supply project in Kenya, evaluating the robustness and vulnerability of prespecified design alternatives. Freeman et al. (2020) use multiobjective optimization and exploratory modeling to discover and evaluate water supply alternatives for Mexico City, Mexico, finding that meaningful coproduction and recognition of the regional socio-economic context are critical to developing resilient outcomes. Fletcher et al. (2019) use engineering options analysis to design adaptive water supply planning alternatives in Riyadh, Saudi Arabia, concluding that adaptive planning reduces financial risk without incurring significant water supply risk. Skerker et al. (2023) use a Bayesian learning approach to develop adaptive infrastructure planning alternatives for a stylized test case near Mombasa, Kenya—highlighting the benefits of adaptive planning for avoiding overbuilding in wet futures. The DU Pathways Framework, which incorporates elements of each of these studies—exploratory stress-testing, multiobjective, and adaptive planning—into a single urban water supply planning framework, has never been applied outside of the US.
This study contributes an extension of the DU Pathways framework that explicitly considers regional equity during the development of adaptive long-term water supply planning in the Federal District of Brazil (FDB). Development of the FDB has historically been marked by rapid population growth, inequitable land development and infrastructure access, and significant socioeconomic disparities (CODEPLAN 2020b). Regional water managers are currently developing long-term water supply management strategies but are strongly challenged by deeply uncertain hydroclimatic and socioeconomic factors. Our extension of DU Pathways couples multiobjective optimization, detailed temporal diagnostics of performance, and exploratory visual analytics to reveal the impacts of historical socioeconomic inequity within the FDB. The outcomes of our work will aid decision-makers in regions with high levels of regional inequity in implementing long-term water supply management strategies that account for deeply uncertain future scenarios, incorporate adaptive measures, and prioritize equitable access for all residents.
Case Study: The Federal District of Brazil
The Federal District of Brazil (FBD) is located in the central west region of Brazil [Fig. 1(a)] and is home to nearly 3 million people (IBGE 2023). The FDB has experienced rapid population growth since the 1960s when the federal capital of Brazil was transferred from Rio de Janeiro to the newly founded city of Brasilia within the FDB (CODEPLAN 2020b). Since the founding of Brasilia, the region has experienced rapid population growth, reaching an average annual growth rate of 2.28% between 2000 and 2010 (GDF 2017), which has led to both sustained increase in water demand and unplanned occupation in urban spaces (CODEPLAN 2020b).
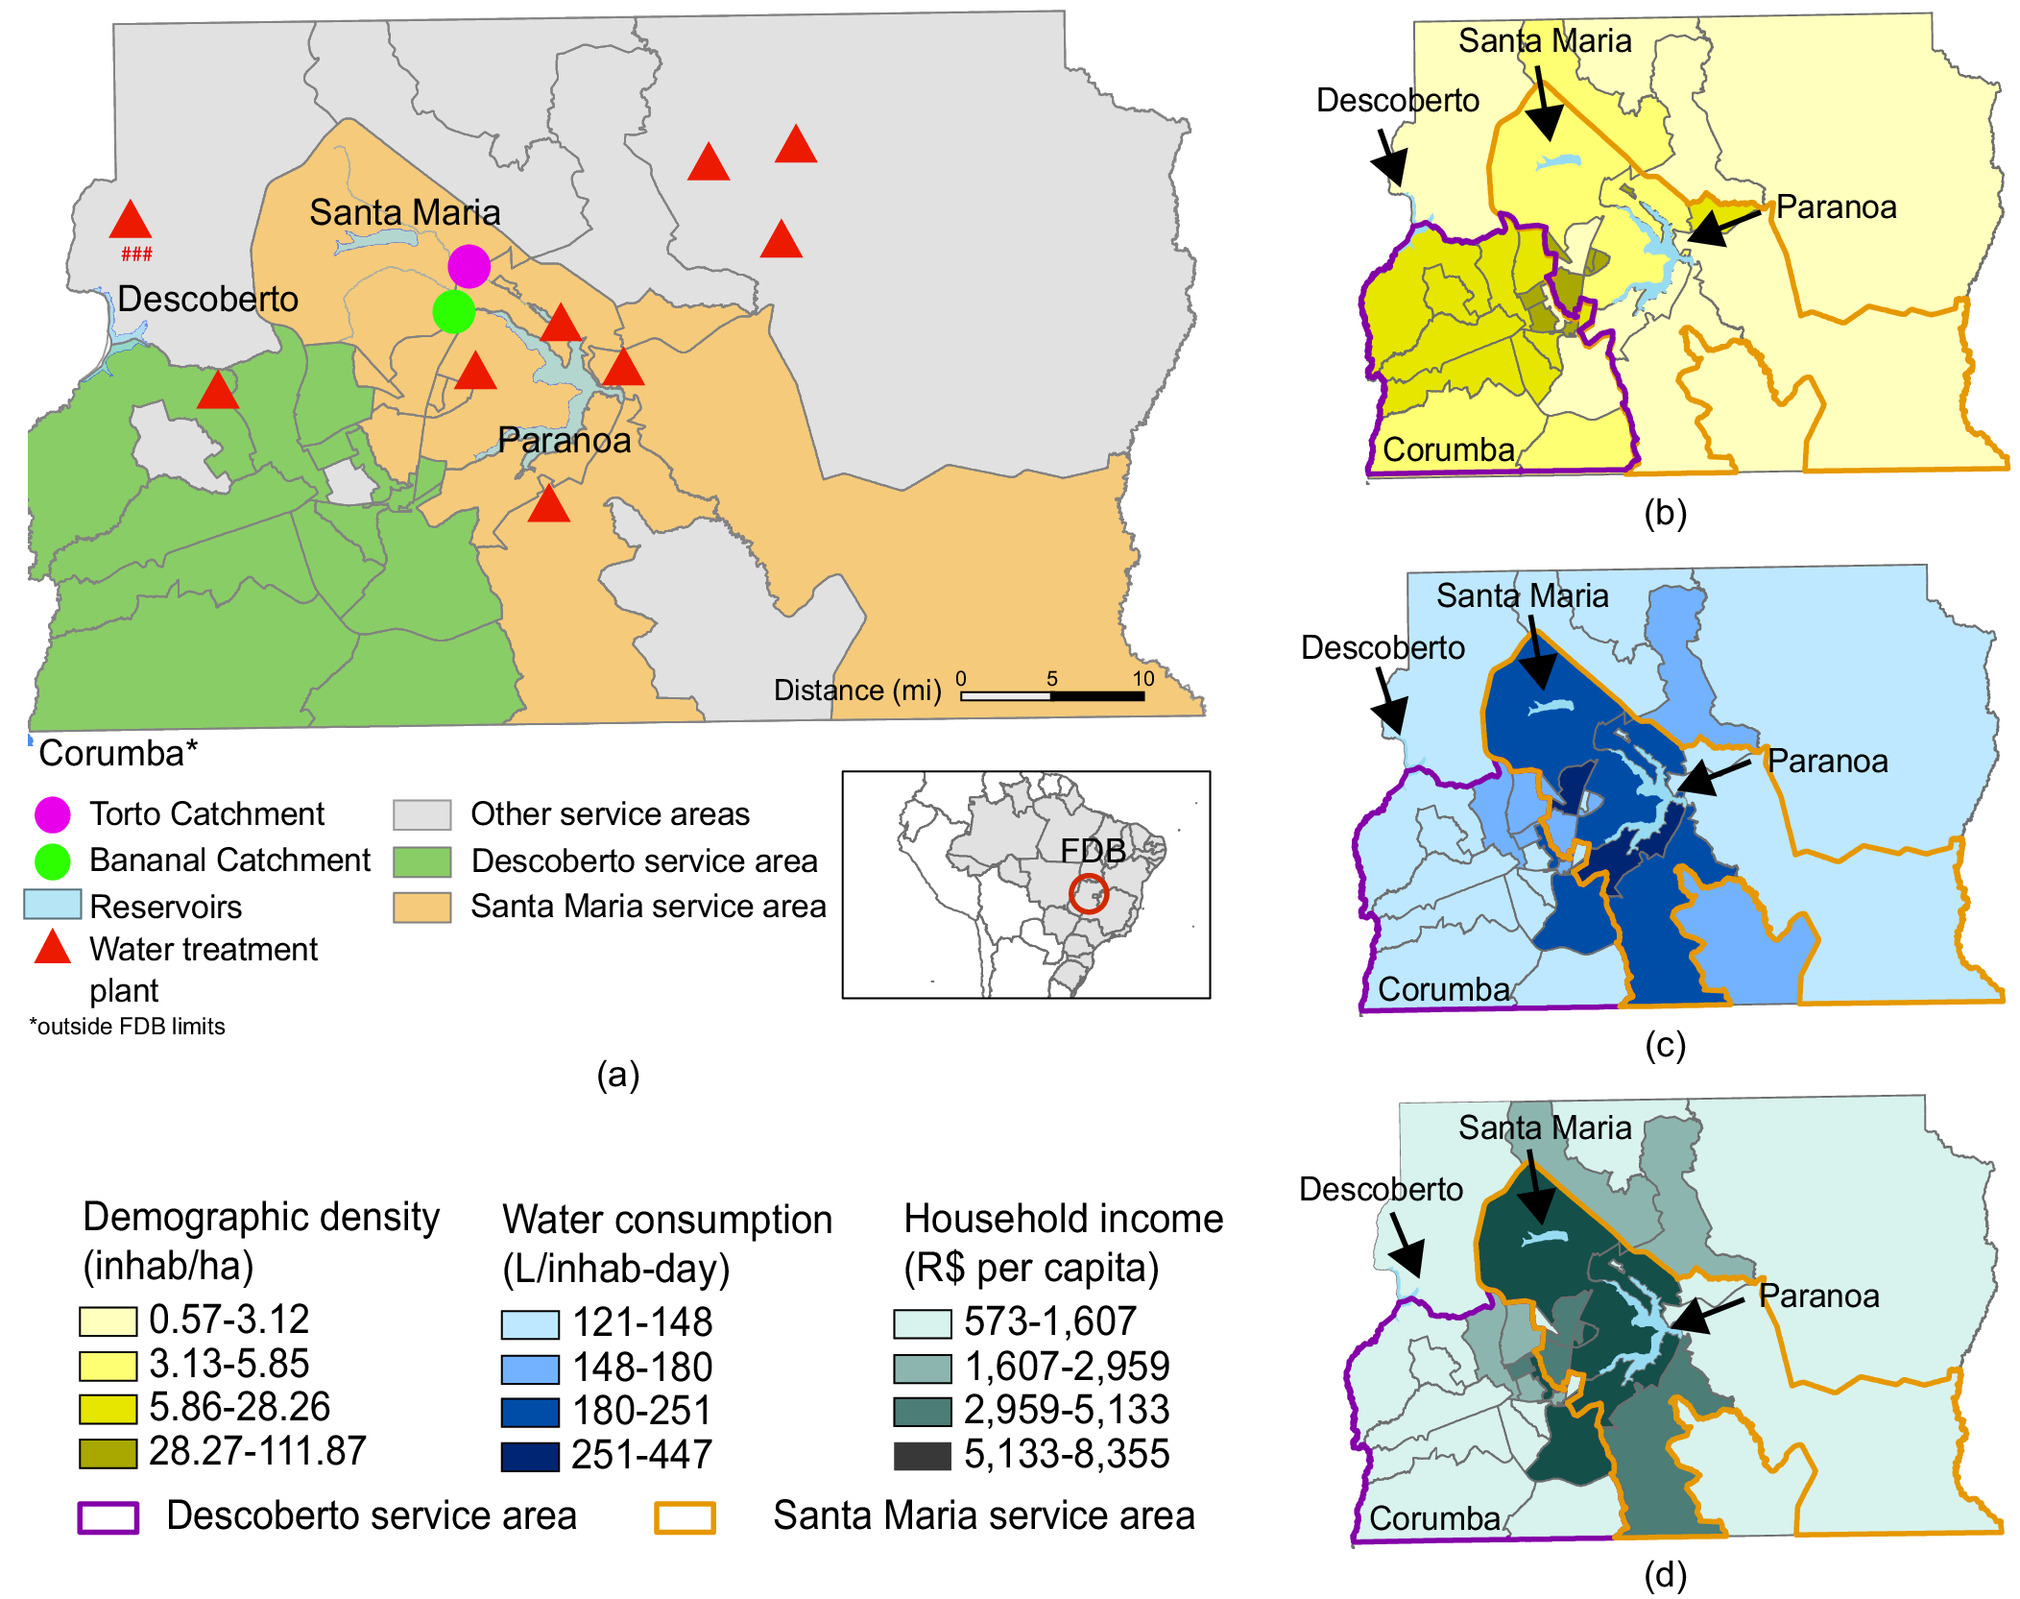
The development of the FDB has been marked by socioeconomic inequities. The high-income population—usually involved in government services—predominantly settled in planned urban areas that were designed and built with appropriate water supply infrastructure (GDF 2009). In contrast, the region’s low-income population—comprised mostly of people that migrated to work in the construction of Brasilia or that kept coming to the region searching for jobs—mainly moved into informal settlements surrounding the city (GDF 2009). These informal settlements initially contained little or no drinking water supply infrastructure and have received far less infrastructure investment than the affluent urban core. The legacy of uneven regional development is evident today in the wide disparities in demographic density and household income [Figs. 1(b and d)]. These disparities are also observed in household water consumption [Fig. 1(c)].
The FDB region’s water supply is managed by a single water utility, CAESB, which services the five main subsystems within the FDB. Two of these subsystems, Descoberto and Santa Maria, are the main supply sources in the region, providing water to more than 80% of the regional population, and therefore making them highly relevant to our study. These two subsystems operate separate reservoir networks but are jointly managed by CAESB. This enables water transfers between the two subsystems via a complex infrastructure network. The region’s water supply is primarily served by surface water reservoirs and withdrawal from local rivers [Fig. 2(b)]. The Descoberto reservoir (Descoberto subsystem) is the region’s largest supply source, serving approximately 465,000 households that primarily reside in the lower-income settlements outside of Brasilia. According to data from an FDB Survey (CODEPLAN 2020a), more than 98% of the population in the Descoberto service area is connected to the water supply network. However, specifically in informal settlements within the Descoberto area, most people have access to water supply using irregular connections to the utility water network. On the other hand, the wealthier urban core of Brasilia draws water from Santa Maria Reservoir, Paranoa Lake, and two rivers—the Bananal Stream and Torto Stream (Santa Maria subsystem). Around 200,000 households are served by these sources. A full list of regional water supply sources is provided in Table S1 .
Concern over the region’s water supply was heightened after a severe drought between 2015 and 2018. During this period, the Descoberto reservoir volume dropped to 5% of its total capacity, the lowest recorded storage volume since water levels began to be monitored in 1987 (ADASA et al. 2018). In response to the drought crisis, the regional government imposed severe water rationing and tariffs, promoted educational campaigns, reinforced integrated water inspections in big consumers, reactivated old, smaller catchments, installed new transfer networks between water sources, and invested in reducing water losses (ADASA et al. 2018). Higher-income populations were able to avoid the worst impacts of these policies by privately storing water in domestic water tanks. However, the rationing and tariffs were felt acutely by low-income populations that did not have the means to purchase water tanks. In response to the 2015–2018 crisis, the government established a new water supply source catchment in the Paranoa Lake, built a new water treatment plant, and also sped up the implementation of a new water production subsystem based upon the Bananal stream catchment (ADASA et al. 2018). While these options are expected to improve the region’s resilience to drought, the regional government anticipates the need to develop new infrastructure in the near future and is currently developing a regional infrastructure investment and management policy. The new policy will specify drought mitigation measures, including water-use restrictions, drought tariffs, and treated transfers between reservoir systems. The new policy will also develop an infrastructure investment plan, which will prioritize candidate infrastructure investments (listed in Table S2 ) and specify how these investments will be triggered.
Methodological Framework
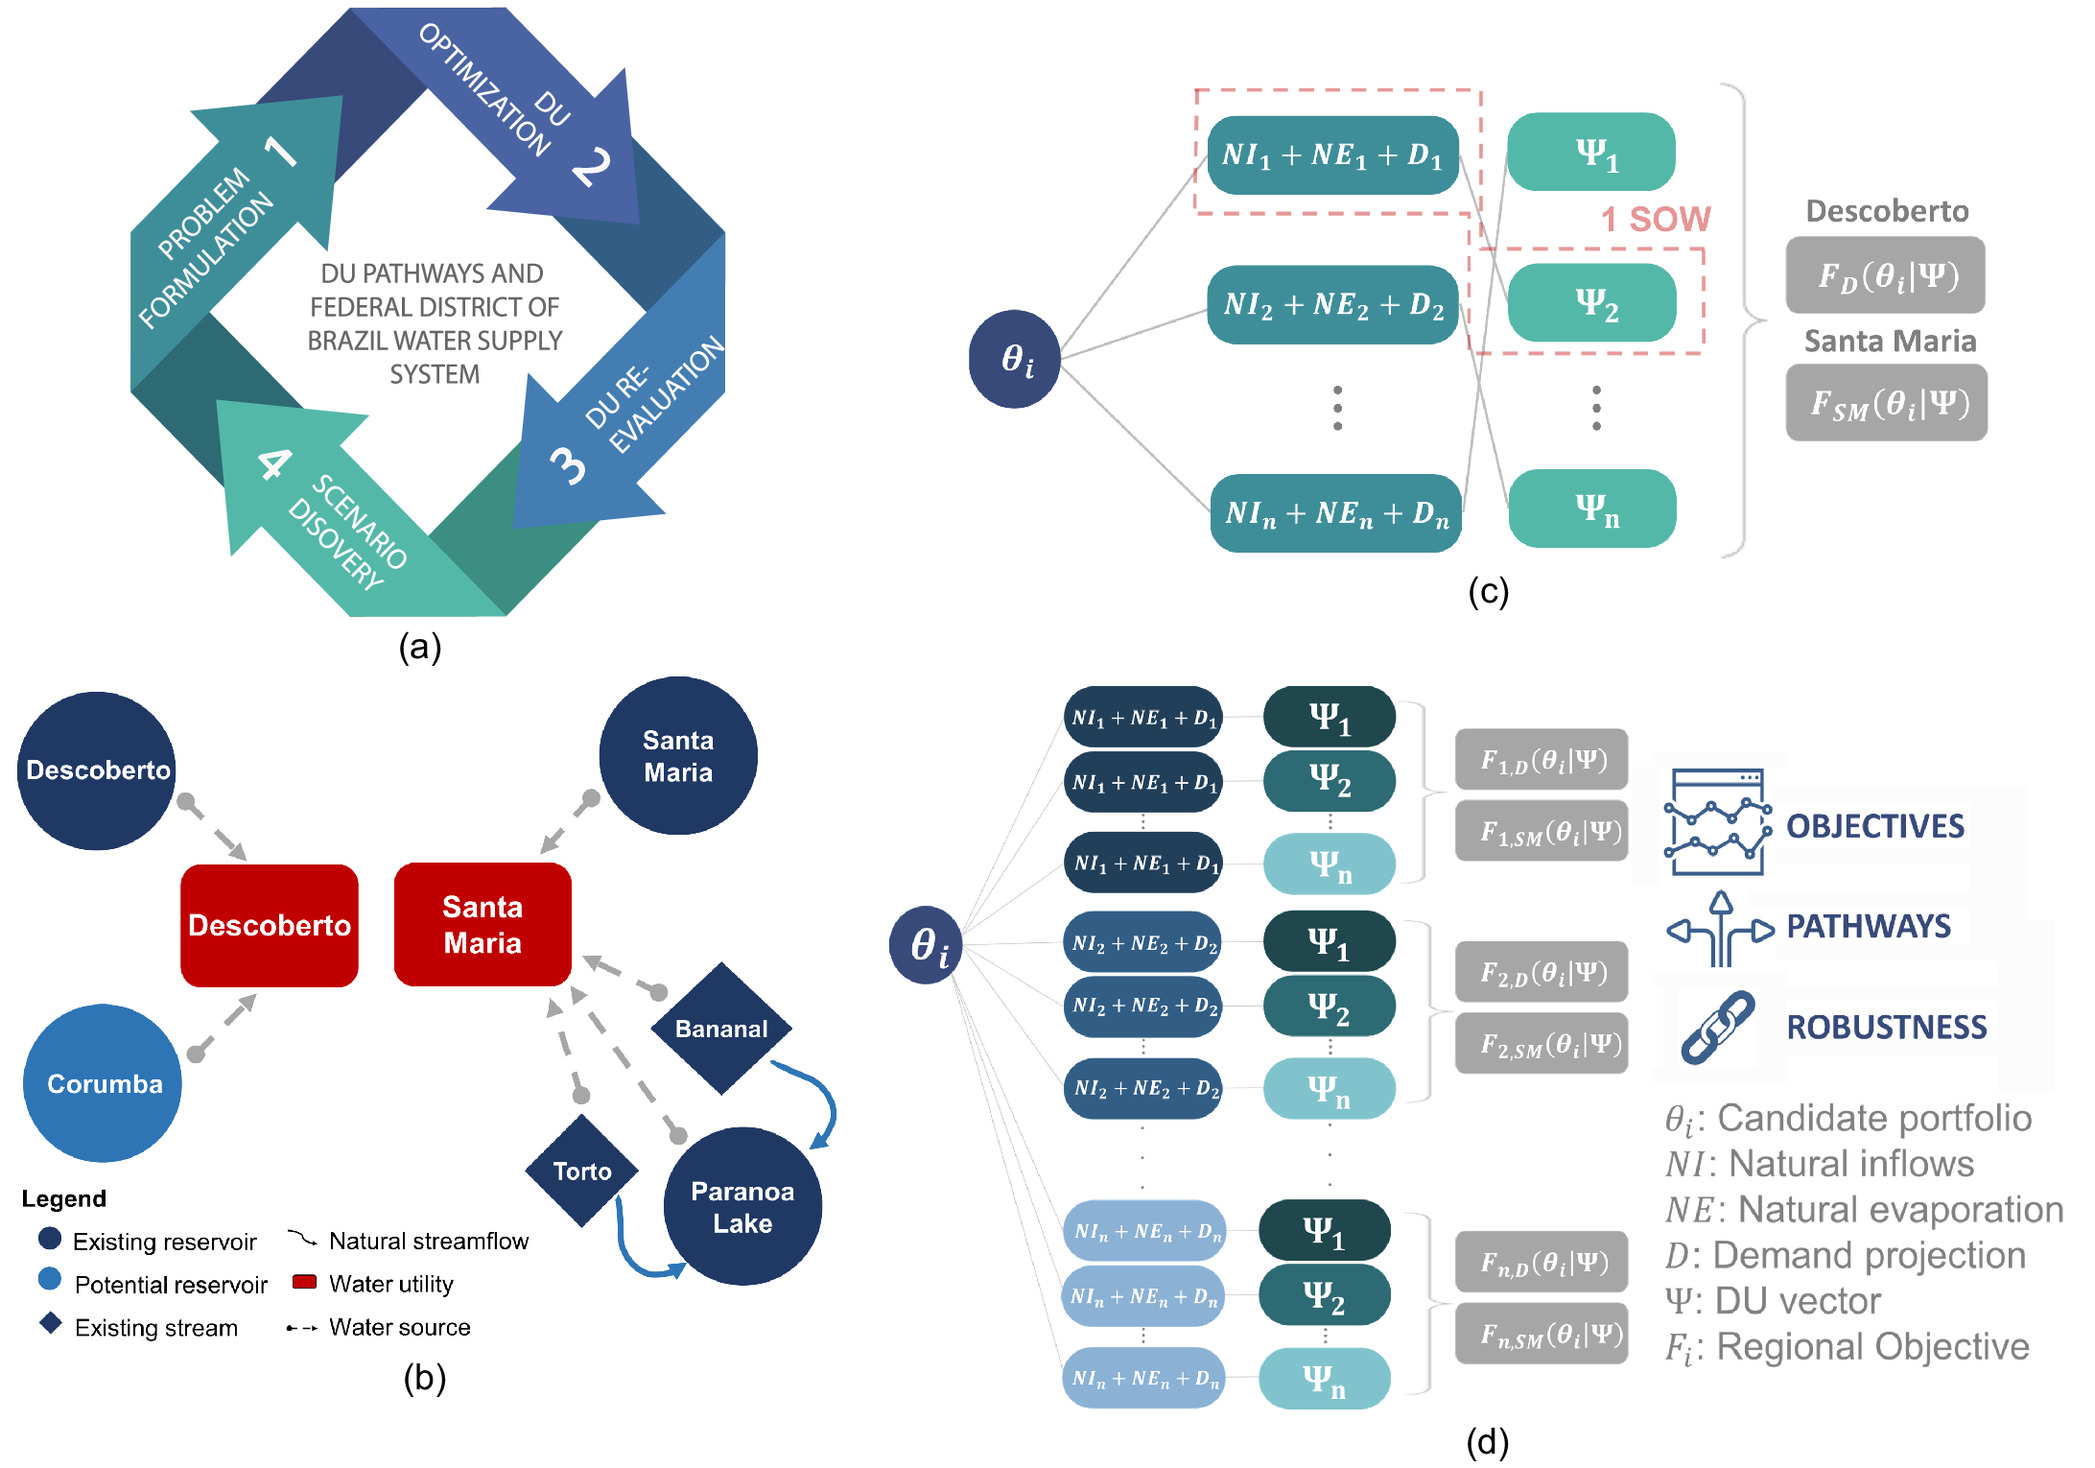
This work extends the DU Pathways framework’s (Trindade et al. 2019) discovery of robust water supply management and infrastructure investment policies to explore the systemic inequities in the FDB. This work represents the first time, to the best of our knowledge, that DU Pathways or a similar methodology has been applied to support water supply planning in the global south. Our methodology explicitly incorporates equity by disaggregating the performance of low-income and high-income service areas in the FDB and evaluating regional tradeoffs across multiple measures of system performance (Fletcher et al. 2022). We also contribute new diagnostic analyses that incorporate visual analytics to explore time-evolving performance and adaptation for the region’s most vulnerable population. Our methodology is composed of the four main steps, described in Fig. 2(a): problem formulation, deep uncertainty optimization (DU Optimization), deep uncertainty reevaluation (DU Reevaluation), and scenario discovery.
During problem formulation, we identify and mathematically define regional performance objectives, candidate policy actions (decision variables), relevant deep uncertainties, and sampling strategies for constructing DU states of the world (SOWs). Our problem formulation emphasizes regional equity by disaggregating regional performance across water service areas and applying Rawls’ difference principle during optimization to prioritize the performance of the region’s most vulnerable population. After formulating the problem, we perform DU Optimization, which uses many-objective evolutionary search (Coello Coello et al. 2007) across DU SOWs to discover candidate robust water supply management and infrastructure investment policies. We use the results of DU optimization to explore tradeoffs between conflicting objectives and evaluate regional performance over time.
We then perform DU reevaluation to evaluate each policy under a much broader and more computationally challenging set of DU SOWs. We use the results of DU reevaluation to examine the robustness of candidate policies using multiple robustness metrics (Herman et al. 2015; McPhail et al. 2018). Finally, we perform scenario discovery to explore which combinations of future scenarios generate vulnerability for the regional system and develop narrative scenarios to guide the decision-making process. This analysis offers consequential insights for regional water managers that can advance their understanding of current water supply risks and enhance the robustness of planning decisions to improve regional equity while balancing supply reliability and financial stability.
Problem Formulation
In this study, we subdivided the main water supply system within the FDB (both managed by a regional utility called CAESB) into two service areas, Descoberto and Santa Maria, to better capture the effects of regional socio-economic inequity. We model the regional system using the representation of the infrastructure and available projects developed by Giacomazzo (2020), visualized in Fig. 2(b). The system model was created in WaterPaths, a generalizable, cloud-compatible, open-source exploratory modeling system designed to support long-term regional water supply planning (Trindade et al. 2020).
We formulate the water supply planning problem as the many-objective optimization under DU SOWs problem shown in Eqs. (1)–(4). This formulation searches for the set of actions (a policy denoted by ) that minimizes objective function . For both service areas we seek to maximize water supply reliability (), minimize water-use restriction frequency (), minimize the infrastructure net present cost (), minimize the peak financial cost of drought mitigation and debt payments (), and minimize the worst-case cost of drought mitigation actions (). These objectives were selected based on prior studies on regional water supply planning that have been shown to holistically capture stakeholders’ priorities (Matrosov et al 2015; Borgomeo et al 2018; Hall 2019; Gorelick et al 2023; Gold et al. 2022) and implementations of DU Pathways in the US (Zeff et al. 2016; Trindade et al. 2019; Gold et al. 2022; Gorelick et al. 2023). The formulations for each objective were reviewed with CAESB to ensure that the choice of objectives reflected the preferences of regional decision-makers.
The reliability and restriction frequency objectives are particularly important for evaluating the equity of water supply policy alternatives. Like in many regions of the global south, underserved communities in the FDB experience disproportional impacts from supply disruption (measured by the reliability objective) because they do not have access to private sources of water such as cisterns (ADASA et al. 2018; Saveli et al. 2021). Water-use restrictions and associated tariffs (captured by the restriction frequency objective) increase the financial burden on lower-income populations and impact customers’ health and quality of life (Calverley and Walther 2022; Leflaive and Hjort 2020). To ensure the many-objective search prioritizes equity we employ a minimax formulation where the regional objective values are taken as the worst value for each objective between the two service areas. The minimax formulation is an application of Rawls’ difference principle that prioritizes equity by maximizing the performance of the least-well-off population (Hammond 1976; Rawls 1999):where = objective values for the Descoberto service area; and = objective values for the Santa Maria service area. Note that the objective vector, , is being minimized, and the max operators on each element of carry out the minimax formulation. Performance objectives are described in detail in Eqs. (S5 )–(S14 ).
(1)
(2)
A policy, , is mathematically expressed using Eq. (3):where = risk-of-failure (ROF) trigger threshold for educational campaigns; = trigger threshold for rationing and contingency tariffs; = ROF trigger threshold for water transfers; = ROF trigger threshold for infrastructure construction; = annual contributions to the contingency fund; and = matrix containing the construction orders for implementing each infrastructure option.
(3)
To develop policies that dynamically respond to evolving system risk, DU Pathways uses metrics known as risk of failure (ROF) to adaptively trigger both short-term drought mitigation actions and long-term infrastructure investment decisions (Zeff et al. 2016; Trindade et al. 2019). Drought mitigation actions, including water-use restrictions () and treated transfers (), are triggered using short-term ROF, a dynamic representation of a service areas evolving capacity-to-demand ratio, calculated on a weekly basis. Infrastructure investment decisions are triggered based on long-term ROF, which is calculated annually and describes the risk of a supply failure in a given year if all reservoirs begin the year at full capacity. ROFs allow system managers to adapt their strategies in response to changing future conditions. For more detail on the ROF formulation used in this work, see Appendix S1 .
Both drought mitigation actions and infrastructure investment can exacerbate the financial risk of FDB utility (ADASA et al. 2018). To manage financial risks, recent studies have recommended using financial instruments such as contingency funds and third-party drought insurance (Zeff et al. 2014; Gorelick et al. 2022). Since the FDB’s water supply utilities only consider the use of contingency funds (), this work will suggest exclusively the application of this measure, of which its operation is presented in Eq. (4):where = contingency fund; = total annual revenue in year ; = percentage of annual revenue allocated to the contingency fund (annual contributions to the contingency fund) in year ; and = interest rate.
(4)
Many-Objective Optimization
We use the Borg Multi-Objective Evolutionary Algorithm (MOEA; Hadka and Reed 2013) to find an approximate Pareto set of nondominated solutions to the many-objective optimization problem described in the Problem Formulation section. Policies in the Pareto set are “nondominated,” meaning they perform better than all other policies in at least one of the objectives of function . The Borg MOEA is a global population-based evolutionary algorithm that employs multiple evolutionary search operators that are adaptively selected based on their ability to find optimal solutions. The Borg MOEA also uses epsilon dominance archiving (Laumanns et al. 2002), stagnation detection, and randomized restarts to avoid local optima and overcome dominance resistance (Hanne 2001; Hadka and Reed 2013). These characteristics have resulted in the Borg MOEA demonstrating superior performance for exploration and optimization of complex, high-dimensional problems with nonlinear, discontinuous decision spaces (Reed et al. 2013; Zatarain Salazar et al. 2017; Gupta et al,. 2020).
To discover policies that maintain robust performance across DU futures, we incorporate DU into the many-objective search process using DU Optimization (Trindade et al. 2019). DU Optimization utilizes the sampling scheme illustrated in Fig. 2(c). DU Optimization has been shown to produce robust policies with acceptable performance over a large ensemble of SOWs (Trindade et al. 2017; Gold et al. 2022). During this process, each candidate policy is evaluated across 1,000 DU SOWs that are composed of random parings of one DU sample () and a set of natural inflows (NI) and natural evaporations (NE) that have time horizons of 40 years. Here, the goal is to efficiently explore the implications of hydroclimatic and socio-economic uncertainty on the performance of a specific policy. We utilize visual analytics (Keim 2002) to explore multiple perspectives of policy performance, visualize differences between the Descoberto and Santa Maria service areas, and examine how performance changes over time.
DU Reevaluation
During DU reevaluation, the optimized portfolios are stress tested across a wider, more challenging, and computationally demanding set of deeply uncertain states of the world (SOWs) using the DU reevaluation sampling scheme shown in Fig. 2(d). The first step of DU reevaluation is to produce a new set of 1,000 new natural inflow and evaporation, and demand time series, following the same methodology presented in the Problem Formulation section. The DU samples are represented in a matrix , composed of 1,000 LHS samples of infrastructure construction, policy effectiveness, and socio-economic DU factors that describe a large ensemble of potential future scenarios that include extreme events. The DU samples in DU reevaluation are structured by coupling one hydroclimatic realization with one vector of DU factors, or one row of , as illustrated in Fig. 2(d). Under DU reevaluation, each Pareto-approximate policy is evaluated across 1,000,0000 total simulations, each representing a sample of NI, NE, and D with one sample from .
We evaluate the performance of candidate policies using three measures of robustness (Herman et al. 2015; McPhail et al. 2018). Satisficing, , measures the fraction of SOWs that each solution meets a set of performance criteria, as shown in Eq. (5):wherewhere = vector of performance criteria. Given the lack of extensive applications of DMDU approaches in Brazilian systems, we first evaluate satisficing with a baseline set of criteria chosen to represent “high performance,” and then evaluate how changing perceptions of acceptable performance impacts perceived robustness.
(5)
(6)
We complement the satisficing-based robustness with two measures of regret. Type I regret (R1) measures how much a policy’s performance deviates from its performance under an expected “baseline” SOW (Kasprzyk et al. 2013; Herman et al. 2015). In effect, R1 measures the consequences of incorrect assumptions regarding the future when implementing a given policy. R1 calculates regret as the 90th percentile deviation of an objective within a given SOW from its performance in the baseline SOW across all SOWs, maximized across all objectives, as shown in Eqs. (7) and (8):where = value of objective in the baseline SOW ; = value of objective calculated in SOW ; and = deviation of objective in SOW from its performance in (Herman et al. 2015).
(7)
(8)
Our final measure of robustness, Type II regret (R2), measures the deviation between objective ’s performance and that of the best-possbile value for objective across all policies within the prevailing state of the world (Herman et al. 2015). The value of is normalized by the actual objective itself as the latter value may approach zero due to the minimization approach of the objectives’ formulation. This metric provides a measure of the impact of choosing the wrong policy alternative across SOWs (Savage 1951):where = minimum (best) value of objective taken across all policies under SOW .
(9)
(10)
Scenario Discovery
We perform scenario discovery (Groves and Lempert 2007; Bryant and Lempert 2010) to develop narratives of future change to inform the selection and implementation of infrastructure investment and management policy. In its traditional form, scenario discovery uses machine learning and data mining algorithms to map which combinations of DU SOWs generate vulnerability for candidate policies (Groves and Lempert 2007; Bryant and Lempert 2010; Jafino and Kwakkel 2021). In this work, we use gradient boosted trees (GBT) to discover consequential combinations of DU factors (Freund et al. 1999). GBT is a tree-based machine learning method that predicts the probability of a policy’s success or failure. We selected GBT because of its model-free, unbiased implementation that can classify nonlinear, nonconvex, discontinuous success–failure regions in a visually interpretable manner. In this study, we expand traditional scenario discovery to include a temporal component by coupling output from GBT with a visual exploration of system performance over time. This coupling yields narrative scenarios that capture not only how vulnerability occurs, but also when it occurs in the water supply system.
Computational Experiment
The complexity of the FDB system motivated the use of WaterPaths (Trindade et al. 2020), an open-source, cloud-compatible software capable of capturing the unique characteristics of regional water supply systems and support the decision-making process through exploratory modeling. In this work, the baseline version of WaterPaths was modified to more accurately represent FDB water supply system. In the DU Optimization phase, WaterPaths was coupled with Master-Worker (MW) Borg (Reed and Hadka 2014; Hadka and Reed 2015). This implementation of the Borg MOEA was selected as it has been previously shown to be effective, efficient, and reliabile for WaterPaths-based DU Optimization application (Trindade et al. 2019). In this study we used five MW Borg MOEA seed trials; each one ran on 240 Intel E5-2680 CPUs @ 2.7 GHz, 128 GB of RAM with 1,000 realizations for each function evaluation [Fig. 2(c)]. The final reference Pareto approximate set was attained by selecting Pareto dominant policies across the five seeds when evaluated across a new sample of 1,000 realizations. The ranges for the decision variables are presented in Tables S3 and S4 , while the significance of the objective values is presented in Table S5 .
Results and Discussion
Many-Objective Optimization under Deep Uncertainty
Fig. 3 shows the Pareto-approximate water supply infrastructure investment and management policies discovered through many-objective DU optimization. The Pareto-approximate set includes a total of 91 policies, each representing a set of ROF-based rules that coordinate drought mitigation actions and infrastructure investment pathways. Figs. 3(a and b) show the performance of Pareto-approximate policies for the Descoberto [Fig. 3(a)] and Santa Maria [Fig. 3(b)] service areas on parallel-axis plots. Each line in Figs. 3(a and b) represents a Pareto-approximate regional policy, and each vertical axis represents a performance objective. The orange lines are policies in which no new infrastructure is built for Descoberto and Santa Maria respectively, while the blue lines are policies that require significant infrastructure investments to achieve high performance in other objectives. The remaining gray lines are the Pareto-approximate policies that do not belong to either group. The point where each line crosses a certain axis corresponds to the policy performance for a specific objective. The slope of the lines between each axis denotes the degree of tradeoff, where a steeper slope indicates that a stronger tradeoff exists between two objectives. The arrow indicating direction of preference indicates whether a higher or lower value of the performance objective is preferable, depending on the objective. For all objectives except reliability, lower values approaching zero are preferred, with the direction of preference being downward. The axis for reliability is vertically flipped to align with the direction of preference being downward, as higher values of reliability are preferred.
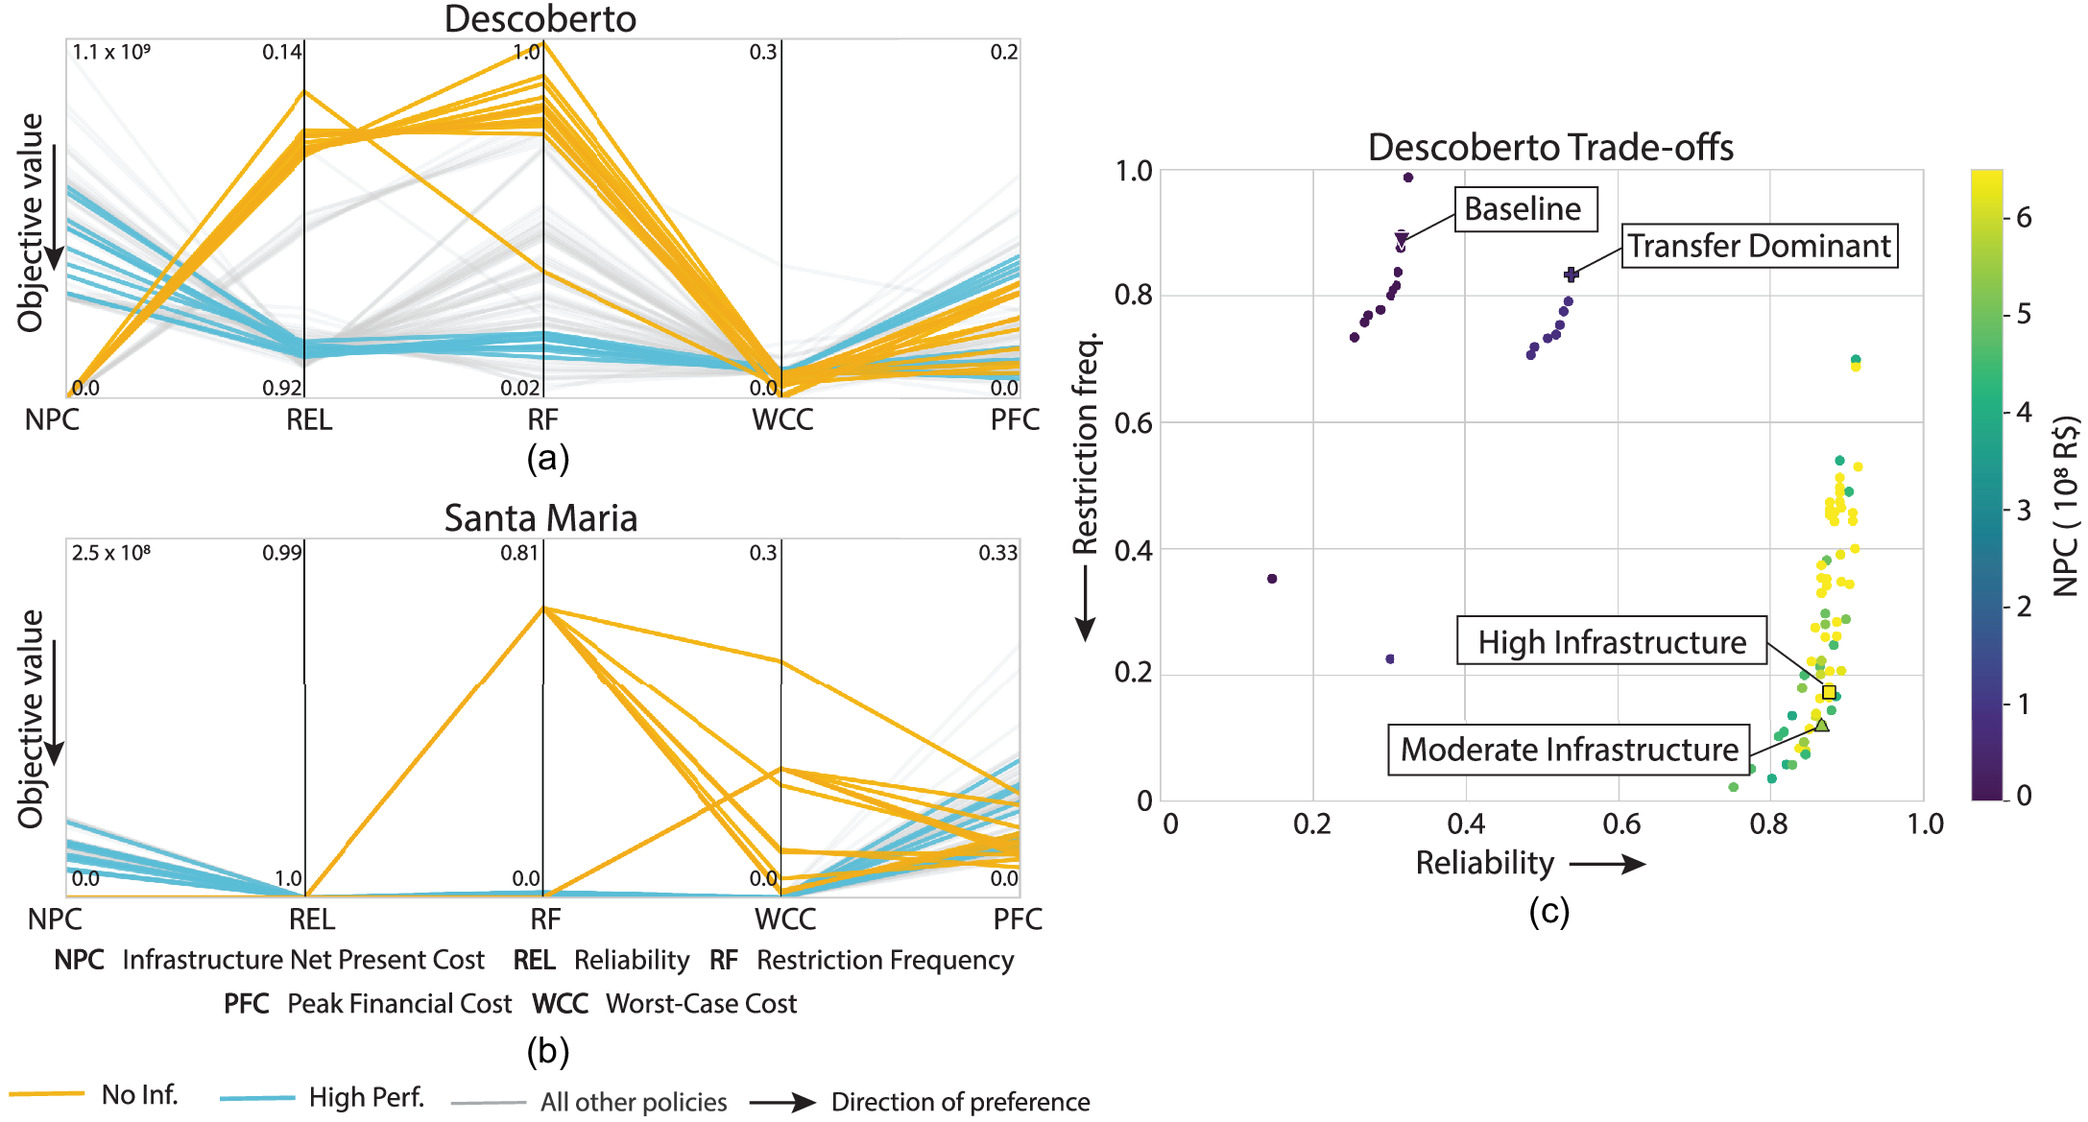
Figs. 3(a and b) highlight the necessity of infrastructure to maintain regional water supply reliability. Policies that contain zero infrastructure net present cost [the orange lines in Figs. 3(a and b)] yield poor performance for both service areas. Without infrastructure investment, the Descoberto service area can achieve a maximum reliability of 56% and must experience high frequency of water-use restrictions in most future years. The Santa Maria service area also struggles under policies that do not include infrastructure investment. When the infrastructure net present cost is zero, Santa Maria either experiences severe levels of water-use restrictions or is exposed to worst-case drought management costs in excess of 20% of annual volumetric revenue (AVR).
We highlight a set of “highest-performance” regional policies [blue lines in Figs. 3(a and b)] that maintain reliability over 85% and a restriction frequency of less than 20% for both service areas. These policies require a minimum infrastructure net present cost of R$320,000,000 in the Descoberto service area and R$83,000,000 in the Santa Maria service area. While these policies maintain relatively high performance for both service areas when compared to policies that do not employ infrastructure investment, there is a wide discrepancy between the best achievable performance of the two service areas. Under high-performance policies, the affluent Santa Maria service area maintains nearly 100% reliability, with little or no restriction frequency and modest drought management costs. In contrast, Descoberto, the lower-income service area with a predominantly low-income population, achieves a maximum reliability of 92% and a minimum of 11% restriction frequency. The contrast between the performance of Descoberto and Santa Maria—both evaluated across the same set of hydroclimatic scenarios and deep uncertainties—highlights the impact of historical regional inequity in water supply infrastructure investment, which has left Descoberto vulnerable to water supply failures.
Fig. 3(c) provides more detail on how Pareto-approximate policies perform in the Descoberto service area. Fig. 3(c) illustrates the strong tradeoff between Descoberto’s reliability and restriction frequency and highlights how increasing infrastructure investment shifts this tradeoff surface to improve performance under both objectives. Policies that do not incorporate infrastructure (colored dark blue) perform poorly in both reliability and restriction frequency. In contrast, most policies that make substantial infrastructure investments (green and yellow points) maintain reliability values greater than 80% and have lower restriction frequency.
Using these results, we highlight four policies for further evaluation. First, we designate a “baseline” policy [diamond in Fig. 3(c)], which does not make use of infrastructure investments or treated transfers, instead relying on water-use restrictions to manage drought conditions. This policy performs poorly in both reliability and restriction frequency. Second, we denote a “transfer-dominant” policy [cross in Fig. 3(c)] that makes use of both water-use restrictions and treated transfers. This policy does not include new infrastructure in the Descoberto service area but makes modest infrastructure investments in Santa Maria’s treatment capacity. The investment in additional Santa Maria treatment capacity may increase the region’s ability to send treated water to Descoberto, resulting in improved reliability with respect to the baseline policy and suggesting a strong interdependency between the two service areas. Third, we highlight a “moderate-infrastructure” compromise policy [triangle in Fig. 3(c)] that performs substantially better in reliability and restriction frequency when compared to the baseline and transfer-dominant policies but requires an average of R$545 million infrastructure net present cost. Finally, we select a “high-infrastructure” compromise policy [square in Fig. 3(c)] that has an infrastructure net present cost of R$624 million and improves Descoberto’s reliability when compared with the moderate-infrastructure policy, though it also incurs an increase in restriction frequency. We will use the selected policies throughout the rest of this section to explore the dynamics of the regional system and the performance gap between the two water service areas.
Fig. 4 illustrates the decision variables that compose each of the four policies highlighted in Fig. 3(c) and the infrastructure pathways generated by each policy. Decision variables are shown in Figs. 4(a–d), where each axis represents a decision variable, with values further from the center representing increasing risk aversion and use of the associated management actions, as well as a lower ROF threshold value. Each policy represents an adaptive rule system that triggers drought management measures and infrastructure investments in response to observed SOWs. Figs. 4(e–l) summarize these infrastructure pathways for both service areas by clustering high, medium, and low infrastructure SOWs and plotting the average year that each infrastructure option is triggered for each cluster. The frequency that each infrastructure option is triggered is represented by the shading behind the clusters.
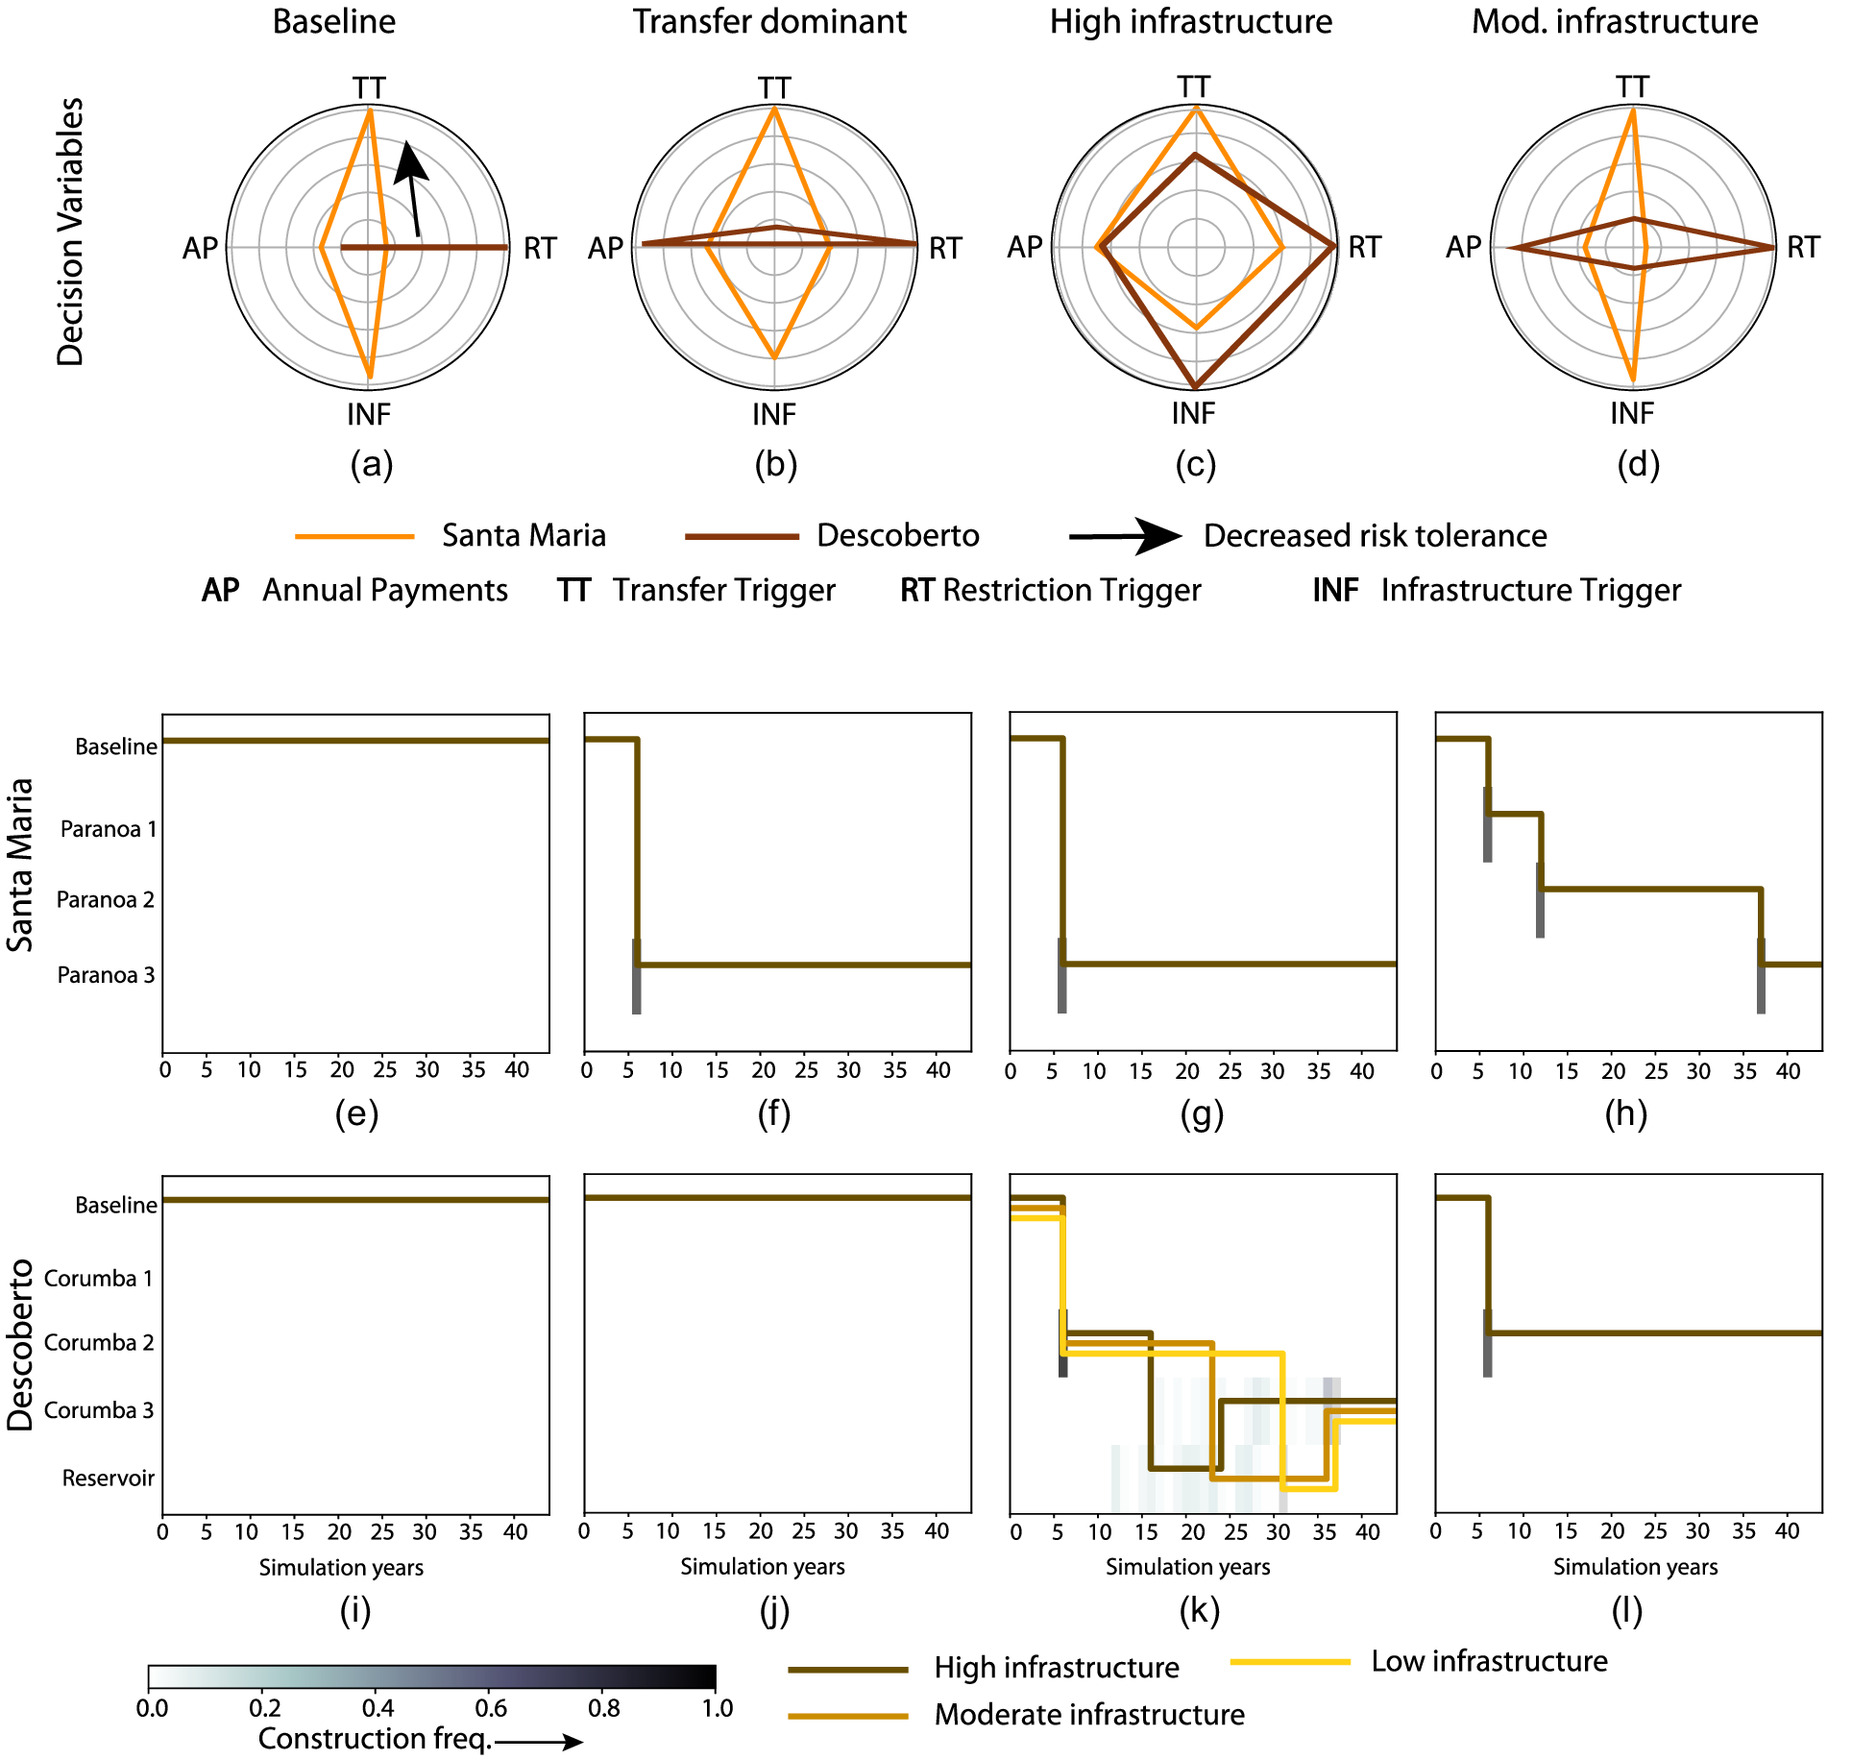
Under the baseline policy [Fig. 4(a)], Descoberto does not utilize treated transfers or infrastructure investment. Instead, drought is managed solely through water-use restrictions. Under this policy, the Santa Maria service area utilizes both treated transfers and new infrastructure investment. However, the infrastructure pathways [Figs. 4(e and i)] reveal that no investments are made for either service area under this policy. The transfer-dominant policy [Figs. 4(b, f, j)] makes use of treated water transfers and water-use restrictions to manage drought in the Descoberto service area but does not include any new infrastructure investment in the area.
The policy also utilizes water-use restrictions and treated water transfers to manage drought risk in the Santa Maria service area and includes the potential for new infrastructure development in Santa Maria to ensure enough treated water for transfers. This reinforces the hypothesis of high interdependency between the two service areas. Examining the infrastructure pathways for this policy reveals that it expands the surface water treatment capacity in the Santa Maria system by developing the largest option of the Paranoa Treatment Expansion project.
Under the high-infrastructure compromise [Figs. 4(c, g, k)], both service areas utilize water-use restrictions, treated transfers, and infrastructure investment to manage long-term water supplies. The Corumba 2 expansion project is built as early as possible in the Descoberto service area under every SOW, highlighting that this project is essential to Descoberto’s performance. The high-infrastructure compromise also expands the Descoberto reservoir, but the timing of this investment infrastructure varies depending on the challenging nature of observed SOWs. The high-infrastructure policy also constructs the largest Paranoa treatment expansion in the Santa Maria service area under all SOWs. Like the Corumba 2 expansion, this project is built as early as possible, highlighting that it likely plays a key role in regional reliability. Under the moderate-infrastructure compromise policy [Figs. 4(d, h, l)], both service areas again utilize treated transfers, water-use restrictions, and infrastructure investment. Like the high-infrastructure compromise, this policy builds the Corumba 2 expansion in the Descoberto service area under all SOWs [Fig. 4(l)]. In the Santa Maria Service area, all three Paranoa treatment capacity expansion projects are developed over the simulation period [Fig. 4(h)].
Temporal Diagnostics
Fig. 5 shows Descoberto’s reliability [Fig. 5(a)], restriction frequency [Fig. 5(b)], average annual transfer volume [Fig. 5(c)], and average annual debt service [Fig. 5(d)] as a function of time. These values are calculated across 1,000 hydrologic conditions (composed of natural inflows and evaporation) under a “base SOW,” where all DU factors are set to 1. These settings represent optimistic system conditions that do not account for deep uncertainty. Instead, they serve to decompose the behavior of the system by the hydrologic scenario (Hamilton et al. 2022), highlighting plausible extreme future scenarios that draw attention to the effects of internal variability on the performance of the system over time (Lehner and Deser 2023). More detailed exploration on the effects of deep uncertainties will be performed in the following sections.
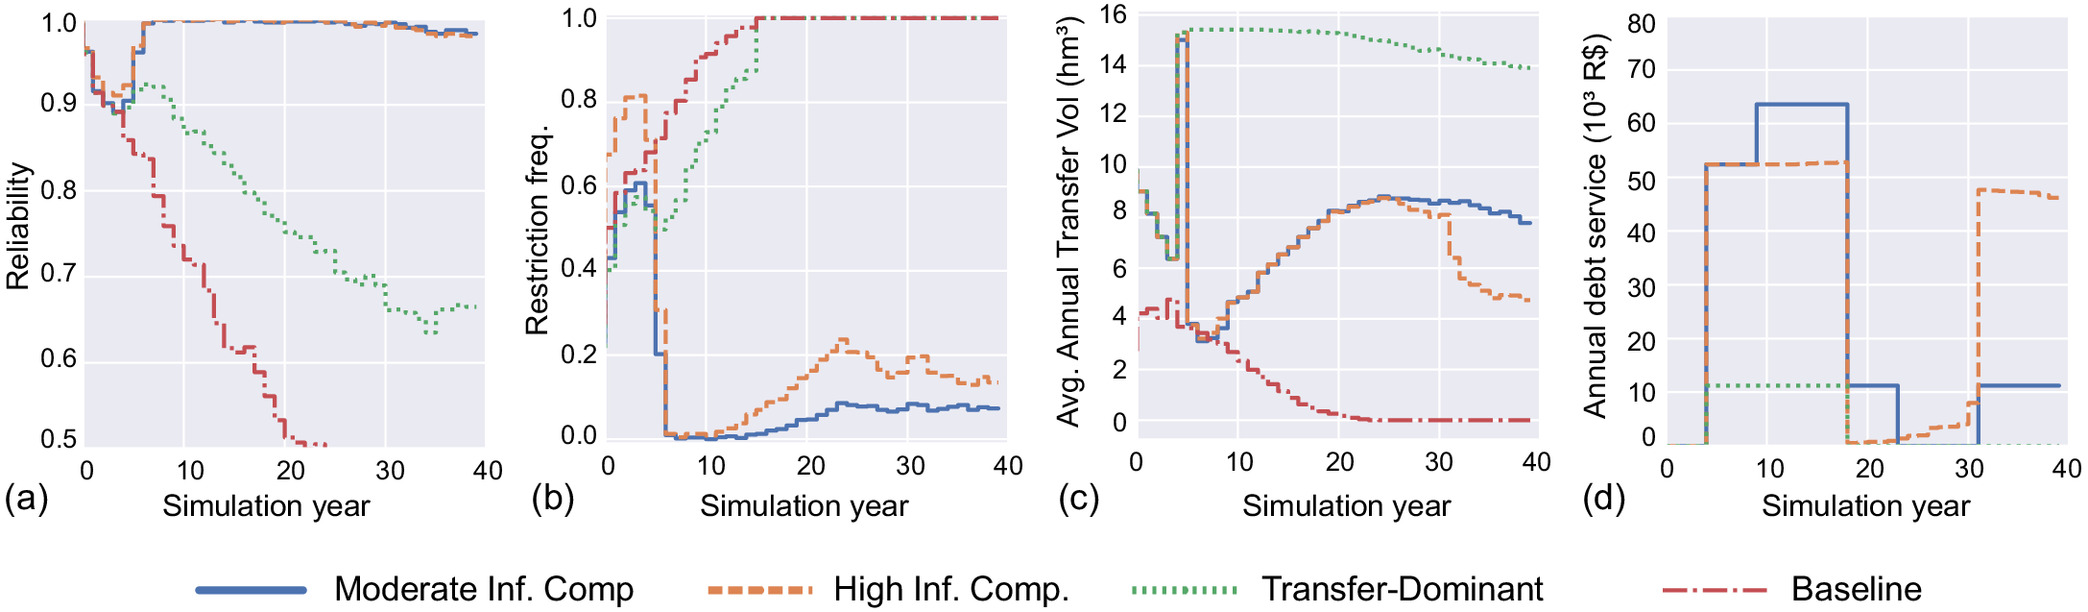
Under these conditions, the baseline policy (red lines in Fig. 5) experiences a rapid decline in reliability over the course of the planning horizon [Fig. 5(a)]. This is accompanied by a corresponding rise in restriction frequency to a level of 100%, indicating that under the expected demand growth conditions, the total supply capacity of Descoberto’s current infrastructure cannot meet future water demands, even in mild future hydrologic scenarios. The baseline policy utilizes transfers from Santa Maria to Descoberto early in the planning period [Fig. 5(c)], but the volume of water supplied to Descoberto via transfers decreases as regional demand grows. This is likely because of limitations to Santa Maria’s treatment capacity, which is eventually stressed by growing demands.
Under the transfer-dominant policy (green line), Descoberto experiences a rapid decrease in reliability in the first five years of the planning horizon. This rapid decline is arrested after the Paranoa 3 expansion is triggered [shown in Fig. 4(f)]. The increase in Santa Maria’s treatment capacity from the Paranoa 3 expansion allows more water to be transferred from Santa Maria to Descoberto, as demonstrated by the increase in average annual transfer volume in Fig. 5(c). However, this benefit is short-lived, and Descoberto’s reliability soon begins to decline once more. Like the baseline policy, Descoberto is subject to water-use restrictions in 100% of inflow scenarios under the transfer-dominant policy by year 20. The performance of this policy underscores how regional cooperation can help Descoberto improve supply reliability but also highlights that additional supply infrastructure investment is needed to achieve reliable performance in the long term.
Under the high-infrastructure compromise, Descoberto’s performance is very different from the baseline and transfer-dominant policies. While Descoberto’s reliability decreases sharply over the first six years of the planning period, it quickly rebounds after infrastructure investment is completed. Like the transfer-dominant policy, Descoberto is able to obtain a much greater volume of treated transfers after the Paranoa expansion has been triggered in year 5 [Fig. 4(g)]. However, after the Corumba 2 reservoir expansion has been completed in year 6 [Fig. 4(k)], Descoberto’s purchase of treated transfers drops precipitously. After Corumba 2 is constructed, Descoberto’s reliability also climbs to nearly 100%, and its use of water-use restrictions drops to below 20%. While Descoberto’s reliability decreases slightly as demand grows, the infrastructure investments made to increase Santa Maria’s transfer capacity and Descoberto’s storage capacity show clear benefits for regional water supply.
Under the moderate-infrastructure compromise (solid blue line in Fig. 5), Descoberto experiences a rapid decline in reliability during the first six years of the planning period. Like the high-infrastructure compromise, the new infrastructure constructed in year 6 [Fig. 4(l)] rapidly improves Descoberto’s reliability. Instead of making large investments in additional storage late in the planning period, like the high-infrastructure compromise [Fig. 5(d)], the moderate-infrastructure compromise makes a series of smaller investments in Santa Maria’s treatment capacity, allowing the sustained use of treated transfers throughout the planning period, even as Santa Maria’s demand grows [Fig. 5(c)]. These investments allow the moderate-infrastructure policy to maintain similar reliability to the high-infrastructure policy, with lower overall investment in infrastructure and lower frequency use of water-use restrictions in the last 20 years of the planning period.
Overall, Fig. 5 reveals several important initial insights into the regional water supply planning problem. First, the rapid decline in reliability across all four policies, and the subsequent long-term decline of the baseline and transfer-dominant policies, suggest that current water supplies are not sufficient to accommodate even modest levels of demand growth in Descoberto. The near-term decline in reliability also suggests that the system is currently at a high level of risk, and decision-makers must act fast to maintain regional supply reliability. Second, Fig. 5 reveals the benefits of regionally coordinated treated transfers. Although transfers alone are not enough to maintain a reliable water supply in Descoberto (as demonstrated by the performance of the transfer-dominant policy), investing in expanded treatment capacity in Santa Maria has strong benefits for Descoberto and plays a crucial role in maintaining near-term regional reliability [as shown in Figs. 5(a and c)]. Finally, Fig. 5 reveals that investing in the Corumba 2 storage expansion greatly reduces Descoberto’s water supply risk. When coupled with investments in Santa Maria’s treatment capacity, both policies that triggered the Corumba 2 project raised Descoberto’s reliability to values similar to Santa Maria’s. These results reinforce the importance of infrastructure investment to maintain regional reliability, even under the generally optimistic baseline scenario.
Robustness to Deep Uncertainty
We next transition to evaluating how policies respond when stress tested under the much broader and more challenging set of future SOWs generated by DU Reevaluation sampling [Fig. 2(d)]. Fig. 6 shows the robustness of Pareto-approximate infrastructure investment and management policies for the Descoberto service area using three different measures. The Santa Maria service area is not substantially impacted by deep uncertainties and is omitted from Fig. 6. Fig. 6(a) shows robustness as measured by the domain criterion satisficing metric [Starr 1963; Eqs. (5) and (6)], which evaluates a policy’s ability to maintain a set of satisficing criteria (reliability , restriction frequency , and worst-case drought management cost annual revenue) across the broad and challenging set of future SOWs sampled using DU reevaluation sampling [Fig. 2(d)].
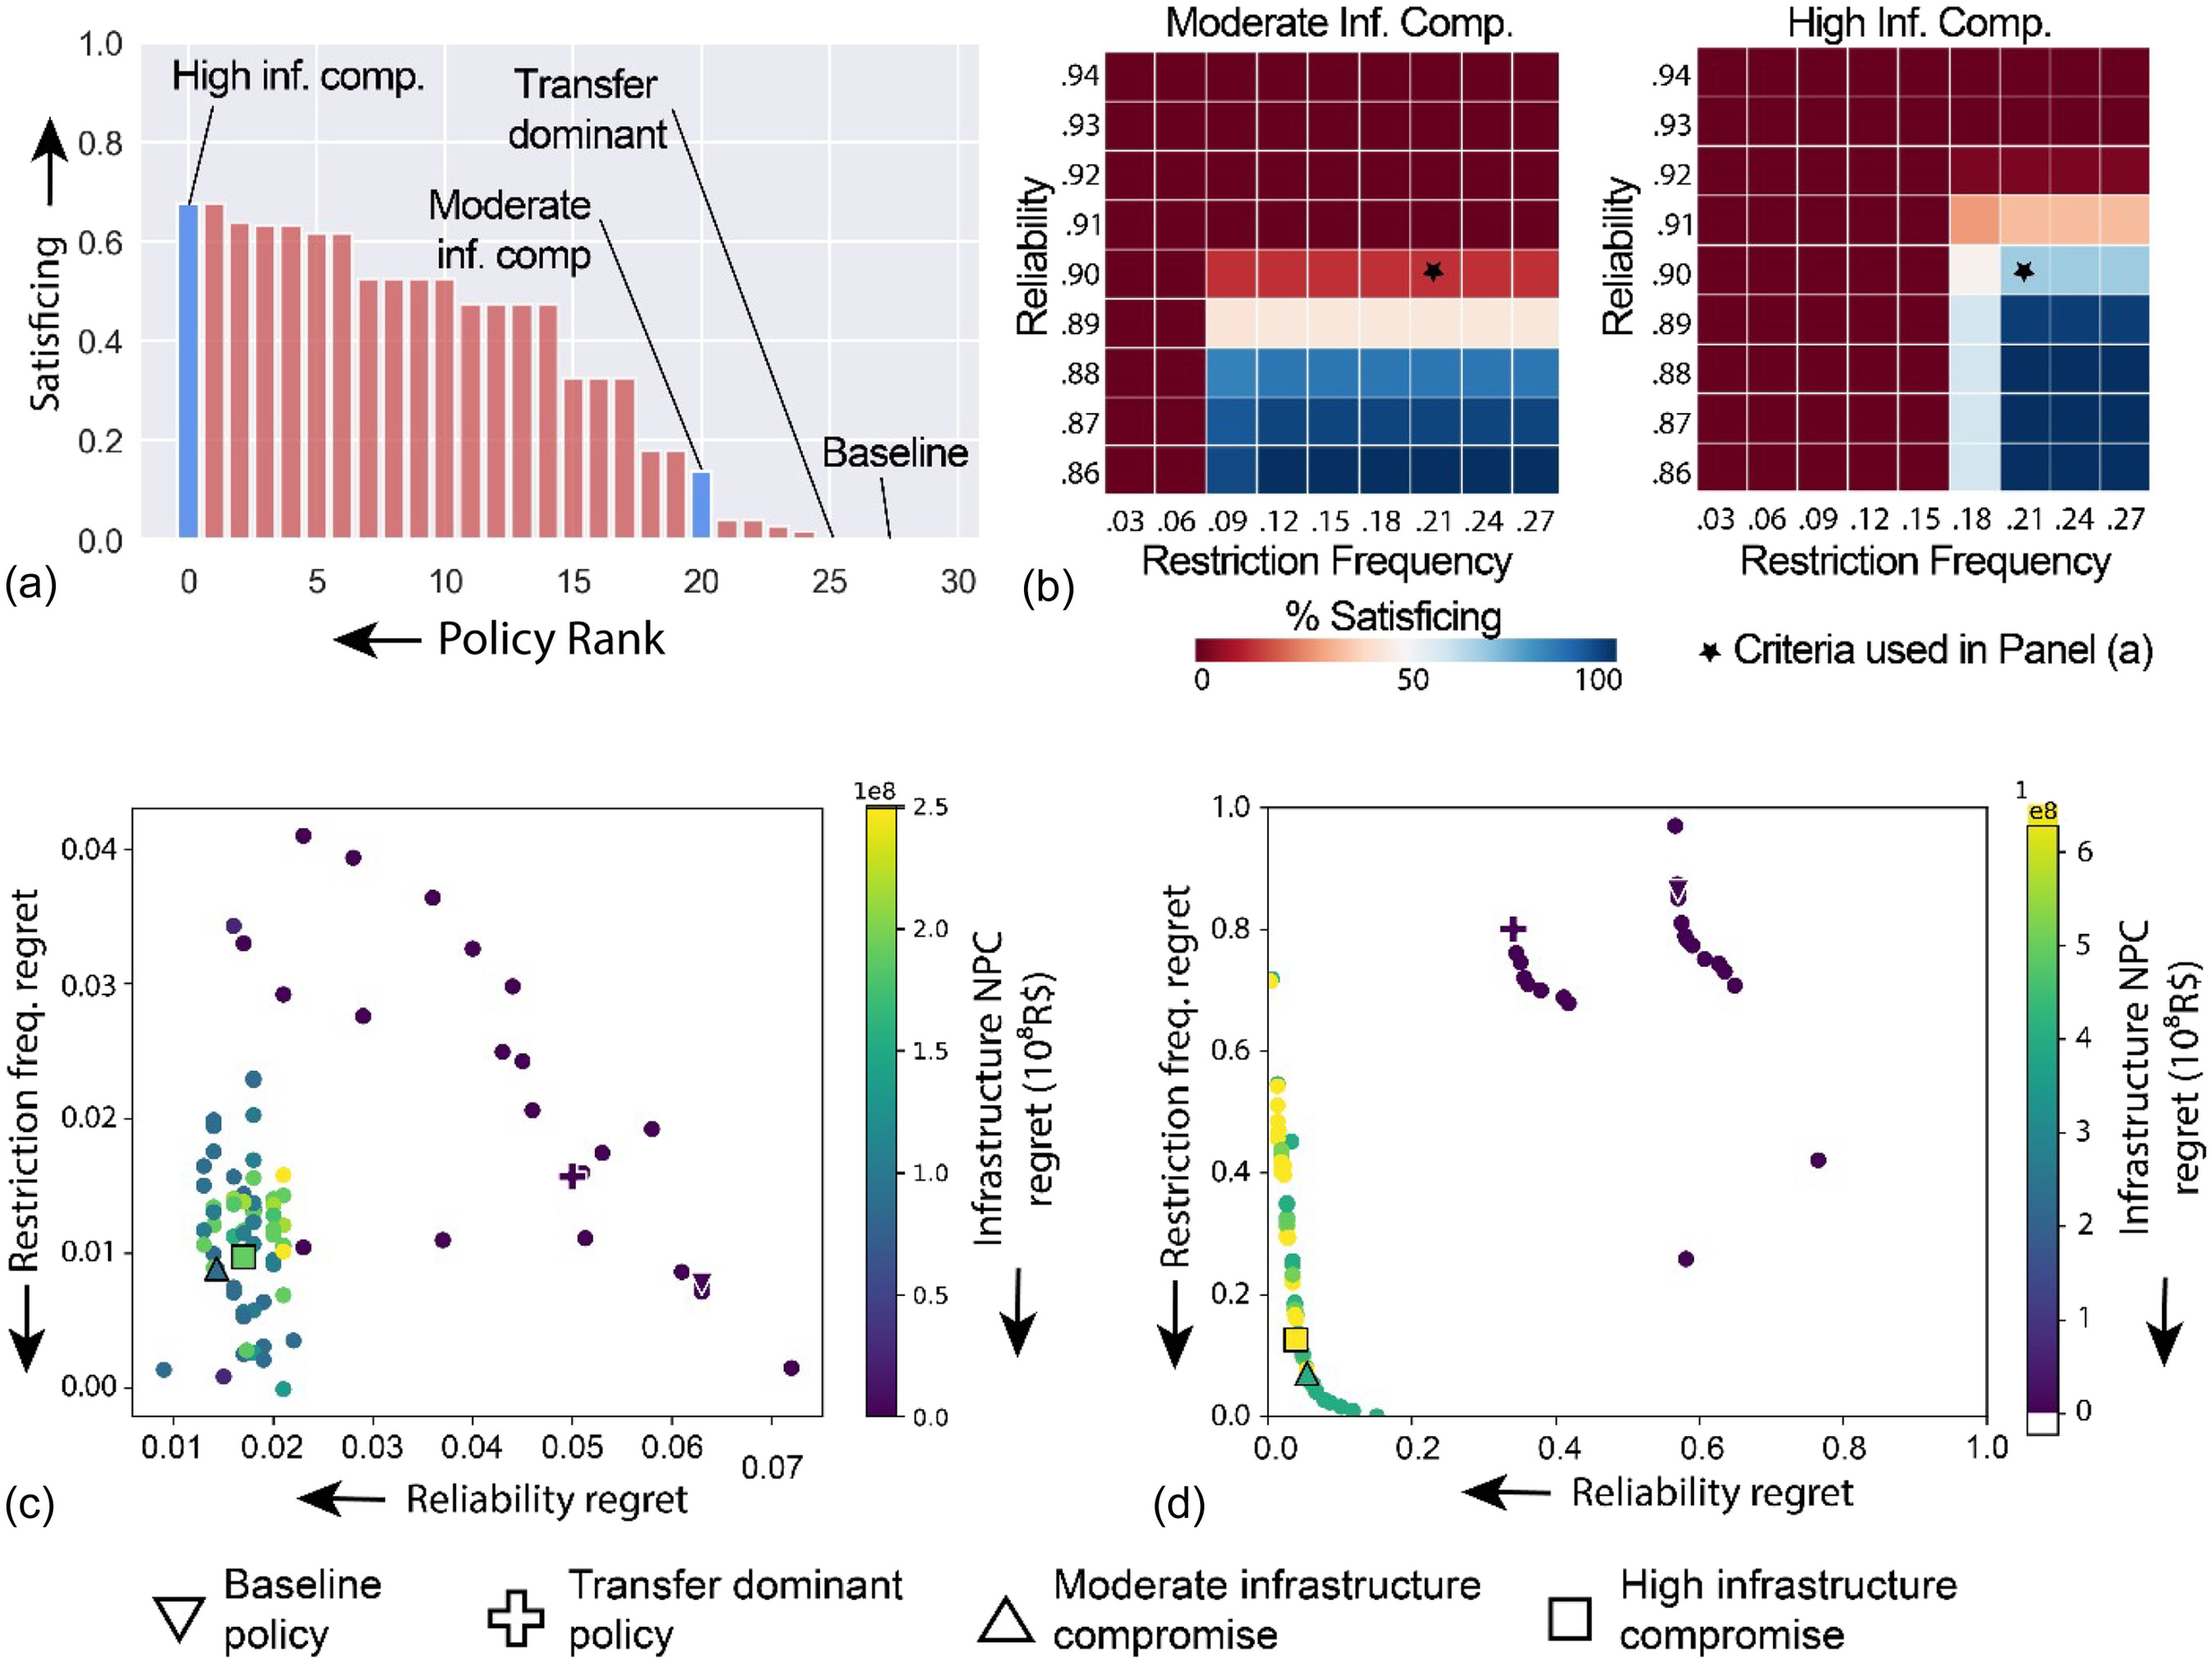
Across all 91 Pareto-approximate policies, only 24 policies meet the satisficing criteria in any SOW. The high-infrastructure policy has the largest robustness of any policy in the Pareto approximate set, meeting the satisficing criteria in 67.8% of sampled SOWs. The satisficing-based robustness of the other highlighted policies is markedly worse. The moderate-infrastructure policy is only able to meet the criteria under 14% of SOWs, and neither the baseline nor the transfer-dominant policy met the satisficing criteria under any sampled SOW.
While the high-infrastructure compromise is clearly the most robust alternative when evaluated using the assumed satisficing criteria, Fig. 6(b) explores how our perception of robustness changes when alternative performance criteria are applied to the high- and moderate-infrastructure compromises. In each plot, moving left to right indicates an increased tolerance for water-use restrictions, moving from top to bottom indicates an increased tolerance for supply failures, and the colored shading in each cell indicates the satisficing value achieved for the corresponding reliability and restriction frequency thresholds. The satisficing criteria used to calculate robustness in Fig. 6(a) (, ) is shown with the star in each plot. Fig. 6(b) illustrates key differences in the performance of the two compromise policies under deep uncertainty. The high-infrastructure compromise can maintain reliability of at least 88% and a maximum restriction frequency of 21% under all DU SOWs. In contrast, the moderate-infrastructure compromise can maintain reliability of 86% with a maximum restriction frequency of 12% under all DU SOWs. While Fig. 6(b) illustrates a strong tradeoff between reliability and restriction frequency for the two policies, it also highlights that neither policy can achieve reliability greater than 91% for Descoberto, a level of performance that would be considered unacceptable by major urban water utilities in the US (Asefa et al. 2015).
Figs. 6(c and d) complement the satisficing-based robustness assessment by showing robustness evaluation using regret-based metrics (Herman et al. 2015). Fig. 6(c) shows the performance of candidate policies using Type I regret [Eqs. (7) and (8)], which measures the difference between a policy’s performance in an assumed “base” SOW and the performance of the policy in the 90th percentile of SOWs (i.e., the top 10% most challenging SOWs). Fig. 6(c) highlights tradeoffs between Type I regret across three individual metrics: reliability, restriction frequency, and infrastructure net present cost. Across the four compromise policies, the moderate-infrastructure compromise has the lowest Type I regret in all three performance criteria, indicating that it experiences the lowest change in performance under challenging future scenarios when compared to the expected future. The high-infrastructure compromise experiences a slightly higher Type I regret with respect to restriction frequency and reliability and a much higher regret with respect to infrastructure net present cost. However, it is important to note that a high-infrastructure net present cost regret is not necessarily a negative quality but may reflect the policy’s ability to adapt to challenging future SOWs by triggering infrastructure. Both the baseline and transfer-dominant policies have much higher Type I regret in reliability and restriction frequency, indicating that, in addition to never meeting the satisficing criteria, the performance of these policies is severely degraded under challenging future SOWs.
Fig. 6(d) shows a final measure of robustness, Type II regret [Eqs. (9) and (10)]. Type II regret measures the performance of each solution with respect to the performance of the best-performing solution in the prevailing SOW. In effect, this metric is evaluating the consequences of making an incorrect choice when selecting a policy (Savage 1951; Herman et al. 2015). Fig. 6(d) once again showcases the strong tradeoff between reliability and restriction frequency. Both the baseline policy and the transfer-dominated policy perform very poorly when evaluated using Type II regret, reinforcing that there are solutions in the Pareto-approximate set that greatly outperform both across all SOWs. In contrast, policies that include infrastructure investment lie on a tradeoff surface between reliability and restriction frequency, indicating that the choice of policy represents an application of preference between reliability, restriction frequency, and infrastructure investment cost. Both the high-infrastructure and moderate-infrastructure compromises represent a balance between reliability and restriction frequency, though the high-infrastructure policy favors reliability while the moderate-infrastructure policy favors restriction frequency.
Discovering Narrative Scenarios
Fig. 7 provides additional context about how the high- and moderate-infrastructure compromises perform across DU SOWs. Figs. 7(a and c) contain factor maps resulting from the scenario discovery process described in the Scenario Discovery section. Factor maps plot Descoberto’s ability to maintain the satisficing criteria used to evaluate robustness in Fig. 6(a) (, restriction , worst-case drought management AVR) under different future SOWs. The GBT algorithm indicated that, for both the high-infrastructure and moderate-infrastructure compromises, restriction effectiveness and demand growth rate are the two most influential deep uncertainties (for a full list of feature importance from GBT, see Table S7 ). Fig. 7(a) reveals that the moderate-infrastructure compromise can only meet these performance criteria when water-use restrictions are more effective than anticipated (restriction effectiveness multiplier values greater than 1) and the demand growth rate is low. The high-infrastructure compromise [Fig. 7(c)] meets the performance criteria in most SOWs, only failing in SOWs where restriction effectiveness is low and the demand growth is high.
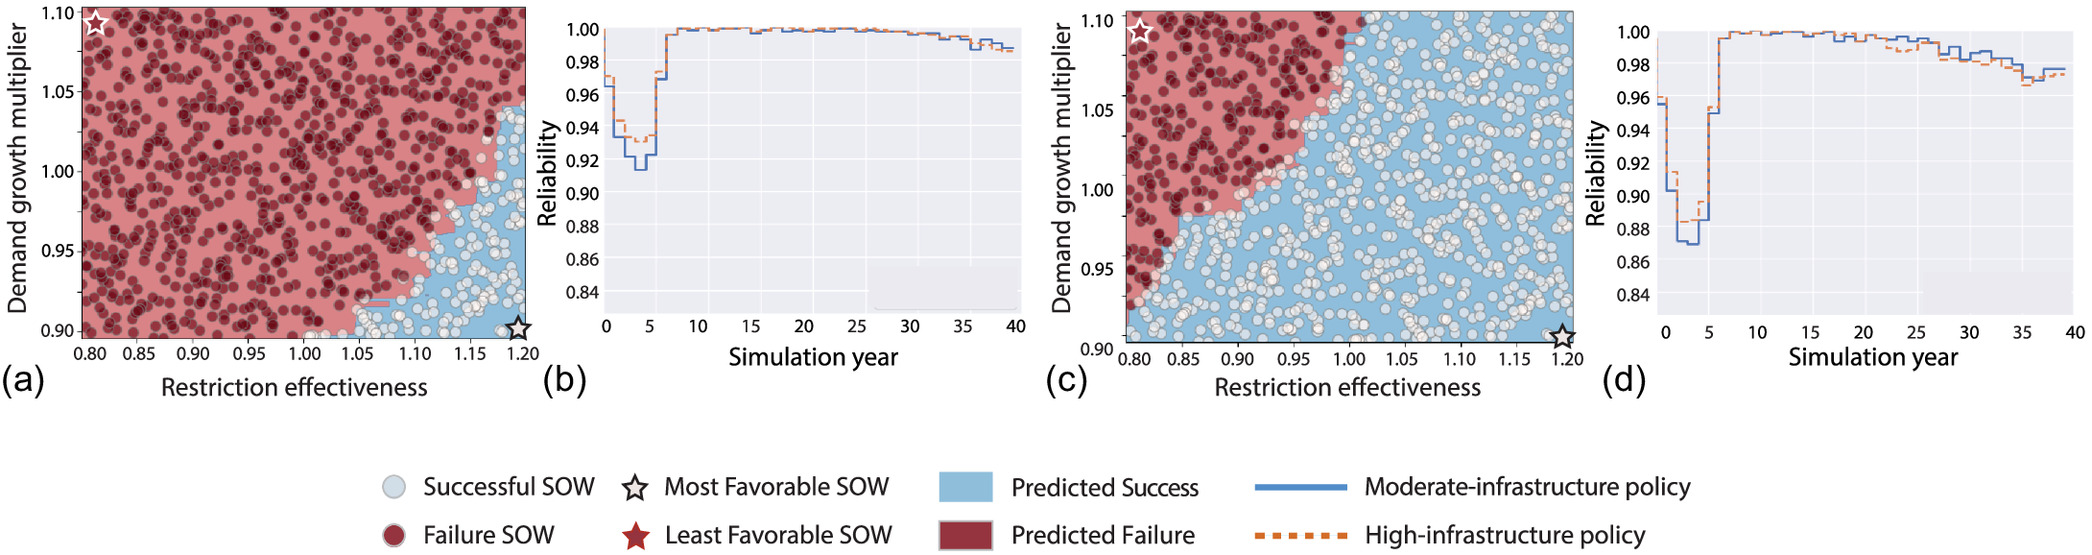
While Figs. 7(a and c) appear to reveal a strong difference between the two policies, these differences appear less substantial when policy performance is examined in detail under the most favorable and least favorable SOWs [highlighted in Figs. 7(a and c) with white and red stars]. Figs. 7(b and d) show Descoberto’s reliability over time under both compromise policies. As in the base SOW (Fig. 5), the reliability of both policies declines sharply in the first six years of the simulation under both the most and least favorable SOWs. The high-infrastructure policy maintains a higher reliability during this period than the moderate-infrastructure policy under both SOWs. During this critical point in the planning period, no infrastructure has been completed, so the higher reliability provided by the high-infrastructure compromise is due to an increased use of water-use restrictions. After new infrastructure projects have been completed, both policies maintain similar levels of reliability under both the most and least favorable SOWs. This finding adds context to the scenario discovery results—before new infrastructure has been completed, Descoberto is heavily dependent on water-use restriction to manage supply shortfalls. When demand growth is high and water-use restrictions are less effective than anticipated, Descoberto is at increased risk of near-term failure.
Figs. 7(b and d) illustrate how static factor maps—created using a metric that aggregates the dynamics of the entire simulation period as the worst reliability over time—may mislead decision-makers if not contextualized with further analysis. Coupling the factor maps with detailed diagnostics deepens the scenario discovery process by providing a temporal dimension to narrative scenarios. In the case of the FDB, we find that Descoberto is vulnerable to supply reliability failures that may be caused by ineffective water-use restrictions and high demand growth in the near term. The system is also vulnerable if construction of new infrastructure is not built as early as possible. If CAESB can manage near-term droughts and accelerate the development of new water supply infrastructure, the utility has the opportunity to overcome the large historical inequities in the water supply system.
Implications for the Federal District Water Supply System
The results of our DU Pathway analysis provide local decision-makers with actionable water supply infrastructure investment and management policies and reveal new insights into regional water supply vulnerability. Using multiobjective optimization, we discover a wide disparity in achievable performance between the Descoberto and Santa Maria service areas [Fig. 3(a)]. However, further analysis reveals that infrastructure investment greatly improves Descoberto’s water supply reliability and restriction frequency (Figs. 5 and 7). Importantly, to improve Descoberto’s performance, CAESB must make new investments in both service areas [Fig. 3(a)], indicating that transfers from Santa Maria play an important role shaping Descoberto’s performance. Our analysis reveals that the Corumba 2 expansion provides large improvements to Descoberto’s performance, and is triggered as early as possible in both highlighted compromise policies [Figs. 4(k and l)]. We find diminishing returns for additional infrastructure projects after Corumba 2 has been completed. The high-infrastructure compromise prioritizes two additional infrastructure projects after Corumba 2 [Fig. 4(k)]—at an additional average expense of R$ 350 million—but does not generate higher long-term performance than the moderate-infrastructure policy, which only constructures Corumba 2 (Fig. 7).
Our analysis suggests that decision-makers should construct the Corumba 2 expansion as soon as possible and prepare for possible restrictions and shortages until it comes online. Scenario discovery reveals that high demand growth and low restriction effectiveness cause near-term vulnerability for Descoberto. Policies that curb near-term demand and educate residents about water conservation may help the utility improve conditions until Corumba 2 has been completed.
Conclusion
This study provides a detailed assessment of how the path-dependent legacy of historical inequity impacts present and future water supply in the FDB. Our methodology extends the DU Pathways framework to reveal wide disparities in water supply reliability and achievable robustness between vulnerable and affluent populations within the FDB. Our results highlight the importance of prioritizing equity considerations during all phases of the DU Pathways framework. Our methodology centered equity during the problem formulation process by independently evaluating the performance of the two service areas and applying Rawls’ difference principle during multiobjective search. Our analysis reveals that Descoberto faces a strong near-term risk of supply failures from drought, while Santa Maria is relatively more secure in its near-term water supply. This finding bears similarities to other research on water supply systems in the global south, such as Savelli et al. (2021), who illustrate how the severe impacts of the 2015–2017 Cape Town drought are not solely attributable to extreme hydroclimatic conditions, but a product of inequitable access to water supplies—a finding that emerges only when system performance is disaggregated across socioeconomic groups. As in the Cape Town example, we find that water supply vulnerability in the FDB is primarily borne by the region’s most vulnerable population.
Our analysis further illustrates that the two systems have complex interdependencies and require substantial increases in coordinated drought mitigation actions as well as longer-term investments. Given Descoberto’s consistently severe vulnerability to declines in its supply reliability, rapid actions are necessary to enhance regionally coordinated treated transfers from Santa Maria. However, short-term transfers alone are not enough to maintain a reliable water supply in Descoberto; investing in expanded treatment capacity in Santa Maria has strong benefits for Descoberto and plays a crucial role in maintaining regional reliability of the FDB overall. Constructing the Corumba 2 expansion has large benefits for Descoberto, and mitigates much of the water supply risk. These findings provide actionable information to guide regional decision-makers in developing equitable and robust long-term regional water supply policies. Beyond the FDB, our results are generalizable to practitioners who are or will be applying DMDU methodology in global south nations. First, discussions with the FDB regulation agency (ADASA) and water utility (CAESB) demonstrate that iterative decision-maker engagement was essential for developing an actionable water resources system model. Before this analysis, regional decision-makers were unfamiliar with DMDU literature, and applications in South America are still rare. Bringing decision-makers into the planning process provided an opportunity for dialogue about decision-making methodology and helped refine estimates for key system inputs. Second, by disaggregating regional performance between high- and low-income service areas, our methodology identifies the impacts of inequitable historical development on the region’s most vulnerable populations. These insights may have been missed or underrepresented if the CAESB utility had been treated as a single, homogenous system, showing that a region-specific problem formulation is needed to accurately represent regional dynamics. Finally, our results highlight the importance of pairing multiobjective optimization and scenario discovery with detailed temporal diagnostics. Incorporating a temporal dimension into the development of narrative scenarios revealed severe near-term risks for Descoberto and demonstrated the benefits of rapid infrastructure investment.
Our analysis illustrates the impact of historical inequity between regional service areas but does not resolve water supply impacts at a household level. Future work can complement this analysis by examining the impacts of water-use restrictions and tariffs on vulnerable populations at a household level. Additional analysis could also investigate how private household water supply impact disparities in safe drinking water access for the residents of FDB.
Supplemental Materials
File (supplemental_materials_jwrmd5.wreng-6353_araujo.pdf)
- Download
- 2.77 MB
Data Availability Statement
Some data and code for this work, including (a) a subset of input data, (b) instructions for replicating the computational experiment, and (c) figure generation code, can be found at the GitHub repository at https://github.com/lbl59/federal_district/tree/v1.0.0 with DOI 10.5281/zenodo.8221350, allowing replication of final results.
Acknowledgments
This work used the computational resources of The Cube and Hopper clusters at the Cornell University Center for Advanced Computing. The authors thank Conselho Nacional de Desenvolvimento Científico e Tecnológico (CNPq) for financial support provided for this research. We would also like to thank Bernardo Trindade and Andressa Giacomazzo for earlier work on WaterPaths and CAESB (Diogo Gebrim) and ADASA (Jorge Lima and Gustavo Carneiro) for their consistent collaboration in discussing technical features concerning the FDB water supply system. Finally, we would like to thank the Editor, the Associate Editor, and the two anonymous reviewers for helping us improve the clarity and quality of the manuscript.
References
ADASA (Regulation Agency for Water, Sewage and Sanitation for the Federal District), CAESB (Environmental Sanitation Company of The Federal District), EMATER-DF (Federal District Enterprise for Technical Assistance and Rural Extension), SEAGRI (The State Secretariat for Agriculture, Supply and Rural Development). 2018. 2016-2018 water crisis management: Federal district experiences. [In Portuguese]. Brasília, Brazil: ADASA.
ADASA (Regulation Agency for Water, Sewage and Sanitation for the Federal District) [In Portuguese]. 2018. Regular monitoring of treated water consumption of the federal district. [In Portuguese]. Brasília, Brazil: ADASA.
Asefa, T., A. Adams, and N. Wanakule. 2015. “A level-of-service concept for planning future water supply projects under probabilistic demand and supply framework.” J. Am. Water Resour. Assoc. 51 (5): 1272–1285. https://doi.org/10.1111/1752-1688.12309.
Ben-Haim, Y. 2006. Info-gap decision theory: Decisions under severe uncertainty. 2nd ed. London: Academic Press.
Borgomeo, E., M. Mortazavi-Naeini, J. W. Hall, and B. P. Guillod. 2018. “Risk, robustness and water resources planning under uncertainty.” Earth’s Future 6 (3): 468–487. https://doi.org/10.1002/2017EF000730.
Brown, C., Y. G., M. Laverty, and K. Li. 2012. “Decision scaling: Linking bottom-up vulnerability analysis with climate projections in the water sector.” Water Resour. Res. 48 (9). https://doi.org/10.1029/2011WR011212.
Bryant, B. P., and R. J. Lempert. 2010. “Thinking inside the box: A participatory, computer-assisted approach to scenario discovery.” Technol. Forecast. Soc. Change 77 (1): 34–49. https://doi.org/10.1016/j.techfore.2009.08.002.
Calverley, C. M., and S. C. Walther. 2022. “Drought, water management, and social equity: Analyzing Cape Town, South Africa’s water crisis.” Frontiers Water 4 (Sep): 910149. https://doi.org/10.3389/frwa.2022.910149.
Carrera, J., V. Arroyo, F. Rojas, and A. Mejia. 2018. “Water security in Latin America: The urban dimension. Empirical evidence and policy implications from 26 cities.” In Global water security, lessons learnt and long-term implications (Water resources development and management), 217–232. Singapore: Springer.
CODEPLAN (Planning Company of the Federal District). 2018. “District research by household sampling.” [In Portuguese.] Accessed June 27, 2023. https://www.codeplan.df.gov.br/pdad-2018.
CODEPLAN (Planning Company of the Federal District). 2020a. “District research by household sampling.” [In Portuguese.] Accessed November 10, 2023. https://www.codeplan.df.gov.br/resultados-alcancados-2020/.
CODEPLAN (Planning Company of the Federal District). 2020b. Federal district atlas. [In Portuguese]. Brasília, Brazil: CODEPLAN.
Coello Coello, C. A., G. B. Lamont, and D. A. V. Veldhuizen. 2007. Evolutionary algorithms for solving multi-objective problems. Berlin: Springer.
de Jesus, F. S. M., A. M. V. Monteiro, and J. Tomasella. 2023. “Spatial inequalities in access to safe drinking water in an upper-middle-income country: A multi-scale analysis of Brazil.” Water 15 (8): 1620. https://doi.org/10.3390/w15081620.
Escobar, H. 2015. “Water security: Drought triggers alarms in Brazil’s biggest metropolis.” Science 347 (6224): 812. https://doi.org/10.1126/science.347.6224.812.
Fletcher, S., A. Hadjimichael, J. Quinn, K. Osman, M. Giuliani, D. Gold, A. J. Figueroa, and B. Gordon. 2022. “Equity in water resources planning: A path forward for decision support modelers.” J. Water Resour. Plan. Manage. 148 (7): 02522005. https://doi.org/10.1061/(ASCE)WR.1943-5452.0001573.
Fletcher, S., K. Strzepek, A. Alsaati, and O. de Weck. 2019. “Learning and flexibility for water supply infrastructure planning under groundwater resource uncertainty.” Environ. Res. Lett. 14 (11): 114022. https://doi.org/10.1088/1748-9326/ab4664.
Freeman, S., et al. 2020. “Resilience by design in Mexico City: A participatory human-hydrologic systems approach.” Water Secur. 9 (Apr): 100053. https://doi.org/10.1016/j.wasec.2019.100053.
Freund, Y., R. Schapire, and N. Abe. 1999. “A short introduction to boosting.” Trans. Jpn. Soc. Artif. Intell. 14 (771–780): 1612.
GDF (Federal District Government). 2009. Federal district land-use plan: Technical document. [In Portuguese.] Brasília, Brazil: GDF.
GDF (Federal District Government). 2017. District plan for sanitation and integrated management of solid waste. Brasília, Brazil: GDF.
Giacomazzo, A. P. 2020. “Planning and management Portifolios assessments of federal district of Brazil water supply system in contexts of deep uncertainty.” [In Portuguese.] Master Degree dissertation, Dept. of Civil and Environmental Engineering, Univ. of Brasília.
Gold, D. F., P. M. Reed, D. E. Gorelick, and G. W. Characklis. 2022. “Power and pathways: Exploring robustness, cooperative stability, and power relationships in regional infrastructure investment and water supply management portfolio pathways.” Earth’s Future 10 (2): e2021EF002472. https://doi.org/10.1029/2021EF002472.
Gold, D. F., P. M. Reed, D. E. Gorelick, and G. W. Characklis. 2023. “Advancing regional water supply management and infrastructure investment pathways that are equitable, robust, adaptive, and cooperatively stable.” Water Resour. Res. 59 (9): e2022WR033671. https://doi.org/10.1029/2022wr033671.
Gorelick, D. E., D. F. Gold, T. Asefa, S. Svrdlin, H. Wang, N. Wanakule, P. M. Reed, and G. W. Characklis. 2023. “Water supply infrastructure investments require adaptive financial assessment: Evaluation of coupled financial and water supply dynamics.” J. Water Resour. Plann. Manage. 149 (3): 04022084. https://doi.org/10.1061/jwrmd5.wreng-5863.
Gorelick, D. E., D. F. Gold, P. M. Reed, and G. W. Characklis. 2022. “Impact of inter-utility agreements on cooperative regional water infrastructure investment and management pathways.” Water Resour. Res. 58 (3): e2021WR030700. https://doi.org/10.1029/2021WR030700.
Groves, D. G., and R. J. Lempert. 2007. “A new analytic method for finding policy-relevant scenarios.” Glob. Environ. Change 17 (1): 73–85. https://doi.org/10.1016/j.gloenvcha.2006.11.006.
Groves, D. G., E. Molina-Perez, E. Bloom, and J. R. Fischbach. 2019. “Decision making under deep uncertainty. From theory to practice—Robust decision making (RDM): Application to water planning and climate policy.” In The society for decision making under deep uncertainty. Berlin: Springer.
Gupta, R. S., A. L. Hamilton, P. M. Reed, and G. W. Characklis. 2020. “Can modern multi-objective evolutionary algorithms discover high-dimensional financial risk portfolio tradeoffs for snow-dominated water-energy systems?” Adv. Water Resour. 145 (Nov): 103718. https://doi.org/10.1016/j.advwatres.2020.103718.
Hadka, D., and P. Reed. 2013. “Borg: An auto-adaptive many-objective evolutionary computing framework.” Evol. Comput. 21 (2): 231–259. https://doi.org/10.1162/EVCO_a_00075.
Hadka, D., and P. Reed. 2015. “Large-scale parallelization of the Borg multiobjective evolutionary algorithm to enhance the management of complex environmental systems.” Environ. Model. Software 69 (Jul): 353–369. https://doi.org/10.1016/j.envsoft.2014.10.014.
Hall, J. W., et al. 2019. “Risk-based water resources planning in practice: A blueprint for the water industry in England.” Water Environ. J. 34 (3): 441–454. https://doi.org/10.1111/wej.12479.
Hamilton, A. L., H. B. Zeff, G. W. Characklis, and P. M. Reed. 2022. “Resilient california water portfolios require infrastructure investment partnerships that are viable for all partners.” Earth’s Future 10 (4): e2021EF002573. https://doi.org/10.1029/2021EF002573.
Hammond, P. J. 1976. “Equity, Arrow’s conditions, and Rawls’ difference principle.” Econometrica 44 (4): 793. https://doi.org/10.2307/1913445.
Hanne, T. 2001. “Global multiobjective optimization with evolutionary algorithms: Selection mechanisms and mutation control.” In Computer science, edited by E. Zitzler, L. Thiele, K. Deb, C. A. Coello, D. Corne. Berlin: Springer.
Herman, J. D., P. M. Reed, H. B. Zeff, and G. W. Characklis. 2015. “How should robustness be defined for water systems planning under change?” J. Water Resour. Plan. Manage. 141 (10): 04015012. https://doi.org/10.1061/(ASCE)WR.1943-5452.0000509.
Housh, M., and T. Aharon. 2021. “Info-gap models for optimal multi-year management of regional water resources systems under uncertainty.” Sustainability 13 (6): 3152. https://doi.org/10.3390/su13063152.
IBGE (Brazilian Institute of Geography and Statistics). 2023. “Preview of calculated population based upon 2022 Demographic Census results until december 25th, 2022.” [In Portuguese.] Accessed June 28, 2023. https://www.ibge.gov.br/estatisticas/sociais/populacao/22827-censo-demografico-2022.html?edicao=35938&t=resultados.
IMF (International Monetary Fund). 2023. World economic outlook: A rocky recovery. Washington, DC: IMF.
IPCC (Intergovernmental Panel on Climate Change). 2022. “Climate change 2022: Impacts, adaptation, and vulnerability. Contribution of working Group II to the sixth assessment report of the intergovernmental panel on climate change.” In Summary for policy makers. Cambridge, UK: Cambridge University Press.
Jafino, B. A., and J. H. Kwakkel. 2021. “A novel concurrent approach for multiclass scenario discovery using multivariate regression trees: Exploring spatial inequality patterns in the Vietnam Mekong delta under uncertainty.” Environ. Model. Software 145 (5): 105177. https://doi.org/10.1016/j.envsoft.2021.105177.
Kasprzyk, J. R., S. Nataraj, P. M. Reed, and R. J. Lempert. 2013. “Many objective robust decision making for complex environmental systems undergoing change.” Environ. Model. Software 42 (Apr): 55–71. https://doi.org/10.1016/j.envsoft.2012.12.007.
Keim, D. A. 2002. “Information visualization and visual data mining.” IEEE Trans. Vis. Comput. Graphics 8 (1): 1–8. https://doi.org/10.1109/2945.981847.
Kwakkel, J. H., W. E. Walker, and M. Haasnoot. 2016. “Coping with the wickedness of public policy problems: Approaches for decision making under deep uncertainty.” J. Water Resour. Plan. Manage. 142 (3): 01816001. https://doi.org/10.1061/(ASCE)WR.1943-5452.0000626.
Lau, L. B., P. M. Reed, and D. F. Gold. 2023. “Evaluating implementation uncertainties and defining safe operating spaces for deeply uncertain cooperative multi-city water supply investment pathways.” Water Resour. Res. 7 (Jul): e2023WR034841. https://doi.org/10.22541/essoar.167870405.59610216/v2.
Laumanns, M., L. Thiele, K. Deb, and E. Zitzler. 2002. “Combining convergence and diversity in evolutionary multiobjective optimization.” Evol. Comput. 10 (3): 263–282. https://doi.org/10.1162/106365602760234108.
Leflaive, X., and M. Hjort. 2020. Addressing the social consequences of tariffs for water supply and sanitation. Paris: Organization for Economic Co-operation and Development.
Lehner, F., and C. Deser. 2023. “Origin, importance, and predictive limits of internal climate variability.” Environ. Res.: Climate 2 (2): 023001. https://doi.org/10.1088/2752-5295/accf30.
Lempert, R., J. Fischbach, D. Groves, E. Bloom, B. Goshi, and J. Nevills. 2011. “Identifying key indicators for adaptive management of the metropolitan water district integrated resource plan.” In Vol. 2011 of Proc., AGU Fall Meeting Abstracts. Washington, DC: American Geophysical Union.
Lempert, R. J., D. G. Groves, S. W. Popper, and S. C. Bankes. 2006. “A general, analytic method for generating robust strategies and narrative scenarios.” Manage. Sci. 52 (4): 514–528. https://doi.org/10.1287/mnsc.1050.0472.
Lempert, R. J., S. Popper, and S. Bankes. 2003. Shaping the next one hundred years: New methods for quantitative, long term policy analysis. Santa Monica, CA: RAND.
Marchau, V., W. Walker, P. Bloemer, and S. Popper. 2019. “Decision making under deep uncertainty. From theory to practice.” In The society for decision making under deep uncertainty. Berlin: Springer.
Matrosov, E. S., I. Huskova, J. R. Kasprzyk, J. J. Harou, C. Lambert, and P. M. Reed. 2015. “Many-objective optimization and visual analytics reveal key trade-offs for London’s water supply.” J. Hydrol. 531 (Jun): 1040–1053. https://doi.org/10.1016/j.jhydrol.2015.11.003.
Mc Donald, R. I., et al. 2014. “Water on an urban planet: Urbanization and the reach of urban water infrastructure.” Glob. Environ. Change 27 (Apr): 96–105. https://doi.org/10.1016/j.gloenvcha.2014.04.022.
McDonald, R. I., P. Green, D. Balk, B. M. Fekete, C. Revenga, M. Todd, and M. Montgomery. 2011. “Urban growth, climate change, and freshwater availability.” Proc. Natl Acad. Sci. 108 (15): 6312–6317. https://doi.org/10.1073/pnas.1011615108.
McPhail, C., H. R. Maier, J. H. Kwakkel, M. Giuliani, A. Castelletti, and S. Westra. 2018. “Robustness metrics: How are they calculated, when should they be used and why do they give different results?” Earth’s Future 6 (2): 169–191. https://doi.org/10.1002/2017EF000649.
Miro, M. E., D. Groves, B. Tincher, J. Syme, S. Tanverakul, and D. Catt. 2022. “Adaptive water management in the face of uncertainty: Integrating machine learning, groundwater modeling and robust decision making.” Clim. Risk Manage. 34 (Jan): 100383. https://doi.org/10.1016/j.crm.2021.100383.
Rawls, J. 1999. A theory of justice: Revised edition. Cambridge, MA: Harvard University Press.
Ray, P., S. Wi, A. Schwarz, M. Correa, M. He, and C. Brown. 2020. “Vulnerability and risk: Climate change and water supply from California’s central valley water system.” Clim. Change 161 (Jul): 177–199. https://doi.org/10.1007/s10584-020-02655-z.
Reed, P. M., and D. Hadka. 2014. “Evolving many-objective water management to exploit exascale computing.” Water Resour. Res. 50 (10): 8367–8373. https://doi.org/10.1002/2014WR015976.
Reed, P. M., D. Hadka, J. D. Herman, J. R. Kasprzyk, and J. B. Kollat. 2013. “Evolutionary multiobjective optimization in water resources: The past, present, and future.” Adv. Water Resour. 51 (Jan): 438–456. https://doi.org/10.1016/j.advwatres.2012.01.005.
Savage, L. J. 1951. “The theory of statistical decision.” J. Am. Stat. Assoc. 46 (253): 55–67. https://doi.org/10.1080/01621459.1951.10500768.
Savelli, E., M. Rusca, H. Cloke, and G. Di Baldassarre. 2021. “Don’t blame the rain: Social power and the 2015–2017 drought in Cape Town.” J. Hydrol. 594 (Mar): 125953. https://doi.org/10.1016/j.jhydrol.2020.125953.
Savelli, E., M. Rusca, H. Cloke, and G. Di Baldassarre. 2022. “Drought and Society: Scientific Progress, blind spots, and future prospects.” Wiley Interdiscip. Rev. Clim. Change 13 (3): e761. https://doi.org/10.1002/wcc.761.
SEMA-DF (Environmental and Animal Protection Secretariat of the Federal District of Brazil). n.d. “Sistema Distrital de Informações Ambientais—SISDIA.” Accessed June 28, 2023. www.sisdia.df.gov.br/home.
Skerker, J. B., M. Zaniolo, K. Willebrand, M. Lickley, and S. M. Fletcher. 2023. “Quantifying the value of learning for flexible water infrastructure planning.” Water Resour. Res. 59 (6): e2022WR034412. https://doi.org/10.1029/2022WR034412.
Starr, M. K. 1963. Product design and decision theory. Englewood Cliffs, NJ: Prentice Hall.
Steinschneider, S., R. McCrary, S. Wi, K. Mulligan, L. O. Mearns, and C. Brown. 2015. “Expanded decision-scaling framework to select robust long-term water-system plans under hydroclimatic uncertainties.” J. Water Resour. Plan. Manage. 141 (11): 04015023. https://doi.org/10.1061/(ASCE)WR.1943-5452.0000536.
Taner, M. Ü., P. Ray, and C. Brown. 2019. “Incorporating multidimensional probabilistic information into robustness-based water systems planning.” Water Resour. Res. 55 (5): 3659–3679. https://doi.org/10.1029/2018WR022909.
Trindade, B., P. Reed, and G. Characklis. 2019. “Deeply uncertain pathways: Integrated multi-city regional water supply infrastructure investment and portfolio management.” Adv. Water Resour. 134 (Dec): 103442. https://doi.org/10.1016/j.advwatres.2019.103442.
Trindade, B., P. M. Reed, J. D. Herman, H. B. Zeff, and G. W. Characklis. 2017. “Reducing regional drought vulnerabilities and multi-city robustness conflicts using many-objective optimization under deep uncertainty.” Adv. Water Resour. 104 (Jun): 195–209. https://doi.org/10.1016/j.advwatres.2017.03.023.
Trindade, B. C., D. F. Gold, P. M. Reed, H. B. Zeff, and G. W. Characklis. 2020. “Water pathways: An open source stochastic simulation system for integrated water supply portfolio management and infrastructure investment planning.” Environ. Modell. Software 132 (Oct): 104772. https://doi.org/10.1016/j.envsoft.2020.104772.
United Nations Department of Economic and Social Affairs, Population Division. 2022. World population prospects 2022: Summary of results. New York: United Nations Department of Economic and Social Affairs.
UN (The United Nations). 2015. “Transforming our world: The 2030 agenda for sustainable development.” Accessed July 15, 2023. https://sustainabledevelopment.un.org/content/documents/21252030%20Agenda%20for%20Sustainable%20Development%20web.pdf.
Walker, W. E., M. Haasnoot, and J. H. Kwakkel. 2013. “Adapt or perish: A review of planning approaches for adaptation under deep uncertainty.” Sustainability 5 (3): 955–979. https://doi.org/10.3390/su5030955.
WHO (World Health Organization). 2019. “Progress on household drinking water, sanitation and hygiene 2000-2017: Special focus on inequalities.” Accessed July 15, 2023. https://apps.who.int/iris/handle/10665/329370.
World Bank. 2018. “Water scarce cities: Thriving in a finite world.” Accessed July 15, 2023. https://documents1.worldbank.org/curated/en/281071523547385102/pdf/125187-REVISED-WP-W17100.pdf.
World Bank. 2022. “Water matters: Resilient, inclusive and green growth through water security in Latin America.” Accessed July 15, 2023. https://documents1.worldbank.org/curated/en/099450103222231166/pdf/P1668950059b6e0af0bc670ffe759af1487.pdf.
Zatarain Salazar, J., P. M. Reed, J. D. Quinn, M. Giuliani, and A. Castelletti. 2017. “Balancing exploration, uncertainty and computational demands in many objective reservoir optimization.” Adv. Water Resours. 109 (Nov): 196–210. https://doi.org/10.1016/j.advwatres.2017.09.014.
Zeff, H., J. Kasprzyk, J. Herman, P. M. Reed, and G. Characklis. 2014. “Navigating financial and supply reliability tradeoffs in regional drought portfolios.” Water Resour. Res. 50 (Dec): 4906–4923. https://doi.org/10.1002/2013WR015126.
Zeff, H. B., J. D. Herman, P. M. Reed, and G. W. Characklis. 2016. “Cooperative drought adaptation: Integrating infrastructure development, conservation, and water transfers into adaptive policy pathways.” Water Resour. Res. 52 (9): 7327–7346. https://doi.org/10.1002/2016WR018771.
Zeitoun, M., et al. 2016. “Reductionist and integrative research approaches to complex water security policy challenges.” Global Environ. Change 39 (Jul): 143–154. https://doi.org/10.1016/j.gloenvcha.2016.04.010.
Information & Authors
Information
Published In

Journal of Water Resources Planning and Management
Volume 150 • Issue 8 • August 2024
Copyright
This work is made available under the terms of the Creative Commons Attribution 4.0 International license, https://creativecommons.org/licenses/by/4.0/.
History
Received: Aug 7, 2023
Accepted: Feb 13, 2024
Published online: Jun 12, 2024
Published in print: Aug 1, 2024
Discussion open until: Nov 12, 2024
Authors
Metrics & Citations
Metrics
Citations
Download citation
If you have the appropriate software installed, you can download article citation data to the citation manager of your choice. Simply select your manager software from the list below and click Download.