Influence of Belowground Biomass on Barrier-Island Evolution During Storms: A Computational Parameter Study
Publication: Journal of Waterway, Port, Coastal, and Ocean Engineering
Volume 150, Issue 3
Abstract
Barrier islands span 10% of the world’s coastlines and dominate along the Atlantic and Gulf of Mexico coasts in the USA routinely exposed to storm surge. These islands serve as buffers between the open coast and the mainland, and protect the mainland from storm damage. During storms, significant morphological change can occur, including substantial erosion of the islands’ vegetated dunes. In this study, the focus is on the influence of belowground biomass – namely dune plant roots – and dune topographic characteristics on barrier-island erosion during storms. The numerical model XBeach was employed to simulate storm-induced sediment transport. A parameter study was conducted by varying distance from the shoreline to the dune, dune shape, sediment grain size, and sediment mobility as an analogue for biomass. The influence of individual parameters and the collective impact of parameters were analyzed. The results help improve our knowledge of barrier island dynamics and lay a solid groundwork for future investigations.
Introduction
Ten percent of the world’s coastlines contain barrier islands (Stutz and Pilkey 2011). In the USA, for example, barrier islands are a predominant feature along the Atlantic and Gulf of Mexico coasts. Barrier islands serve as a buffer between the open coast and inland regions, thereby providing protection against coastal storms and creating lower-energy environments for ecosystem growth. By their nature, barrier islands are dynamic systems. On the open coast, larger waves and changes in water level work to alter the nearshore and onshore topography and shoreline position. On the bay, or sound, side, tidal flows and smaller waves dominate sediment erosion and deposition. Under more severe storm conditions, barrier islands commonly undergo significant morphological change and may be overwashed or breached. Water level gradients between the ocean and bay sides contribute to breaching, although it is uncertain under which conditions and from which side of the barrier island initiation occurs (Hegermiller et al. 2022; Sherwood et al. 2014).
The role of vegetation, particularly the belowground biomass or root system, on barrier island dynamics is complex and also not fully understood. Emergent vegetation is known to build dunes by trapping sediment transported by aeolian processes. During storm conditions, vegetated land cover influences morphological change by increasing friction, thereby reducing velocities and causing sediment to deposit, potentially burying vegetation under overwash fans. Vegetated land cover, or the lack thereof, may also play a governing role in the location of breaches, ocean versus bay side breach initiation, or overwash extent. While significant advances have been made over recent decades, accurate morphological modeling of barrier island change remains difficult (Hoagland et al. 2023 and references therein). Modeling of storm-induced barrier island erosion with the state-of-the-art model XBeach (Roelvink et al. 2009) can still potentially have considerable error in sediment erosion and deposition. XBeach-predicted bed-elevation errors, with respect to observations, of the order of 0.5 m or more, are routinely reported in the literature (e.g., Smallegan et al. 2016; Simmons et al. 2019). Further, Gharagozlou et al. (2020) used observed topographic data in North Carolina, USA following Hurricane Isabel (2003) to assess XBeach model error, reporting a 28% error in storm-induced overwash deposition volume. Morphodynamic modeling requires accurate representation of land cover, often parameterized with a spatially varying friction coefficient, to simulate sediment deposition and erosion (Passeri et al. 2018). Some numerical models resolve the effects of emergent vegetation by coupling its physical characteristics, such as density or stem diameter, with wave models (Yin et al. 2021).
The effects of belowground biomass on morphological change adds another dimension of complexity to predicting barrier island dynamics. Belowground biomass is known to stabilize dunes, with field studies indicating some dune plant species are more effective than others (Charbonneau et al. 2016; Figlus et al. 2017). A few studies have been conducted on the explicit, physical relationships between belowground biomass and dune erosion potential during storms (some examples include Feagin et al. 2015; Bryant et al. 2019; Figlus et al. 2017), and most of those studies show reductions in erosion in the presence of vegetation. Schweiger and Schuettrumpf (2021) implemented belowground biomass parameterizations in the process-based model XBeach using a critical velocity for erosion in the presence of roots, and results also showed a decrease in dune erosion under different hydrodynamic conditions. van der Lugt et al. (2019) introduced a dynamic bed roughness model within XBeach to capture changes in sediment mobility arising from changes in flow velocity induced by the removal or burial of dune vegetation. Van der Lugt’s roughness model accounts for roughness arising from roots exposed during erosion to a depth below the surface of 0.5 m, where this subsurface depth was selected based on model calibration to field data. However, Feagin et al. (2019) isolated the effect of belowground biomass in a laboratory setting and discovered a complex relationship where belowground biomass reduced erosion by attenuating wave energy and also increased erosion due to uprooting in clumps.
While a number of questions regarding barrier island dynamics remain unanswered, here we seek to understand the combined influence of dune topography and belowground biomass associated with dune vegetation on storm-induced erosion of narrow barrier islands (Fig. 1). Specifically, we conducted a parameter study with the physics-based computational model XBeach (Roelvink et al. 2009) by varying distance from the shoreline to the dune, dune shape, sediment grain size, and sediment mobility as an analogue for biomass. In the parameter study, emphasis is placed on understanding erosion arising during Sallenger’s (2000) storm overwash and inundation regimes. An in-depth understanding of these processes will lead to more quantitative measures of coastal vulnerability and improved methods for increasing resilience in coastal communities located on barrier islands as well as those communities located on bay shores, which benefit from the protection provided by the barrier islands.

Methods
The numerical model XBeach was used in surfbeat mode to simulate storm wave propagation, surge inundation, and sediment transport (Roelvink et al. 2009). XBeach was developed to investigate morphological change of complex topography during storm events, and it has been shown to perform with significant skill and accuracy (McCall et al. 2010; Van Dongeren et al. 2013). In this parameter study, we used XBeach to simulate storm-induced erosion of the barrier island over a range of topographic profiles, sediment grain sizes, and, as an analogue for belowground biomass, sediment mobility conditions (extending the dissertation work of Cheng 2015; Table 1). Except where noted below, default XBeach model settings were used (readers are referred to Bart (2017) for a summary of XBeach default settings). In all, the parameter study included 6,444 unique simulations, where real run time was six hours per simulation for a cumulative run time of more than four years. The following subsections describe the model setup for topography, sediment grain size, sediment mobility, and storm conditions for this parameter study.
| Parameter Name | Data Value |
|---|---|
| (1) | (2) |
| Peak surge (m, MSL) | 2.5, 3.0 |
| Dune elevation (m, MSL) | 2.5, 3.1, 4.2, 4.7, 5.5 |
| Distance from shoreline to dune crest (m) | 159, 169, 179, 189, 199, 209, 219, 229, 249 |
| Equilibrium sediment concentration factor | 0.01, 0.02, 0.03, 0.05, 0.07, 0.1, 0.14, 0.2, 0.3, 0.5, 0.7, 1.0 |
| Grain size ( and pairs, mm) | (0.2, 0.3), (0.4, 0.6), (0.6, 0.8) |
| Impeded mobility layer thickness (cm) | 5, 10 |
Note: Smaller indicates stronger biomass effect.
Idealized Topographic Profiles and Computational Grid
To assist in isolating the influence of dune topography and belowground biomass, we based our simulations on idealized alongshore-uniform topography. Selection of idealized topographic cross-shore profiles were informed by characteristics of the barrier islands along Moriches Bay, New York, USA. Ten cross-shore profiles were created from topographic lidar data (USACE et al. 2022) and bathymetric ETOPO data (NOAA 2022) in the Moriches Bay region (Cheng 2015). The lidar topography displayed large variability alongshore. For example, dune elevations range from approximately 4 to 8 m above mean sea level (MSL), distances from the shoreline to the dune crest range from 160 to 260 m, and total subaerial barrier island widths range from 100 to 600 m. In selecting idealized topographic characteristics, we gave preference to conditions likely to overwash and inundate during storms.
Fig. 2 provides an example of the idealized initial barrier island profile. The submerged portions of the initial profile in all simulations was fixed and specified by power laws with an exponent of 0.67 (Dean equilibrium profile) and constants of 0.15 and 0.02, respectively, in the ocean and in the bay. The initial subaerial profile in all simulations was characterized by a fixed cross-shore width of m and a fixed subaerial sediment volume of m3/m. The initial subaerial beach and back-barrier topography in all simulations was fixed and specified by power laws with an exponent of 0.50 and constants of 0.15 and 0.10, respectively, in the transition from 0 m, MSL to a nominal island elevation of 1.5 m, MSL.
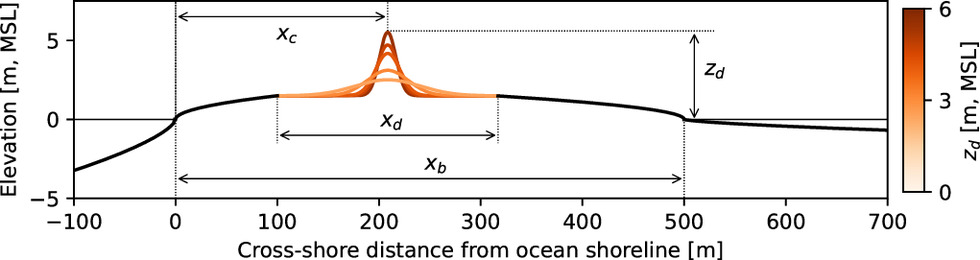
The dune was specified within the subaerial region spanning in Fig. 2. While the initial dune volume was held constant in all simulations, the dune profile takes on different shapes. The dune profile shape is based on the normal probability density function, so that different variances result in different shapes: a large variance corresponds to wider and shorter dunes (light orange in Fig. 2), while a small variance corresponds to narrower and taller dunes (dark orange in Fig. 2). The initial subaerial sediment volume within the region spanning is 406 m3/m (59% of total subaerial island volume ). Dune elevation, , varied from 2.5 to 5.5 m, with lower heights corresponding to wider dunes and higher heights corresponding to narrower dunes. Finally, distance from the ocean shoreline to the initial profile’s dune crest, , was varied from 159 to 249 m (Table 1).
These selected idealized profile conditions fall within the range of observed topographies along the United States Atlantic and Gulf or Mexico coasts (e.g., Cheng 2015; Cañizares and Irish 2008; USACE et al. 2022; NOAA 2022).
The horizontal computational grid resolution varies from 2 to 45 m, where finer resolution is used in areas with larger topographic gradients.
Sediment Grain Size Distribution
Sediment grain size was represented by a distribution characterized by the 50th and 90th percentile grain diameters, respectively and (Table 1). To understand the relative importance of grain size, we considered three different sands varying from fine ( mm) to coarse ( mm), which are characteristic of sandy barrier islands in the United States (e.g., Bocamazo et al. 2011; Feagin and Williams 2008). In each simulation, the grain size distribution was held uniform across the entire profile.
Belowground Biomass Simulation Using Equilibrium Sediment Concentration Factor
We assumed that belowground biomass acts to slow sediment mobility and, as such, can be simulated within XBeach by reducing equilibrium sediment concentration, , when biomass is present. We make use of preexisting XBeach model parameters within XBeach’s governing equations; no new parameters or modules are introduced into the modeling framework. This is achieved within the model by introducing into the two-dimensional advection-diffusion equation an equilibrium sediment concentration factor (XBeach’s parameter):where is the sediment concentration, and are the horizontal flow velocities in the and directions, respectively, is the water depth, and is the diffusivity. The factor varies from zero to one, where represents sediment alone (no biomass). When , proportionately less sediment can be picked up and, thus, transported.
(1)
In our simulations, we made use of ten vertical sediment layers to approximate the impact of belowground biomass overlaying sediment. The top nine layers are each 5 cm deep and the tenth layer encompasses all sediment below the ninth layer. Sediment mobility was impeded in the top one or two sediment layers spanning in Fig. 2. In this parameter study, we assumed an impeded mobility layer thickness range of 5 to 10 cm, based on our own observations (Fig. 1) that the fibrous roots likely to provide the most resistance to erosion are more densely packed toward the surface (e.g., Schweiger and Schuettrumpf 2021). Field observations in New Jersey, USA (Charbonneau et al. 2016) and North Carolina, USA (Walker and Zinnert 2022), for example, showed that maximum root depth of the native American beach grass (Ammophila breviligulata) prevalent along the US Gulf of Mexico and Atlantic coasts extended no more than approximately 40 cm below the surface. Charbonneau et al.’s field photographs demonstrate a sparsening of fibrous roots with depth from the surface and with lateral distance from the aboveground shoots. However, others reported deeper Ammophila breviligulata maximum root depth (e.g., USDA 2013), and Charbonneau et al. and others have noted that nonnative grass species can have much deeper root depths. The impeded mobility layer thickness was held uniform across the profile but varied from 5 to 10 cm, depending on the simulation (Table 1). In the initial profile’s impeded mobility layer in the biomass region , was varied from 0.01 to 1.0 (Table 1). Beneath the impeded mobility layer, was initially fixed at 1 (no reduction in sediment mobility) to represent sand. Outside of the biomass region, was likewise initially fixed at 1. The reduced- material initially in the impeded mobility layer is free to move between vertical layers during the simulation, as this material is eroded and deposited, or covered up. In this regard, our approach is similar to that of van der Lugt et al. (2019) in that both approaches facilitate time-varying sediment mobility as belowground biomass is eroded or buried. Fig. S1 presents representative initial, interim, and final profiles depicting the redistribution over time of material initially in the top vertical layers.
While cohesion in the belowground biomass will certainly impact sediment slumping by avalanching, in our approach, we do not make any specific adjustments for this process. Here, we used XBeach critical wet and dry avalanching slopes within the standard range given in the XBeach manual, (similar to XBeach BOI value of 0.15, Rijkswaterstaat 2022) and (XBeach manual’s listed default). XBeach model parameter settings related to avalanching and sediment layers are provided in Table S1 .
In using the combined effect of the model parameters and on sediment mobility as an analogue for the impact of belowground biomass, we do not claim that the model setup exactly mimics real belowground biomass properties. From this perspective, the model parameters and represent belowground biomass calibration parameters.
Storm Conditions
To assist in isolating the impact of dune shape and belowground biomass, idealized storm conditions were used in all simulations (Cheng 2015). Storm surge and wave conditions were selected to emphasize simulation of the Sallenger (2000) overwash and inundation regimes. This is a purely hypothetical storm that simplifies both surge height and wave height variation with time. Real storms may have shorter or longer durations and may exhibit some skewness around the surge peak, for example. In all simulations, storm significant wave height and peak period at the offshore boundary (25-m depth) are respectively 8 m and 10 s, where a unidirectional onshore JONSWAP spectrum is employed. Idealized storm surge was specified using the positive portion of a sine curve over a 6-hour duration, starting from 1.0 m, MSL then increasing to a peak of either 2.5 or 3.0 m, MSL before decreasing to 1.0 m, MSL (Table 1).
Data Analysis
Simulations were planned for all unique input parameter combinations in Table 1 for a total of 6,480 attempted simulations. Of these, 36 simulations (0.6%) failed leaving 6,444 completed simulations for analysis. For each completed simulation, the final bed elevation profile was saved for analysis. From these profiles, bed elevation change with respect to the initial profile is determined then used to quantify the following.
1.
Final dune elevation
2.
Shoreline change (positive is erosion)
3.
Total subaerial eroded volume (over ; due to mass conservation, eroded and accreted volumes are of similar magnitude)
4.
Overwash extent (measured horizontally from initial ocean shoreline m)
These output parameters were examined to determine their sensitivity and trends with respect to model input parameters, with emphasis on the influence of impeded sediment mobility. We used partial correlation analysis to isolate the influence of one input parameter while controlling for other input parameters. We further selected Spearman correlation to quantify correlation while allowing for nonlinear monotonic trends. For discussion, we interpret Spearman partial correlation coefficients as follows.
1.
Uncorrelated when
2.
Weakly correlated when
3.
Moderately correlated when
4.
Strongly correlated when
Simulation Results
Bed Profile Change
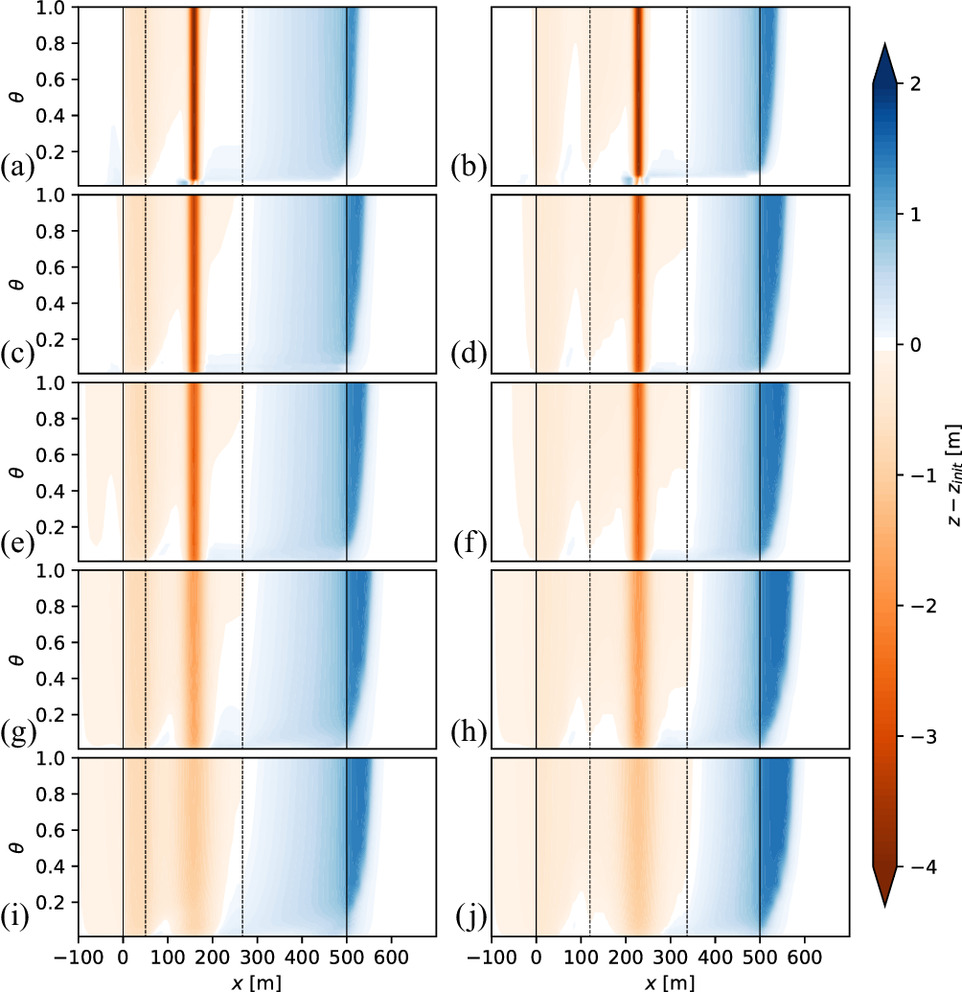
Fig. 3 depicts simulated bed elevation change along the cross-shore profile as a function of equilibrium sediment concentration factor for selected dune positions ( ) and elevations when peak surge is 2.5 m, MSL, median grain diameter is mm, and impeded mobility layer thickness is cm. Fig. 4 likewise depicts the same information for the 3.0-m, MSL peak surge case. Regardless of dune position and elevation, lower results in less sediment movement along the profile, both in terms of magnitude of vertical change and lateral extent of bed change. With the exception of the highest dune elevation case ( m, MSL) during the lower-surge event, for a given dune elevation, the amount of erosion at the dune crest is similar for the narrower [panels (a, c, e, g, and i)] and wider [panels (b, d, f, h, and j)] distance to dune crest cases. Yet, lateral extent of overwash deposit shifts landward (to the right) of the order of the difference in distance to the dune crest. The dune elevation of m, MSL during the lower-surge event varies from predominantly overwash regime to predominantly inundation regime, depending on the factor and distance to dune crest , with the wider case exhibiting more limited dune elevation erosion.

Respectively for the 2.5- and 3.0-m, MSL peak surge cases, Figs. 5 and 6 depict simulated bed elevation change along the cross-shore profile as a function of equilibrium sediment concentration factor for each of the three simulated grain size distributions and each of the two simulated impeded mobility layer thicknesses when the initial dune elevation is m, MSL and distance to the dune crest is m. As anticipated, sediment movement increases with decreasing sand grain diameter. However, a doubling of the impeded sediment layer thickness from 5 to 10 cm has a less dramatic influence on sediment movement; its influence is most pronounced for very low .


Statistical Analysis of Output Parameters
Table 2 lists Spearman partial correlation coefficients between input and output parameters when all 6,444 simulations are considered. All input–output parameter pairs result in statistically significant correlation, with -values less than 0.05. As anticipated, all output parameters exhibit moderate to strong correlation with peak surge, with positive correlation with shoreline change , total subaerial eroded volume , and overwash extent and negative correlation with final dune elevation .
| XBeach Input Parameter | ||||
|---|---|---|---|---|
| (1) | (2) | (3) | (4) | (5) |
| Peak surge | −0.59 | 0.88 | 0.60 | 0.66 |
| Dune elevation | 0.58 | −0.72 | −0.71 | −0.73 |
| Distance to dune crest | −0.05 | 0.58 | −0.16 | 0.17 |
| Equilibrium sediment concentration factor | −0.82 | 0.48 | 0.84 | 0.71 |
| Grain size | 0.63 | −0.78 | −0.77 | −0.79 |
| Impeded mobility layer thickness | 0.31 | −0.15 | −0.33 | −0.24 |
With respect to the two topographic characteristics, all output parameters are moderately correlated with initial dune elevation . Because initial subaerial profile volume is held constant in all simulations, a positive correlation with initial dune elevation also indicates a negative correlation with dune width, and vice versa. In contrast, all but shoreline change are uncorrelated (defined as ) with distance to dune crest . Shoreline change exhibits moderate positive correlation with .
With respect to sediment and sediment mobility characteristics, output parameters are moderately to strongly correlated with the factor and with sand grain size . In contrast, output parameters are uncorrelated to weakly correlated with impeded mobility layer thickness .
Overall, this Spearman partial correlation analysis on the full 6,444 simulation set suggests that sediment movement under the overwash and inundation regimes is dominated primarily by sediment grain size, the factor , and initial dune elevation. While the presence of the impeded mobility layer has a significant impact on sediment movement, as indicated by strong correlation with , the thickness of the impeded mobility layer only marginally influences sediment movement. The results further suggest that for these two storm regimes, distance to the dune crest does not measurably impact sediment movement.
Next, we investigate the range of output parameter responses as a function of the commonly accepted primary drivers of sediment change during inundation and overwash, initial dune height, and peak surge, while considering all other input parameters as sources of uncertainty. Fig. 7 depicts box plots of the output parameters when the simulations are grouped by like initial dune elevation (642 to 648 simulations per box). Total subaerial volume eroded [Fig. 7(e and f)] exhibits the most variation across a range of initial dune elevations, often varying by an order of magnitude. As anticipated, median decreases with increasing initial dune height, exhibiting a stronger trend with initial dune height for the lower-surge case [Fig. 7(e)].

Shoreline change [Fig. 7(c and d)] likewise exhibits variation across a range of initial dune elevations though the magnitude of change of the order of 20 m or less is relatively small with respect to distance to the dune. Notably, the direction of shoreline change generally shifts to accretion (negative) for the lower surge case [Fig. 7(c)] when dune elevation is 4.7 m or higher, corresponding to cases predominantly in the overwash regime.
Overwash extent [Fig. 7(g and h)] tends to be fairly consistent across simulations of the same initial dune height, except in the 4.7-m dune elevation case for the lower surge, when simulations span from being overwash-dominated to inundation-dominated. Final dune elevation [Fig. 7(a and b)] is likewise constrained to a small range close to the base island height of 1.5 m in all but the two highest initial dune elevation cases for the lower surge [Fig. 7(g)]. As with overwash extent, this wider range in final dune elevation at the higher initial dune heights reflects simulations spanning from overwash-dominated to inundation-dominated.
Fig. 8 depicts Spearman partial correlation between input and output parameters when data are grouped by like initial dune elevation and surge magnitude. With respect to sediment mobility, regardless of initial dune height, the total subaerial eroded volume [Fig. 8(e and f)] exhibits very strong correlation with both sediment grain size and the factor , and is moderately correlated with impeded mobility layer thickness . Except for the lower surge case [Fig. 8(a, c, e, and g)] when dune height is 4.7 m, MSL or higher, final dune elevation [Fig. 8(a and b)] and overwash extent [Fig. 7(g and h)] likewise are strongly correlated with and ; these output parameters are moderately to weakly correlated with .

Consistently, across initial dune heights, shoreline change exhibits strongest correlation with grain size [Fig. 8(c and d)]. Shoreline change mostly exhibits moderate positive correlation with the factor . Yet, for the highest dune and lowest surge case, shoreline change’s correlation with becomes weakly negative. Of the four output parameters, only shoreline change exhibits consistent dependence on distance to the dune crest ; here, correlation is moderate to strong for most initial dune height and storm condition combinations. Overwash extent’s dependence on varies from no correlation to highly correlated, with the highest correlation corresponding to the overwash-dominated case with low surge and high dune height. Final dune elevation and total subaerial eroded volume both exhibit weak to no correlation with .
The following sections discuss the nature of the relationship between the four analyzed output parameters and correlated input parameters.
Total Subaerial Volume Eroded
Fig. 9 depicts total subaerial eroded volume for the 2.5-m surge case when distance to the dune crest is m, as a function of the factor and median grain diameter ; results are shown for different initial dune elevations and for both impeded mobility layer thicknesses. Fig. 10 provides the same information when peak surge is 3.0 m. In general, higher and narrower dunes (higher ) result in less total erosion, although the initial subaerial island volume is kept constant.


Regardless of storm surge intensity and initial dune elevation, a lower results in less volume of total erosion. Decreasing sediment mobility has a greater impact on total volume eroded when sediment size is small; volume eroded is more variable with when median diameter is smaller and less variable when diameter is larger. In other words, the largest gradient in total volume generally occurs when both and are small while the smallest gradients are associated with higher and larger . The magnitude of these gradients increase with decreasing initial dune elevation, indicating that the impact of impeded mobility is more significant when the dune is narrower and wider, or alternatively, is more deeply inundated. The pattern of total eroded volume in the - space for the lower surge and highest dune elevation case [Figs. 9(a and b)] differs from the other surge and dune elevation cases, where in most simulations, the higher dune sufficiently protected against full inundation (i.e., simulations were overwash-dominated). Here, volume eroded approaches a linear trend with sediment size.
Final Dune Elevation and Overwash Extent
The influence of sediment mobility and sediment size on final dune elevation and on overwash extent are similar, as in Figs. 11 and 12 for simulations with initial dune height m, MSL and distance to dune crest m. This similarity is expected, given that more dune erosion means more sediment is available to be moved into the back-barrier region. Our simulation results yield a Spearman correlation coefficient of between these two output parameters.


Simulations depicted in Figs. 11 and 12 range from those that are predominantly overwash-regime dominated [panels (a and b)] to those that are predominantly inundation-regime dominated [panels (c and d)]. Panels (c and d) in these figures depict that when the island is unindated, the influence of the factor on and is limited to very small , of the order of 0.1 or smaller. For larger , and are nearly constant for a given sediment grain diameter, and variation with grain diameter is limited to a relatively small range.
In contrast, Figs. 11(a and b) exhibit strong variation in across all values of . The is most sensitive to when is larger, being close to constant when is less than approximately 0.2. The 4.0–4.3 m, MSL contour interval represents the transition from overwash-dominated to inundation-dominated conditions, exhibiting a much stronger dependence on grain diameter as the dune lowers below 4.3 m, MSL. This threshold flow condition is also apparent in Figs. 12(a and b), where overwash extent likewise rapidly increases with decreasing and increasing . Prior to reaching this threshold, overwash extent is limited to the vicinity of the dune.
Shoreline Change
While the shoreline’s position is seaward of the belowground biomass region, shoreline change exhibits sensitivity to the presence of the impeded mobility layer, as seen in Fig. 13 when the initial dune elevation is m and impeded mobility layer thickness is cm. Simulations shown for the lower surge case in Figs. 13(a and b) are generally overwash-regime dominant. The resulting shoreline response is accretion, as a result of mobilized sediment being redeposited seaward of the dune. In contrast, for inundation-dominant simulations, as is the case for the high surge [panels (c and d)], the resulting shoreline response is erosion and indicates a net loss of sediment from the region seaward of the dune.

Decreasing in the biomass region leads to less shoreline erosion during inundation events and less accretion during overwash events – reflecting an overall reduction in mobile sediment with lower . While increasing sediment grain size likewise leads to less shoreline erosion during inundation events, increasing grain size leads to more shoreline accretion during overwash events.
Of the output parameters we considered, shoreline change is most sensitive to initial dune position. As distance from the shoreline to the dune crest increases from narrower [panels (a and c)] to wider [panels (b and d)], less sediment is deposited at the shoreline during overwash events while more sediment is removed from the shoreline during inundation events.
Discussion and Conclusions
Significance of Results
While our results reinforce that initial dune elevation, hydrodynamic forcing, and sediment grain diameter remain dominant factors driving barrier-island change during storm overwash and inundation, our results also demonstrate that impedance of sediment mobility, as is the case in the presence of belowground biomass, can play a significant role in barrier-island change. Over the parameter ranges considered herein, the factor is potentially as important an indicator of eroded volume, dune elevation change, and overwash extent as is initial dune elevation and grain diameter (Table 2). The practical engineering significance of this result lies in quantitatively demonstrating the importance of designing and maintaining vegetation elements in conjunction with traditional beach nourishment topographic parameters.
As observed by van der Lugt et al. (2019) and Schweiger and Schuettrumpf (2021), our findings demonstrate the significance of belowground biomass in reducing the severity of erosion and its potentially important role in the transition between overwash and inundation regimes. Though our approach differs from van der Lugt et al.’s (2019) in that we impede sediment mobility rather than reduce flow velocity through roughness, both approaches allow for time-dependent variation in sediment erosion and deposition as a result of differing bed characteristics. While dune height remains a dominant driver of when and whether the flow regime transitions from overwash to inundation, this bed-characteristic time dependence is important. When total water level coincides with dynamic dune elevation, belowground biomass may well become the dominant factor in determining whether flow remains within the overwash regime or transitions to the inundation regime, particularly when threshold conditions occur near the water-level peak.
This study represents the first attempt to quantify barrier-island morphological response over a range of impeded mobility, grain diameter, and dune elevation. Our results show that the interplay between impeded sediment mobility and grain diameter is complex (Figs. 9–13). Yet, in nature, both dune vegetation and sediment characteristics vary not only at regional scales but also at local scales of the order of our finest model grid resolution (2 m) and less. Vegetation in particular varies over time as well. Such local-scale observational data are not readily obtained or available, though initiatives like the citizen-science sand grain project SandSnap (e.g., McFall et al. 2022) show promise for the future. In the meantime, our results may best be employed to quantify aggregate uncertainty in expected morphological response and in ensemble simulation applications (e.g., Monte Carlo) to characterize the range and likelihood of various morphological responses.
Modeling of Vegetation in XBeach
As is introduced in the Methods section, the belowground biomass-induced mobility reduction factor is a scaling factor applied to the equilibrium sediment concentration. Lower values reduce the equilibrium concentration within the top layers of bed sediment of specified thickness , and thereby limit the amount of sediment picked up by the flow. Our results show a strong dependence on , but a relatively weak dependence on . This relatively weak influence of changes in on morphological response is surprising. To further explore our finding regarding the relatively low importance of the impeded mobility layer thickness , we conducted a computational sensitivity analysis for the and m dune case when mm and , 0.1, 0.2, 0.3, and 0.5. We varied at 5-cm increments from 5 to 45 cm, with the deepest case being in the range of van der Lugt et al.’s (2019) somewhat arbitrarily selected belowground biomass XBeach calibration depth. Results for these 45 simulations are in Fig. 14. Of the four outputs, total subaerial eroded volume is the most sensitive to , where its influence is most pronounced for . For , the interquartile range of eroded volume is relatively small, within (13%) of the median result. Likewise, final dune elevation and overwash extent are only impacted when . When , respectively for and , the interquartile ranges are within and m of the median result; these differences are of the order of the numerical error and thus can be considered negligible. Variability in shoreline change across all values of is likewise negligible, with changes of no more than 5 m falling within the range of numerical error. Under the assumption that fibrous root density thins with depth below the surface, this sensitivity analysis largely supports our earlier finding that results are relatively insensitive to impeded mobility layer thickness . However, in cases where very dense, fibrous roots extend deep into the dune, impeded mobility layer thickness could become important.

It should be noted that and are not the only parameters in XBeach that affect vegetated flow and sediment transport. Instead, there is a whole group of parameters to define very detailed vegetation characteristics that influence vegetated flow, such as, vegetation stem diameter, vegetation density, and vegetation height per vegetation layer, to name a few. Using these parameters will lead to damping of waves which, in turn, will affect sediment transport (Van Rooijen et al. 2015).
The dissipation of waves mentioned above only applies to stationary vegetation and does not account for any vegetated sediments entrained by the flow. In comparison, a lower-than-one value for the factor not only affects erosion, but it will accelerate the deposition of sediment in the flow as well. In reality, the effect of vegetation on sediment transport is much more complicated and our knowledge is currently too limited to be able to fully model vegetated sediment transport as a process. For instance, the shape of vegetation itself – both its belowground root system and aboveground stem and leaf system – is a challenge for transport modeling; vegetation could capture flowing sediments, and vegetation could greatly alter the properties of surrounding sediments by making them cohesive and increasing the effective grain size (Feagin et al. 2019).
Practical application of the model parameters and to model specific belowground biomass necessitates calibration to field and laboratory data. There is currently no method for direct mapping of certain and values to a specific combination of vegetation species, maturity, and health. However, such relationships can be established, given sufficient field or experimental data of vegetation characteristics, flow conditions, and sediment transport. van der Lugt et al. (2019) demonstrated successful regional-scale calibration of their dynamic bed roughness model using initial roughness specified using spatially variable land cover classification and using field observations of overwash and breaching during hurricanes in Florida and New York, USA. A calibration exercise similar to that undertaken by van der Lugt et al.’s (2019) is a logical next step in mapping the parameter to land cover classification for practical application.
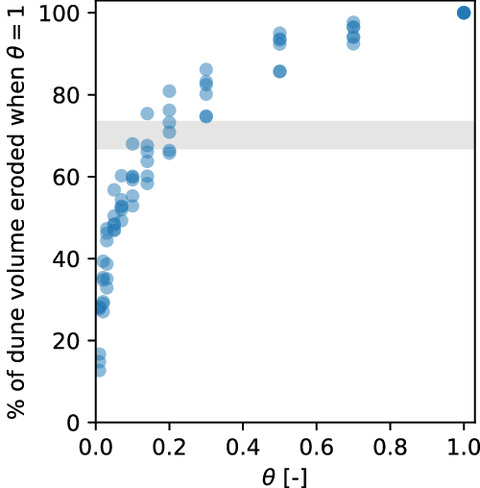
As performed by Schweiger and Schuettrumpf (2021), controlled laboratory experiments may likewise be used to constrain or calibrate model parameters. For example, as shown in Fig. 15, the recent work of Bryant et al. (2019) reveals that our simulations fall within the range of their belowground biomass laboratory results. The gray shaded area in the figure spans the range of Bryant et al. (2019) dune erosion results for the case where artificial belowground biomass is introduced uniformly throughout the dune and the dune overwashes. Our simulations suggest that setting the factor between 0.1 and 0.3 would lead to reasonable XBeach results for this experimental case.
In summary, our use of and to represent belowground biomass is an intuitive approach that works within XBeach’s existing governing equations and settings to approximate the impact of dense, fibrous roots on sediment mobility (see Methods section). Yet, this is a rather tentative approach to simulating the influence of vegetation on sediment transport. As such, this approach is currently difficult to verify and validate. Nonetheless, its simplicity allows us to represent the influence of belowground biomass in an intuitive way with just two model parameters, and , which makes possible a general parameter study that involves many other variables.
Parameterization of Dune Shape
In this study, we construct different dune shapes based on the probability density function of normal distributions. This approach allows the change of dune shape (height and width) while retaining a constant volume within the dune. However, a drawback of this approach is that for larger initial dune elevations ( ), the actual dune width is smaller than the defined belowground biomass region width . For example, the transition from the berm to the dune (dune toe) is typically determined by slope and would thus result in a narrower dune width. Our assumption that the biomass region is constant regardless of leads to impeded sediment motion outside of the actual dune width when is large.
Outlook
This study is the first parameter study aimed at investigating the impact of belowground vegetation biomass on barrier island response during storms. We have considered parameters including dune elevation, distance to the dune crest, sediment grain size, and belowground biomass-induced sediment mobility reduction. Our simulation results have demonstrated how each individual parameter affects subaerial erosion and deposition, and more importantly, revealed the complex interplay between parameters. Our results can also be employed in barrier island storm hazard prediction and protection efforts. Furthermore, our approach of implementing the influence of belowground biomass using existing XBeach model settings and governing equations may be readily adopted by practitioners, as it negates the need to implement new modules that are potentially more computationally intensive. Additional insights can be gained by expanding the number of input parameters (six) considered along with expanding the number of distinct values considered for each parameter. Such an expanded parameter study needs to take into account variations in, for instance, horizontal and vertical distribution of belowground biomass and aboveground stems and leaves, dune volume, elevation of berm and back barrier, and storm conditions (wave height, surge magnitude, and duration) – to include inducing conditions leading to Sallenger’s (2000) collision regime. Again, the purpose of this study is not focused on reproducing any specific storm case at any location, but to provide coastal engineers and scientists with a tool to better understand the sediment transport on vegetated barrier islands during storms. For dune design and restoration efforts, our results help point out the locations where most work is needed, and to what extent, if vegetation is involved in the dune design. This study has laid a solid groundwork for future studies, with the ultimate goal of improving our understanding of barrier island dynamics and better protecting the coastal communities from storms.
Data Availability Statement
XBeach is an open-source model made available by Deltares (https://oss.deltares.nl/web/xbeach/). Initial and simulated final profiles, final dune elevation, total subaerial eroded volume, shoreline change, and overwash extent generated and used during the study are available online in the Virginia Tech Data Repository in accordance with funder data retention policies (Irish et al. 2024, https://doi.org/10.7294/23739405).
Supplemental Materials
File (supplemental materials_jwped5.wweng-2047_irish.pdf)
- Download
- 1.66 MB
Acknowledgments
This material is based upon work that was primarily supported by the U.S. Army Corps of Engineers (USACE), Department of Defense (Northrop Grumman Subcontract No. 7500124898 for Grant No. W91278-10-D-0104) and was partially supported by the U.S. Coastal Research Program (USCRP) as administered by USACE (Grant No. W912HZ-20-2-0005) and the National Science Foundation (Grant Number 1630099). The photograph in Fig. 1(a) was taken during field work supported by the National Science Foundation (Grant Number 1312813). Figs. 2–15 were generated with Python 3, where contours in some panels in Figs. 9–13 were smoothed using a Gaussian filter to improve presentation. Any opinions, findings, and conclusions or recommendations expressed in this material are those of the authors and do not necessarily reflect the views, position or policy of these organizations, and no official endorsement should be inferred. The authors acknowledge the USACE and USCRP’s support of their effort to strengthen coastal academic programs and address coastal community needs in the United States. The authors acknowledge Advanced Research Computing at Virginia Tech for providing computational resources and technical support that have contributed to the results reported within this paper.
References
Bart, L. J. C. 2017. “Long-term modelling with XBeach: combining stationary and surfbeat mode in an integrated approach.” Master's thesis, Coastal Engineering, Technical Univ. Delft.
Bocamazo, L. M., W. G. Grosskopf, and F. S. Buonuiato. 2011. “Beach nourishment, shoreline change, and dune growth at Westhampton Beach, New York, 1996–2009.” J. Coastal Res. 59: 181–191. https://doi.org/10.2112/SI59-019.1.
Bryant, D. B., M. A. Bryant, J. A. Sharp, G. L. Bell, and C. Moore. 2019. “The response of vegetated dunes to wave attack.” Coastal Eng. 152: 103506. https://doi.org/10.1016/j.coastaleng.2019.103506.
Cañizares, R., and J. L. Irish. 2008. “Simulation of storm-induced barrier island morphodynamics and flooding.” Coastal Eng. 55 (12): 1089–1101. https://doi.org/10.1016/j.coastaleng.2008.04.006.
Charbonneau, B. R., J. P. Wnek, J. A. Langley, G. Lee, and R. A. Balsamo. 2016. “Above vs. belowground plant biomass along a barrier island: Implications for dune stabilization.” J. Environ. Manage. 182: 126–133. https://doi.org/10.1016/j.jenvman.2016.06.032.
Cheng, W. 2015. “The meso-scale particle transport model (mescapt) for studying sediment dynamics during storms and tsunamis.” Ph.D. thesis, Geosciences, Virginia Tech.
Feagin, R., M. Furman, K. Salgado, M. Martinez, R. Innocenti, K. Eubanks, J. Figlus, T. Huff, J. Sigren, and R. Silva. 2019. “The role of beach and sand dune vegetation in mediating wave run up erosion.” Estuarine Coastal Shelf Sci. 219: 97–106. https://doi.org/10.1016/j.ecss.2019.01.018.
Feagin, R. A., J. Figlus, J. C. Zinnert, J. Sigren, M. L. Martínez, R. Silva, W. K. Smith, D. Cox, D. R. Young, and G. Carter. 2015. “Going with the flow or against the grain? The promise of vegetation for protecting beaches, dunes, and barrier islands from erosion.” Front. Ecol. Environ. 13 (4): 203–210. https://doi.org/10.1890/140218.
Feagin, R. A., and A. M. Williams. 2008. “Sediment spatial patterns in a Hurricane Katrina overwash fan on Dauphin Island, Alabama, USA.” J. Coastal Res. 244 (4): 1063–1070. https://doi.org/10.2112/07-0862.1.
Figlus, J., J. M. Sigren, M. J. Power, and A. R. Armitage. 2017. “Physical model experiment investigating interactions between different dune vegetation and morphology changes under wave impact.” In Proc., Coastal Dynamics, 470–480. Kastrup, Denmark: Rohde Nielsen.
Gharagozlou, A., J. C. Dietrich, A. Karanci, R. A. Luettich, and M. F. Overton. 2020. “Storm-driven erosion and inundation of barrier islands from dune- to region-scales.” Coastal Eng. 158: 103674. https://doi.org/10.1016/j.coastaleng.2020.103674.
Hegermiller, C. A., J. C. Warner, M. Olabarrieta, C. R. Sherwood, and T. S. Kalra. 2022. “Modeling of barrier breaching during Hurricanes Sandy and Matthew.” J. Geophys. Res.: Earth Surf. 127 (3): e2021JF006307. https://doi.org/10.1029/2021JF006307.
Hoagland, S. W., C. R. Jeffries, J. L. Irish, R. Weiss, K. Mandli, S. Vitousek, C. M. Johnson, and M. A. Cialone. 2023. “Advances in morphodynamic modeling of coastal barriers: A review.” J. Waterway, Port, Coastal, Ocean Eng. 149 (5): 03123001. https://doi.org/10.1061/JWPED5.WWENG-1825.
Irish, J. L., W. Cheng, S. M. Patch, and R. Weiss. 2024. “Idealized cross-shore XBeach simulations of storm-induced barrier island change with varying subaerial profile and sediment mobility characteristics.” University Libraries, Virginia Tech. Dataset. Accessed March 14, 2024. https://doi.org/10.7294/23739405.
McCall, R., J. V. T. De Vries, N. Plant, A. Van Dongeren, J. Roelvink, D. Thompson, and A. Reniers. 2010. “Two-dimensional time dependent hurricane overwash and erosion modeling at Santa Rosa Island.” Coastal Eng. 57 (7): 668–683. https://doi.org/10.1016/j.coastaleng.2010.02.006.
McFall, B. C., D. L. Young, S. J. Whitmeyer, D. Buscombe, and S. Stever, et al. 2022. “Sandsnap—amassing a beach grain size database in the United States.” In Vol. 37 of Proc., Int. Conf. on Coastal Engineering Proceedings, 11. College Station, TX: Texas Digital Library.
NOAA (National Oeanic and Atmospheric Administration). 2022. “ETOPO1 global relief model.” NOAA. Accessed January 1, 2014. https://www.ngdc.noaa.gov/mgg/global/.
Passeri, D. L., J. W. Long, N. G. Plant, M. V. Bilskie, and S. C. Hagen. 2018. “The influence of bed friction variability due to land cover on storm-driven barrier island morphodynamics.” Coastal Eng. 132: 82–94. https://doi.org/10.1016/j.coastaleng.2017.11.005.
Rijkswaterstaat. 2022. “Validation of dune erosion model xbeach: Development of BOI sandy coast.” Utrecht, the Netherlands: Rijkswaterstaat. https://open.rijkswaterstaat.nl/publish/pages/183958/boi_zw_arcadis_deltares_2022_validation_of_dune_erosion_model_xbeach.pdf
Roelvink, D., A. Reniers, A. van Dongeren, J. van Thiel de Vries, R. McCall, and J. Lescinski. 2009. “Modelling storm impacts on beaches, dunes and barrier islands.” Coastal Eng. 56 (11): 1133–1152. https://doi.org/10.1016/j.coastaleng.2009.08.006.
Sallenger, A. H., Jr. 2000. “Storm impact scale for barrier islands.” J. Coastal Res. 16 (3): 890–895.
Schweiger, C., and H. Schuettrumpf. 2021. “Considering the effect of belowground biomass on dune erosion volumes in coastal numerical modelling.” Coastal Eng. 168: 103927. https://doi.org/10.1016/j.coastaleng.2021.103927.
Sherwood, C. R., J. W. Long, P. J. Dickhudt, P. S. Dalyander, D. M. Thompson, and N. G. Plant. 2014. “Inundation of a barrier island (Chandeleur Islands, Louisiana, USA) during a hurricane: Observed water-level gradients and modeled seaward sand transport.” J. Geophys. Res.: Earth Surf. 119 (7): 1498–1515. https://doi.org/10.1002/jgrf.v119.7.
Simmons, J. A., K. D. Splinter, M. D. Harley, and I. L. Turner. 2019. “Calibration data requirements for modelling subaerial beach storm erosion.” Coastal Eng. 152: 103507. https://doi.org/10.1016/j.coastaleng.2019.103507.
Smallegan, S. M., J. L. Irish, A. R. Van Dongeren, and J. P. Den Bieman. 2016. “Morphological response of a sandy barrier island with a buried seawall during Hurricane Sandy.” Coastal Eng. 110: 102–110. https://doi.org/10.1016/j.coastaleng.2016.01.005.
Stutz, M. L., and O. H. Pilkey. 2011. “Open-ocean barrier islands: Global influence of climatic, oceanographic, and depositional settings.” J. Coastal Res. 272 (2): 207–222. https://doi.org/10.2112/09-1190.1.
USACE, NOAA, and USGS (US Army Corps of Engineers, National Oeanic and Atmospheric Administration, and US Geological Survey). 2022. “Coastal topobathy lidar.” NOAA. Accessed January 1, 2014. https://coast.noaa.gov/digitalcoast/data/jalbtcx.html.
USDA. 2013. “Section 3b: Eastern region invasive plants ranked by degree of invasiveness as based on information from states.” Washington, DC: USDA.
van der Lugt, M. A., E. Quataert, A. van Dongeren, M. van Ormondt, and C. R. Sherwood. 2019. “Morphodynamic modeling of the response of two barrier islands to Atlantic hurricane forcing.” Estuarine Coastal Shelf Sci. 229: 106404. https://doi.org/10.1016/j.ecss.2019.106404.
Van Dongeren, A., R. Lowe, A. Pomeroy, D. M. Trang, D. Roelvink, G. Symonds, and R. Ranasinghe. 2013. “Numerical modeling of low-frequency wave dynamics over a fringing coral reef.” Coastal Eng. 73: 178–190. https://doi.org/10.1016/j.coastaleng.2012.11.004.
Van Rooijen, A., J. Van Thiel de Vries, R. McCall, A. Van Dongeren, J. Roelvink, and A. Reniers. 2015. “Modeling of wave attenuation by vegetation with XBeach.” In Proc., 36th IAHR World Congress. 1–7. Madrid, Spain: International Association for Hydro-Environment Engineering and Research (IAHR).
Walker, S. L., and J. Zinnert. 2022. “Whole plant traits of coastal dune vegetation and implications for interactions with dune dynamics.” Ecosphere 13 (5): e4065. https://doi.org/10.1002/ecs2.v13.5.
Yin, K., S. Xu, W. Huang, S. Liu, and M. Li. 2021. “Numerical investigation of wave attenuation by coupled flexible vegetation dynamic model and XBeach wave model.” Ocean Eng. 235: 109357. https://doi.org/10.1016/j.oceaneng.2021.109357.
Information & Authors
Information
Published In

Journal of Waterway, Port, Coastal, and Ocean Engineering
Volume 150 • Issue 3 • May 2024
Copyright
This work is made available under the terms of the Creative Commons Attribution 4.0 International license, https://creativecommons.org/licenses/by/4.0/.
History
Received: Jul 28, 2023
Accepted: Feb 12, 2024
Published online: Mar 21, 2024
Published in print: May 1, 2024
Discussion open until: Aug 21, 2024
ASCE Technical Topics:
- Barrier islands
- Biomass
- Coastal engineering
- Coastal processes
- Coasts, oceans, ports, and waterways engineering
- Dunes
- Energy engineering
- Energy sources (by type)
- Engineering fundamentals
- Fuels
- Gates (hydraulic)
- Geology
- Geotechnical engineering
- Hydraulic engineering
- Hydraulic structures
- Islands
- Mathematics
- Non-renewable energy
- Parameters (statistics)
- Renewable energy
- Shores
- Statistics
- Storm surges
- Water and water resources
Authors
Metrics & Citations
Metrics
Citations
Download citation
If you have the appropriate software installed, you can download article citation data to the citation manager of your choice. Simply select your manager software from the list below and click Download.