Developing Rules for Rental Subsidy: An Empirical Housing Study in Taiwan
Publication: Journal of Urban Planning and Development
Volume 150, Issue 4
Abstract
Homeownership rates have declined, underscoring the significant challenges our society faces in affording homes. This research aims to develop an effective and precise tool for swiftly evaluating and filtering out unqualified applications and establish consistent review criteria for cities and townships across Taiwan. The proposed approach involves the creation of a tool that utilizes particle swarm optimization-based fuzzy hyperrectangular composite neural networks. This paper, chosen without political bias and based on a randomly selected year, uses a data set of 36,086 entries from across Taiwan, with each application containing 10 distinct features for further analysis. The result achieves an impressive accuracy rate of 98.6% and produces 66 recommended rules for determining eligibility for rental subsidies. The contributions of this study are twofold: (1) the rapid auditing tool benefits both government agencies and applicants, streamlining the application process; and (2) the 66 rules generated by the tool offer valuable guidance to internal auditors, expediting audits and reducing personal biases. This promotes a more standardized and efficient workflow.
Introduction
Taiwan, encompassing an area of 36,197 km2, is home to a population of 23 million individuals, resulting in an average population density of 669 individuals per km2, placing it 16th in the global ranking. It has 6 municipalities and 13 counties, with a per capita GDP of $32,687. Fig. 1 illustrates the geographic distribution of these six municipalities as well as metropolitan areas, delineated by black lines, encompassing around 30% of Taiwan’s land area. Despite this relatively small land coverage, these municipalities host approximately 70% of the population. In recent times, metropolitan areas have witnessed a notable escalation in housing prices, attributed to the government's implementation of urban renewal initiatives and the expansion of mass rapid transit systems (Geng et al. 2015; Tsai 2018). There has been a decline in homeownership rates among all countries in the world, highlighting the formidable challenges these countries face in purchasing homes (Fung and Lee 2014; Powell et al. 2018; Fan et al. 2019). To address this issue, the government has introduced a housing rental subsidy program. However, the annual volume of applications for housing rental subsidies is substantial.
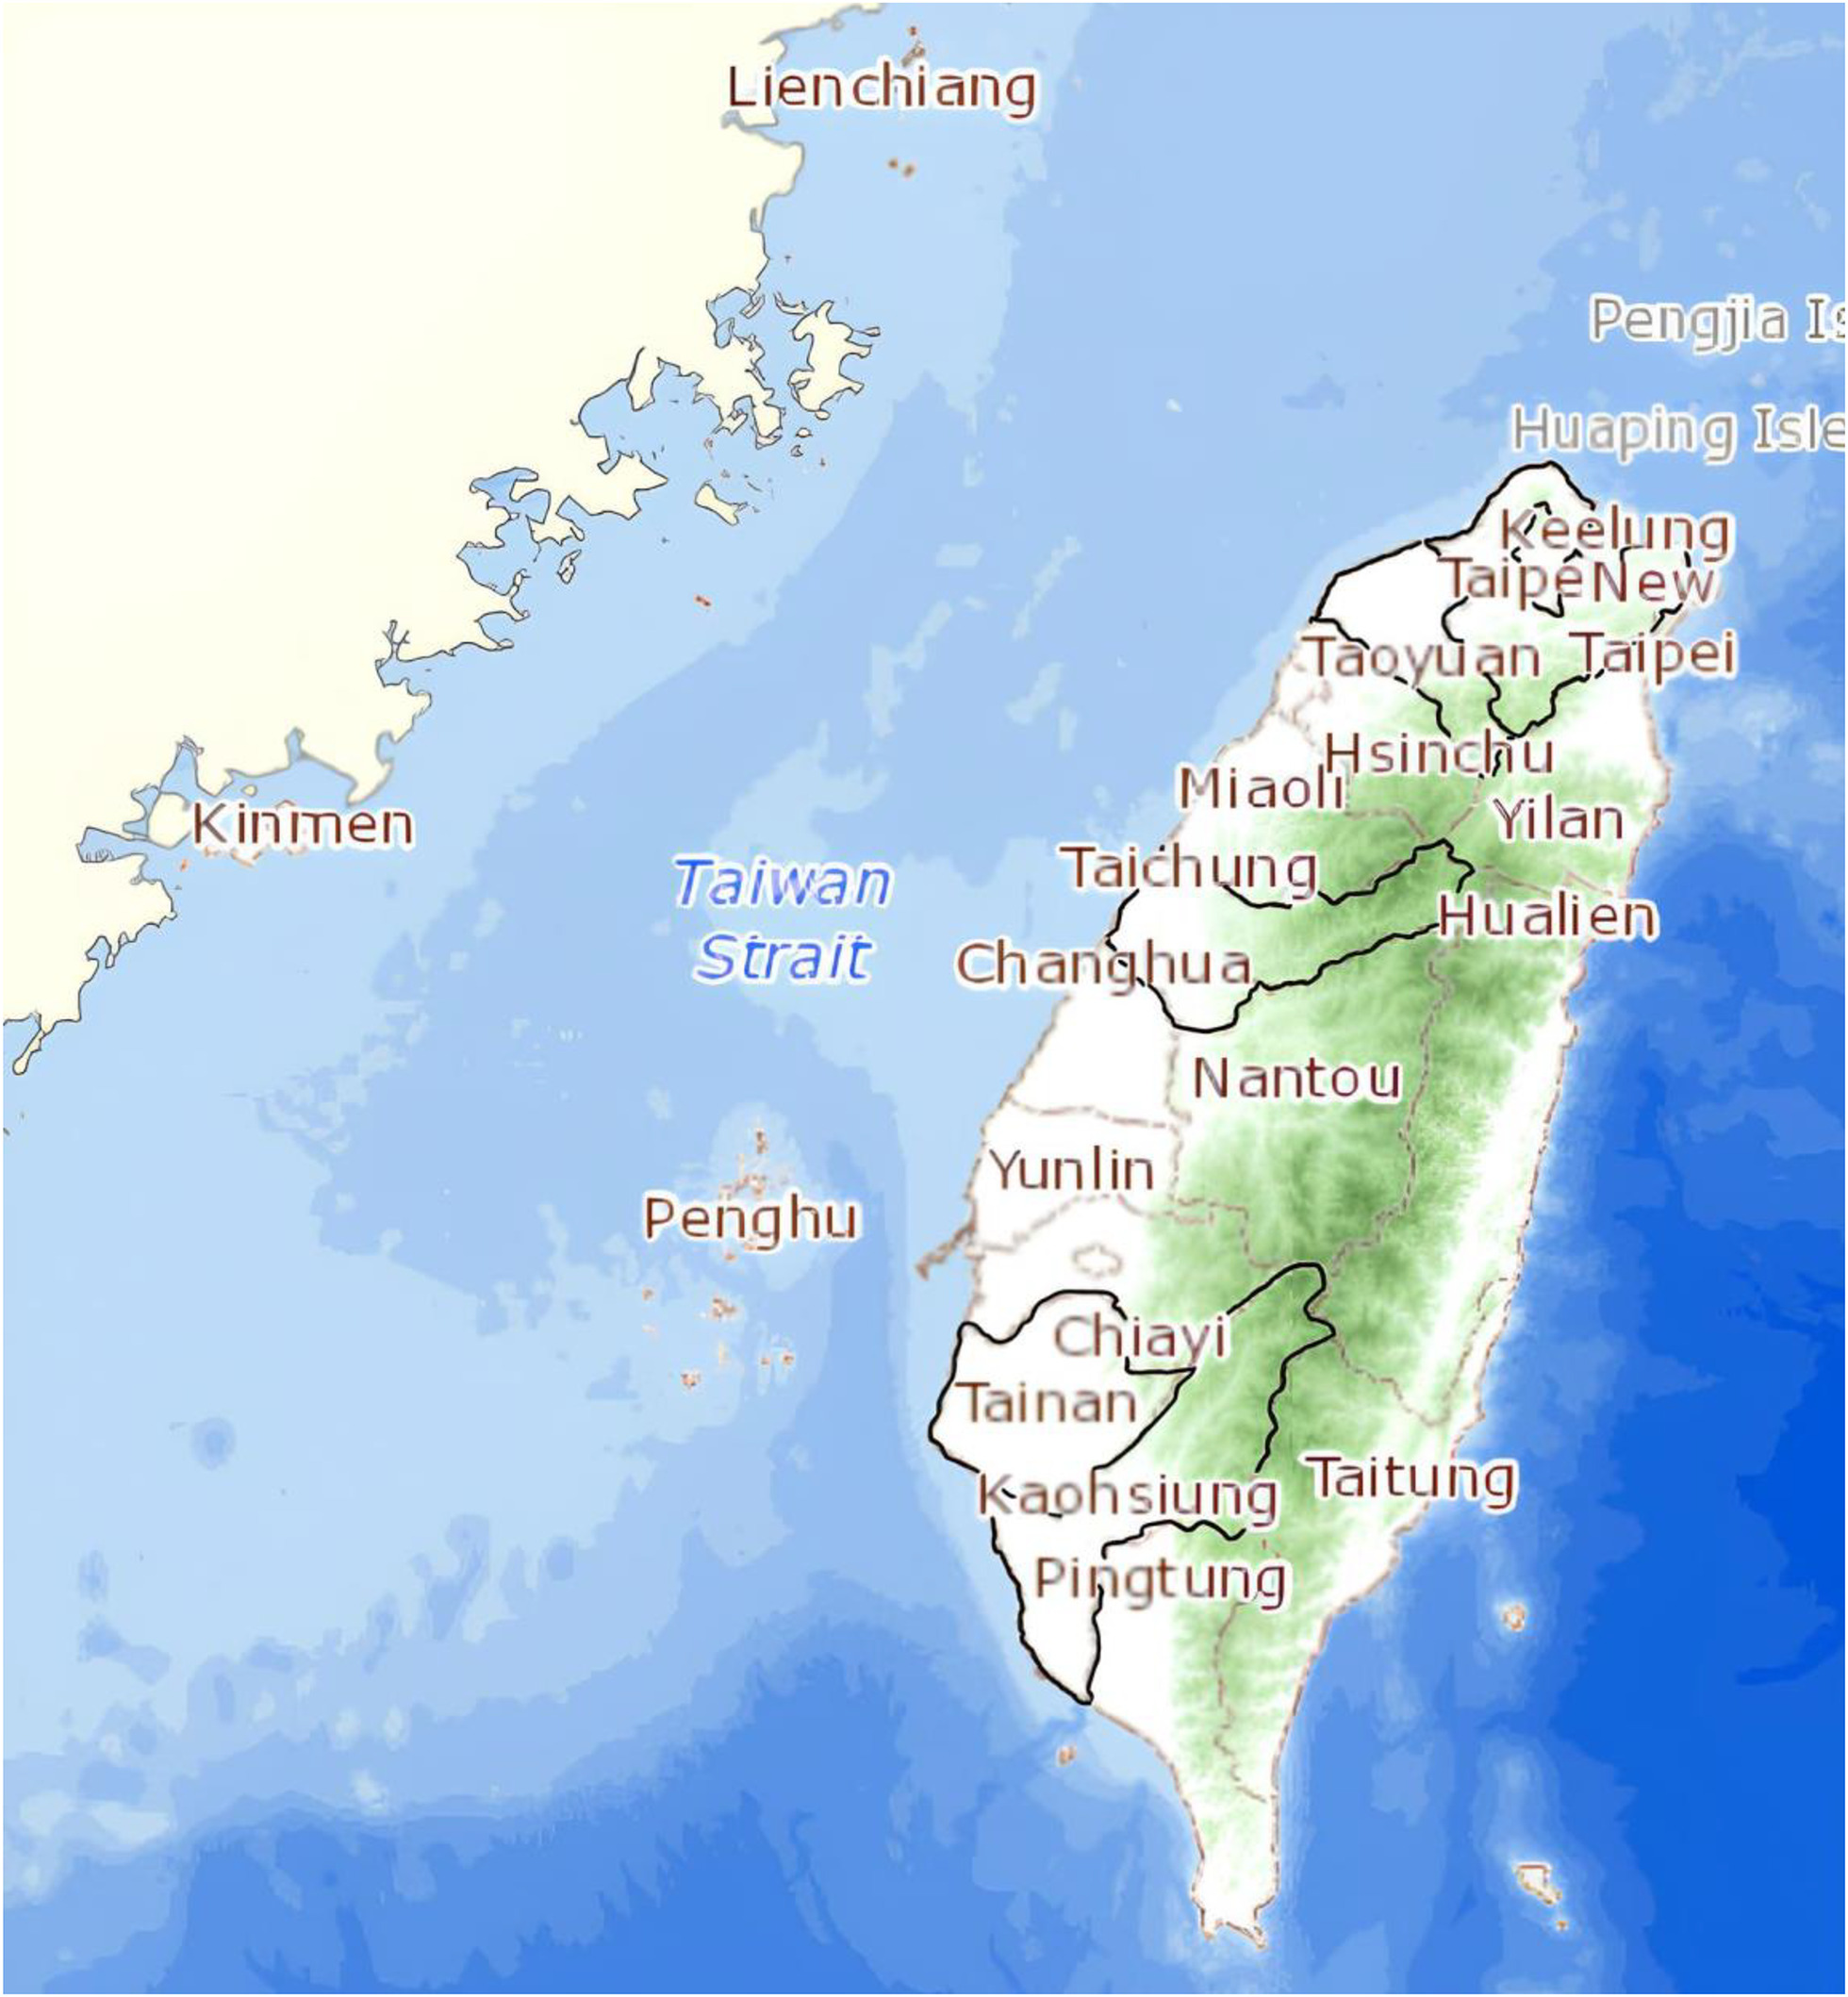
Fig. 1. Six municipalities and 13 counties of Taiwan.
(Map data from Ministry of the Interior 2023.)
The massive volume of the data renders conventional statistical analysis inadequate for fully assessing the potential eligibility of applicants. In light of recent advancements in information technology, various fields have turned to machine learning techniques for artificial intelligence predictions (da Silva et al. 2005; Kuşan et al. 2010; Gerek 2014; Zhou et al. 2014; Zhang et al. 2017; Wang et al. 2018). Machine learning classification involves using identifiable features to classify data into separate groups and develop a predictive model for households eligible for residential subsidies. Additionally, by inputting information about a new applicant seeking residential subsidies, the model can provide a reliable prediction of the applicant's eligibility for subsidies and offer insights into their actual qualifications.
In this study, an approach, utilizing particle swarm optimization (PSO)-based fuzzy hyperrectangular composite neural networks (PFHRCNNs), is employed to categorize housing subsidy applications. The primary goal is to efficiently sort and categorize applications based on specific data attributes. This method seeks to speed up the process of identifying unqualified applications, leading to substantial savings in manpower and providing useful guidelines for reviewers, both domestically and internationally. The newly developed rapid screening tool offers applicants prompt insights into their application outcomes upon entering their information. As a result, applicants can make informed decisions about continuing their application process. Government officials in other countries facing similar circumstances can use these results as a benchmark for verification purposes.
Literature Review
Computational Modeling Techniques in Classification
The utilization of classification and expert systems has become widespread across various fields of engineering and social sciences. This trend has been particularly pronounced over the last decade, driven by rapid technological advancements. Noteworthy applications have emerged in areas such as conflict resolution, sentiment analysis of media posts, earthquake prediction, concrete reinforcement, building information modeling, and shield tunneling (Vashishtha and Susan 2019; Gitis and Derendyaev 2019; Nasrollahzadeh and Afzali 2019; Wu and Zhang 2019; Tian and Ma 2019; Zhao et al. 2020). Computational modeling techniques encompass diverse methods, with neural networks, fuzzy systems, and evolutionary computation being the three major approaches. These approaches have indeed yielded solutions to challenges in both scientific and social science research. Fuzzy and neural networks play a significant role in streamlining the auditing process and detecting errors (Chen et al. 2011). Researchers have devised a set of precise If–Then rules through a PSO-based fuzzy algorithm to enhance medical diagnosis (Hsieh et al. 2014a). The rough set approach has been harnessed to identify meaningful relationships between variables in extensive data sets, employing association rule mining techniques (Feng et al. 2016). Studies integrating neural networks with fuzzy logic or other optimization algorithms have proven successful in addressing practical issues such as predicting financial distress (Chen 2012a; Chen et al. 2016), managing financial risk (Chen et al. 2012a; Chen 2012b), assessing damage, detecting cracks, and recognizing patterns in remote sensing images (Su et al. 2011; Chen et al. 2012a, 2014, 2017). It has been established that integrating neural networks with fuzzy logic or other optimization methods offers efficient and effective solutions for real-world problems.
Rental Subsidy Policy among Countries
Rental subsidy pertains to direct financial assistance extended by the government to low-income households. Its purpose is to enable the recipient to select suitable housing and a preferred place of residence (Colburn 2019; Blunden and Flanagan 2020; Braakmann and McDonald 2020; Ma et al. 2022). The government fills the financial gap, allowing these households to afford their rent comfortably (Li and Wu 2019; Quiroga et al. 2018; Harting and Radi 2020). Meanwhile, residential subsidies involve either direct or indirect assistance provided to housing customers or suppliers only for residential purposes. These subsidies can manifest as interest rate reductions on loans, monetary grants, or tax incentives (Heylen 2020; Alva et al. 2022). The government's role in housing subsidies primarily involves optimizing the distribution of residential resources within the market and establishing operational regulations to stabilize the national economy. When faced with imperfect competition and economic inflation, ensuring fairness involves income redistribution and other factors. Government intervention in the residential market indicates its recognition of the market’s lack of complete competitiveness. The subsidy approach in European and American countries typically considers the tenant’s household auditing and size, seldom providing fixed cash amounts as subsidies (Schwartz 2006; Lund 2007). In the context of urban housing system reforms, there has been a significant focus on the economic aspects of residential investment, often overlooking the housing needs of low-income families, such as young families, single-parent families, disabled individuals, and others (Chen et al. 2010). Research on rental subsidies has revealed that housing subsidies are predominantly directed at low-income residents (Dickson-Gomez et al. 2016).
Since 2007, Taiwan has witnessed a plethora of new phenomena, including population aging, shifts in family structures, a widening wealth gap, increased population mobility, and heightened ease of policy advocacy. According to these developments, it is imperative for the government’s public sector to reassess and consolidate housing subsidy policies concerning domestic housing issues, target demographics, and aid methods. The introduction of the “Residential Subsidy Resource Implementation Plan” in 2007 marked a significant step. This initiative aimed to address national income levels and vulnerability, offering tailored and diverse housing subsidy measures or administrative aid to various applicant households. Employing an evaluation mechanism, it assesses individual applicant conditions against predetermined criteria to determine scores and allocate subsidies based on the annual number of households processed by each county and city government.
Due to the lengthy and time-consuming nature of the housing subsidy application process, submissions commence in July annually and conclude by the end of August. These applications are then processed by the respective authorities of each county and city government. It is expected that the review process will be finalized by December, following which each county and city government will inform applicants of the review outcomes in writing. Should applicants wish to inquire about their application status, they can contact the county (or city) government where their household registry is located beginning in December of the same year. This process entails a 4-month wait from the application date to receiving the results, leaving applicants in limbo regarding the status of their application and posing significant inconvenience in terms of housing arrangements. Furthermore, the application process spans over 4 months from submission to outcome announcement, posing challenges for many applicants who may struggle to secure alternative sources of income during this period. The subsidy is categorized into four types of rental subsidies ranging from 3,000 to 5,000 NTD (100–166 USD), which may have a more pronounced impact in the central and southern regions. However, in metropolitan areas of the northern region where the housing price-to-income ratio (housing affordability) exceeds nine times and the mortgage burden rate is 36%, it is evident that this amount remains insufficient.
Under the principles of fair and efficient resource allocation, how to respond to appropriate rental structures and resource allocation remains an area for the government to continually ponder. Ongoing investigations into rental subsidies concentrate primarily on applicants’ economic circumstances. However, there is a dearth of reasonable audit standards in the government's relevant subsidy policies. It becomes imperative to design an improved audit mechanism to enhance the quality of rental housing, striking a balance within the overall housing market and facilitating the equitable distribution of resources.
Methodology
Since its inception in 2008, the subsidy program has processed data ranging from nearly 10,000 to over 30,000 annually, accumulating to over a hundred thousand entries. Analyzing this vast database using traditional statistical methods may be somewhat inadequate, thus utilizing data mining techniques seems more appropriate. With the advancement of information technology and the maturity of data mining techniques, many scholars are using data mining techniques for research. The deeper they delve, the better they understand the limitations of statistical methods, making it a suitable tool for analyzing massive amounts of data. Performance evaluations, financial crises, medical pathology, and other fields have all demonstrated the considerable reference value of the accuracy and feasibility of results obtained through data mining analysis of massive data sets.
Building upon the aforementioned considerations, this study devised a methodology illustrated in Fig. 2.
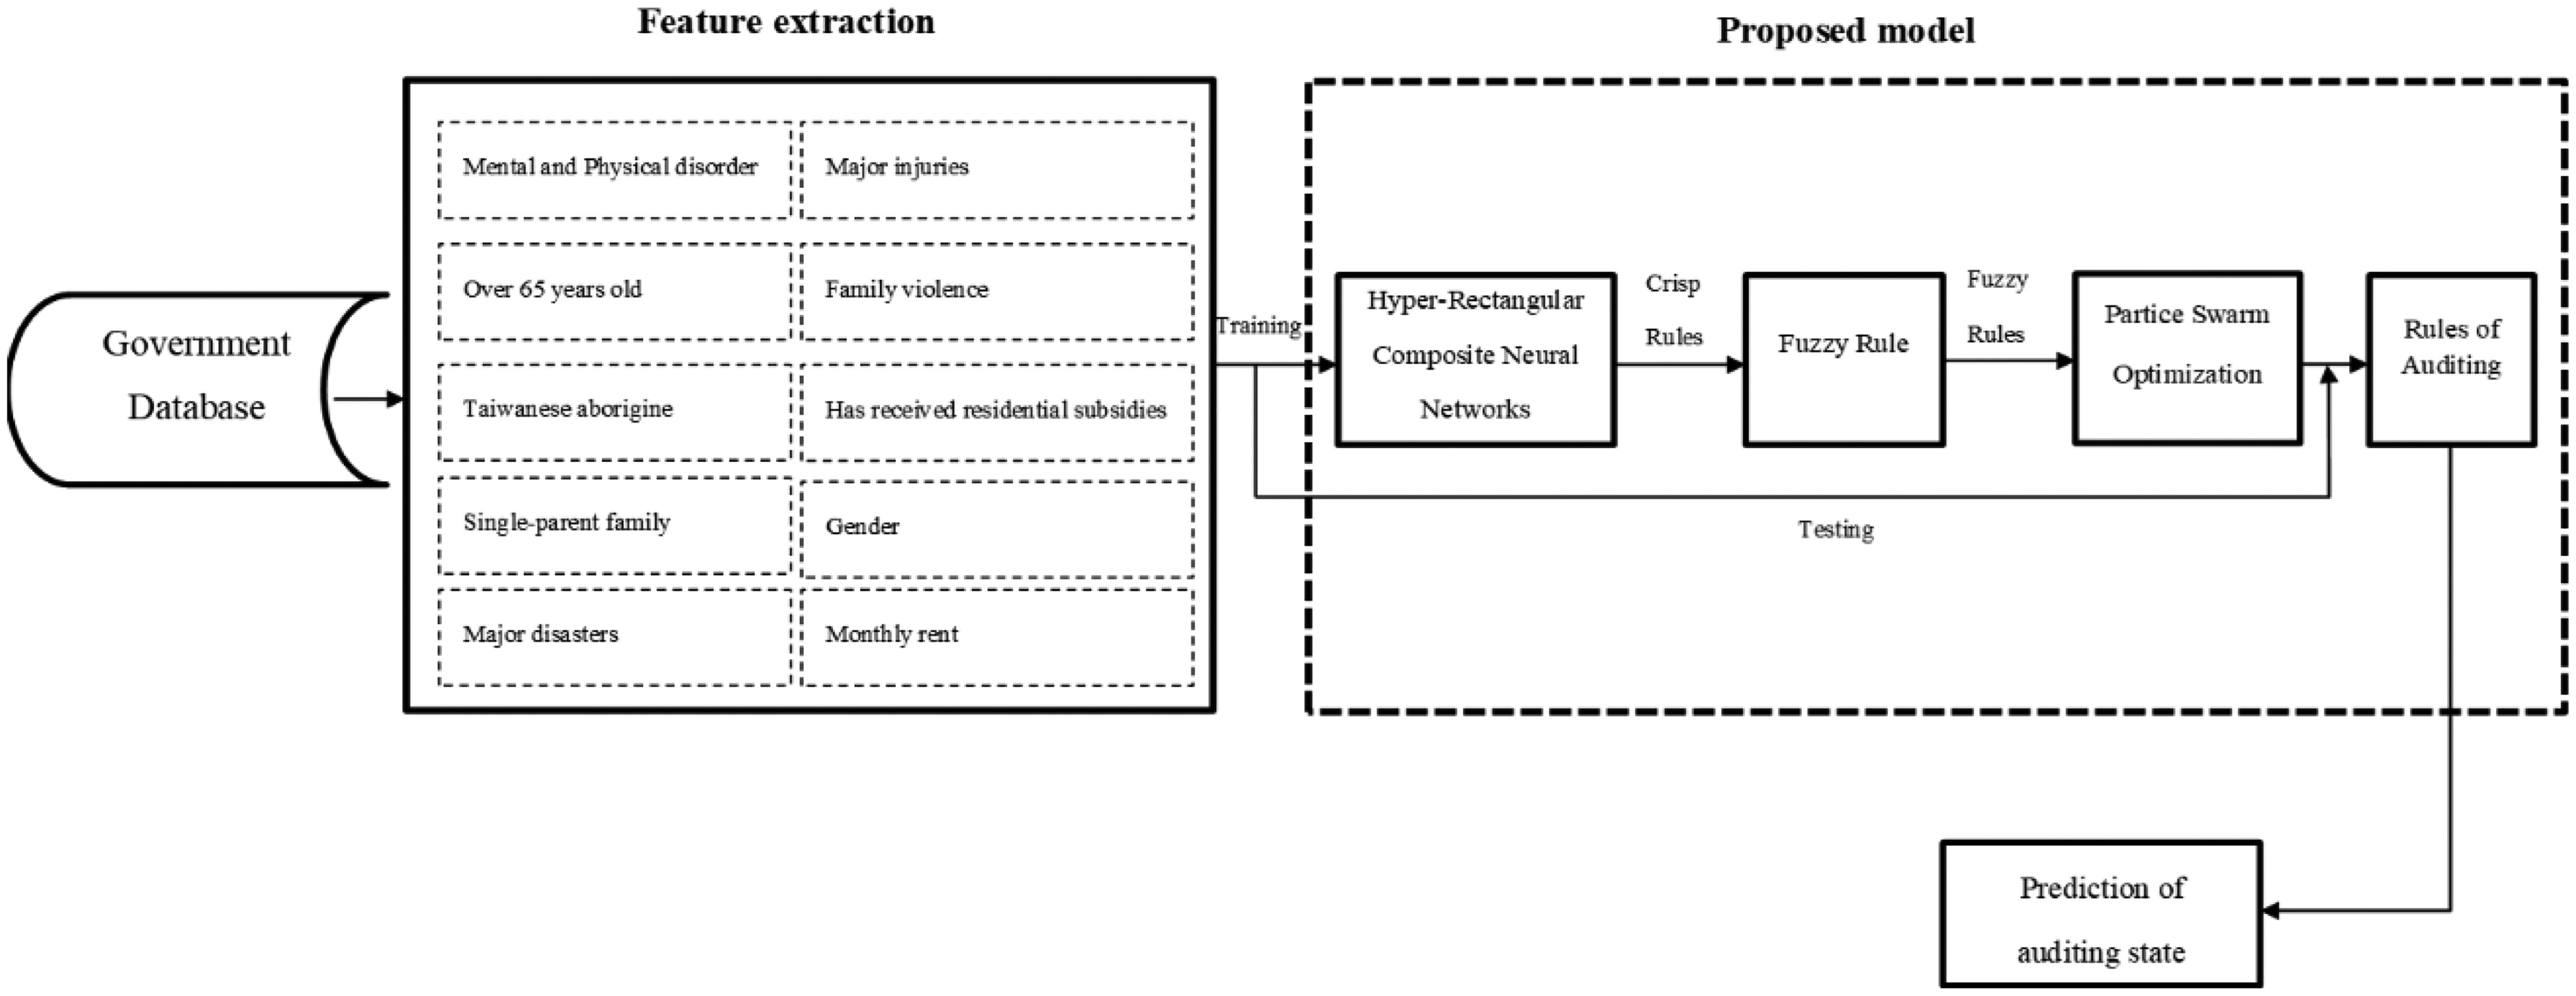
To initiate the process, raw attributes were extracted from segments of the government database (Ministry of Interior 2023). The application procedures for rental subsidies must be completed online. All information and data entered into the system underwent error-checking procedures to ensure accurate records without any defects. The feature set covered 10 categories, including mental and physical disorders, age over 65, Taiwanese aborigine status, single-parent households, major disasters, severe injuries, family violence, prior residential subsidies, gender, and monthly rent. Following the extraction of features, the proposed model trained hyperrectangular composite neural networks (HRCNNs) for each category, resulting in a set of precise rules. However, a challenge inherent in these rules was their varying effectiveness; consequently, each definitive rule underwent transformation into a fuzzy rule, accompanied by a confidence factor to bolster their efficacy. Notably, the significance of a rule is determined by its higher confidence factor value. Subsequently, a PSO approach was employed to simultaneously streamline the rules, identify optimal confidence factors, and fine-tune the positioning of the remaining hyperrectangles to enhance their effectiveness. Ultimately, a PFHRCNN was established, comprising a compilation of fuzzy rules, facilitating the prediction of the auditing state.
Data Collection and Feature Extraction
To steer clear of political sensitivity, typically entailing confidential policies, personal information, and regional development concerns, the present investigation delved into data concerning subsidy applications a decade ago (Year 2012), sourced from the government data repository. The rationale behind selecting this specific year lies in its alignment with the research project (MoI-102A-030) sanctioned by the Ministry of Interior, which sought to assess the satisfaction level regarding rental subsidies in Taiwan during 2012. While certain portions of this project’s findings remained confidential for a considerable duration, a portion of the outcomes has been put into practice and retains relevance in contemporary policy considerations. The data set underwent a meticulous curation process involving the removal of unreasonable and duplicated entries due to inaccuracy, wrong procedure, and late applications, culminating in utilizing 36,086 valid records for subsequent analysis. In the subsequent sections, pivotal features are scrutinized, and comparisons are drawn between approved applicants and the entire applicant pool through feature extraction. These preprocessed outcomes of feature extraction served as inputs for the subsequent model. The efficacy of subsidy application outcomes is influenced by an array of factors. For the present analysis, 10 pivotal demographic attributes were distilled, and the ensuing outcomes are presented in both Tables 1 and 2:
1.
Physical and mental disability: The proportion of applicants who have either physical or mental disabilities.
2.
Elderly population (over 65): The percentage of applicants aged over 65 years.
3.
Indigenous ethnicity (Taiwanese aborigine): The proportion of applicants belonging to Indigenous ethnic groups officially recognized in Taiwan. Currently, there are 16 ethnic groups officially recognized by the Taiwan government, which comprise approximately 2.5% of Taiwan's population.
4.
Single-parent households: The percentage of applicants hailing from single-parent families.
5.
Major catastrophes: The proportion of applicants who have experienced significant calamities, including natural disasters.
6.
Serious injuries or illnesses: The percentage of applicants with severe injuries or major health conditions.
7.
Domestic violence: The proportion of applicants who are victims of domestic violence.
8.
Prior housing subsidy recipients: The percentage of applicants who have previously received housing subsidies.
9.
Gender (male): The proportion of male applicants.
10.
Average monthly rent: The mean monthly rental amount paid by applicants.
| County/city and feature name | Mental and physical disorder (%) | Over 65 years old (%) | Taiwanese aborigine (%) | Single-parent family (%) | Major disasters (%) | Major injuries (%) | Family violence (%) | Has received residential subsidies (%) | Monthly rent (TWD) | Gender (male) (%) |
|---|---|---|---|---|---|---|---|---|---|---|
| Taipei | 8.52 | 10.44 | 2.87 | 19.23 | 0.07 | 3.66 | 0.25 | 46.76 | 13,197.08 | 42.14 |
| New Taipei | 17.72 | 5.01 | 4.76 | 19.67 | 0.03 | 2.96 | 0.17 | 45.30 | 10,605.05 | 42.93 |
| Taichung | 9.66 | 5.58 | 4.94 | 27.32 | 0.05 | 3.98 | 0.21 | 49.26 | 8,123.44 | 40.13 |
| Tainan | 10.70 | 7.33 | 1.69 | 26.54 | 0.00 | 4.12 | 0.14 | 57.17 | 6,905.69 | 42.03 |
| Kaohsiung | 13.39 | 8.46 | 2.86 | 30.94 | 0.03 | 5.73 | 0.32 | 56.27 | 6,868.95 | 40.02 |
| Keelung | 13.76 | 8.74 | 13.57 | 28.11 | 0.00 | 5.41 | 0.26 | 54.53 | 6,837.62 | 42.53 |
| Yilan | 17.61 | 5.97 | 12.23 | 33.82 | 0.15 | 4.72 | 0.15 | 66.62 | 6,575.10 | 37.95 |
| Taoyuan | 10.31 | 5.87 | 8.23 | 25.42 | 0.03 | 2.60 | 0.14 | 55.36 | 7,824.17 | 39.92 |
| Hsinchu | 6.74 | 6.74 | 15.84 | 31.96 | 0.29 | 1.76 | 0.29 | 46.33 | 7,881.16 | 46.33 |
| Miaoli | 13.86 | 6.74 | 9.72 | 30.70 | 0.52 | 4.92 | 0.52 | 52.20 | 6,484.43 | 39.64 |
| Changhua | 12.24 | 5.89 | 4.00 | 19.93 | 0.09 | 4.00 | 0.05 | 62.59 | 6,729.98 | 39.48 |
| Nantou | 13.96 | 9.24 | 6.47 | 33.72 | 1.01 | 3.51 | 0.94 | 48.15 | 6,315.61 | 38.77 |
| Yunlin | 11.60 | 6.10 | 2.51 | 23.68 | 0.00 | 4.19 | 0.24 | 55.02 | 6,102.13 | 37.32 |
| Chiayi | 11.09 | 5.51 | 1.19 | 30.65 | 0.15 | 4.69 | 0.67 | 53.87 | 6,347.26 | 36.83 |
| Pingtung | 18.25 | 6.65 | 7.92 | 32.11 | 0.11 | 6.02 | 0.52 | 63.02 | 5,875.95 | 40.10 |
| Taitung | 11.74 | 5.47 | 32.48 | 36.01 | 0.00 | 2.25 | 0.64 | 55.31 | 6,223.58 | 36.82 |
| Hualien | 20.66 | 7.80 | 28.65 | 30.80 | 0.49 | 7.50 | 0.58 | 43.76 | 6,490.42 | 37.23 |
| Penghu | 13.43 | 6.36 | 1.06 | 26.15 | 0.00 | 2.47 | 0.00 | 54.42 | 6,245.39 | 46.29 |
| Kinmen | 12.99 | 9.60 | 3.95 | 30.51 | 0.00 | 1.69 | 0.00 | 57.06 | 6,140.06 | 38.98 |
| Hsinchu City | 6.98 | 5.28 | 5.45 | 32.54 | 0.00 | 2.21 | 0.00 | 49.23 | 9,166.67 | 38.50 |
| Chiayi City | 11.09 | 5.51 | 1.19 | 30.65 | 0.15 | 4.69 | 0.67 | 53.87 | 6,347.26 | 36.83 |
| Lianjiang | 50.00 | 0.00 | 50.00 | 0.00 | 0.00 | 0.00 | 0.00 | 0.00 | 7,500.00 | 50.00 |
| County/city and feature name | Mental and physical disorder (%) | Over 65 years old (%) | Taiwanese aborigine (%) | Single-parent family (%) | Major disasters (%) | Major injuries (%) | Family violence (%) | Has received residential subsidies (%) | Monthly rent (TWD) | Gender (male) (%) |
|---|---|---|---|---|---|---|---|---|---|---|
| Taipei | 8.65 | 10.93 | 2.90 | 20.86 | 0.09 | 3.92 | 0.16 | 52.58 | 13,230.27 | 41.58 |
| New Taipei | 17.21 | 5.31 | 4.88 | 20.95 | 0.03 | 3.02 | 0.16 | 48.46 | 10,569.99 | 42.76 |
| Taichung | 9.59 | 5.57 | 4.79 | 28.66 | 0.05 | 4.07 | 0.20 | 52.14 | 8,106.47 | 39.66 |
| Tainan | 10.95 | 7.50 | 1.64 | 27.56 | 0.00 | 4.15 | 0.12 | 59.51 | 6,875.27 | 41.84 |
| Kaohsiung | 13.60 | 8.56 | 2.66 | 31.93 | 0.02 | 5.80 | 0.30 | 58.47 | 6,845.18 | 39.63 |
| Keelung | 14.23 | 8.81 | 13.32 | 28.66 | 0.00 | 5.48 | 0.28 | 56.14 | 6,822.98 | 42.26 |
| Yilan | 17.85 | 5.95 | 11.35 | 35.16 | 0.16 | 4.93 | 0.16 | 68.36 | 6,552.53 | 37.43 |
| Taoyuan | 10.15 | 5.83 | 8.01 | 26.46 | 0.03 | 2.57 | 0.13 | 57.80 | 7,831.84 | 39.52 |
| Hsinchu | 6.41 | 7.37 | 15.38 | 33.97 | 0.32 | 1.60 | 0.00 | 46.47 | 7,846.76 | 45.19 |
| Miaoli | 13.81 | 6.91 | 9.78 | 31.80 | 0.58 | 5.32 | 0.58 | 55.54 | 6,472.87 | 38.71 |
| Changhua | 12.04 | 6.07 | 4.08 | 20.64 | 0.10 | 4.08 | 0.00 | 64.06 | 6,701.64 | 39.34 |
| Nantou | 14.44 | 9.84 | 6.35 | 36.27 | 1.11 | 3.57 | 0.95 | 54.13 | 6,311.28 | 37.54 |
| Yunlin | 11.80 | 6.29 | 2.49 | 25.16 | 0.00 | 4.19 | 0.26 | 58.98 | 6,080.47 | 36.96 |
| Chiayi | 11.30 | 5.38 | 1.19 | 31.62 | 0.08 | 4.82 | 0.71 | 55.65 | 6,321.86 | 37.00 |
| Pingtung | 18.46 | 6.68 | 7.11 | 33.20 | 0.12 | 6.05 | 0.55 | 65.57 | 5,858.87 | 39.96 |
| Taitung | 11.62 | 5.81 | 32.12 | 32.12 | 0.00 | 2.36 | 0.73 | 60.62 | 6,216.51 | 38.48 |
| Hualien | 21.20 | 8.32 | 28.30 | 31.85 | 0.44 | 7.66 | 0.44 | 47.84 | 6,436.42 | 38.40 |
| Penghu | 13.86 | 5.99 | 0.75 | 26.22 | 0.00 | 2.62 | 0.00 | 56.18 | 6,264.66 | 47.19 |
| Kinmen | 13.94 | 10.30 | 3.64 | 32.73 | 0.00 | 1.82 | 0.00 | 60.00 | 6,024.19 | 40.61 |
| Hsinchu City | 6.86 | 5.38 | 5.38 | 34.32 | 0.00 | 2.23 | 0.00 | 51.76 | 9,176.28 | 38.78 |
| Chiayi City | 11.30 | 5.38 | 1.19 | 31.62 | 0.08 | 4.82 | 0.71 | 55.65 | 6,321.86 | 37.00 |
Table 1 displays the comprehensive outcomes concerning applicants’ city of residence, with each applicant potentially possessing multiple attributes. In Lianjiang County, a noteworthy percentage of features is attributed to a limited number of rental subsidy applications, with merely two valid data sets available in 2012. As a result, the data from Lianjiang County deemed insufficient for further analysis. In contrast, Table 2 provides insights into approved applicants based on their city of residence. Notably, among all features, applicants from single-parent families who have previously received residential subsidies exhibit the highest proportions. The analysis of Tables 1 and 2 reveals a noteworthy trend: applicants with attributes like physical and mental disorders, age exceeding 65 years, membership in single-parent families, and major injuries are more likely to secure subsidies. Delving further into the data of applicants and approved applicants within each monthly rental subsidy program, it is observed that Taipei boasts the highest ratio of approved applicants within the monthly rent distribution, surpassing 10,000 TWD (New Taiwan Dollar), which is approximately 320 USD, while Pingtung County exhibits the lowest such ratio. Despite this, Tables 1 and 2 exhibit minimal disparity in monthly rent figures between all applicants and approved applicants. Irrespective of approval status, rents predominantly cluster below 10,000 TWD, with the majority falling within the range of 10,000–5,000 TWD.
Proposed Model
Prior research has harnessed big data analysis to glean valuable insights and knowledge, particularly in exploring the interplay between demographic traits and applicants’ eligibility for residential subsidies (Chen et al. 2012b). Recently, this method has gained significant prominence. However, the sheer volume and intricacy of data involved in big data analysis pose challenges in terms of manual retrieval, management, processing, and timely organization, rendering it less accessible for human comprehension (Chen et al. 2012a; Huang et al. 2014). In real-world application scenarios, similar characteristics can lead to varied outcomes for different applicants. For example, individuals with both physical and mental disabilities who have previously received housing subsidies may experience different results in their new applications. This inherent complexity makes it challenging to distinguish applicants solely based on traditional statistical methods. Therefore, before conducting logistic regression analysis on features, a comprehensive review of household application data becomes essential. This process helps align the results of logistic regression analysis with real-world situations, ensuring an accurate reflection (Su 1994; Su et al. 2011). The proposed predictive model relies on a specific type of fuzzy neural network known as PFHRCNNs. This novel model seamlessly integrates three powerful computational intelligence tools—neural networks, PSO, and fuzzy systems—to provide improved predictive capabilities.
Before exploring the details of PFHRCNNs, this section offers a brief summary of HRCNNs. HRCNNs, a combination of neural networks and rule-based mechanisms, lay their groundwork as illustrated in Fig. 3. To achieve comprehensive training data coverage, HRCNNs utilize the supervised decision-directed learning (SDDL) algorithm. The mathematical representation of a two-layer HRCNNs can be articulated as follows (Tian and Ma 2019):
(1)
(2)
(3)
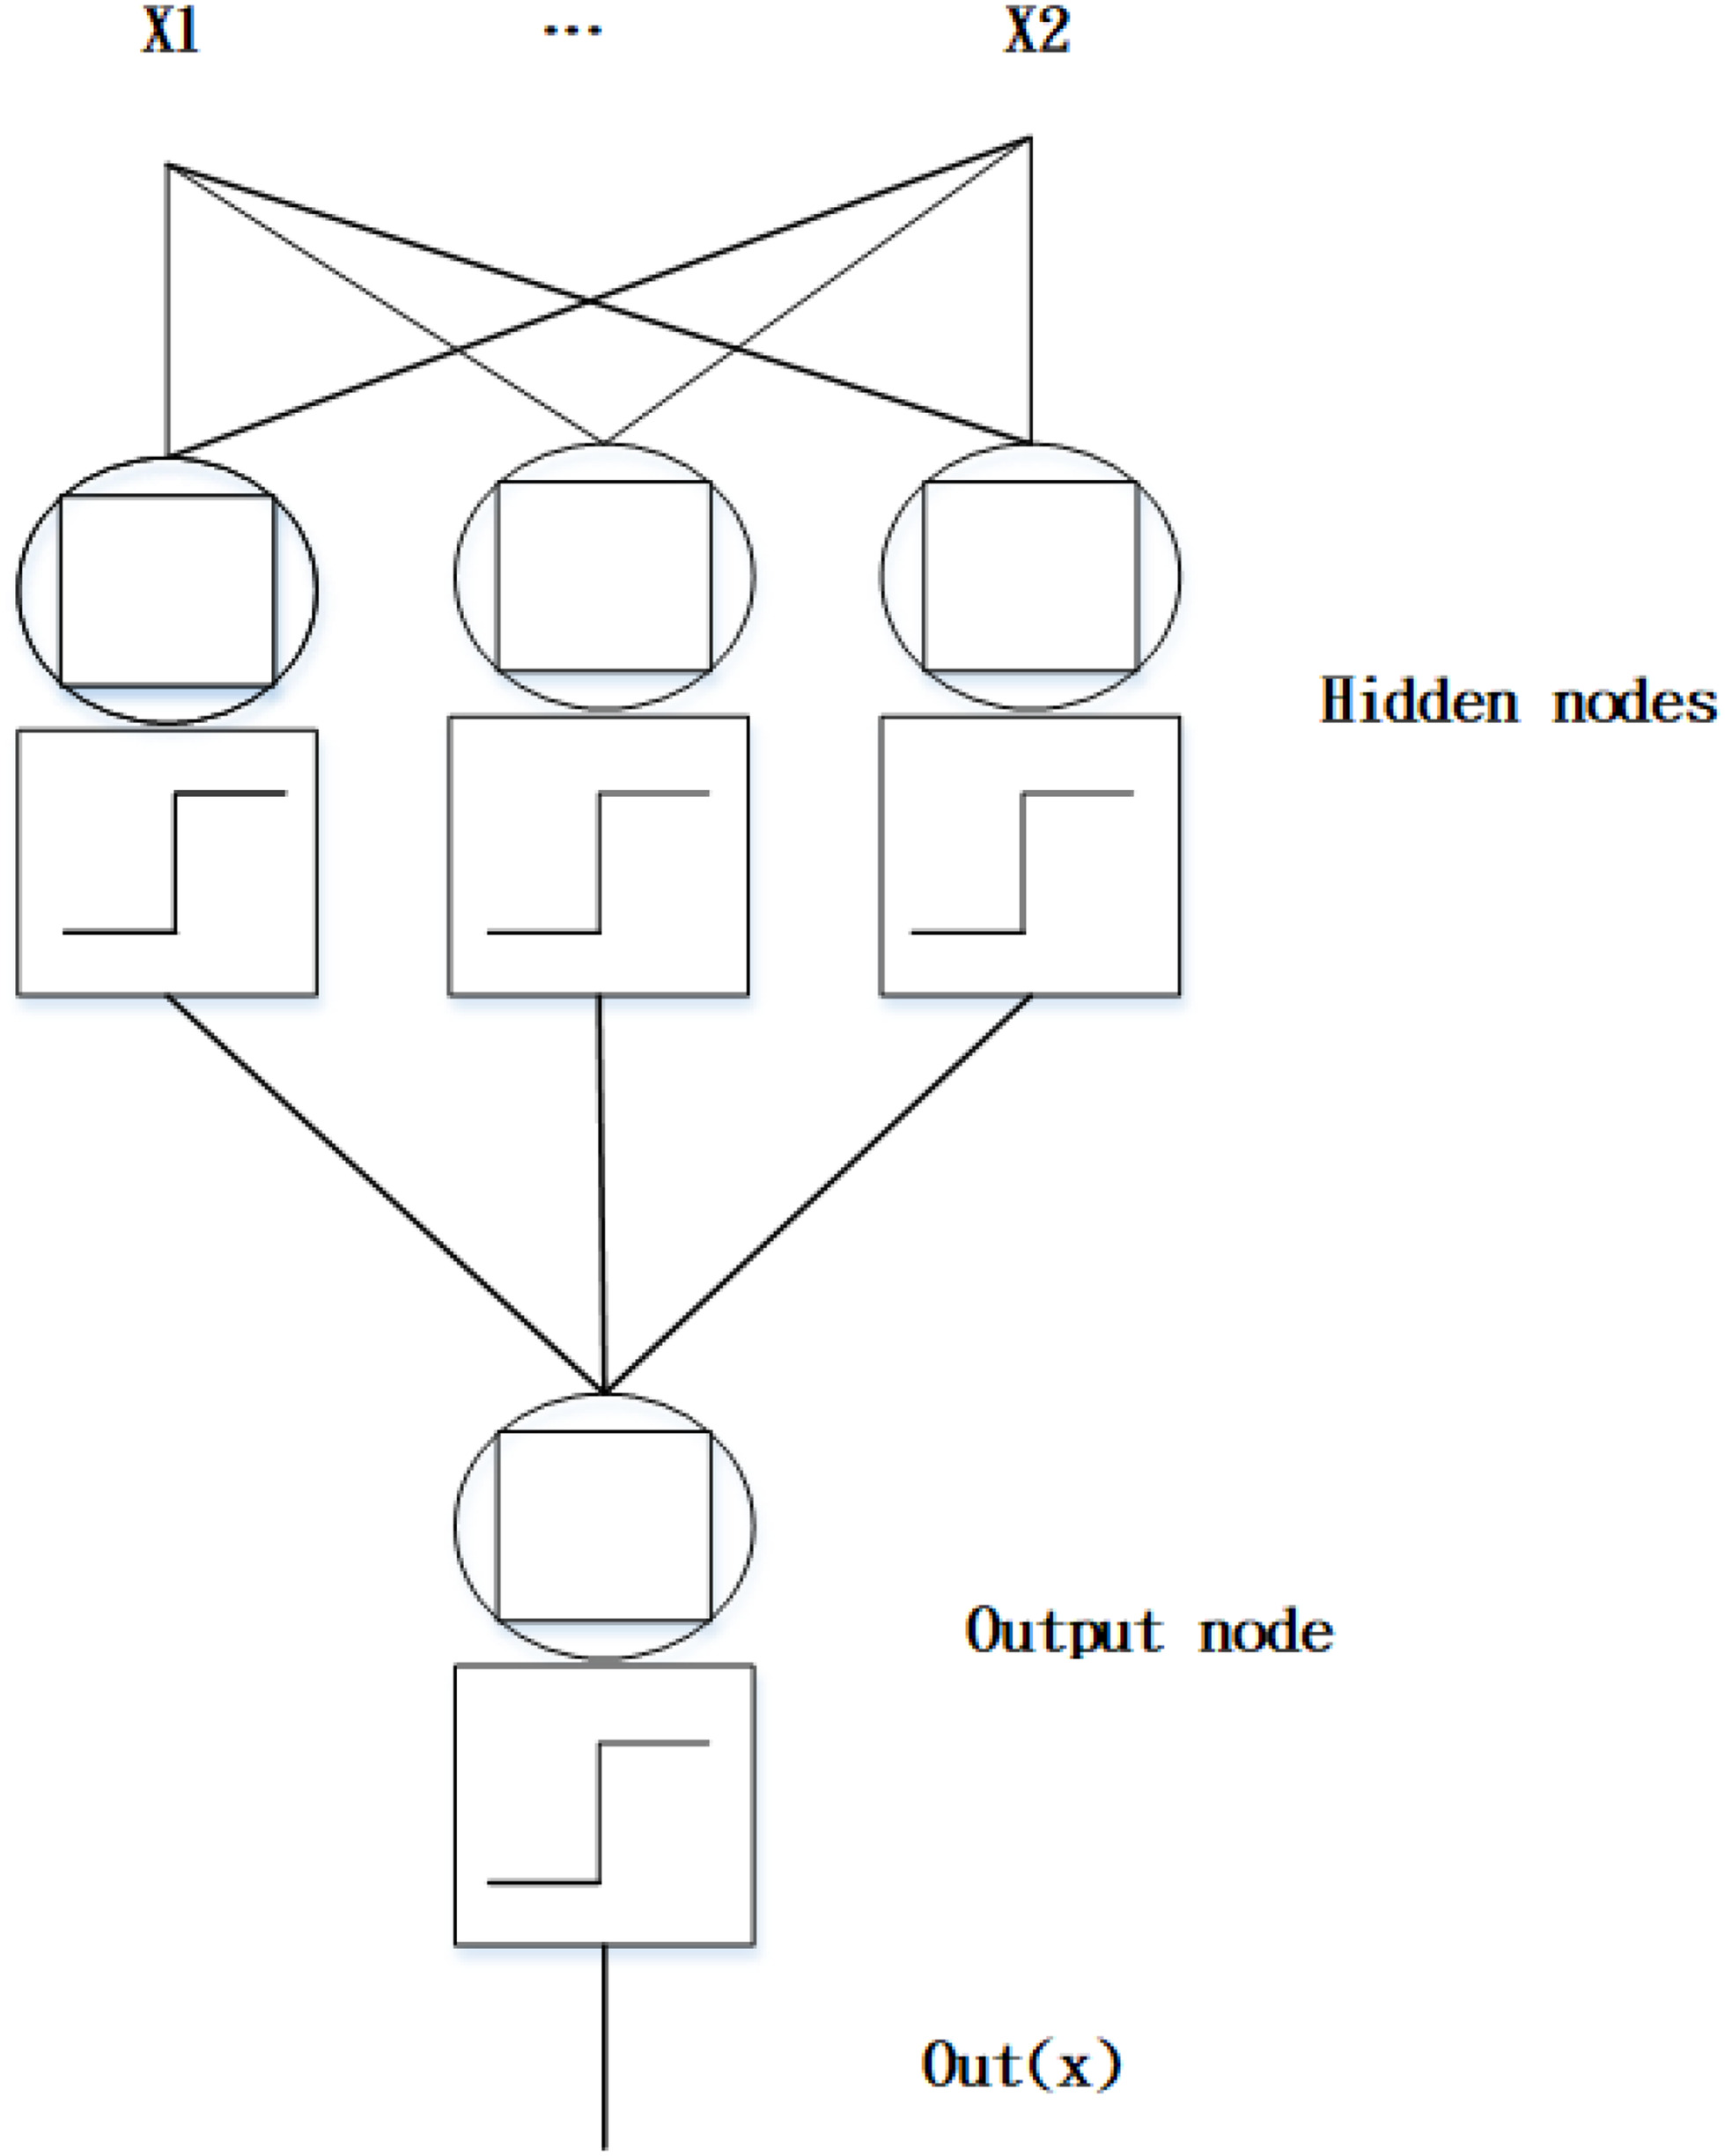
By analyzing Eqs. (1)–(3), it becomes evident that the weight values of the trained HRCNNs can be interpreted as a collection of if–then classification rules. The if–then classification rule derived from the HRCNNs following training, along with the representation of the hidden node J branch, is expressed in Eq. (4):
(4)
These rules can be articulated as follows: If a given data pattern, denoted x = (x1, x2,…, xn)T, resides within at least one of the Jn-dimensional hyper-rectangles delineated by [mj1, Mj1] × [mj2, Mj2] × ⋯ × [mjn, Mjn] for J = 1, …, J, then the network's output is assigned a value of one [i.e., Out(x) = 1]. The concept of employing hyperrectangles to encapsulate rules finds resonance in diverse methodologies such as the nested generalized example algorithm, the fuzzy min–max neural network classifier (FMMC), and approaches presented by Abe and Lan (1995), as well as fuzzy ARTMAP (Salzberg 1990).
SDDL employs a threefold division of data sets: first, the training data set trains the neural network parameters; second, the validation data set assesses the neural network model's outcomes; and finally, the test data set validates the final model. For this context, a supervised neural network was chosen as the identifier. SDDL has demonstrated an ability to achieve 100% accurate recognition posttraining (Salzberg 1990; Simpson 1992; Carpenter et al. 1992; Liu et al. 1999; Chen et al. 2017), but the existence of hyperrectangles that encompass only a few positive instances is possible. Removing these ineffective crisp rules outright could lead to a reduction in overall recognition performance (Hsieh et al. 2014b). Therefore, a compensation approach is necessary, which concurrently prunes these ineffective rules while preserving performance quality. As highlighted in the preceding section, HRCNNs encounter challenges in generating several ineffective crisp rules. Eliminating these ineffectual rules directly would indeed compromise the overall recognition performance. To mitigate the repercussions of rule deletion, a degree of fuzzy theory was introduced into the classification process, and PSO was employed to optimize rule coordination, thereby enhancing the overall recognition performance. These enhancements have driven the development of the PFHRNNs.
The training algorithm for the PFHRCNNs involves the following steps:
Step 1: Establishing crisp rules
For each trained HRCNN, a set of crisp rules will be generated. Suppose the number of crisp rules corresponding to each class is Hk, k = 1, …, k. These Hk if–then rules are represented as Hk n-dimensional crisp hyper-rectangles defined by n intervals,
Step 2: Optimization of fuzzy rules
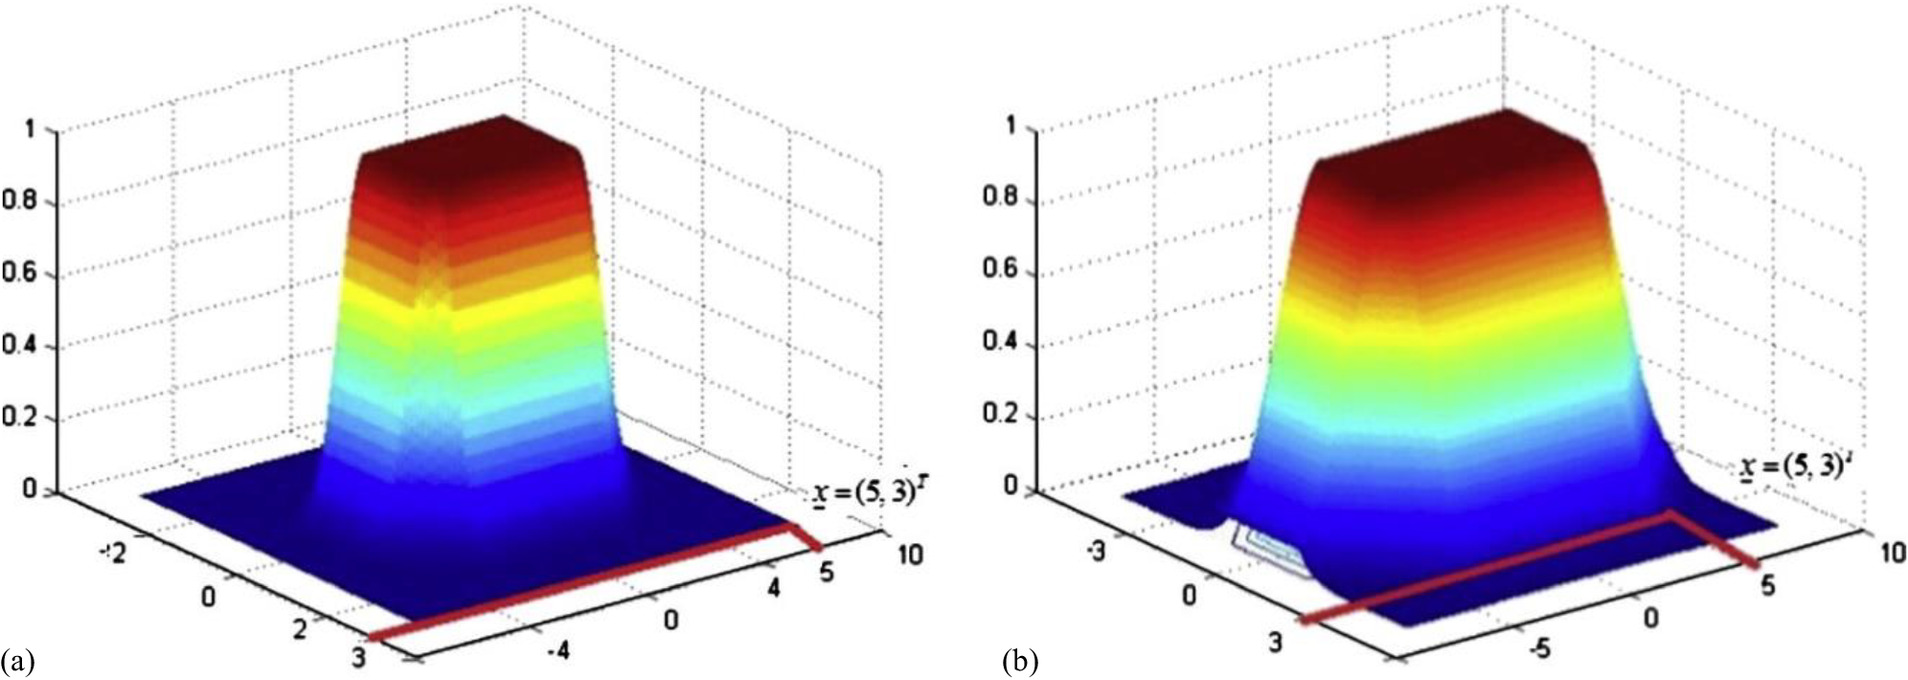
Integrating the fuzzy and PSO concepts, we can use the following membership function to measure the degree to which a data pattern, x, belongs to a fuzzy hyper-rectangle defined by for class k:where = sensitivity parameter that regulates how fast the membership value decreases as the distance between x and the hyper-rectangle defined by . Basically, the membership value becomes 1.0 if the corresponding data lie in the hyper-rectangle defined by . In addition, its membership degree will decrease as the distance between the data pattern and the hyperrectangle (Su 2000). An example of for a two-dimensional rectangle is shown in Fig. 4.
(5)
(6)
(7)
Step 3: Classification
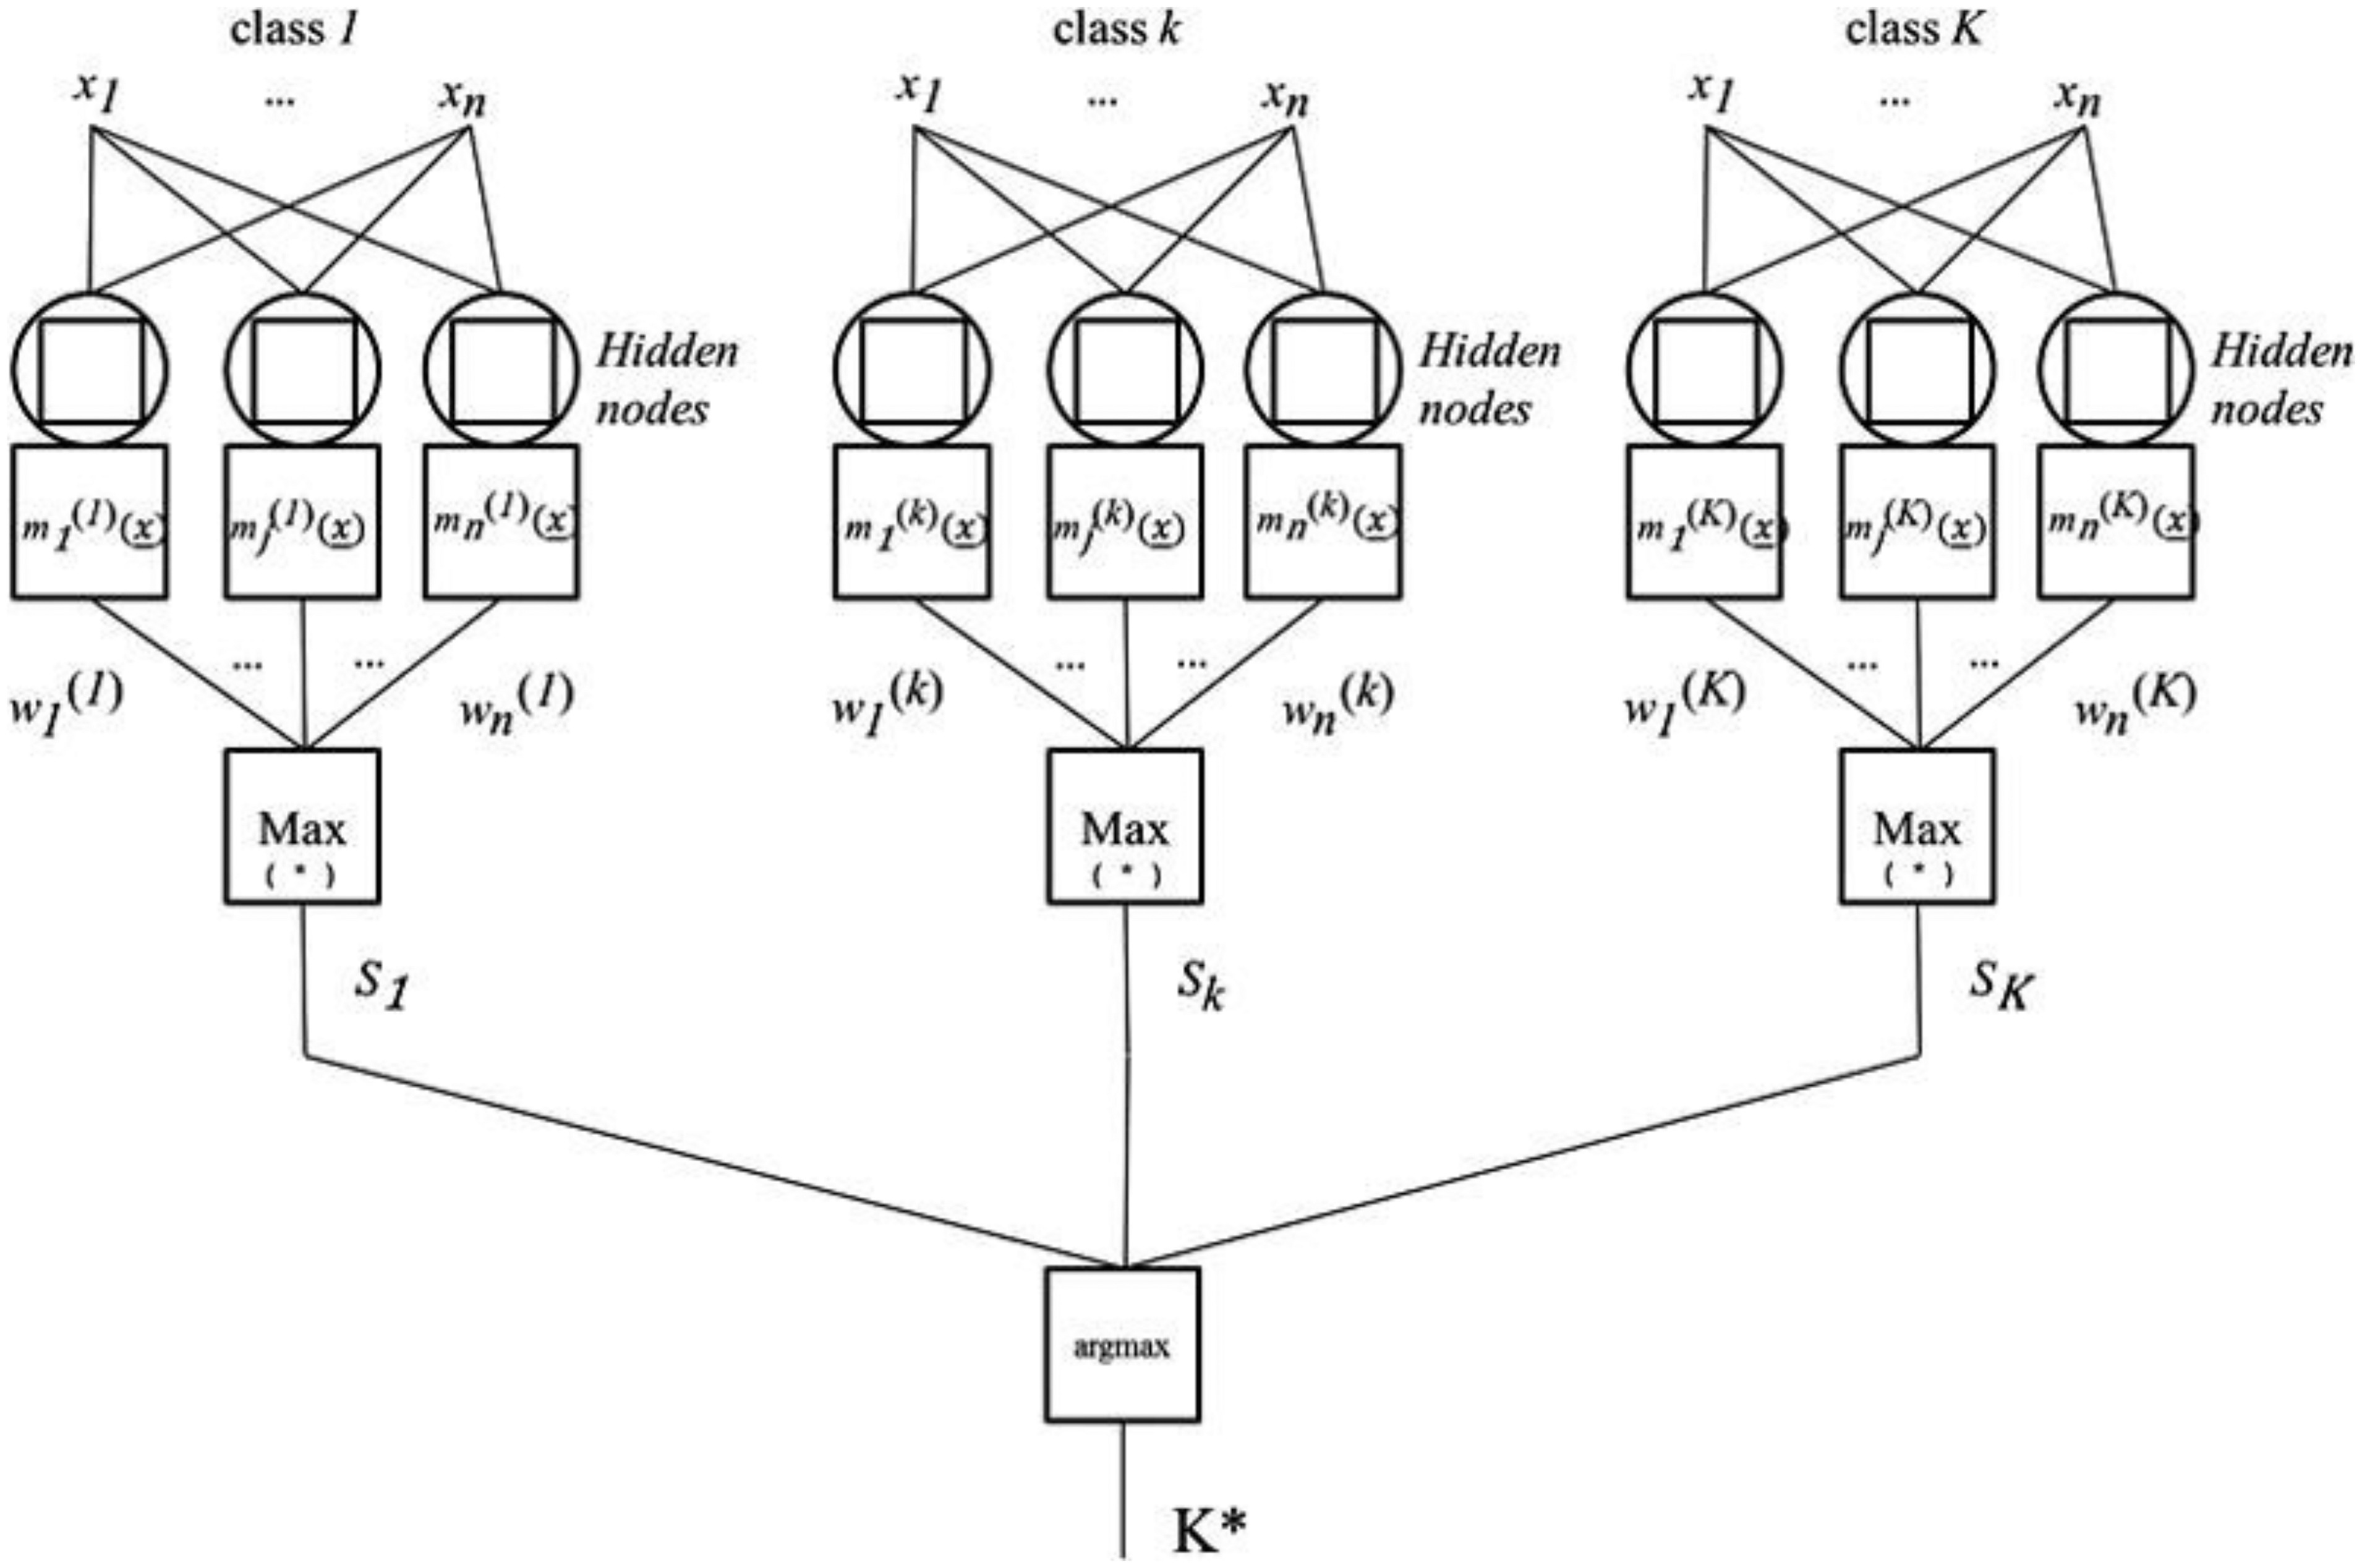
After Step 2, an PFHRCNN can be established. Fig. 5 shows the architecture of the PFHRCNNs. If a rule with the value of the product of and is less than a prespecified threshold θe, then this rule is claimed to be ineffective and must be deleted from the rule list. That is, this rule cannot be counted in the computation of Eq. (8). The final output of trained PFHRCNNs is computed via Eqs. (8) and (9). The best particle is the particle with the largest recognition rate:where Sk = degree with which the data pattern, x, belongs to the class. The firing strength of the jth rule for class k is the product of the membership degree, , and the confidence factor, .
(8)
(9)
Results, Evaluation, and Discussion
The performance of PFHRCNNs in terms of recognition rates was evaluated based on the analysis of 10 key features outlined in Table 3. The initial preset tolerances include three criteria: (1) Ensuring that the sampled data achieves a minimum accuracy of 90%; (2) allowing for a 5% margin of error due to external factors, in accordance with criterion (1); and (3) requiring all data to meet a 95% confidence level.
| Trial | Number of rules | Training accuracy (500/36,086) (%) | Testing accuracy (35,586/36,086) (%) | Average (%) |
|---|---|---|---|---|
| 1 | 66 | 100 | 98.6 | 99.30 |
| 2 | 50 | 100 | 96.9 | 98.45 |
| 3 | 51 | 100 | 92.2 | 96.10 |
| 4 | 46 | 100 | 97.4 | 98.70 |
| 5 | 49 | 100 | 97.6 | 98.80 |
| 6 | 47 | 100 | 93.7 | 96.85 |
| 7 | 49 | 100 | 91.8 | 95.90 |
| 8 | 55 | 100 | 90.4 | 95.20 |
| 9 | 47 | 100 | 88.5 | 94.25 |
| 10 | 57 | 100 | 89 | 94.50 |
Following the three specified tolerances mentioned previously, 500 samples were randomly chosen from a data set containing 36,086 entries, which accounts for roughly 1.4% of the entire data set. These samples were utilized for training purposes using SSDL until achieving 100% accuracy. The remaining data were kept aside for accuracy assessment. Nine sets of training data and one set of testing data were established (10-fold cross validation), each defining distinct rule sets. This methodology aimed to identify which rule configurations provided the most accurate application predictions. The results obtained from the testing samples revealed the highest accuracy rate of 98.6%, which corresponds to the highest accuracy rate observed among all trials presented in Table 3. Notably, the average accuracy percentage ranged from approximately 94.25%–99.3%, highlighting the robust performance of this identifier. In particular, the highest test accuracy rate of 98.6% was linked with 66 rules, suggesting a positive correlation between the number of rules and the accuracy of test samples.
The PFHRCNN model identification aptly captures the authentic attributes of applicants. Furthermore, it effectively discerns the pivotal rules that determine the qualification status of a rental subsidy application, thereby furnishing valuable guidance for individuals. The salient findings are encapsulated within the rules elucidated in Table 4, which encompass four crucial rules spanning an extensive spectrum of household classifications. For instance, the numerical range of [0, 20] encompasses 21 distinct counties in Taiwan, with the exception of Lianjiang County (an offshore island depicted in Fig. 1), which was not included in this research. Likewise, the value range [0, 353] corresponds to 354 diverse regional townships. Demographic attributes, such as mental and physical disorders, age exceeding 65, Taiwanese aborigine status, single-parent families, major disasters, major injuries, family violence, previous receipt of residential subsidies, and gender-related criteria, are represented with [1, 1] to denote significant factors influencing subsidy eligibility. Conversely, [0, 1] signifies minimal impact on the subsidy outcome. The range [0, 195,000] for monthly rent indicates that rent amounts span from 0 to 195,000 NTD (0–6,500 USD). Interpreting the extracted prediction rules yields several noteworthy insights: Rule 1 underscores that applicants from single-parent families who have previously received residential subsidies are more likely to be approved. Rule 2 states that individuals residing outside Chiayi, Pingtung, Hualien, Penghu, and Kinmen Counties qualify for the subsidy if their monthly rent ranges from 8,000 to 13,000 NTD (266–433 USD). These counties, as illustrated in Fig. 1, are primarily located in the southern region or offshore islands. Consequently, residents in the northern areas have a greater likelihood of securing the subsidy within this range. Rule 3 suggests that residents in the southern region of Hsinchu, as well as the islands of Kinmen and Penghu Counties, could pass the audit if they have successfully applied for subsidies before. Rule 4 highlights that individuals aged over 65 paying less than 11,999 NTD (400 USD) in monthly rent are deemed to pass the audit.
| Rule classification and characteristics | Rule 1 | Rule 2 | Rule 3 | Rule 4 |
|---|---|---|---|---|
| County/city | [0, 20] | [0, 14] | [0, 20] | [0, 17] |
| Regional township | [0, 353] | [3, 266] | [177, 353] | [4, 331] |
| Mental and physical disorders | [0, 1] | [0, 1] | [0, 1] | [0, 1] |
| Over 65 years old | [0, 1] | [0, 1] | [0, 1] | [1, 1] |
| Taiwanese aborigine | [0, 1] | [0, 1] | [0, 1] | [0, 1] |
| Single-parent family | [1, 1] | [0, 1] | [0, 1] | [0, 1] |
| Major disasters | [0, 1] | [0, 1] | [0, 1] | [0, 1] |
| Major injuries | [0, 1] | [0, 1] | [0, 1] | [0, 1] |
| Family violence | [0, 1] | [0, 1] | [0, 1] | [0, 1] |
| Has received residential subsidies | [1, 1] | [0, 1] | [1, 1] | [0, 1] |
| Monthly rent | [0, 195,000] | [8,000, 13,000] | [0, 195,000] | [0, 11,999] |
| Gender (male) | [0, 1] | [0, 1] | [0, 1] | [0, 1] |
Conclusion
The objective of this study is to create a proficient and accurate tool for promptly assessing and filtering out ineligible applications, alongside establishing uniform review standards for cities and townships throughout Taiwan. Among the 36,086 data sets, the PFHRCNN model yielded its highest classification accuracy at approximately 98.6% with 66 rules. The four major and crucial rules span an extensive spectrum of household classifications. The evaluation of the model commenced by randomly selecting 500 samples from a data set comprising 36,086 entries, representing roughly 1.4% of the complete data set. Through a 10-fold cross-validation process, the average accuracy percentage ranged from about 94.25% to 99.3%, demonstrating the robust performance of this identifier.
This work makes significant contributions in two key areas: (1) the suitability of PFHRCNNS as a predictive tool for residential rental subsidies, not only domestically but also internationally, and (2) the establishment of 66 rules, with particular emphasis on the four major rules. By scrutinizing detailed data features and rules, these contributions can be implemented in other countries with social and economic development similar to Taiwan. These rules outline specific criteria for passing the audit, including single-parent families, monthly rent range, specific regions, and individuals aged 65 years and older. The rapid auditing tool benefits both government agencies and applicants. By inputting basic information, applicants can assess the likelihood of successful auditing outcomes, enabling them to decide on pursuing further document preparation. Concurrently, government bodies can employ the tool for initial screening, suggesting direct rejection for applications with persistently low success rates, thus enhancing efficiency and impartiality. Subsequent studies will focus on refining the algorithm and developing a user-friendly interface. It is also recommended to incorporate different features as inputs in various countries or regions to tailor the findings to address more specific issues.
Data Availability Statement
All data, models, and codes generated or used during the study appear in the published article.
Acknowledgments
The authors extend their gratitude for the partial support provided for this research by the Taiwan Ministry of Science and Technology (MOST)/National Science and Technology Council (NSTC) under grant numbers MOST-108-2221-E-008-002-MY3, MOST-109-2622-E-008-018-CC2, MOST-110-2622-E-008-018-CC2, MOST-110-2221-E-008-052-MY3, NSTC-111-2622-E-008-017, and NSTC-111-2221-E-008-027-MY3. It is important to note that any opinions, findings, conclusions, and recommendations presented in this paper solely belong to the authors and do not necessarily reflect the perspectives of the MOST/NSTC.
References
Abe, S., and M. S. Lan. 1995. “A method for fuzzy rules extraction directly from numerical data and its application to pattern classification.” IEEE Trans. Neural Networks 3 (1): 18–28.
Alva, M. L., N. L. Mammo, R. Moore, and S. Quinney. 2022. “Do shallow rental subsidies promote housing stability? Evidence on costs and effects from DC's flexible program.” Urban Aff. Rev. 59 (5): 1530–1566. https://doi.org/10.1177/10780874221111140.
Blunden, H., and K. Flanagan. 2020. “Housing options for women leaving domestic violence: The limitations of rental subsidy models.” Hous. Stud. 37 (10): 1896–1915. https://doi.org/10.1080/02673037.2020.1867711.
Braakmann, N., and S. McDonald. 2020. “Housing subsidies and property prices: Evidence from England.” Reg. Sci. Urban Econ. 80: 103374. https://doi.org/10.1016/j.regsciurbeco.2018.06.002.
Carpenter, G., S. Grossberg, N. Markuzon, J. Reynolds, and D. Rosen. 1992. “Fuzzy ARTMAP: A neural network architecture for incremental supervised learning of analog multidimensional maps.” IEEE Trans. Neural Networks 3 (5): 698–713. https://doi.org/10.1109/72.159059.
Chen, J., Q. Hao, and M. Stephens. 2010. “Assessing housing affordability in postreform China: A case study of Shanghai.” Hous. Stud. 25 (6): 877–901. https://doi.org/10.1080/02673037.2010.511153.
Chen, J.-H. 2012a. “Developing SFNN model to predict financial distress for construction companies.” Expert Syst. Appl. 39 (1): 823–827. https://doi.org/10.1016/j.eswa.2011.07.080.
Chen, J.-H. 2012b. “A hybrid knowledge-sharing model for corporate foreign investment in China's construction market.” Expert Syst. Appl. 39 (9): 7585–7590. https://doi.org/10.1016/j.eswa.2011.11.076.
Chen, J.-H., S.-C. Hsu, Y.-H. Lo, and M. Skibniewski. 2012a. “Knowledge management for risk hedging by construction material suppliers.” J. Manage. Eng. 28 (3): 273–280. https://doi.org/10.1061/(ASCE)ME.1943-5479.0000111.
Chen, J.-H., M.-C. Su, and B. A. Badjie. 2016. “Exploring and weighting features for financially distressed construction companies using swarm inspired projection algorithm.” Adv. Eng. Inf. 30 (3): 376–389. https://doi.org/10.1016/j.aei.2016.05.003.
Chen, J.-H., M.-C. Su, R. Cao, S.-C. Hsu, and J.-C. Lu. 2017. “A self organizing map optimization based image recognition and processing model for bridge crack inspection.” Autom. Constr. 73: 58–66. https://doi.org/10.1016/j.autcon.2016.08.033.
Chen, J.-H., M.-C. Su, C.-Y. Chen, F.-H. Hsu, and C.-C. Wu. 2011. “Application of neural networks in detecting erroneous tax reports for construction companies.” Autom. Constr. 20 (7): 935–939. https://doi.org/10.1016/j.autcon.2011.03.011.
Chen, J.-H., M.-C. Su, C.-Y. Chen, and S.-C. Lin. 2014. “Developing a damage assessment model for bridge surroundings: A study of the disaster caused by Typhoon Morakot in Taiwan.” Civ. Eng. Environ. Syst. 31 (1): 24–35. https://doi.org/10.1080/10286608.2013.820278.
Chen, X., Y. Ye, X. Xu, and J. Z. Huang. 2012b. “A feature group weighting method for subspace clustering of high-dimensional data.” Pattern Recognit. 45 (1): 434–446. https://doi.org/10.1016/j.patcog.2011.06.004.
Colburn, G. 2019. “The use of markets in housing policy: A comparative analysis of housing subsidy programs.” Hous. Stud. 36 (1): 46–79. https://doi.org/10.1080/02673037.2019.1686129.
da Silva, J. C., C. Giannella, R. Bhargava, H. Kargupta, and M. Klusch. 2005. “Distributed data mining and agents.” Eng. Appl. Artif. Intell. 18 (7): 791–807. https://doi.org/10.1016/j.engappai.2005.06.004.
Dickson-Gomez, J., T. McAuliffe, C. Obidoa, K. Quinn, and M. Weeks. 2016. “The relationship between housing subsidies and supportive housing on neighborhood distress and housing satisfaction: Does drug use make a difference?” Subst. Abuse Treat. Prev. Policy 11 (1): 1. https://doi.org/10.1186/s13011-016-0064-3.
Fan, Y., Z. Yang, and A. Yavas. 2019. “Understanding real estate price dynamics: The case of housing prices in five major cities of China.” J. Hous. Econ. 43: 37–55. https://doi.org/10.1016/j.jhe.2018.09.003.
Feng, F., J. Cho, W. Pedrycz, H. Fujita, and T. Herawan. 2016. “Soft set based association rule mining.” Knowledge-Based Syst. 111: 268–282. https://doi.org/10.1016/j.knosys.2016.08.020.
Fung, Y. W., and W. L. Lee. 2014. “Development of price models for architectural and environmental quality for residential developments in Hong Kong.” Habitat Int. 44: 186–193. https://doi.org/10.1016/j.habitatint.2014.06.004.
Geng, B., H. Bao, and Y. Liang. 2015. “A study of the effect of a high-speed rail station on spatial variations in housing price based on the hedonic model.” Habitat Int. 49: 333–339. https://doi.org/10.1016/j.habitatint.2015.06.005.
Gerek, I. H. 2014. “House selling price assessment using two different adaptive neuro-fuzzy techniques.” Autom. Constr. 41: 33–39. https://doi.org/10.1016/j.autcon.2014.02.002.
Gitis, V., and A. Derendyaev. 2019. “From monitoring of seismic fields to the automatic forecasting of earthquakes.” Int. J. Web Inf. 15 (5): 535–549.
Harting, P., and D. Radi. 2020. “Residential segregation: The role of inequality and housing subsidies.” J. Econ. Behav. Organ. 179: 801–819. https://doi.org/10.1016/j.jebo.2020.08.011.
Heylen, K. 2020. “Targeted affordable housing subsidies in Flanders: Evaluating equity using equivalence scales.” Int. J. Hous. Policy 20 (4): 513–533. https://doi.org/10.1080/19491247.2019.1608114.
Hsieh, Y.-Z., M.-C. Su, C.-H. Wang, and P.-C. Wang. 2014a. “Prediction of survival of ICU patients using computational intelligence.” Comput. Biol. Med. 47: 13–19. https://doi.org/10.1016/j.compbiomed.2013.12.012.
Hsieh, Y.-Z., M.-C. Su, and P.-C. Wang. 2014b. “A PSO-based rule extractor for medical diagnosis.” J. Biomed. Inf. 49: 53–60. https://doi.org/10.1016/j.jbi.2014.05.001.
Huang, X., Y. Ye, H. Guo, Y. Cai, H. Zhang, and Y. Li. 2014. “DSKmeans: A new kmeans-type approach to discriminative subspace clustering.” Knowledge-Based Syst. 70: 293–300. https://doi.org/10.1016/j.knosys.2014.07.009.
Kuşan, H., O. Aytekin, and İ. Özdemir. 2010. “The use of fuzzy logic in predicting house selling price.” Expert Syst. Appl. 37 (3): 1808–1813. https://doi.org/10.1016/j.eswa.2009.07.031.
Li, L., and X. Wu. 2019. “Housing price and intergenerational co-residence in urban China.” J. Hous. Econ. 45: 101596. https://doi.org/10.1016/j.jhe.2018.08.001.
Liu, C.-W., S.-S. Tsay, Y.-J. Wang, and M.-C. Su. 1999. “Neuro-fuzzy approach to real-time transient stability prediction based on synchronized phasor measurements.” Electr. Power Syst. Res. 49 (2): 123–127. https://doi.org/10.1016/S0378-7796(98)00104-7.
Lund, B. 2007. State welfare, Chap3 in understanding the mixed economy of welfare. Bristol, UK: Policy Press.
Ma, W. M., Z. T. Ren, and H. Ke. 2022. “Green housing subsidy strategies considering consumers’ green preference.” Sustainability 14 (5): 2748. https://doi.org/10.3390/su14052748.
Ministry of Interior. 2023. Housing Statistics. Accessed October 1, 2023. https://pip.moi.gov.tw/V3/Z/SCRZ0211.aspx?Mode=PN02.
Nasrollahzadeh, K., and S. Afzali. 2019. “Fuzzy logic model for pullout capacity of near-surface-mounted FRP reinforcement bonded to concrete.” Neural Comput. Appl. 31 (11): 7837–7865. https://doi.org/10.1007/s00521-018-3590-2.
Powell, T. W., M. Wallace, C. Zelaya, M. A. Davey-Rothwell, A. R. Knowlton, and C. A. Latkin. 2018. “Predicting household residency among youth from vulnerable families.” Children Youth Serv. Rev. 93: 226–230. https://doi.org/10.1016/j.childyouth.2018.07.012.
Quiroga, S., et al. 2018. “What influences European private forest owners’ affinity for subsidies?” For. Policy Econ. 99: 136–144. https://doi.org/10.1016/j.forpol.2018.08.008.
Salzberg, S. L. 1990. Learning with nested generalized examples. Himham, MA: Kluwer Academic.
Schwartz, A. F. 2006. Housing policy in the United States: An introduction. New York: Taylor and Francis Group.
Simpson, P. K. 1992. “Fuzzy min–max neural networks—Part 1: Classification.” IEEE Trans. Neural Networks 3 (5): 776–786. https://doi.org/10.1109/72.159066.
Su, M.-C. 1994. “Use of neural networks as medical diagnosis expert systems.” Comput. Biol. Med. 24 (6): 419–429. https://doi.org/10.1016/0010-4825(94)90040-X.
Su, M.-C. 2000. “A fuzzy rule-based approach to spatio-temporal hand gesture recognition.” IEEE Trans. Syst. Man Cybern. Part C Appl. Rev. 30 (2): 276–281.
Su, M.-C., D.-Y. Huang, J.-H. Chen, W.-Z. Lu, L.-C. Tsai, and J.-Z. Lin. 2011. “Mapping multi-spectral remote sensing images using rule extraction approach.” Expert Syst. Appl. 38: 12917–12922. https://doi.org/10.1016/j.eswa.2011.04.086.
Tian, G., and H. Ma. 2019. “Application of multidimensional association mining in shield tunneling optimization.” Geotech. Geol. Eng. 37 (3): 1869–1876. https://doi.org/10.1007/s10706-018-0729-y.
Tsai, I.-C. 2018. “Housing price convergence, transportation infrastructure and dynamic regional population relocation.” Habitat Int. 79: 61–73. https://doi.org/10.1016/j.habitatint.2018.07.004.
Vashishtha, S., and S. Susan. 2019. “Fuzzy rule based unsupervised sentiment analysis from social media posts.” Expert Syst. Appl. 138: 112834. https://doi.org/10.1016/j.eswa.2019.112834.
Wang, R., W. Ji, M. Liu, X. Wang, J. Weng, S. Deng, S. Gao, and C. Yuan. 2018. “Review on mining data from multiple data sources.” Pattern Recognit. Lett. 109 (15): 120–128. https://doi.org/10.1016/j.patrec.2018.01.013.
Wu, J., and J. Zhang. 2019. “New automated BIM object classification method to support BIM interoperability.” J. Comput. Civil Eng. 33 (5): 04019033. https://doi.org/10.1061/(ASCE)CP.1943-5487.0000858.
Zhang, J., S. O. Williams, and H. Wang. 2017. “Intelligent computing system based on pattern recognition and data mining algorithms.” Sustainable Comput. Inf. Syst. 20: 192–202. https://doi.org/10.1016/j.suscom.2017.10.010.
Zhao, J., R. Xue, Z. N. Dong, D. Y. Tang, and W. H. Wei. 2020. “Evaluating the reliability of sources of evidence with a two-perspective approach in classification problems based on evidence theory.” Inf. Sci. 507: 313–338. https://doi.org/10.1016/j.ins.2019.08.033.
Zhou, Q., R. Dilmore, A. Kleit, and J. Y. Wang. 2014. “Evaluating gas production performances in marcellus using data mining technologies.” J. Nat. Gas Sci. Eng. 20: 109–120. https://doi.org/10.1016/j.jngse.2014.06.014.
Information & Authors
Information
Published In

Journal of Urban Planning and Development
Volume 150 • Issue 4 • December 2024
Copyright
This work is made available under the terms of the Creative Commons Attribution 4.0 International license, https://creativecommons.org/licenses/by/4.0/.
History
Received: Oct 26, 2023
Accepted: May 22, 2024
Published online: Aug 5, 2024
Published in print: Dec 1, 2024
Discussion open until: Jan 5, 2025
ASCE Technical Topics:
- Analysis (by type)
- Artificial intelligence (AI)
- Artificial intelligence and machine learning
- Audits
- Business management
- Case studies
- Computer programming
- Computing in civil engineering
- Data analysis
- Engineering fundamentals
- Engineering materials (by type)
- Financial management
- Fuzzy logic
- Housing
- Infrastructure
- Materials engineering
- Methodology (by type)
- Neural networks
- Particles
- Practice and Profession
- Research methods (by type)
- Urban and regional development
Authors
Metrics & Citations
Metrics
Citations
Download citation
If you have the appropriate software installed, you can download article citation data to the citation manager of your choice. Simply select your manager software from the list below and click Download.