A Unified Multievent Windstorm Performance Testbed for Single-Family Residential Buildings
Abstract
Recent advancements in technology and infrastructure have greatly improved the capabilities of the natural hazards community to collect robust samples of building performance following hazard events and make them available to the research community for broad reuse purposes. Yet, there lacks standardized, open access data sets that combine reconnaissance data from multiple individual hazard events into unified, living testbeds that can grow through community participation. The objectives of this study are to (1) synthesize and present a unified, multievent windstorm performance data set (WiSPD) and (2) summarize common damage patterns observed in the WiSPD. The WiSPD currently consists of four hurricanes (occurring between 2017 and 2020) and four tornadoes (occurring between 2011 and 2020), all of which struck the United States. Each event’s building performance assessments were collected with similar methodologies and contain details such as location, physical address, basic building attributes, estimated 3 s gust wind speed, basic wind speeds, and component-level damage percentage with a precision of . In combination, the testbed reveals that roof cover damage dominates in windstorms, regardless of the year of construction or building code enforced. Additionally, tornadoes tend to produce higher damage rates than hurricanes, specifically in fenestration and roof structure damage. Fragility functions for hurricanes exhibit a nonmonotonic relationship between wind speed and damage, potentially evidencing the strong influence of other confounding variables. Ultimately, the unified data set promises to be a rich testbed for further knowledge discovery and model validation by the research community.
Introduction
Post-windstorm reconnaissance studies have been a staple of the natural hazards community. In the United States, studies following Hurricane Camille in 1969 (Thom and Marshall 1971), the 1970 Lubbock, Texas, tornado (e.g., Fujita 1970; Minor et al. 1977; Somes et al. 1971), Hurricane Andrew in 1992 (Keith and Rose 1994; Wakimoto and Black 1994), Hurricane Katrina in 2005 (van de Lindt et al. 2007; Pistrika and Jonkman 2010), Hurricane Hugo in 1989 (Guimaraes et al. 1993; Saffir 1991), Superstorm Sandy in 2012 (Tomiczek et al. 2017; Xian et al. 2015), the 2007 Greensburg, Kansas, tornado (Paul and Che 2011), the 2011 Joplin, Missouri, tornado (Coulbourne and Miller 2012; Kuligowski et al. 2014; Prevatt et al. 2012a), the 2013 Moore, Oklahoma, tornado (e.g., Atkins et al. 2014; Coulbourne et al. 2015; Ramseyer et al. 2016), and many more have spurred fundamental advancements in science, policy, and practice. However, these studies have traditionally been siloed by individual events, and only rarely has (1) the field data documenting building performance been made publicly available, (2) the building performance data been collected using standardized methodologies from event to event, and (3) has any interevent analysis been conducted, albeit with a few exceptions [e.g., Czajkowski and Done (2014) for Hurricanes Ivan (2004) and Dennis (2005), Friedland (2009) for Hurricanes Katrina (2005) and Ike (2008)]. These siloes exist for several reasons. With the amount of effort involved in conducting field reconnaissance studies, researchers can be hesitant to widely share that data until they have finalized their own analyses and published in academic journals. The raw field data are also often unwieldy, existing in paper forms, notes, and large, unstructured photographic data sets without geospatial context. Federal reconnaissance teams, such as the FEMA mitigation assessment teams, are typically unable to widely share the raw field data due to legal statutes. Finally, reconnaissance teams are typically formed ad hoc for each event response, inhibiting the standardization of methodology and data products across hazard events, thus making it challenging to collaborate across events for common analyses.
The rise of the digital era, and accompanying technological advancements, began to break down those barriers by shifting the reconnaissance paradigm toward data-collection methods that promoted greater access and availability and reduced the burden of collaboration. For example, Gurley and Masters (2011) developed their sampling strategy using a GIS platform and conducted 195 assessments following Hurricane Charlie (2004) using a handheld data recorder to maintain consistency between assessments. Prevatt et al. (2011, 2012a) used geotagged photographs and demonstrated the benefits of synthesizing photographs, performance measures [in this case the degree of damage from the enhanced Fujita scale (McDonald et al. 2012)], and geographic locations for individual buildings to enable spatial interpolation and other analysis via an interactive, publicly available GIS platform. Massarra et al. (2019) piloted virtual assessments using rapid imaging data collected in the immediate aftermath of Hurricane Katrina. Roueche et al. (2018b) and Kijewski-Correa et al. (2018b) deployed a comprehensive building performance survey form via the Fulcrum smartphone application and associated data-collection platform (Spatial Networks Version 2.26) following Hurricane Harvey (2017). With this approach, all collected data were housed in the cloud, accessible by team members and collaborators in real-time as data were collected, and could quickly be shared with other stakeholders as the need arose. This approach was used again in 2017 for Hurricane Irma (Pinelli et al. 2018) and Hurricane Maria (Prevatt et al. 2018). More importantly, these data sets were all published for public use (Kijewski-Correa et al. 2018a, b; Roueche et al. 2018a) through NHERI DesignSafe, a cyberinfrastructure platform and long-term data repository funded by the National Science Foundation (Pinelli et al. 2020).
In 2018, the structural extreme events reconnaissance (StEER) network was formed (Kijewski-Correa et al. 2021), representing structural engineering interests within the broader NHERI CONVERGE node (Peek et al. 2020), which coordinates a collection of extreme events reconnaissance networks supported by the National Science Foundation. StEER was established to enhance the capacity, communication, and coordination of the natural hazards engineering (NHE) community and specifically the structural engineering community through community-driven responses to document the built environment’s impacts from wind, seismic, and coastal hazard events. The StEER response to a particular hazard event adapts to the anticipated impacts and potential for knowledge discovery from the collected perishable data. Events with low impacts or knowledge potential activate primarily virtual responses, in which virtual assessment structural teams (VAST) review publicly available sources (e.g., news stories, social media) to assess and contextualize the impacts. For high-impact events, the VAST operates in tandem with field assessment structural teams (FAST), with the VAST documenting the impacts more broadly and prioritizing targets for on-site investigations by the FAST. In the FAST responses, StEER has primarily focused on collecting representative data sets, typically sampling from clusters of similar structure types (e.g., single-family residential, commercial) and code era across the hazard gradient, and sampling at regularly spaced intervals within the clusters (e.g., every other or every third structure). FAST data typically consists of combinations of performance assessments (conducted on individual structures using the Fulcrum smartphone application), aerial imagery captured by unmanned aerial systems (UAS), surface-level panoramas, and terrestrial lidar. After deployments are completed, VASTs and data librarians (undergraduate and graduate engineering students) enhance, standardize, and conduct quality control checks on the individual performance assessments, using a combination of automated and manual methods, to ensure accuracy and consistency of the final published data sets. The methodology used by StEER opens new pathways for more holistic knowledge discovery across multiple events. Yet, even such coordinated efforts face challenges in that performance assessments are stored as distinct projects and with some slight differences in methodology and recorded fields that were inevitable, as StEER developed and later refined its initial protocols and standards. Further, the information contained within each StEER performance assessment, while extensive, is still not exhaustive with respect to the variety of factors that likely contribute to building performance. Thus, there is a need to generate a single, uniform, living data set of building performance, i.e., (1) enhanced with key information (e.g., hazard intensity) missing from the original StEER data sets, (2) integrates prior data sets collected using similar methodology as StEER, (3) easily accessible for reuse and enhancement by the research community, and (4) transparent in the provenance and lineage of the data. Given the large number of windstorm events documented by StEER in recent years, its repository of wind events is particularly primed for such an effort.
The objective of this paper is to (1) introduce an open-access, unified, living windstorm structural performance data set (WiSPD), which currently includes tornadoes and hurricanes (with plans to extend to other storm types in future versions), and (2) summarize common damage patterns observed in the WiSPD from the analysis of Version 1 of this data set, comprised of performance assessments for residential construction from seven windstorm events (comprising eight individual windstorms) in the United States.
Materials and Methods
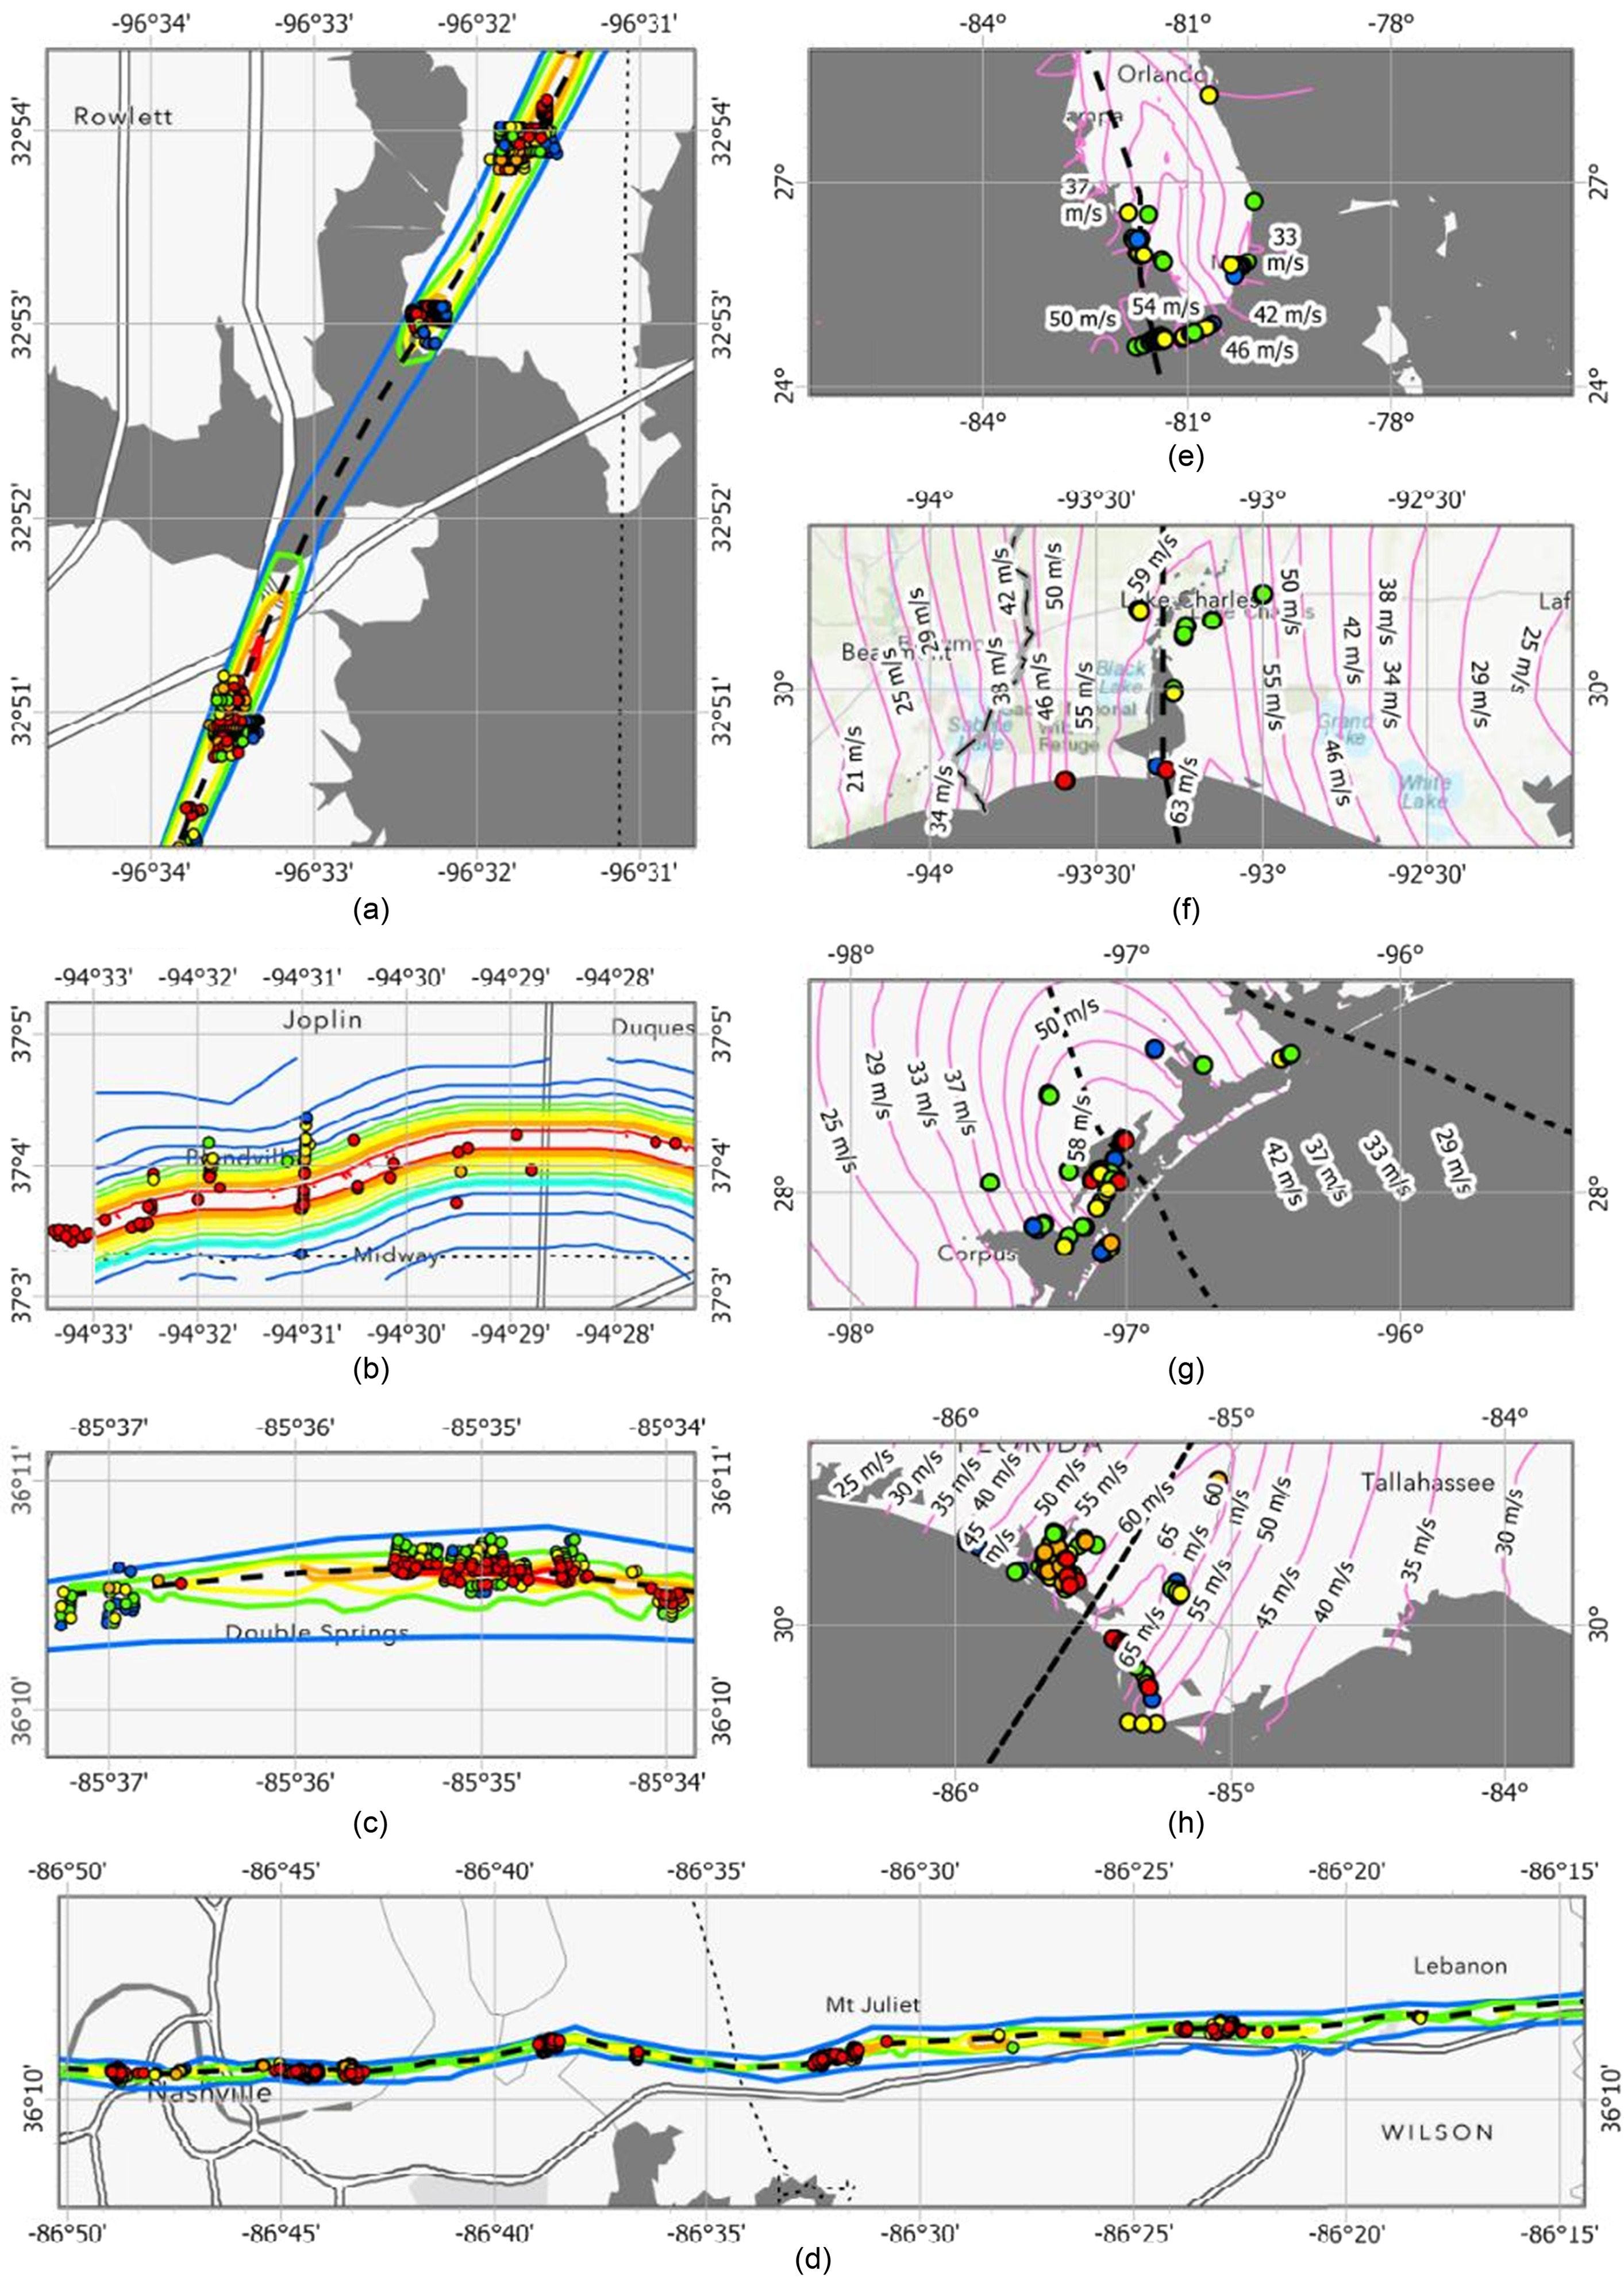
The first iteration of the WiSPD is comprised of data from reconnaissance efforts following eight different windstorms in the United States between 2011 and 2020, as summarized in Table 1 and spatially represented in Fig. 1. Each of these storms were significant tornadoes or hurricanes, with peak intensity of at least EF3 on the enhanced Fujita scale for tornadoes and at least Category 4 on the Saffir–Simpson hurricane scale. Peak wind intensity is also provided in Table 1, representing 1 min sustained winds at 10 m height over marine exposure for hurricanes sourced from National Hurricane Center reports on each storm (Beven et al. 2019; Blake and Zelinsky 2018; Cangialosi et al. 2021; Pasch et al. 2021), and nominally a 3 s gust at 10 m height over open exposure for tornadoes, based on the National Weather Service EF Scale estimates for each storm (NCEI 2022). The reconnaissance missions were not all conducted by the same persons or teams but utilized similar methodologies that made them suitable for merging into a unified database, including cluster-based, transect-based, or other representative sampling techniques, as described more fully in the references to the original datasets provided in Table 1. In general, the data sets generated from each windstorm were primarily derived from door-to-door performance assessments of buildings within representative clusters, conducted either entirely on-site, or utilizing on-site imagery in tandem with supplemental data sources to conduct virtual door-to-door assessments later. After field teams collected the perishable on-site data, it was enriched and standardized into a curated data set. Only single-family residential structures are included in this first iteration of WiSPD, as they are the most frequently affected building stock in general, are most frequently represented in the individual windstorm datasets from which this unified testbed is developed, and tend to fit best within the unified framework presented in this study. Nonresidential structures will be the focus of a future effort.
| Event | Date | Storm rating | Peak wind speed | Primary impact location | Primary data sources | Number of houses | Reference for original dataset | Standardization efforts for current study |
|---|---|---|---|---|---|---|---|---|
| Joplin, MO Tornado | 22-May-11 | EF5 | (200 mph) | Joplin, MO | Geotagged photographs; county appraisals; high-resolution aerial imagery from Surdex Corporation | 79 | Prevatt et al. (2012b) and Bhusar (2017) | Year built, building code, roof cover material, and hazard intensity added |
| Garland-Rowlett, TX Tornado | 26-Dec-15 | EF4 | (175 mph) | Garland and Rowlett, TX | Geotagged photographs; county appraisals | 717 | Jain et al. (2020) | Roof cover reclassified; wall structure damage, wind damage rating, and building code added |
| Hurricane Harvey | 25-Aug-17 | CAT 4 | (145 mph) | Rockport, TX | Geotagged photographs; county appraisals; Texas Windstorm Insurance Association; Pictometry Eagleview; NOAA aerial imagery | 1,133 | Roueche et al. (2018a) | Surge damage rating and building code history added |
| Hurricane Irma | 10-Sep-17 | CAT 4 | (132 mph) | Florida Keys, Marco Island, FL, NE FL | Geotagged photographs; county appraisals; Pictometry Eagleview; NOAA aerial imagery | 836 | Kijewski-Correa et al. (2018c) | Surge damage rating and building code history added |
| Hurricane Michael | 10-Oct-18 | CAT 5 | (160 mph) | Mexico Beach, FL | StEER geotagged photographs, post-storm surface-level panoramas and drone images; county appraisals; Pictometry Eagleview; NOAA aerial imagery; | 623 | Roueche et al. (2020a) | Fenestration damage aggregated into an overall damage ratio; building code added |
| Nashville, TN Tornado | 3-Mar-20 | EF3 | (165 mph) | Nashville, TN | StEER geotagged photographs, surface-level panoramas, and drone images; county appraisals; NOAA aerial imagery | 661 | Wood et al. (2020) | Fenestration damage aggregated into an overall component-level damage ratio; building code added |
| Cookeville, TN Tornado | 3-Mar-20 | EF4 | (175 mph) | Cookeville, TN | StEER geotagged photographs, surface-level panoramas, and drone images; county appraisals; NOAA aerial imagery | 151 | Wood et al. (2020) | Fenestration damage aggregated into an overall component-level damage ratio; building code added |
| Hurricane Laura | 29-Aug-20 | CAT 4 | (150 mph) | Lake Charles, LA | StEER geotagged photographs, surface-level panoramas, and drone images; county appraisals; NOAA aerial imagery | 424 | Roueche et al. (2021a) | Building code added |
Data Collection
Detailed descriptions of the precise data-collection methods are available in the published reports for each individual event (see Table 1), and the methodology is also now standardized in protocols of the StEER network (Kijewski-Correa et al. 2021; Roueche et al. 2019, 2020a). A summary of the methodology is provided here.
Perishable data were collected by reconnaissance teams following landfall of a hurricane or occurrence of a strong tornado. Deployments occurred as soon as the day of impact for some events [e.g., Hurricane Laura (2020)]; for others, reconnaissance teams deployed in stages, with the first deployment occurring a few days after the event, with subsequent deployments as late as several months after the event [e.g., Hurricane Harvey (2017)]. Sampling strategies promoted the collection of representative samples. For hurricanes, this was achieved by sampling within clusters of buildings across the hazard gradient. Clusters were primarily selected to stratify across hazard intensities and year of construction. For tornadoes, representative samples were achieved by sampling along transects through the tornado path at multiple points along the path. Transects were typically chosen to align with streets or neighborhoods (again with year of construction a common secondary stratification level) within which semiregular sampling intervals were used (e.g., every home or every third home).
The data collected during the field deployments included one or more of the following: (1) geotagged photographs capturing multiple elevations of affected homes and details of the load path where possible; (2) survey forms with standardized fields for basic building attributes, structural details, damage quantification, and assessment metadata; (3) surface-level panoramic images captured from a camera mounted onto a vehicle; (4) oblique, nadir, and panoramic imagery captured using UAS. For all events except the Joplin tornado (2011) and the Garland/Rowlett tornado (2015), the geotagged photographs and survey forms were collected using Fulcrum (Spatial Networks Version 2.26), a data-collection platform that uses a smartphone app to create digital records linking geotagged photographs, audio, and customizable survey forms within a geodatabase.
Following deployments, undergraduate and graduate engineering students parsed the field data and integrated supplemental data sources to define or verify essential building attributes, define or verify visible construction materials and systems, and precisely quantify damage to each structure, primarily using the data sources identified in Table 1. Standard building attributes include the number of stories, first-floor elevation, year of construction, the building code enforced for the year of construction, and roof shape. To determine the building code enforced at the time of construction, the Federal Alliance for Safe Homes (FLASH) tool Inspect to Protect (No Code n.d.) website was used. This tool provided the building code history for many municipalities in the WiSPD that established a building code history that could be cross-referenced with the year built to assign the code enforced at the time of construction to each assessment. If no year built was found or the code history did not include data that predated the year built, the building code enforced at the time of construction was listed as “unknown.” The construction materials include the roof cover material, wall cladding material, and the type of garage door if present. Other attributes and structural information, such as the roof slope, structural roof system, fenestration protection, and structural connection details were collected when visible but in many cases were not accessible. For this initial version of the WiSPD, the decision was made to focus on attributes captured for all homes, knowing the attribute list could be expanded with future updates.
Damage was quantified by a global wind and surge damage ratings and individual component-level damage percentage (CLDP). The criteria for wind damage ratings are derived from Vickery et al. (2006), which focuses on economic loss as the underlying performance metric for five discrete damage states. Surge damage ratings were defined using criteria from Friedland (2009), which also focuses on economic loss as the underlying performance metric. The full criteria for both hazard ratings are provided in Tables 3 and 4. The CLDP is defined as the percentage of the building component that remains attached to the structure, without visible damage, for all visible elevations of the building. The structural and nonstructural components for which precise damage estimates are included in the database and used for this analysis consist of the following: roof structure; roof substrate (i.e., sheathing or decking); roof cover; wall structure; wall substrate (i.e., sheathing or decking); wall cladding; large door openings; and fenestration (windows and entry doors). In defining the CLDP, all missing elements of the building component (not including those on the ground floor of elevated buildings) were assumed to be damaged. This assumption is reasonable in most cases but can overestimate damage to component and cladding elements when supporting structural elements’ fail prior to the component and cladding elements failing. For example, if the roof structure completely lifted off the walls during a storm, the CLDP for roof cover, roof decking, and roof structure would all be 100%, even though it is unlikely that the roof decking and roof cover would have been 100% damaged independent of the roof structure failure.
Hazard Intensity
Hazard intensities, specifically peak gust wind speeds, were estimated in three ways. For hurricanes [Figs. 1(e–h)], all wind speeds are taken from the wind fields developed by Applied Research Associates (Vickery et al. 2009). These wind fields are generated using a parametric hurricane wind field model conditioned to surface observations. The resulting wind fields provide the spatial distribution of peak 3 s gust wind speeds normalized to represent open terrain conditions at 10 m height above ground level. The uncertainty in these wind fields has not yet been rigorously quantified but is likely highest near the eyewall, where the sparseness of reliable surface measurements and the sharpness of the hazard gradient provides fewer conditioning points. For example, the wind field for Hurricane Michael (2018) Fig. 1(h) was conditioned by Vickery et al. (2018) using 85 surface measurements located throughout the affected region. Of these, only three of the surface measurements were located near or within the eyewall at landfall, and one of these failed prior to the arrival of the hurricane’s strongest winds (Beven et al. 2019). Further, the parametric wind field models do not capture wind field perturbations due to local convective storms or other phenomena (Wurman and Kosiba 2018). Nonetheless, at present, the ARA wind fields represent the best publicly available estimates of the peak wind speeds during recent hurricanes. The estimates can always be improved in the future as the need and opportunity arise.
For the 2011 Joplin, Missouri, tornado [Fig. 1(b)], wind speeds were estimated using a parametric tornado wind field model conditioned to tree-fall patterns and overall building damage patterns, as described in Lombardo et al. (2015) and Roueche et al. (2017). For the 2015 Garland/Rowlett, Texas, tornado [Fig. 1(a)] and the 2020 Middle Tennessee tornadoes [Figs. 1(c and d)], the wind speeds were linearly interpolated from contours of EF ratings developed by the National Weather Service and publicly available through the Damage Assessment Toolkit (Molthan et al. 2020). The EF scale contours relate back to the enhanced Fujita scale, which indirectly estimates wind speeds based on observed damage. In essence, the EF scale contours, estimated by the local NWS forecast office, simply smooth out the individual wind speed estimates assigned to each structure using the EF scale. While there is higher uncertainty in these estimates (Edwards et al. 2013), they also still represent the best readily available tornado wind speed estimates at present. For all three tornadoes, the wind speed estimates are intended to represent 3 s gusts in open terrain at 10 m height. Note that the values of the estimated wind speed provided in the WiSPD, derived from the ARA and National Weather Service, are different from those presented in Table 1, which are peak storm intensities derived from the National Weather Service and National Hurricane Center event reports.
Summary of Fields Included in WiSPD v1.0
The methods described in the previous two sections were used to create the first version of the windstorm performance data set (WiSPD), which captures building attributes and component-level damage quantification for single-family residential structures only. The fields chosen for this data set focus on an initial set of building attributes and contextual data relevant to understanding the performance of each home consisting of the following: details on the hazards present; hazard intensity; overall damage ratings; age of the structure; building attributes; component-level damage quantification at a confidence level; and basic wind speed estimates for ASCE 7-05 (ASCE 2005), ASCE 7-10 (ASCE 2013), and ASCE 7-16 (ASCE 2017) (Table 2).
| Field alias | Field |
|---|---|
| Record ID | record_id |
| Event | event |
| Latitude | latitude |
| Longitude | longitude |
| Hazards present | hazards_present |
| Wind speed () | wind_speed_ms |
| Wind damage rating | wind_damage_rating |
| Surge damage rating | surge_damage_rating |
| Year built | year_built |
| Building code enforced | Building_code |
| Roof shape | roof_shape |
| Roof cover | roof_cover |
| Number of stories | number_of_stories |
| First-floor elevation (ft) | first_floor_elevation_feet |
| Roof structure damage | roof_structure_damage |
| Roof substrate damage | roof_substrate_damage |
| Roof cover damage | roof_cover_damage |
| Wall structure damage | wall_structure_damage |
| Wall substrate damage | wall_substrate_damage |
| Wall cladding damage | wall_cladding_damage |
| Large door present | large_door_present |
| Large door failure | large_door_failure |
| Fenestration damage | fenestration_avg |
| Basic wind speed ASCE 7-05 () | basic_speed_ms_705 |
| Basic wind speed ASCE 7-10 () | basic_speed_ms_710 |
| Basic wind speed ASCE 7-16 () | basic_speed_ms_716 |
Other WiSPD fields are defined as follows. The record ID is a unique alphanumeric string that relates the record back to the original source data sets published on DesignSafe, where additional fields may be available that have not yet been integrated into WiSPD. The event indicates which of the seven windstorm events each assessment is associated with. Latitude and longitude are provided to six decimal places using the WGS84 global coordinate reference system, which corresponds to approximately 0.111 m accuracy. The point location nominally represents the centroid of the building footprint. Hazards present indicates which hazards were present at the building site based on direct observation and includes wind, storm surge (representing both wave action and inundation), wind-borne debris, tree-fall, and more. Wind speed is the peak estimated 3 s gust wind speed at 10 m above ground level in open terrain, as described in the previous section.
The year built is the original construction year of the home, sourced from county appraisal data sets, realtor data, or review of historical imagery. The building code is the building code that was in place for the year the structure was built within the community in which it is located. The roof shape classifies the shape of the roof structure as gable, hip, hip and gable combination, flat, complex, or other. Roof cover classifies the roof outer waterproofing layer, with options including three-tab asphalt shingle, laminated asphalt shingle, standing seam metal roof, corrugated metal roof, tile, and more. The number of stories defines the number of stories of livable area, not including the ground floor in elevated structures with breakaway walls. The first-floor elevation defines the height above ground to the lowest structural member of the first floor of living area. In most cases, the first-floor elevation was either estimated visually using visible benchmarks (e.g., the number of stairs, height of a door), or measured virtually using 3D point clouds captured by field teams, or measurement tools in Google Earth and the Pictometry EagleView platform.
The wind damage rating and surge damage rating are discrete damage states, with the criteria given in Tables 3 and 4. Where the surge damage was to such an extent that the wind damage rating could not be reasonably separated out, the wind damage rating was not assigned (given a value of ). The CLDP have been described previously and are presented in integer percentages between 0 and 100 in increments of 5. A blank value indicates a CLDP could not be assigned, typically due to a lack of visibility. The large door present field indicates whether a garage door or other large door opening was present in the building envelope. Large door failure indicates whether the large door, if present, failed or not, with failure being defined as any permanent, visible damage, including complete removal from the building. Fenestration damage defines the CLDP for all other fenestration except for large doors. Finally, the basic wind speed provides the basic wind speed per ASCE 7-05, ASCE 7-10, and ASCE 7-16 for the location as estimated by interpolating between the respective ASCE 7 contours. Some municipalities specify a single basic wind speed for an entire jurisdiction, which could lead to small discrepancies between the basic wind speeds contained in WiSPD and the actual basic wind speeds relevant at the time of construction.
| Damage statea | Short description | Presence of extent of failure in: | Fascia and/or soffit | ||||
|---|---|---|---|---|---|---|---|
| Roof or wall cover | Window or door | Roof or wall substrate | Roof structure | Wall structureb | |||
| 0 No damage | No visible exterior damage | 0% | No | No | No | No | No |
| 1 Minor damage | Damage confined to envelope | and | 1 | No | No | No | |
| 2 Moderate damage | Load path preserved, but significant repairs required | and | and ≤ the larger of 3 and 20% | 1 to 3 panels | No | No | |
| 3 Severe damage | Major impacts to structural load path | > the larger of 3 and 20% and | and | No | |||
| 4 Destroyed | Total loss. Structural load path compromised beyond repair | Yes | |||||
a
A building is considered to be in the damage state if any of the bolded damage criteria in the corresponding row are met.
b
Wall structure refers to the walls in the living area only. The ground floor of elevated structures often has breakaway walls that can be easily damage by storm surge. This damage should be ignored in assigning the overall damage rating.
| Damage state | Description |
|---|---|
| 0 None or very minor damage | No floodwater impacts. |
| 1 Minor damage | Breakaway walls or appurtenant structures damaged or removed WITHOUT physical damage to remaining structure. No flood impacts the building. |
| 2 Moderate damage | Some wall cladding damage from flood-borne debris. Breakaway walls or appurtenant structures damage or removed WITH physical damage to remaining structures. |
| 3 Severe damage | Removal of cladding from “wash through” of surge without wall structural damage. |
| 4 Very severe damage | Failure of wall frame, repairable structural damage to any portion of building, or of building plan area unrepairable. |
| 5 Partial collapse | Building shifted off foundation, overall structure racking, of structure unrepairable. |
| 6 Collapse | Total structural failure (no intact structure). |
The fields described here are certainly not exhaustive. There are many other attributes relevant to building windstorm performance that ideally would be included but will take considerable time and effort to add reliably and therefore is beyond the scope of this initial effort. The attributes provided in Version 1 create a foundation for the WiSPD in that (1) they include common inputs to typical community-scale damage simulation models (e.g., HAZUS Hurricane), (2) they can be used to apply more subjective rule-sets for estimating additional attributes [e.g., using year built and location to infer the likely roof-to-wall connection type, as in Wang et al. (2021b)], and (3) they define a quantitative estimate of the physical damage sustained by the structure on a continuous scale by component, which we believe is a significant step forward from the historical use of discrete global damage ratings.
The resulting v.1 WiSPD is published on DesignSafe (PRJ-3650), an open-source publication with version control. This first version of the WiSPD contains fields that could be identified in each individual data set. However, the goal of this study is to present a unified and living dataset that allows continuous refinement and enhancement, through adding additional fields to the data set, adding additional storm events, and refining existing data if methods evolve further. These additions will be published as version changes to maintain the lineage of the data set.
Summary Statistics of the WiSPD v1.0
The WiSPD v1 contains 1,608 single-family homes affected by tornadoes and 3,016 homes affected by hurricanes. Most of the homes in WiSPD were assessed during hurricanes Harvey (2017) and Irma (2017) and the Middle Tennessee tornados (2020) (Fig. 2). The homes are primarily located in the South or Southeast United States, with the states of Texas, Louisiana, Florida, Tennessee, and Missouri represented.
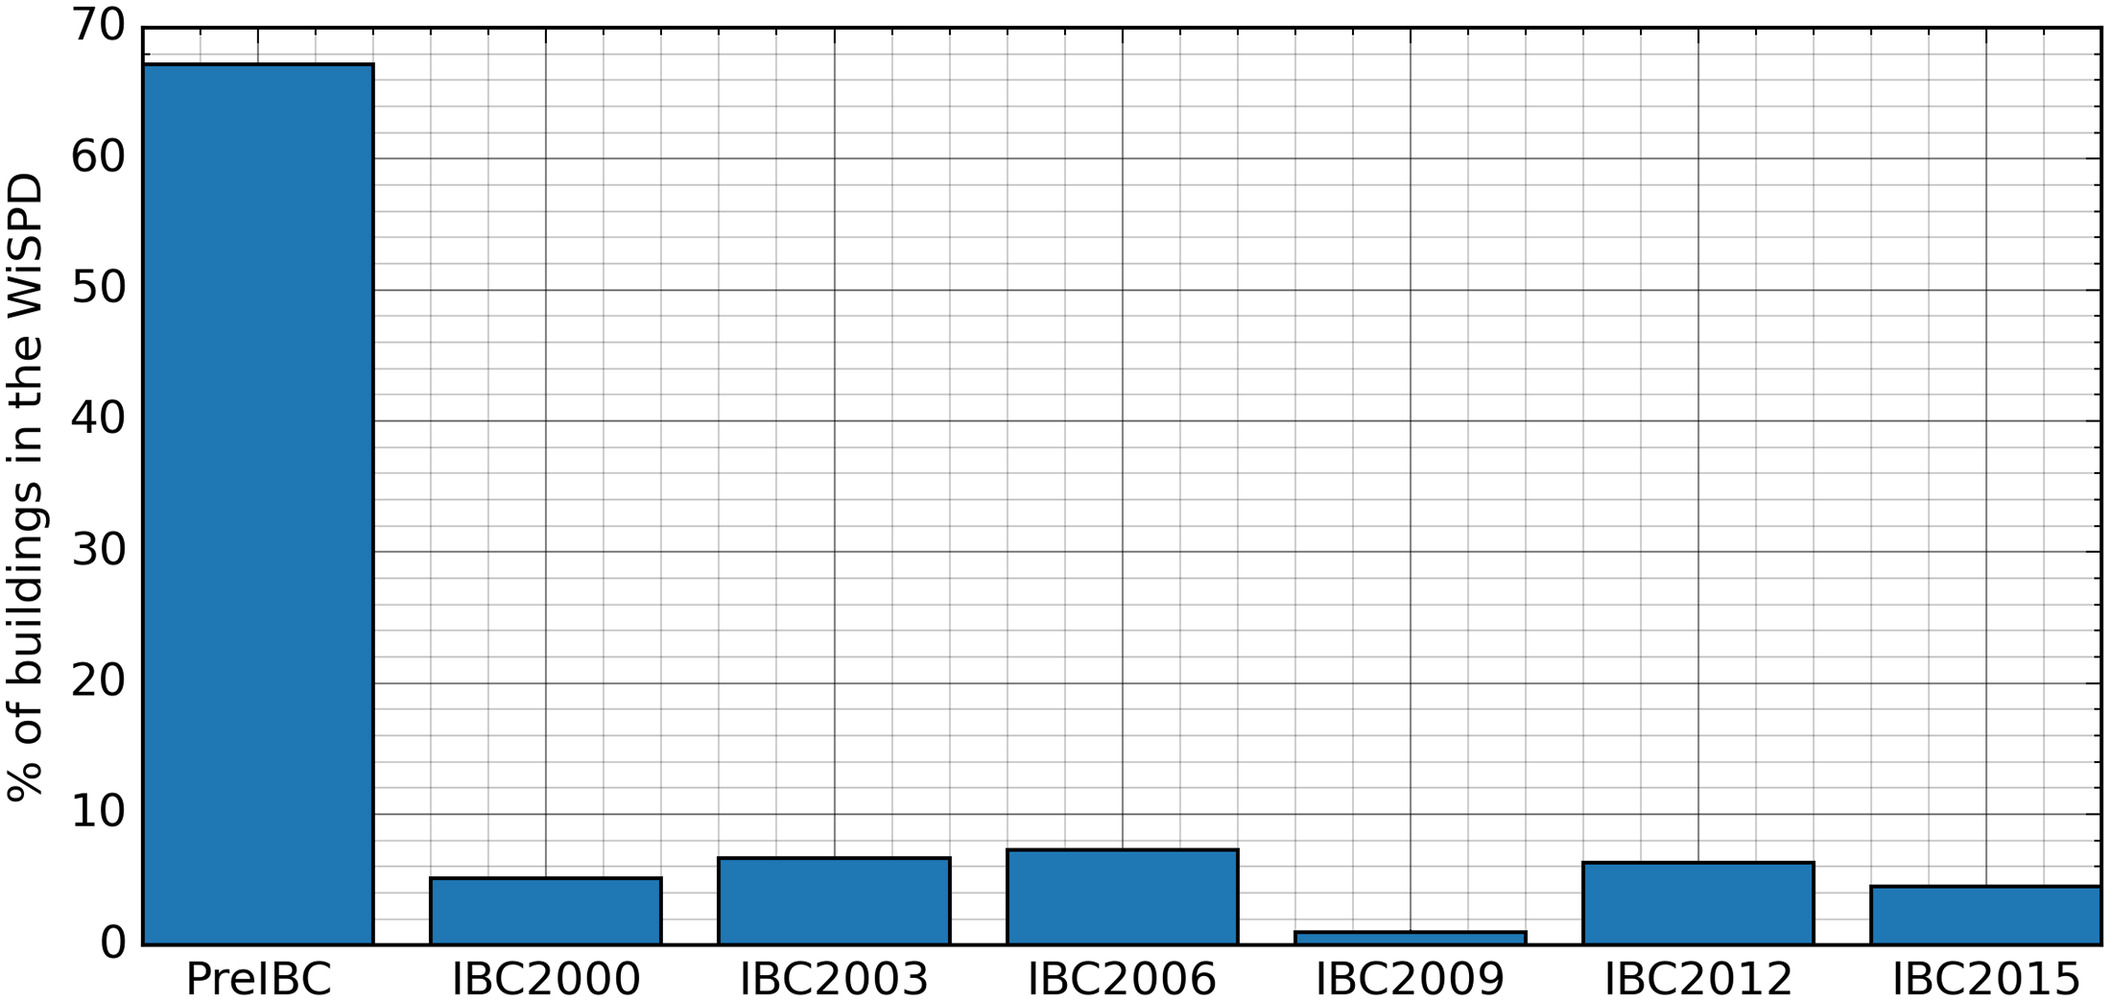
Regarding the year of construction, most of the homes were constructed after 1980 (69.2%), with 33% built after 2001 (Fig. 3). The first International Building Code was adopted in 2001, and each jurisdiction adopted the 2001 IBC at different times, but using the available code history from the FLASH Inspect to Protect tool, approximately 30% of the WiSPD is post-IBC construction (Fig. 4).
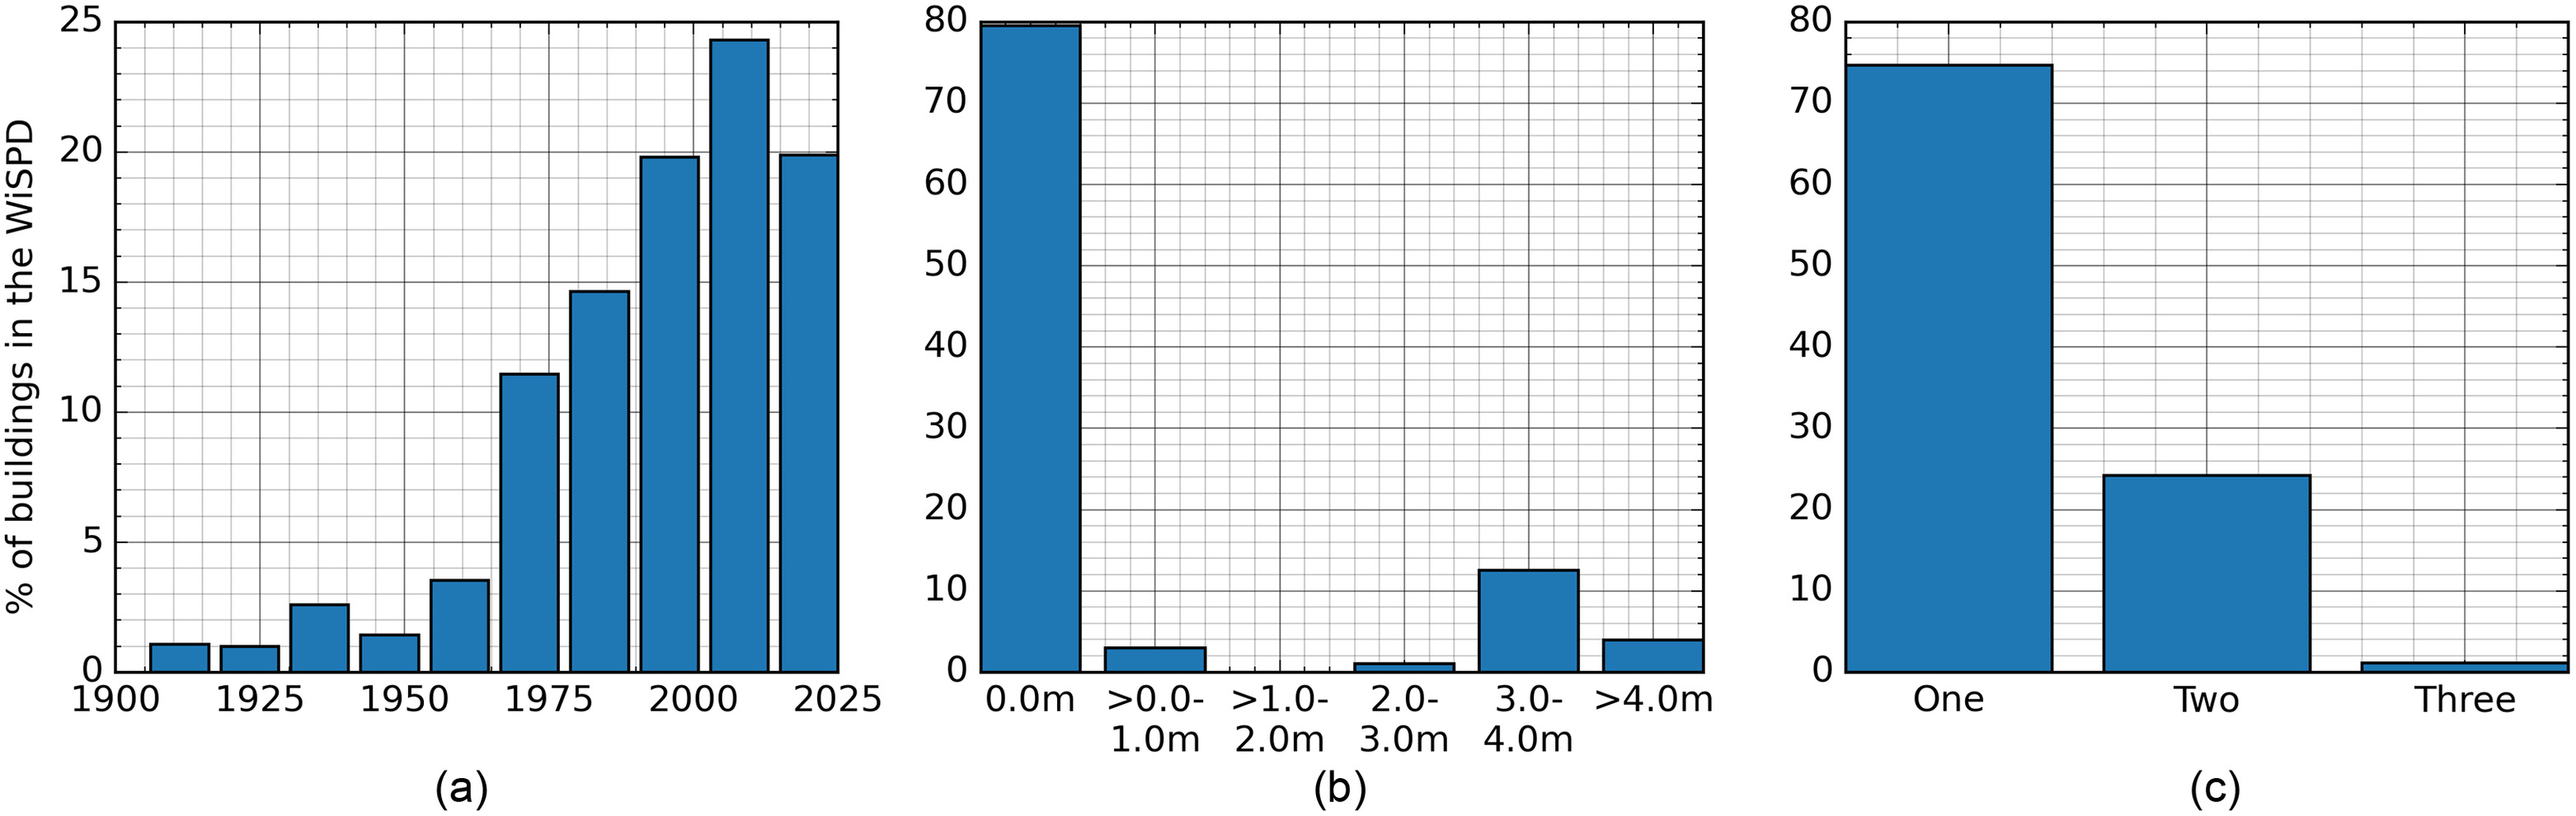
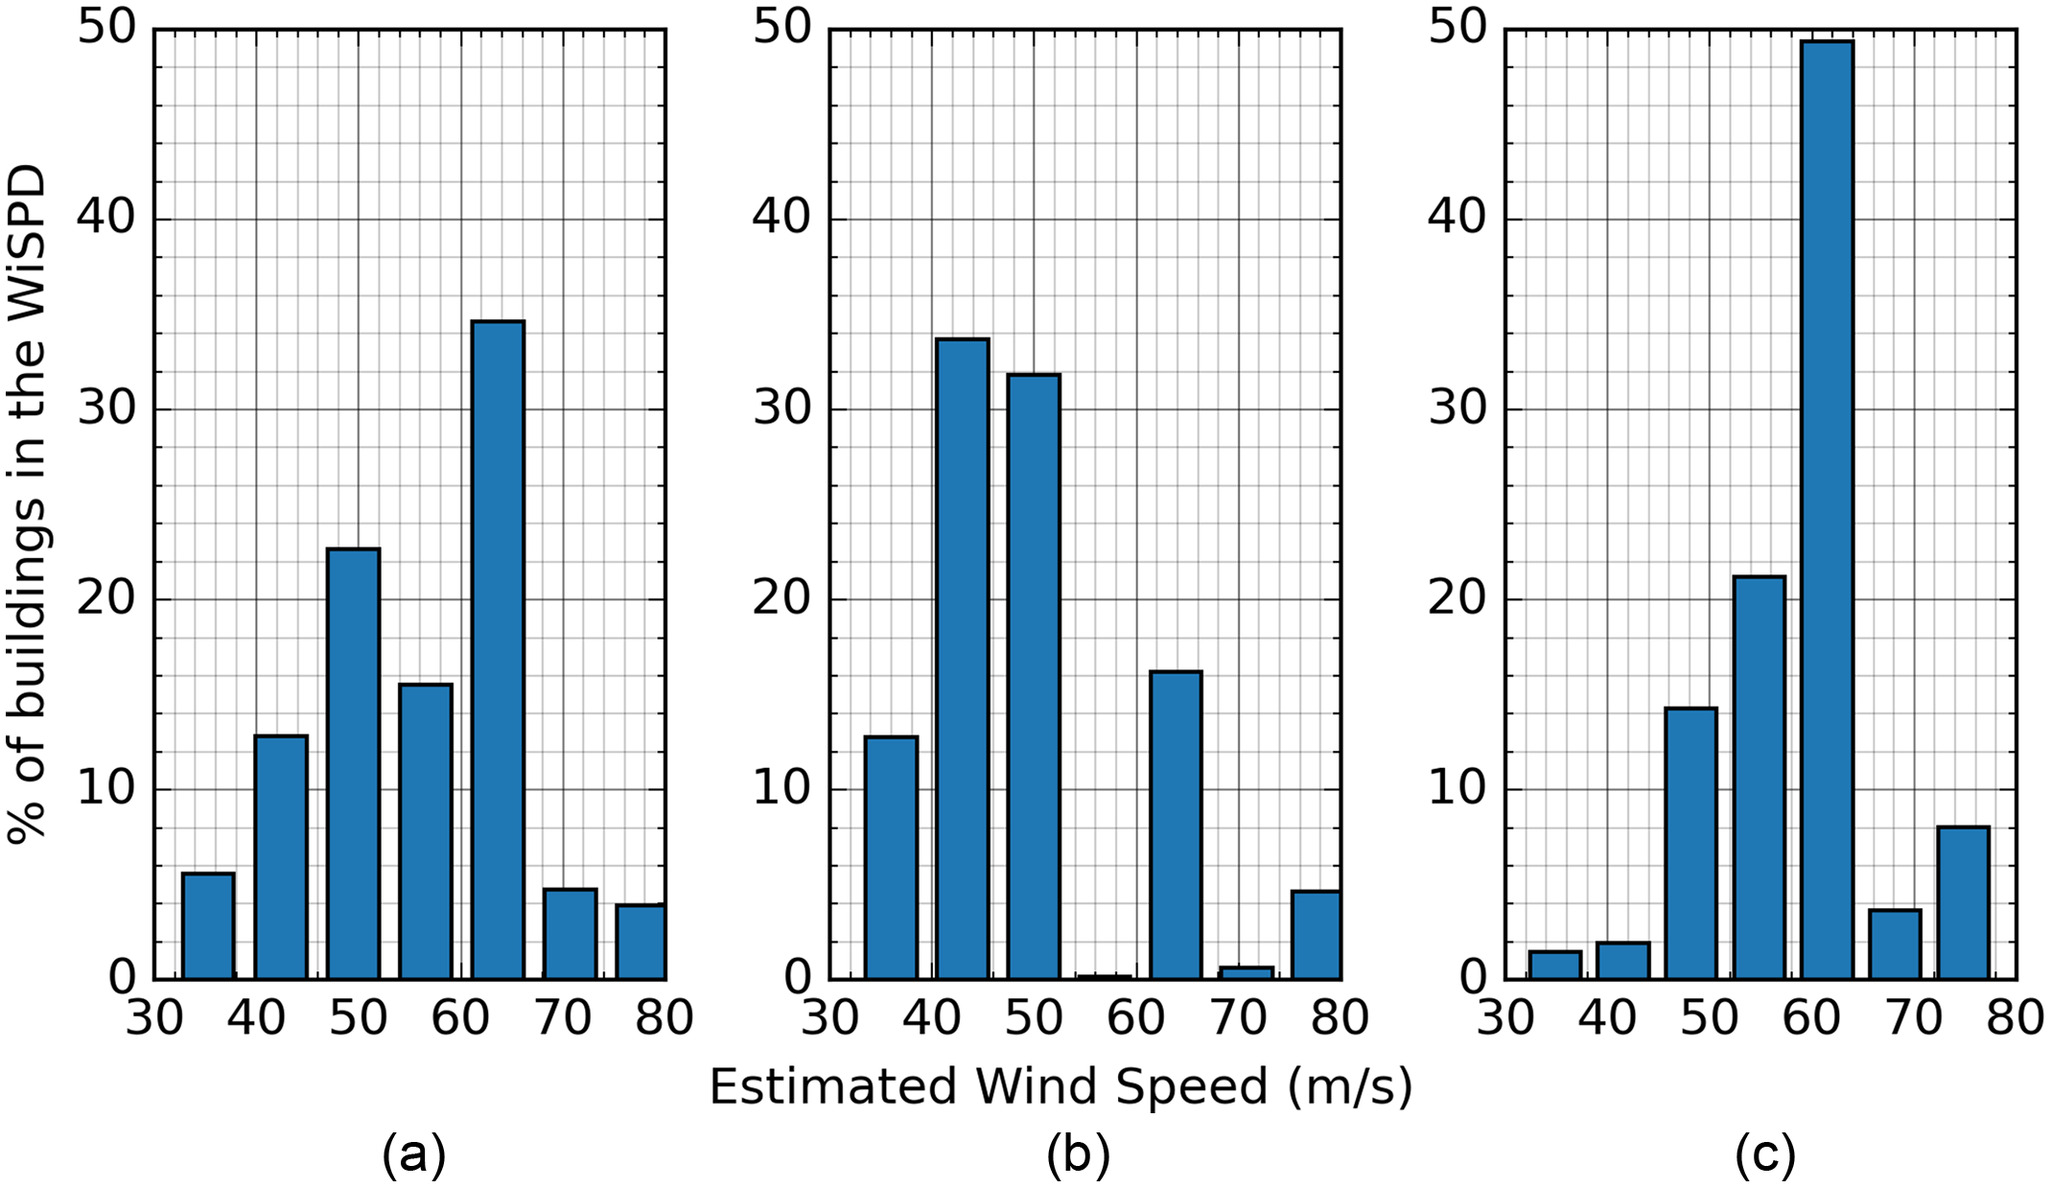
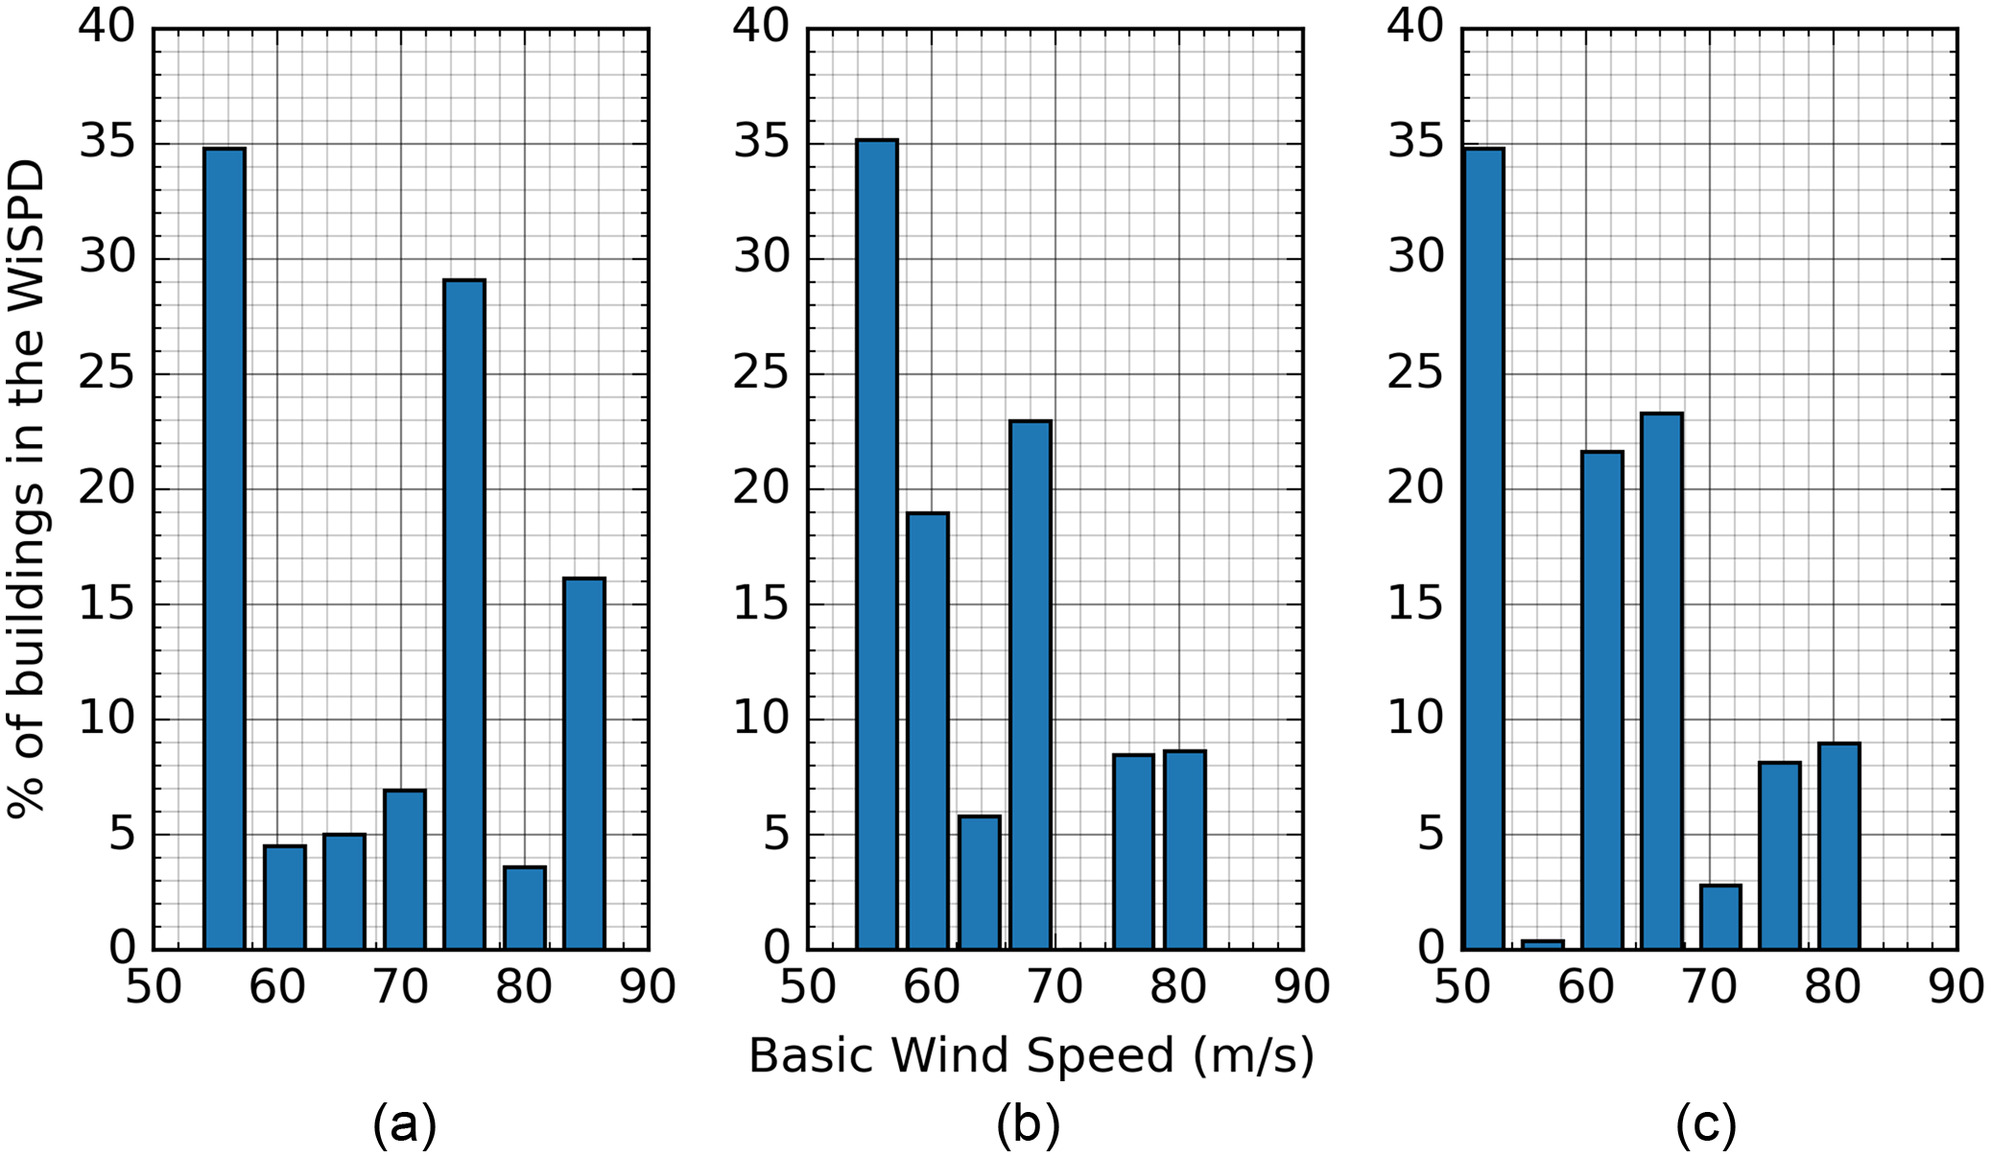
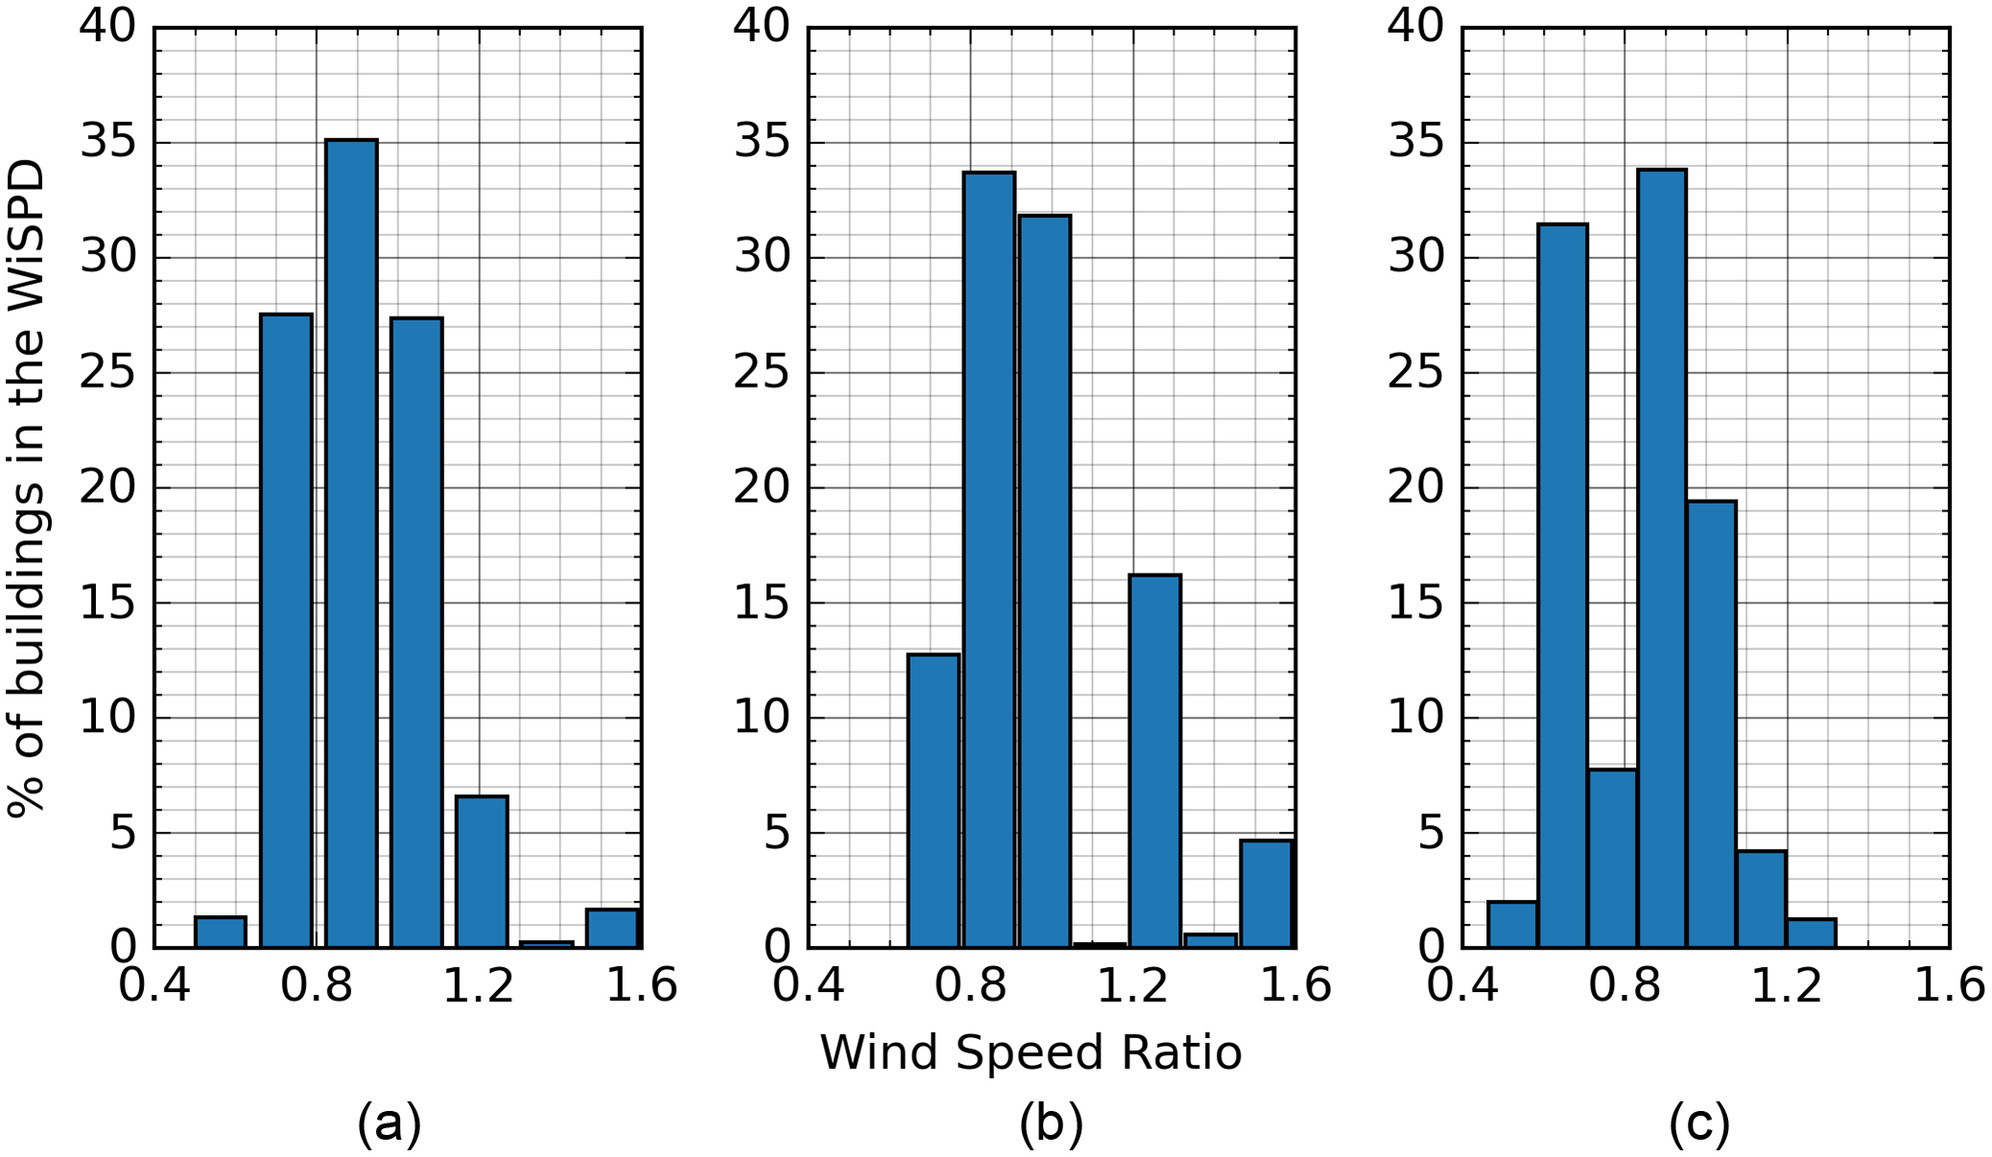
Nearly 82% of the homes contained in the WiSPD have first-floor elevations less than 1.0 m, which is indicative of noncoastal buildings. However, the data set does contain a sizable set of coastal homes, with almost 800 having a first-floor elevation of at least 2.0 m (Fig. 3). The estimated wind speeds experienced by the homes in their respective hazard events primarily fell between and (70%) (Fig. 5). The maximum experienced wind speeds (up to ) during the hazard events in the data set are associated with homes impacted by the 2011 Joplin, Missouri, tornado, but Hurricane Michael (2018) also has multiple homes subjected to estimated wind speeds of . 35% of homes are located in noncoastal regions of the United States, where the basic wind speed is approximately (Fig. 6) for most of the regions. The basic wind speed for each structure was assigned by cross referencing the assigned building code and the corresponding ASCE 7 version. For homes constructed pre-ASCE 7-05, basic wind speeds were assigned. The wind speed ratio, defined as the estimated wind speed divided by the basic wind speed, illustrates that, while most of the structures experienced wind speeds less than or equal to their design levels, structures impacted by tornadoes experienced wind speeds higher than their basic wind speeds more than 50% of the time (Fig. 7).
Damage is defined in the WiSPD as both discrete global damage ratings for wind and (where appropriate) surge and CLDP (Table 5). Wind damage is dominant in the WiSPD, with only 306 out of the 4,624 homes experiencing observable surge damage. The limited number of homes with observable surge damage is due to the much smaller extent of surge impacts in hurricanes relative to wind, the lack of observable surge damage in many homes that likely experienced surge effects but had mitigating features (e.g., sufficient freeboard) and, in some cases, the lack of access to remote coastal communities that were most heavily impacted by storm surge (e.g., Hurricane Laura). Seventy-four homes were completely swept away by storm surge, making it impossible to assign a wind damage rating. Although wind may have contributed to the complete destruction, it is not possible in these situations to distinguish wind-specific damage. Most homes experienced a wind damage rating of minor, with moderate being the next most frequently observed damage rating. No visible damage was observed in 822 homes. The absence of damage is important for conditioning damage prediction or damage characterization models (e.g., fragility functions); thus, the WiSPD should be suitable for such analysis, although for individual events it may be necessary to expand the proportion of “no damage” records through additional virtual assessments using post-storm aerial or street-level panoramic imagery. In tornadic events specifically, the wind damage rating increases to an average of 2.17 (between moderate and severe), while hurricane events averaged a wind damage rating of 1.42 (between minor and moderate), indicating that homes are likely to experience more severe damage in tornadoes than hurricanes.
| Surge damage ratinga | Wind damage ratingb | Total | |||||
|---|---|---|---|---|---|---|---|
| 0 | 1 | 2 | 3 | 4 | |||
| 0 | 1 | 802 | 1,358 | 1,071 | 463 | 623 | 4,318 |
| 1 | 0 | 12 | 43 | 31 | 9 | 7 | 102 |
| 2 | 0 | 7 | 13 | 16 | 14 | 8 | 58 |
| 3 | 0 | 1 | 5 | 14 | 12 | 10 | 42 |
| 4 | 0 | 0 | 1 | 2 | 1 | 9 | 13 |
| 5 | 1 | 0 | 1 | 3 | 1 | 9 | 15 |
| 6 | 74 | 0 | 0 | 0 | 0 | 2 | 76 |
| Total | 76 | 822 | 1,421 | 1,137 | 500 | 668 | 4,624 |
a
Surge damage ratings: 0 = none or very minor damage; 1 = minor damage; 2 = moderate damage; 3 = severe damage; 4 = very severe damage; 5 = partial collapse; and 6 = collapse.
b
Wind damage ratings: = Surge induced damage unable to classify wind damage; 0 = no damage; 1 = minor damage; 2 = moderate damage; 3 = severe damage; and 4 = destroyed. Full descriptions can be found in Table 3.
In addition to the discrete damage ratings, the WiSPD also includes component-level damage quantifications defined as the CLDP. From this continuous data, a variety of damage metrics can be defined. For examining the frequency at which various building components are damaged, the following approach is used [Eq. (1)]:where = the number of buildings with damage information for component ; and = an indicator function with a value of 0 if the given component for building does not exceed the specified limit state (e.g., roof cover damage of at least 10%) and 1 if the damage state is exceeded.
(1)
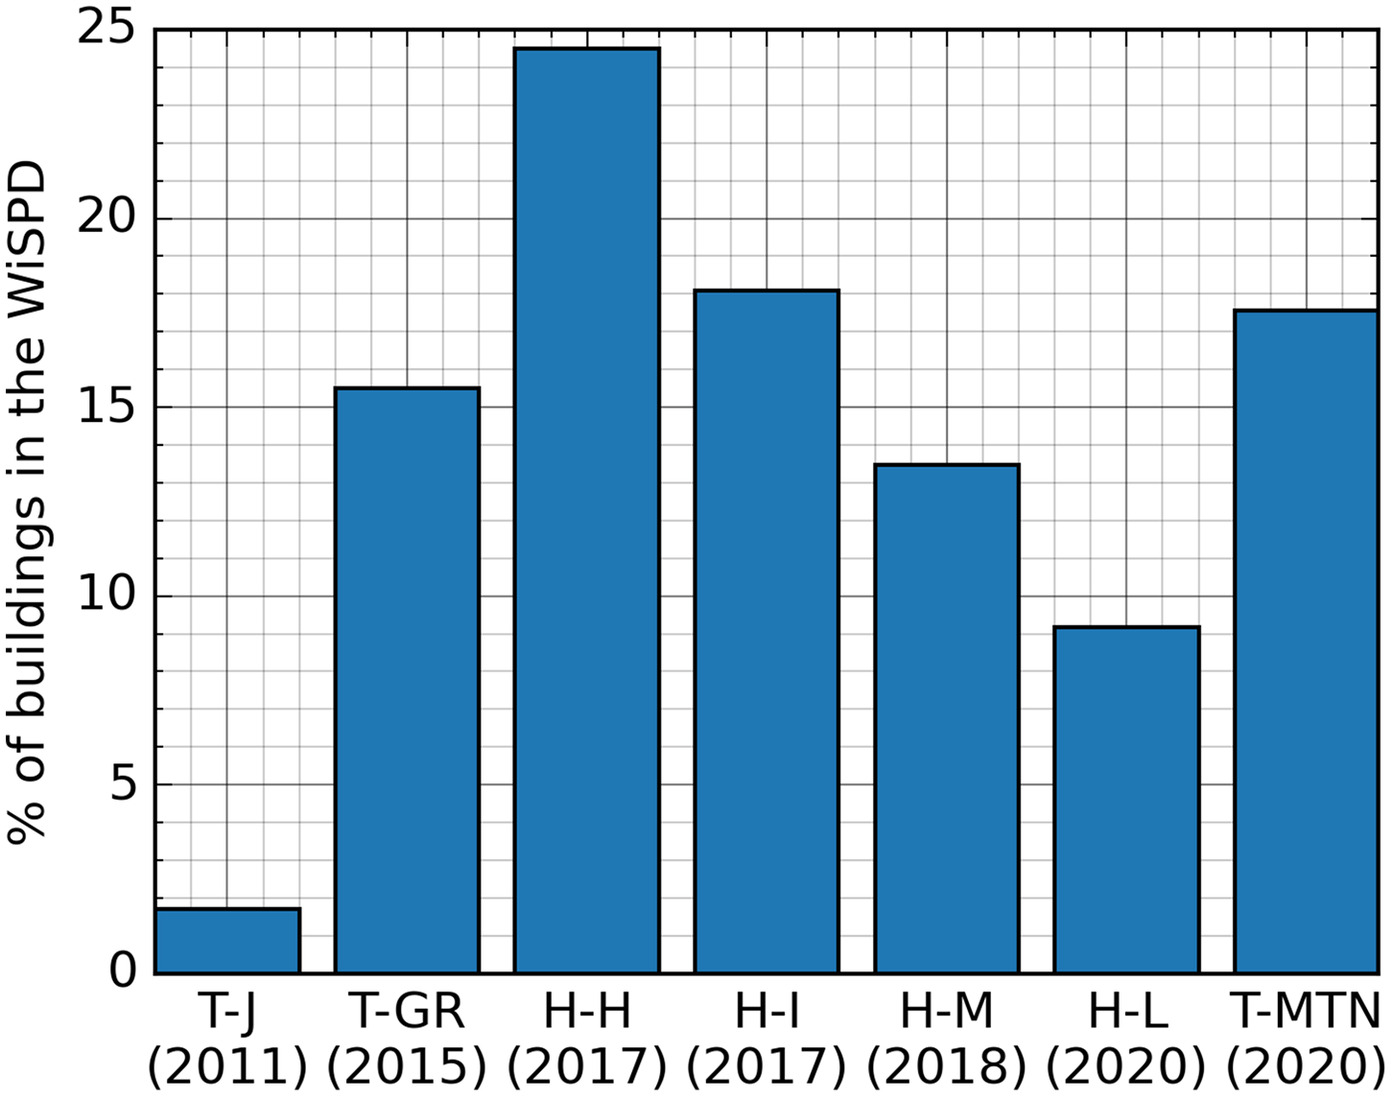
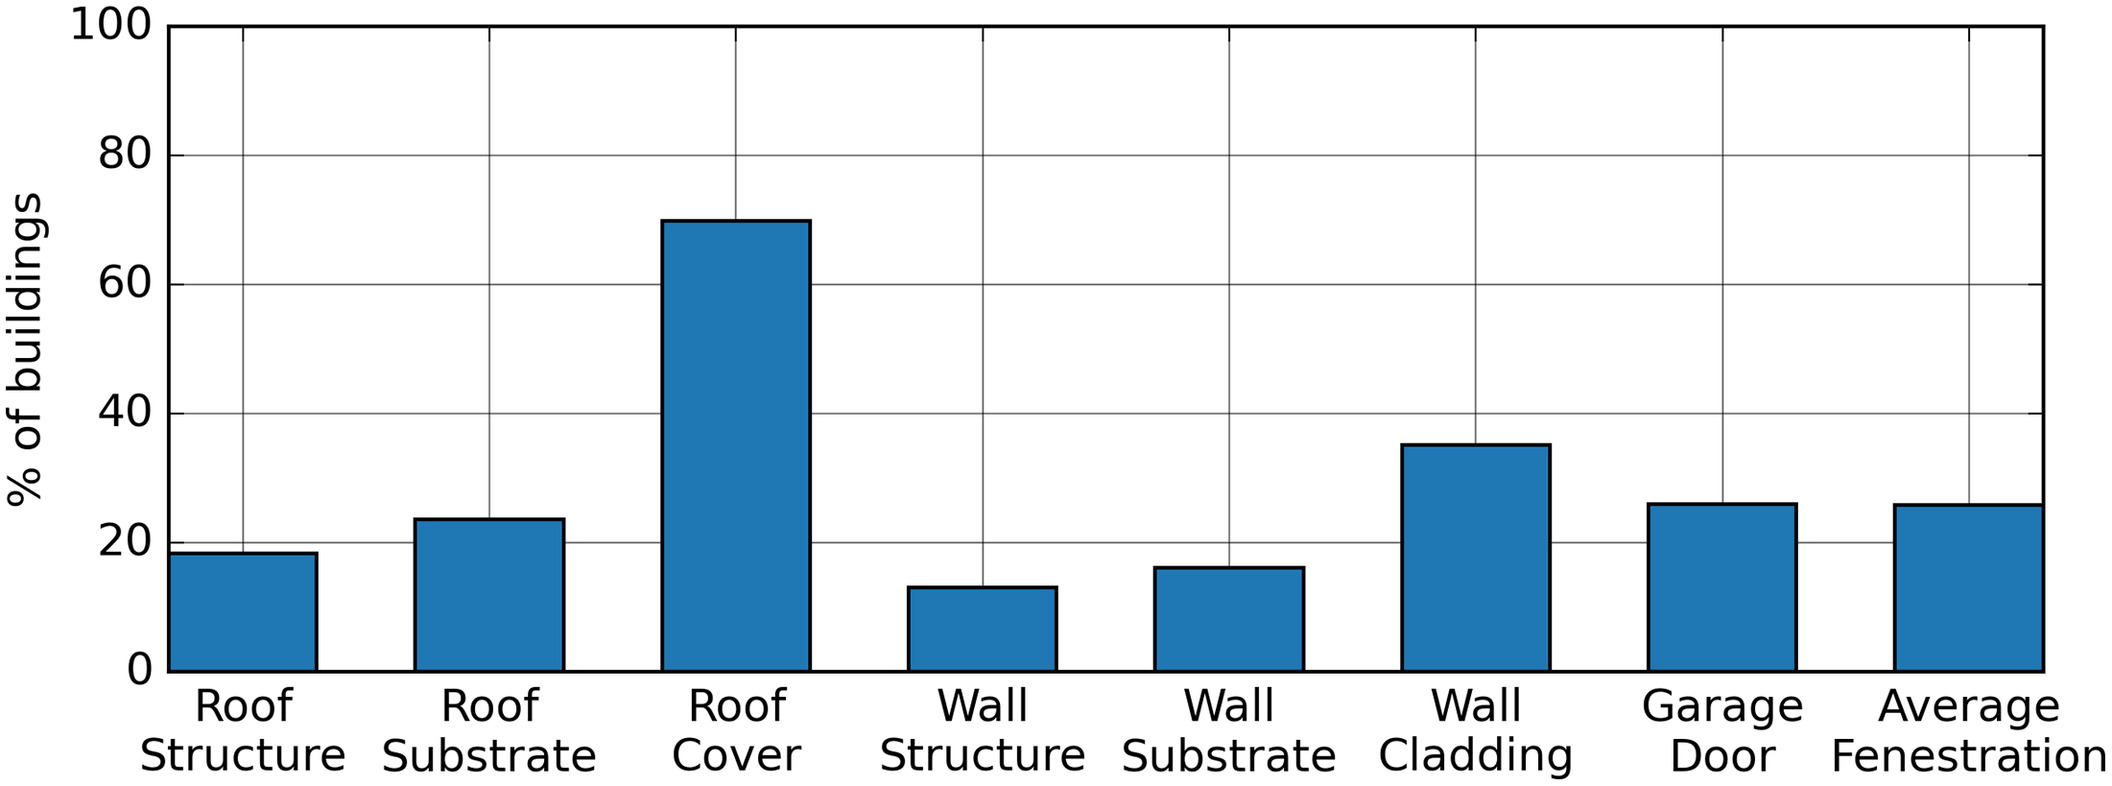
Using this damage frequency metric with a limit state of (i.e., any visible damage), the WiSPD shows that roof cover is by far the most frequently damaged building component, with 70% of all homes in the data set having visible exterior damage to the roof cover (Fig. 8). This trend is consistent in every windstorm (Fig. 9) and for all structures, regardless of whether they were built before or after the introduction of the ICC Codes in 2001 (Fig. 10). Additionally, the roof system (cover, substrate, and structure) is more commonly damaged than the wall system (Figs. 8 and 9). This is indicative of the top-down failure sequence typically observed in permanent housing in windstorms, which is at least partially caused by roof surfaces experiencing higher wind pressures than the walls. Notably, there is also an increased damage frequency of garage doors and fenestration for tornadoes compared with hurricanes (Fig. 9). This could be indicative of the impact of the large wind-borne debris cloud more prevalent in tornadoes than in hurricanes. In hurricanes and tornadoes, damage to fenestration and large door assemblies is significant because such damage has been shown to be correlated with enhanced structural damage (Kovar et al. 2018; Roueche and Prevatt 2013).
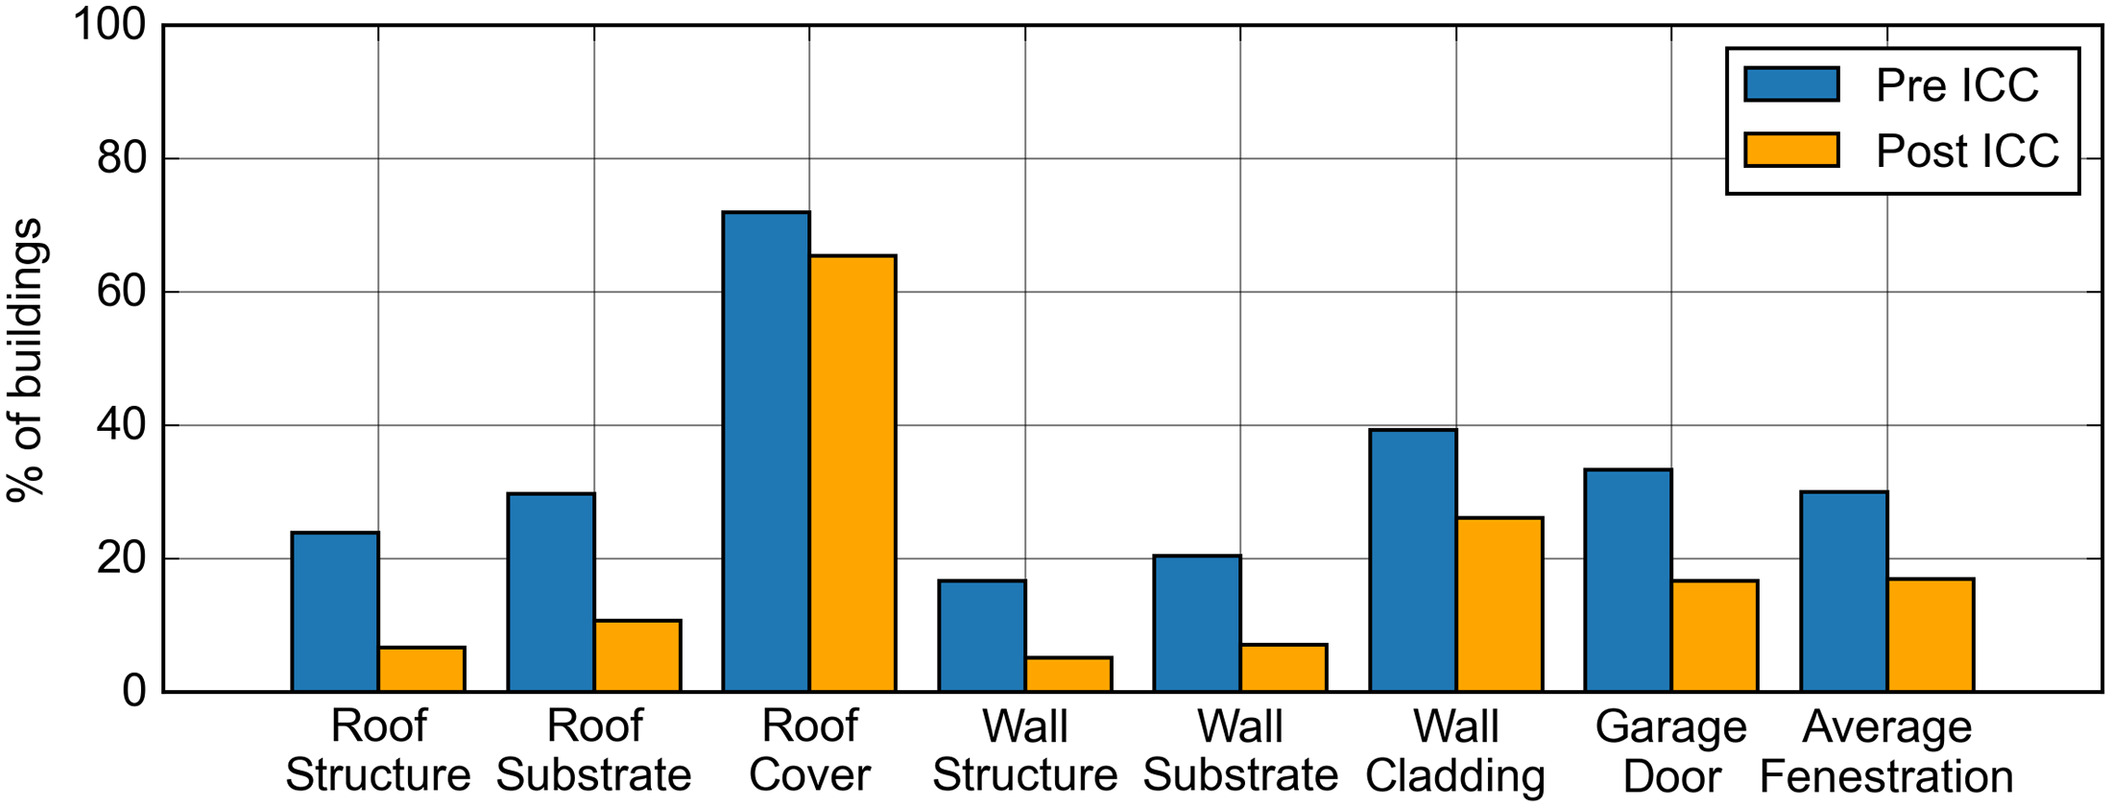
Considering damage frequency by the building code enforced at the time of construction, using pre-ICC and post-ICC construction (actual adoption year of ICC codes varies by region) shows that, for all building components, damage in homes built after the adoption of the ICC is less frequently observed than in pre-ICC homes (Fig. 10). However, the difference is small for roof cover (69% for post-ICC versus 74% for pre-ICC), possibly an indication of (1) the lack of improvements in wind performance of modern roof cover products, and (2) the limitation that the building code enforced in the year the home was constructed is an imperfect proxy for the age of the roof, as many roofs in older homes were likely replaced over time. Nonetheless, there is data-driven evidence overall that modern building codes do work to improve windstorm performance, particularly preventing structural failures.
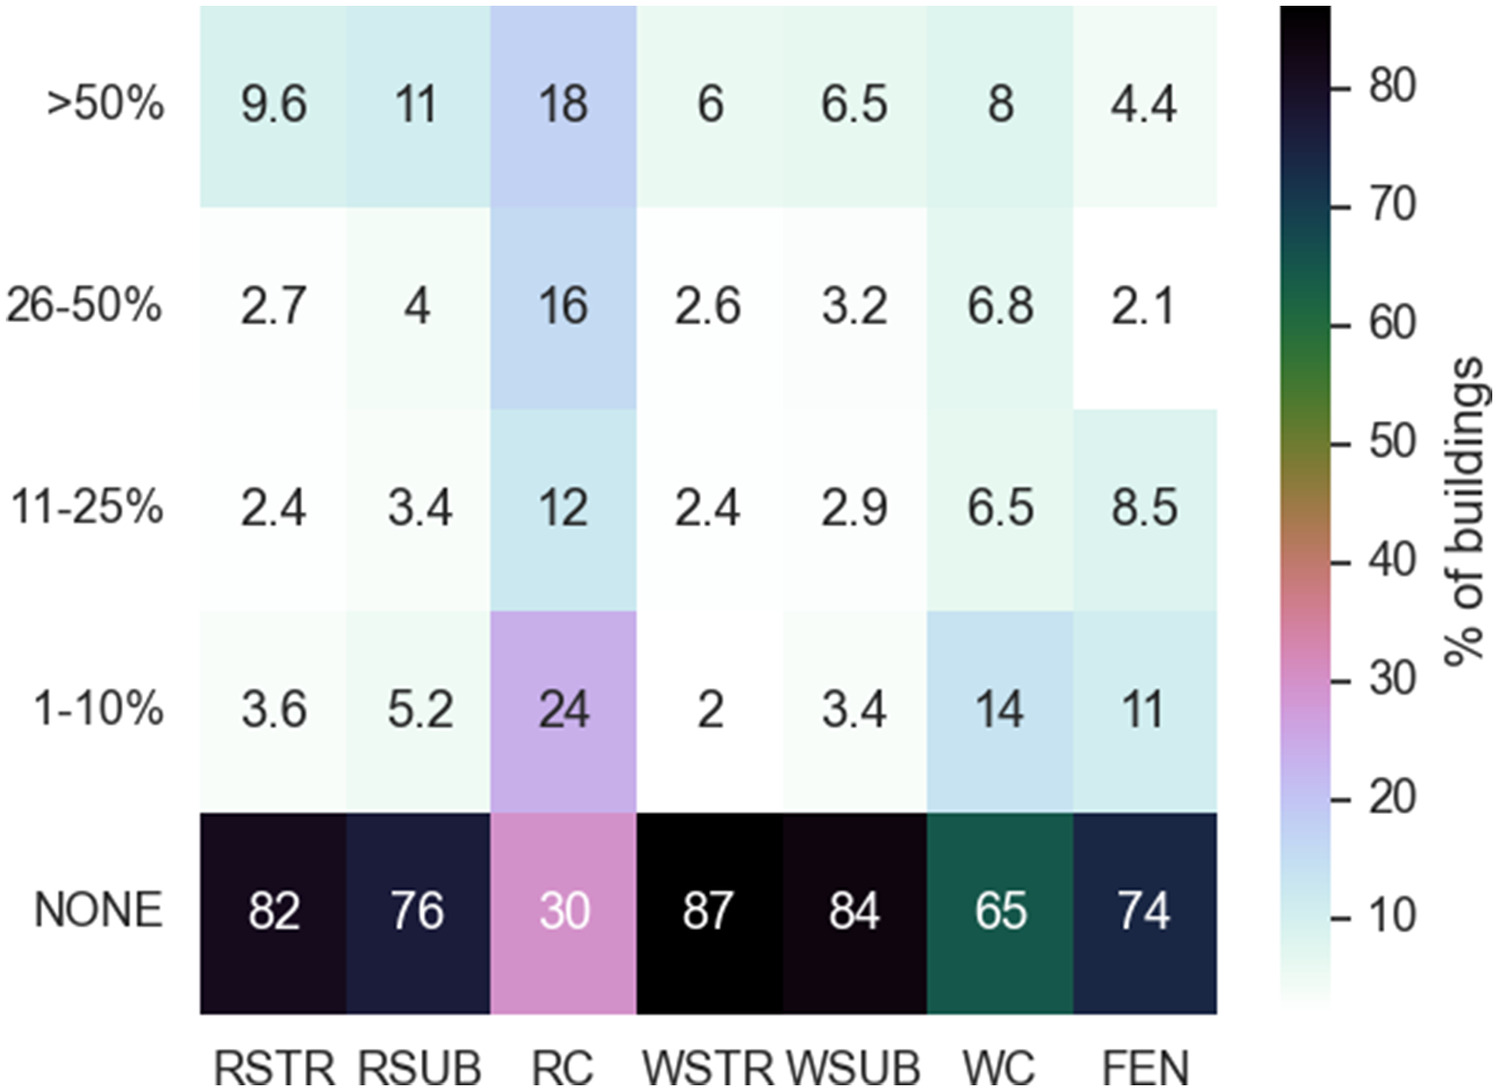
A more complete picture of windstorm performance is provided by stratifying the observed damage to each building component into discrete damage levels (Figs. 11 and 12). The selected damage levels consist of none, 1%–10%, 11%–25%, 26%–50%, and . With a majority of the WiSPD experiencing wind speeds in the lower range (), most of the components experienced 0% damage (Fig. 11). However, 70% of homes experienced roof cover damage, and 34% experienced greater than 25% damage (Fig. 11), which begins to approach and exceed replacement thresholds for roof cover and thus increases the likelihood of replacing the entire roof instead of repairing only the damaged portions. Further, the higher damage rates in roof cover have a nonlinear effect on economic losses, as not only does the cost to replace the damaged roof components increase, but the resulting rainwater ingress also damages more interior components (Sparks et al. 1994). After roof cover, wall cladding and fenestration were most likely to have observable damage levels. The higher damage levels tended to be less frequently observed. However, the damage level tended to be more frequently observed than the 11%–25% and 26%–50% damage levels, driven in part by homes experiencing complete destruction.
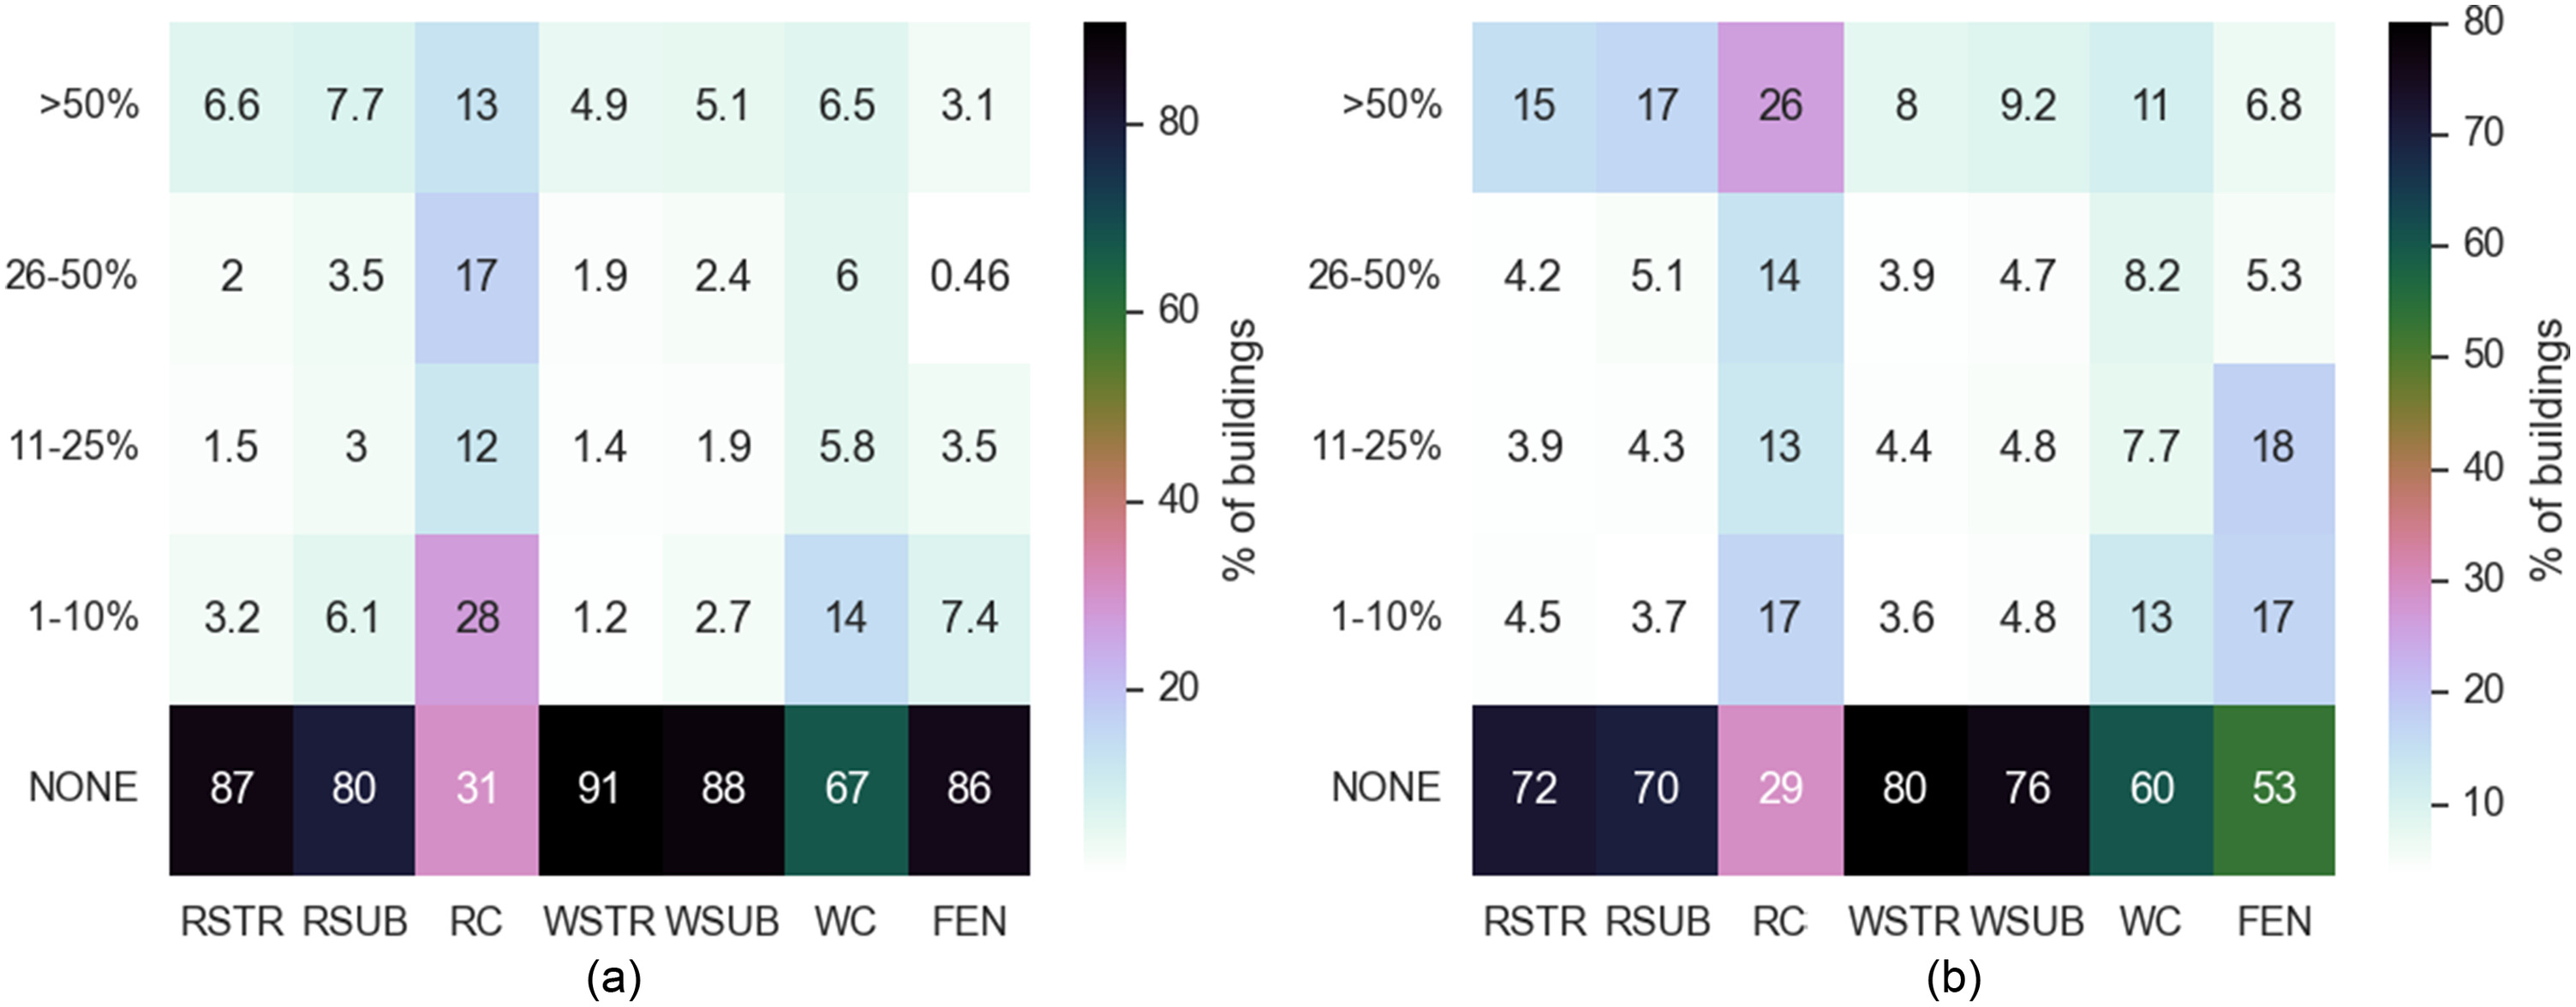
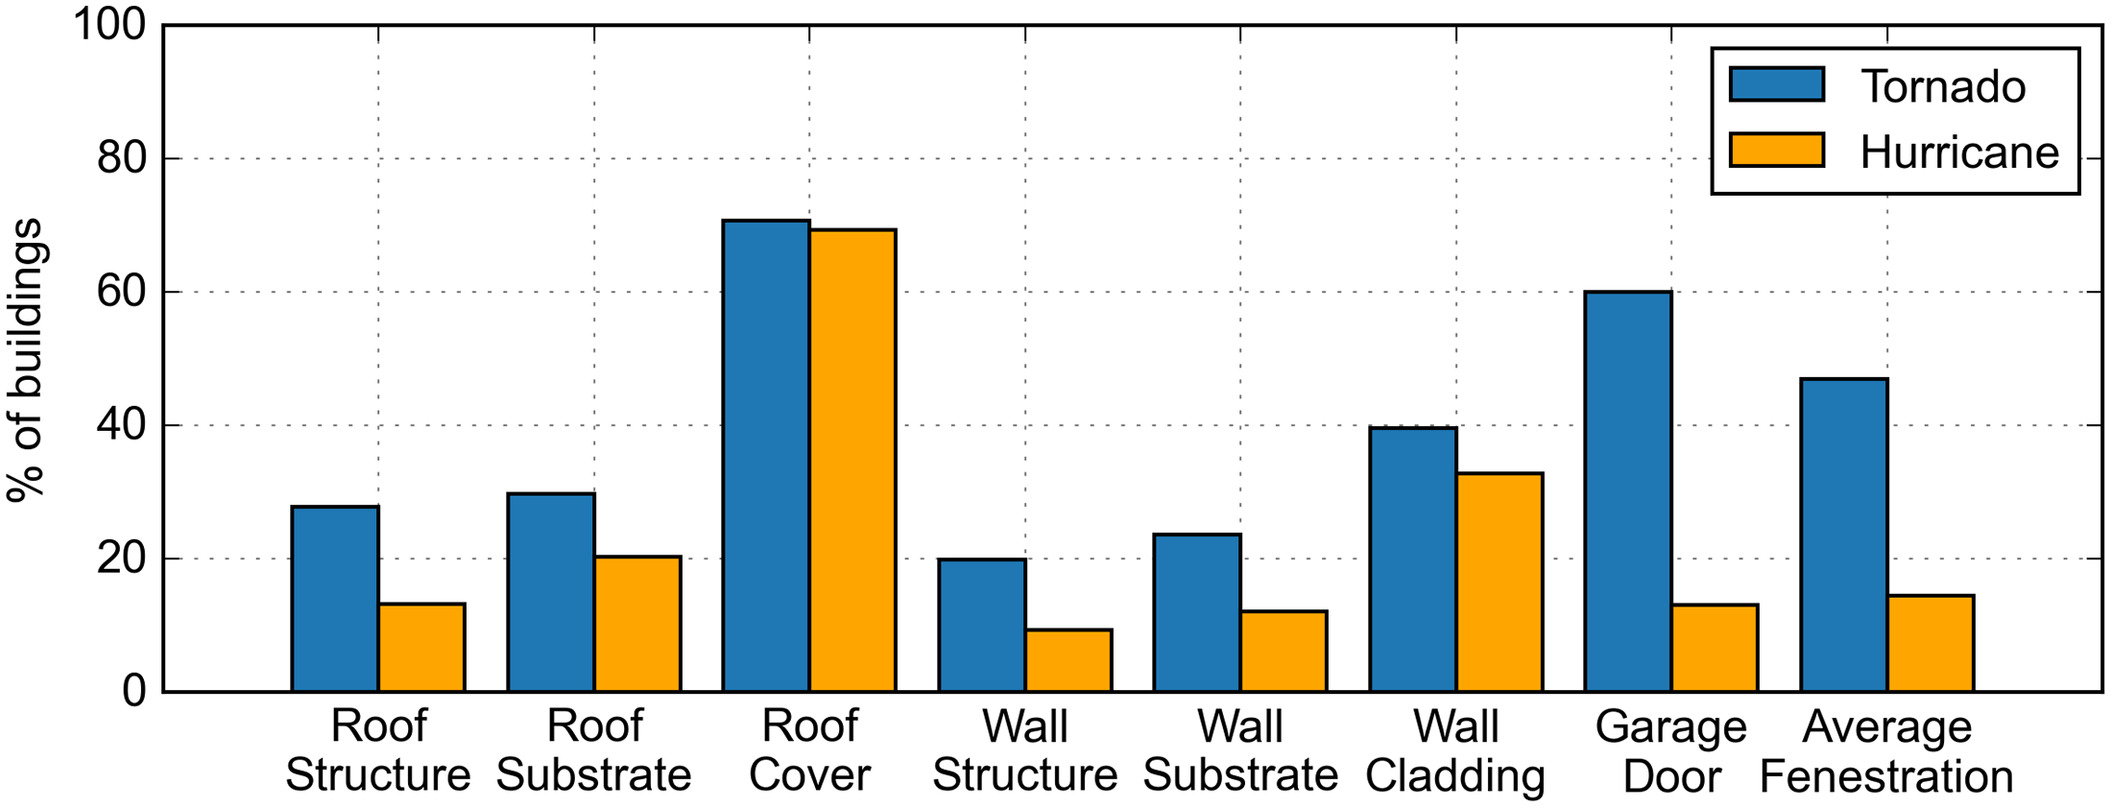
Separating damage rates between hurricanes and tornadoes, Fig. 12 shows that there are slight differences in the performance of homes subjected to hurricane winds () verses tornado winds (). As noted, the fenestration damage increases considerably in tornadoes, with 47% of buildings experiencing some level of fenestration damage, as opposed to 14% in hurricanes, and 18% of homes experiencing damage to between 11% and 25% of the fenestration in tornadoes versus only 3.5% experiencing that level of fenestration damage in hurricanes. This difference is likely caused by hazard and mitigation factors, as (1) tornadoes are associated with larger wind-borne debris clouds than hurricanes, and (2) fenestration is much more likely to be protected (either through impact-rated assemblies or shutters) in hurricane-prone regions than tornado. Beyond fenestration damage, roof damage as a whole trends slightly higher for tornadoes than that of hurricanes. A more robust causal analysis would be needed to address why, as hazard [e.g., potentially greater pressures in tornadoes for the same wind speeds (Jaffe and Kopp 2021; Roueche et al. 2020b)] and vulnerability (e.g., basic wind speeds are higher for homes likely to experience hurricanes than those in the interior of the country where these tornado events occurred) differ between the two. Finally, the proportion of homes with damage in tornadoes is greater than that for hurricanes, across all components considered. This is partly due to the greater likelihood of seeing complete destruction (roof and all walls collapsed) in tornadoes than in hurricanes. Complete destruction (all components at 100% damage) occurred in 68 of the 1,608 homes affected by tornadoes (4.2%) versus 94 of the 3,016 homes affected by hurricanes (3.1%); however, all the homes that suffered complete destruction in hurricanes were associated with storm surge, not high winds only.
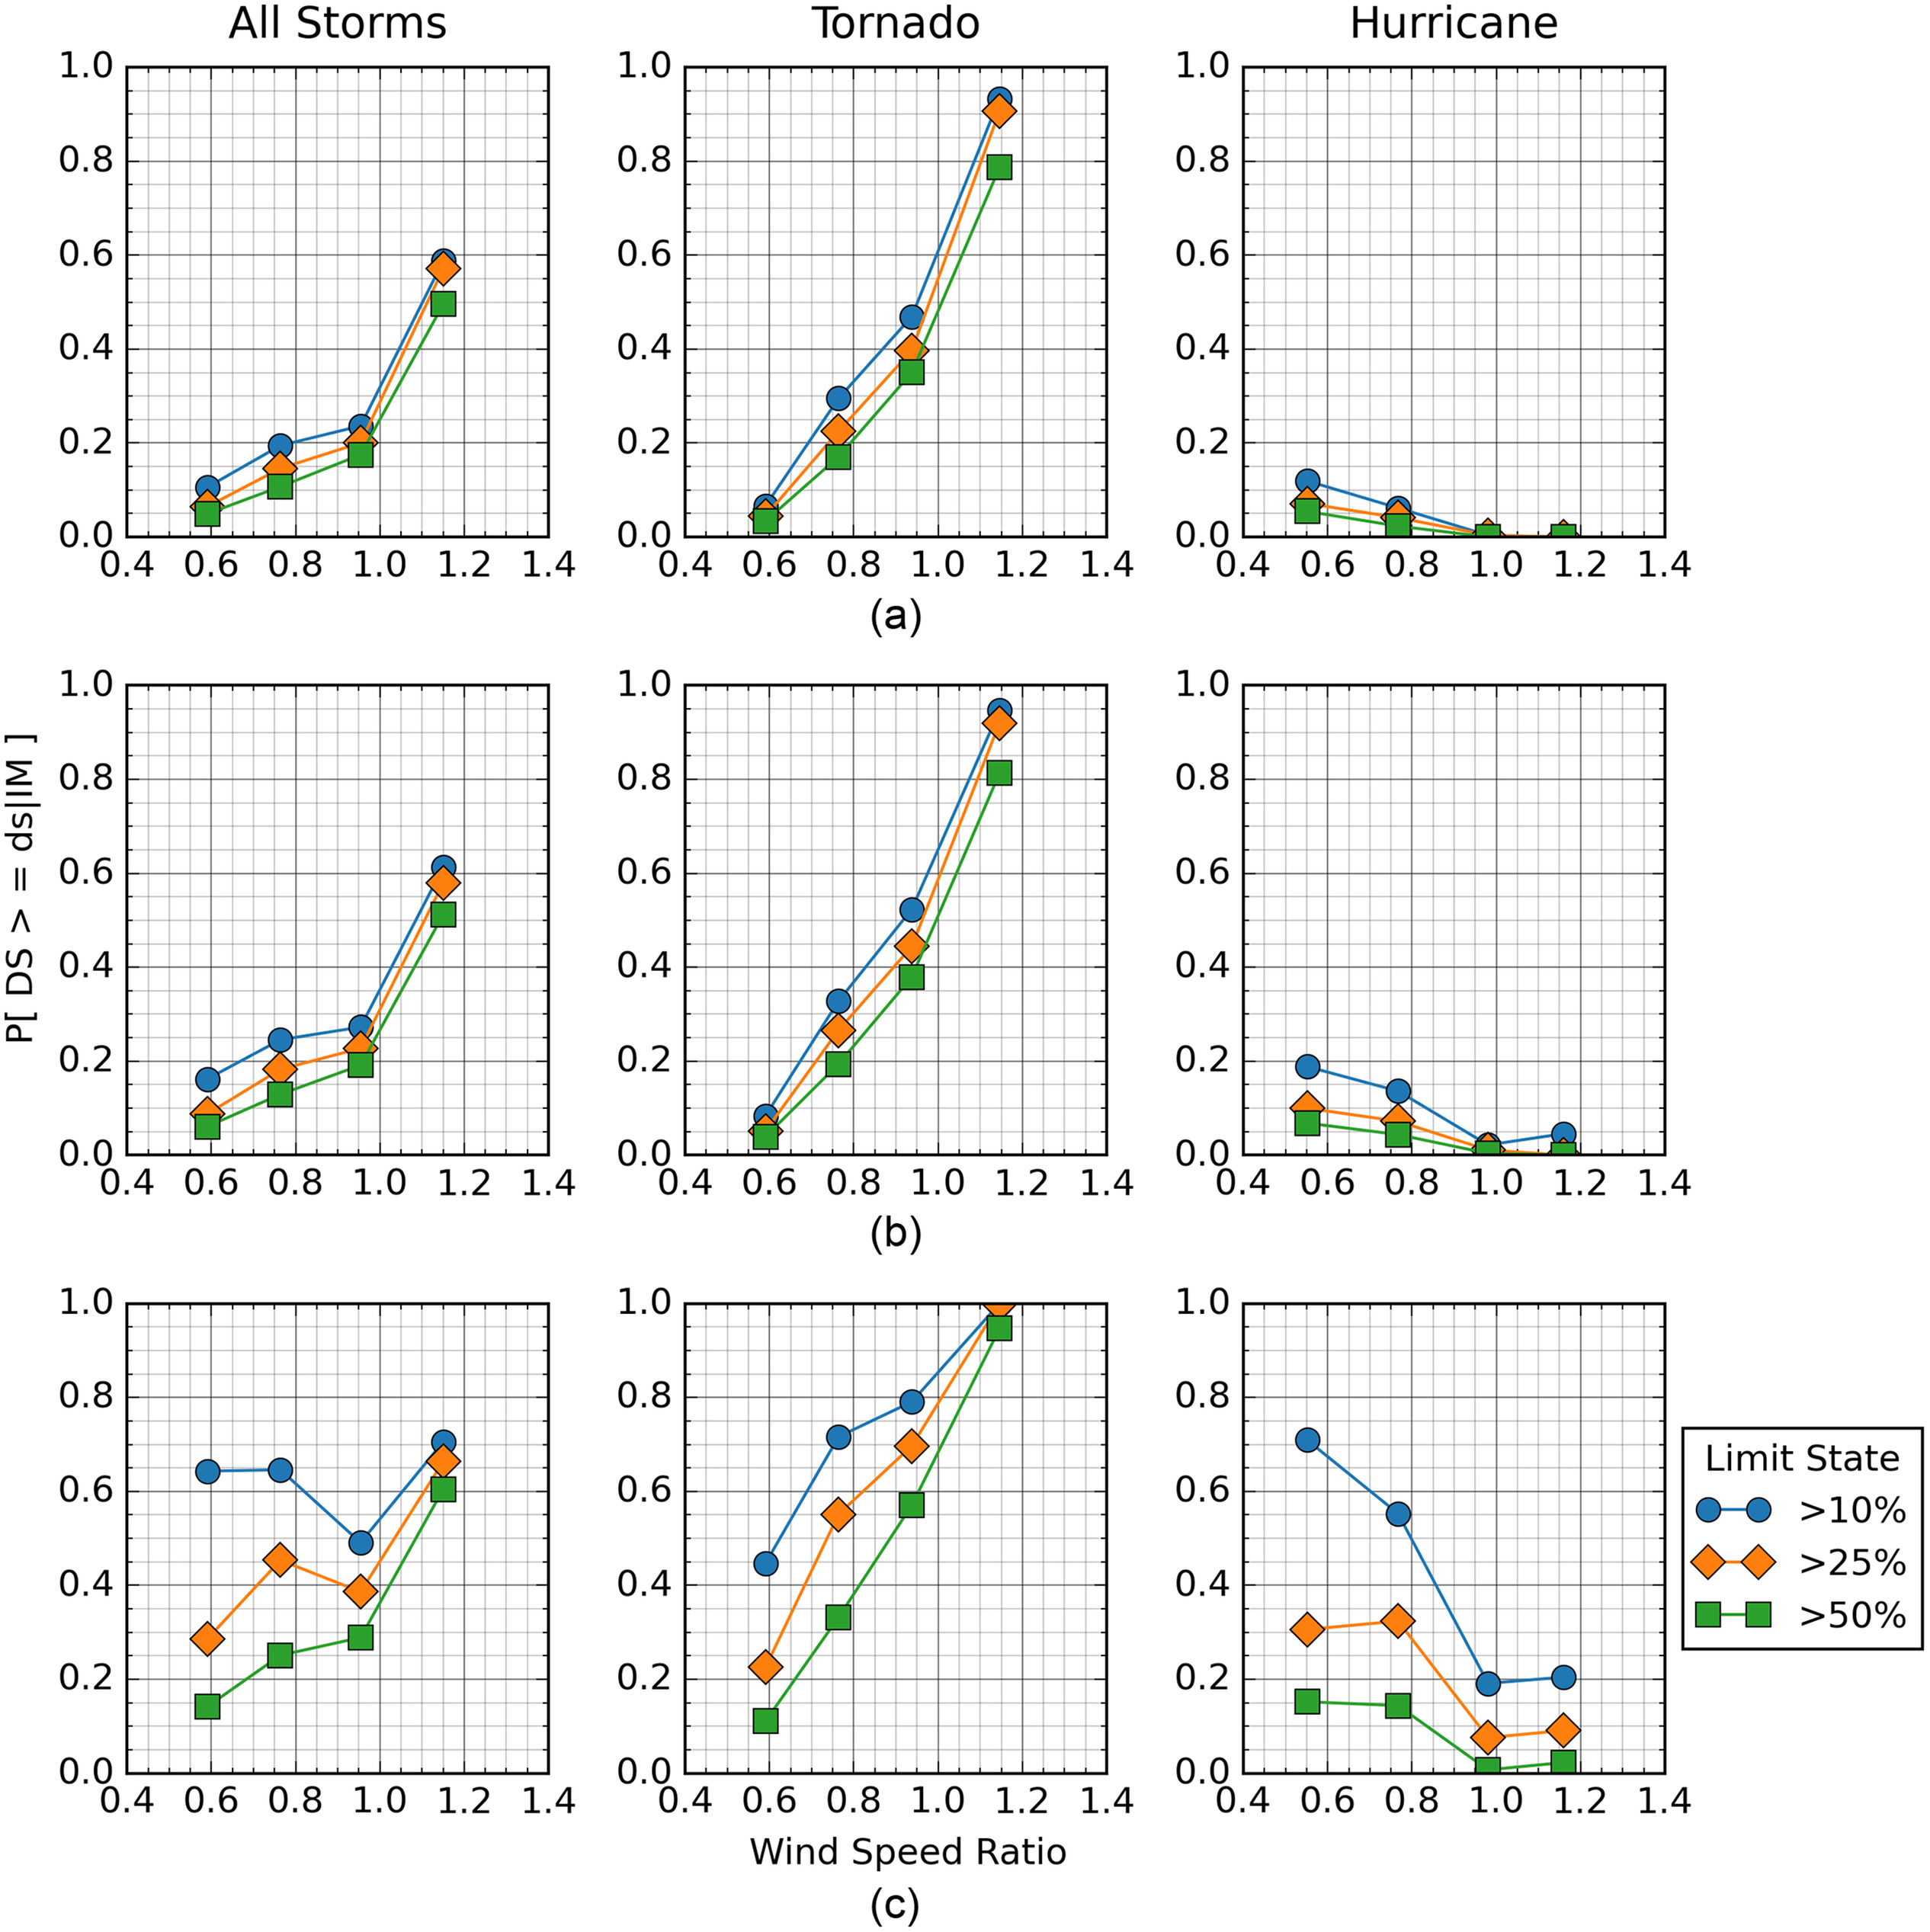
The fundamental relationship between observed damage and wind hazard intensity is presented in Figs. 13–16 as the probability of the CLDP for each building component exceeding limit states of 10%, 25%, and 50% within binned wind speed ranges for (1) all storms, (2) tornadoes only, and (3) hurricanes only. These essentially define the empirical fragility of single-family residences for the limit states defined here, given in equation form as follows:where = the CLDP for a given component, ; = the limit state; = the intensity measure associated with bin ; = the number of records that experienced wind speeds matching those of and were assigned a CLDP for component that met or exceeded ; and = the number of records that experienced wind speeds matching those of .
(2)
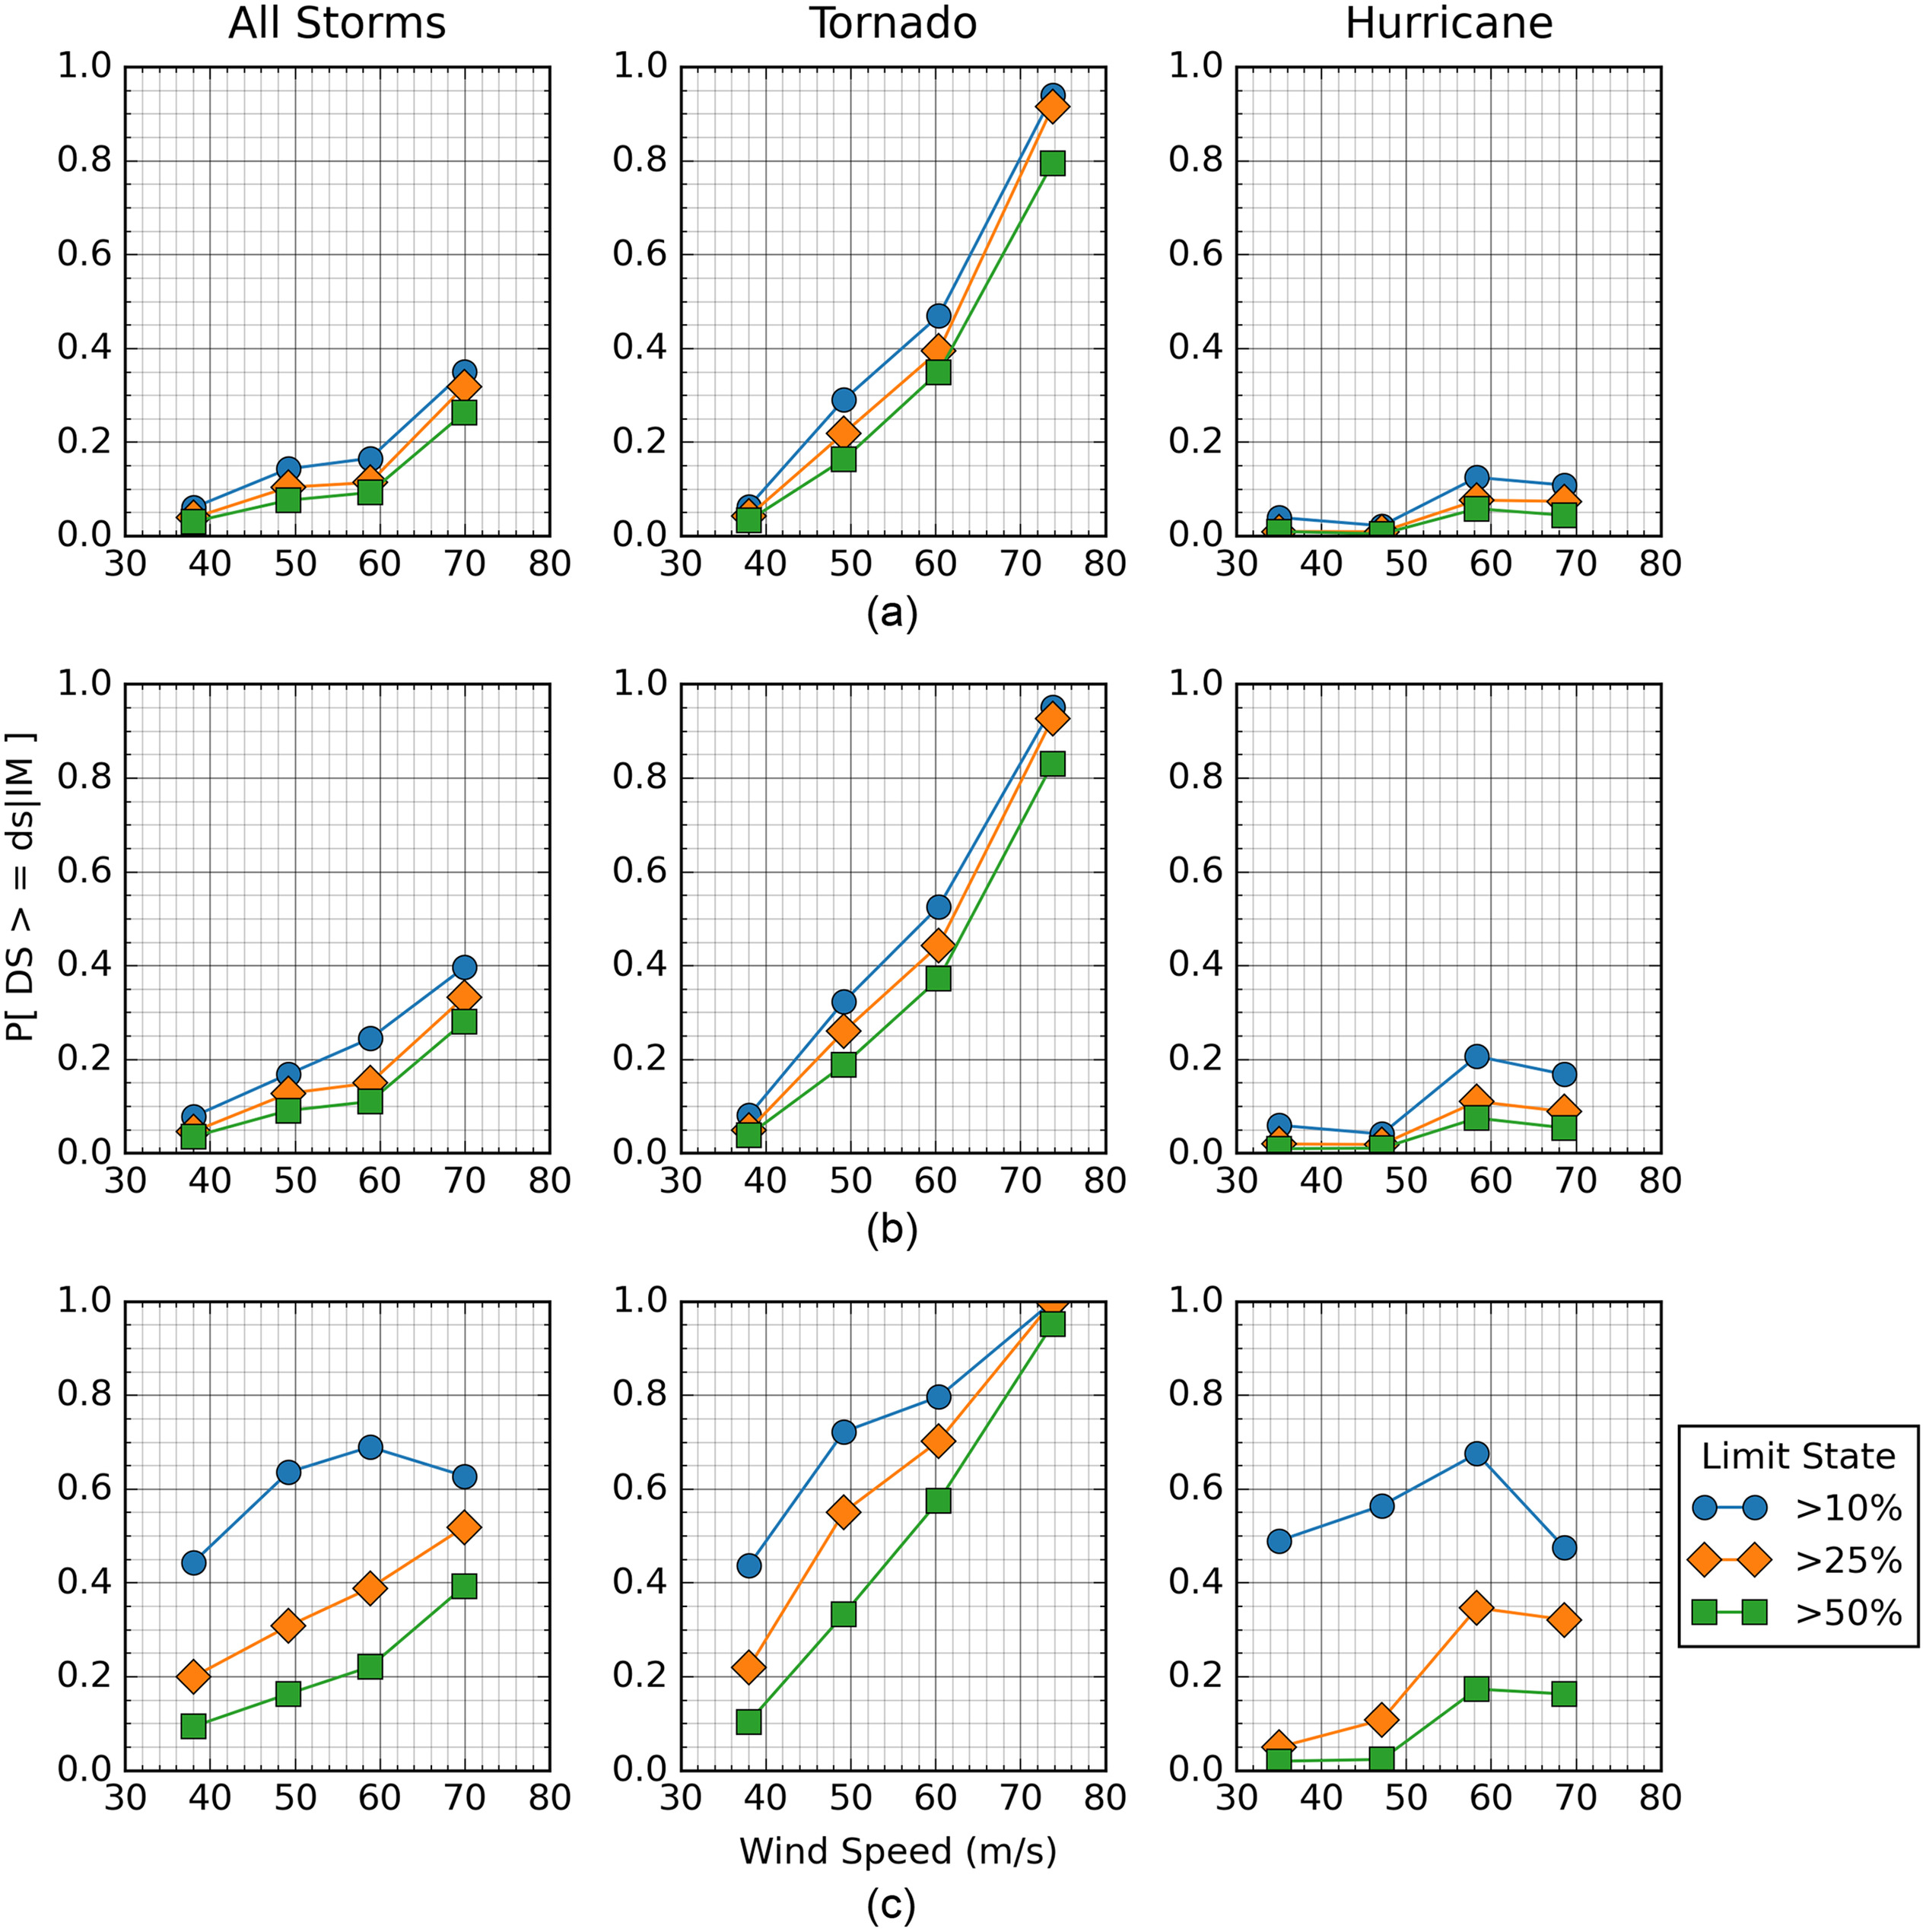
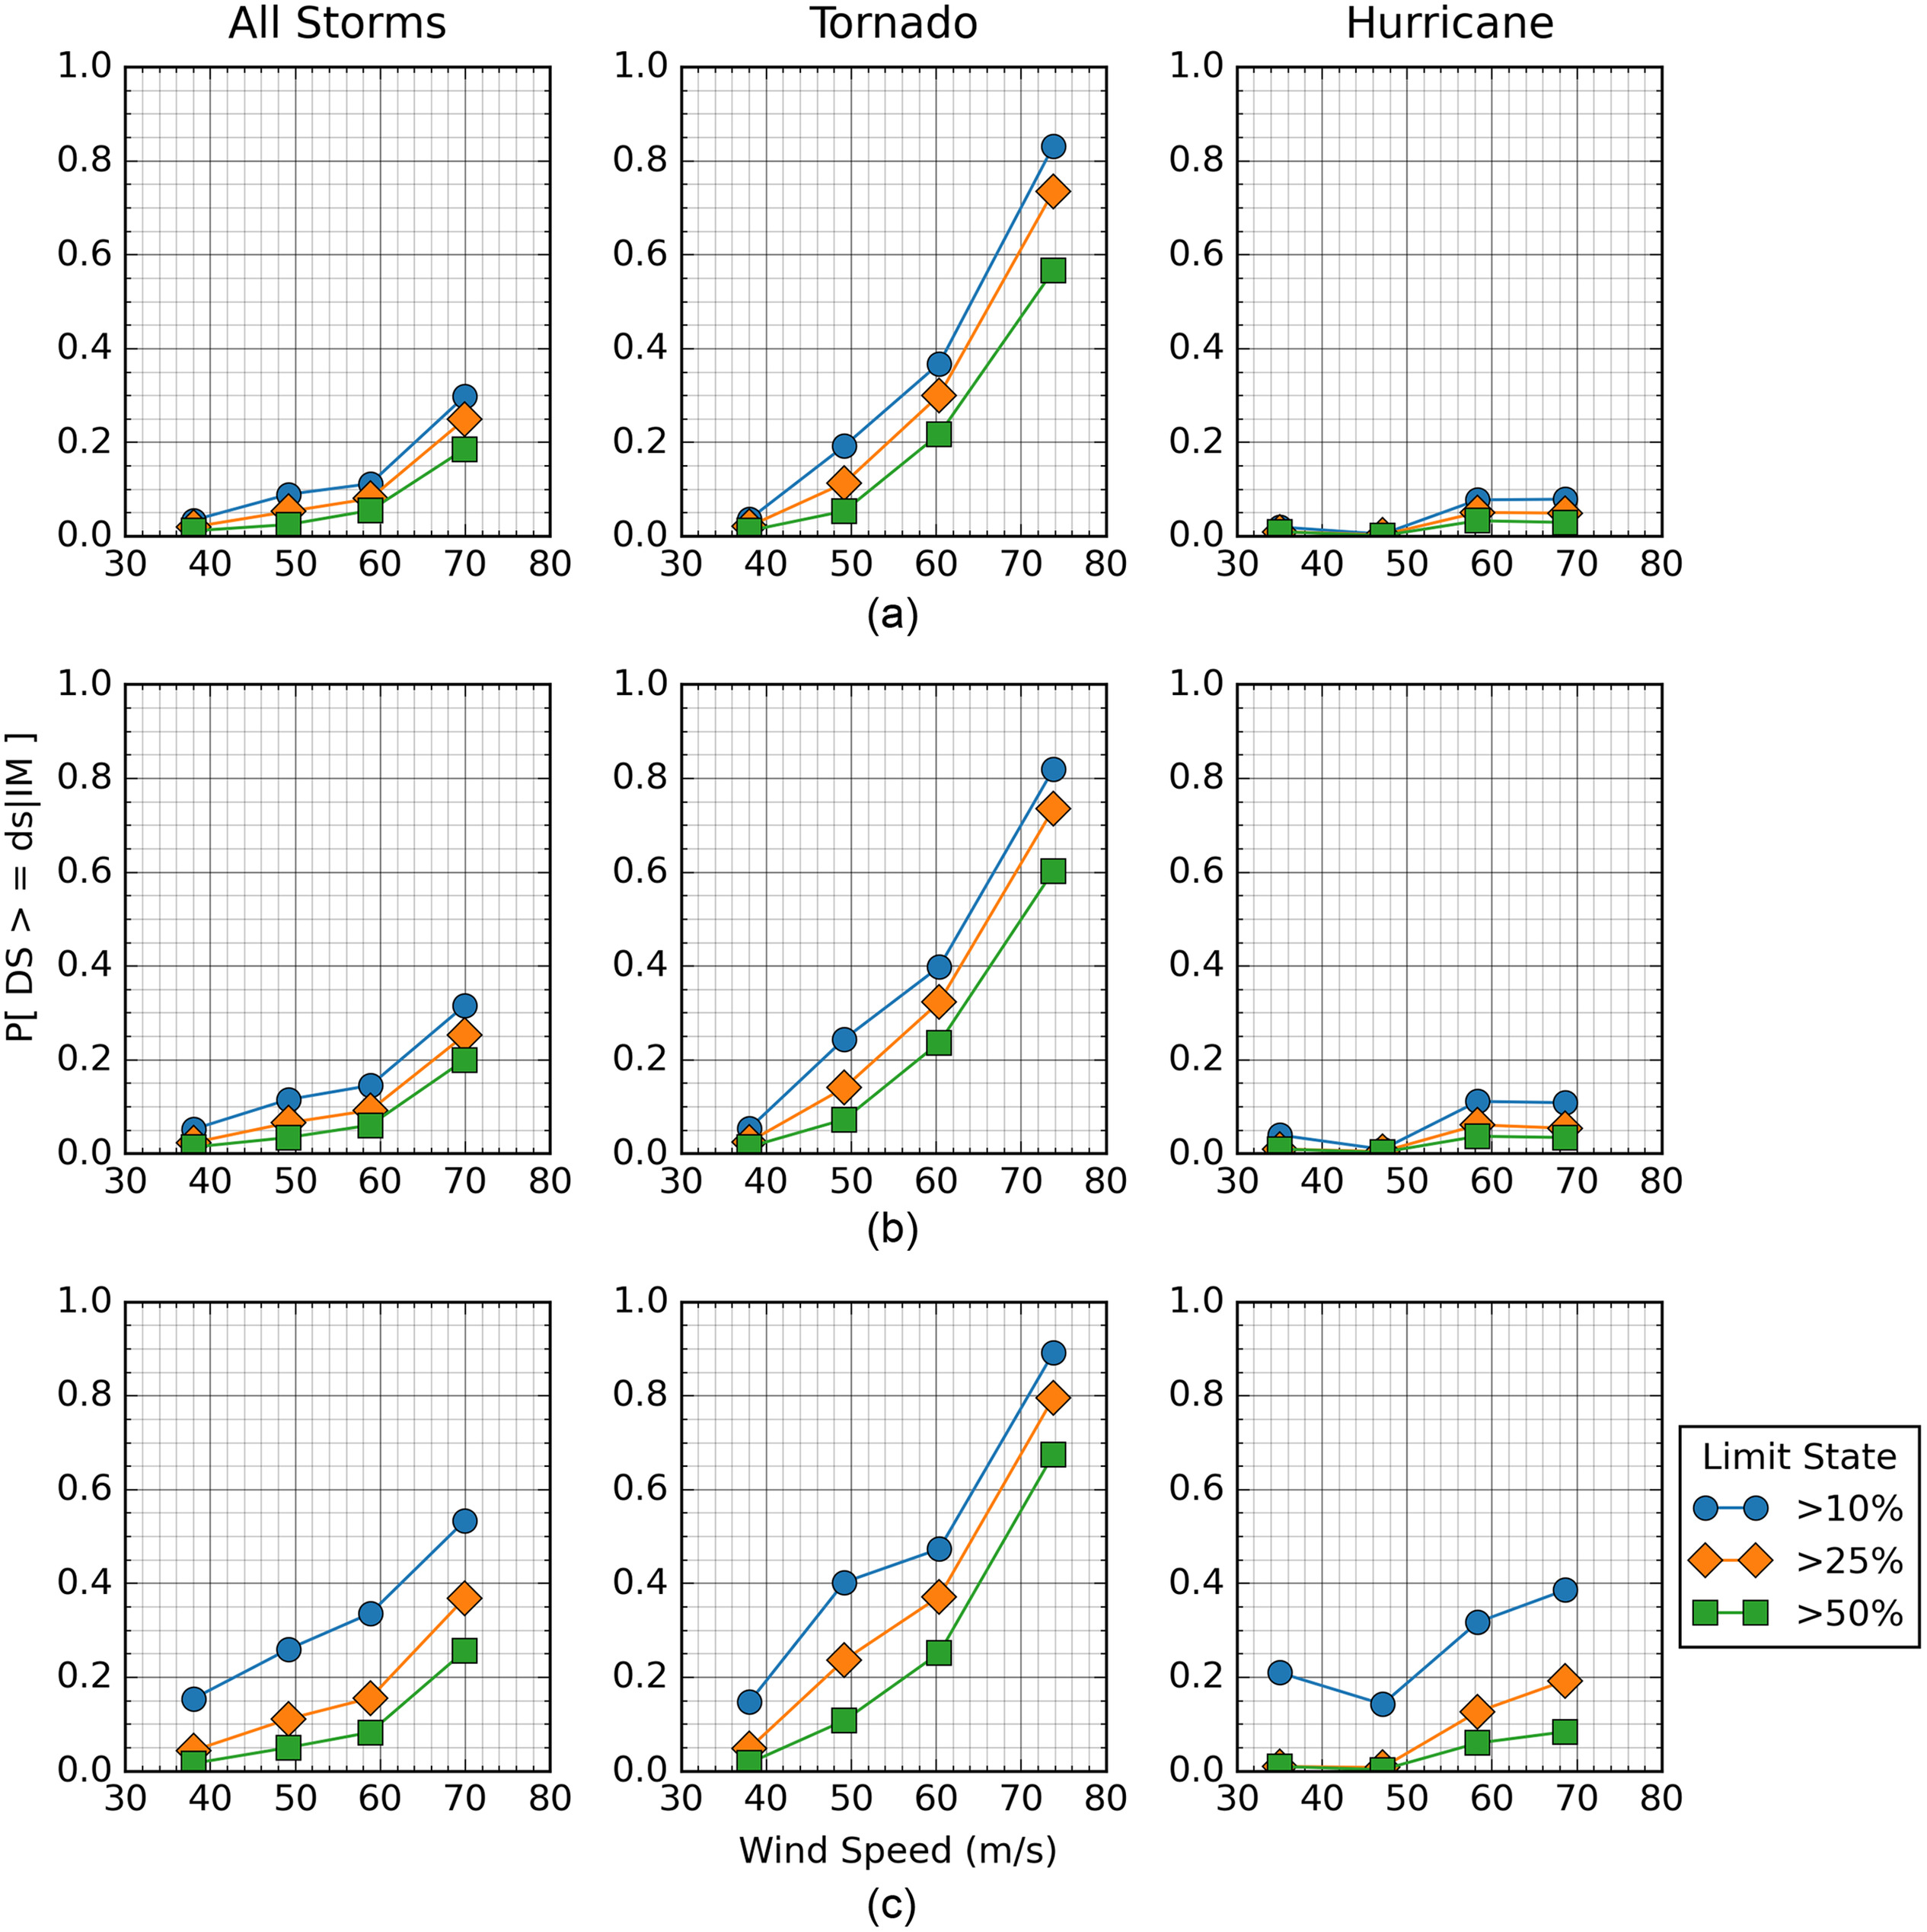
Overall, the empirical fragility functions conditioned on estimated peak wind speed are reasonably well-behaved, with most being monotonic, and all (as expected) exhibiting lower probabilities of being in higher damage states for a given wind speed (Figs. 13–17). Homes impacted by hurricanes consistently had lower probability of experiencing damage under equivalent wind speeds relative to those impacted by tornadoes. At equivalent wind speeds, the probability of damage to the roof system increases for homes in tornadoes relative to hurricanes (Fig. 13). For the three observed limit states (, , ), the probability of roof structure damage exceeding each limit state increases by approximately 80% for tornadoes compared with hurricanes. Similarly, the wall structure observes approximately a 50% increase in the probability of damage exceeding the limit states in tornadoes as compared with hurricanes with equivalent wind speeds. This may be a result of differences in design and construction of homes in tornado-prone regions verses hurricane-prone regions or other factors not currently quantified in this first version of the WiSPD. Interestingly, in hurricanes, the limit state probabilities for roof components are slightly lower for the highest wind speed bin in comparison with the adjacent lower wind speed bin, which may result from those homes experiencing the highest wind speeds being primarily associated with Hurricane Michael (2018), which struck in Florida, a state with a history of strong building codes.
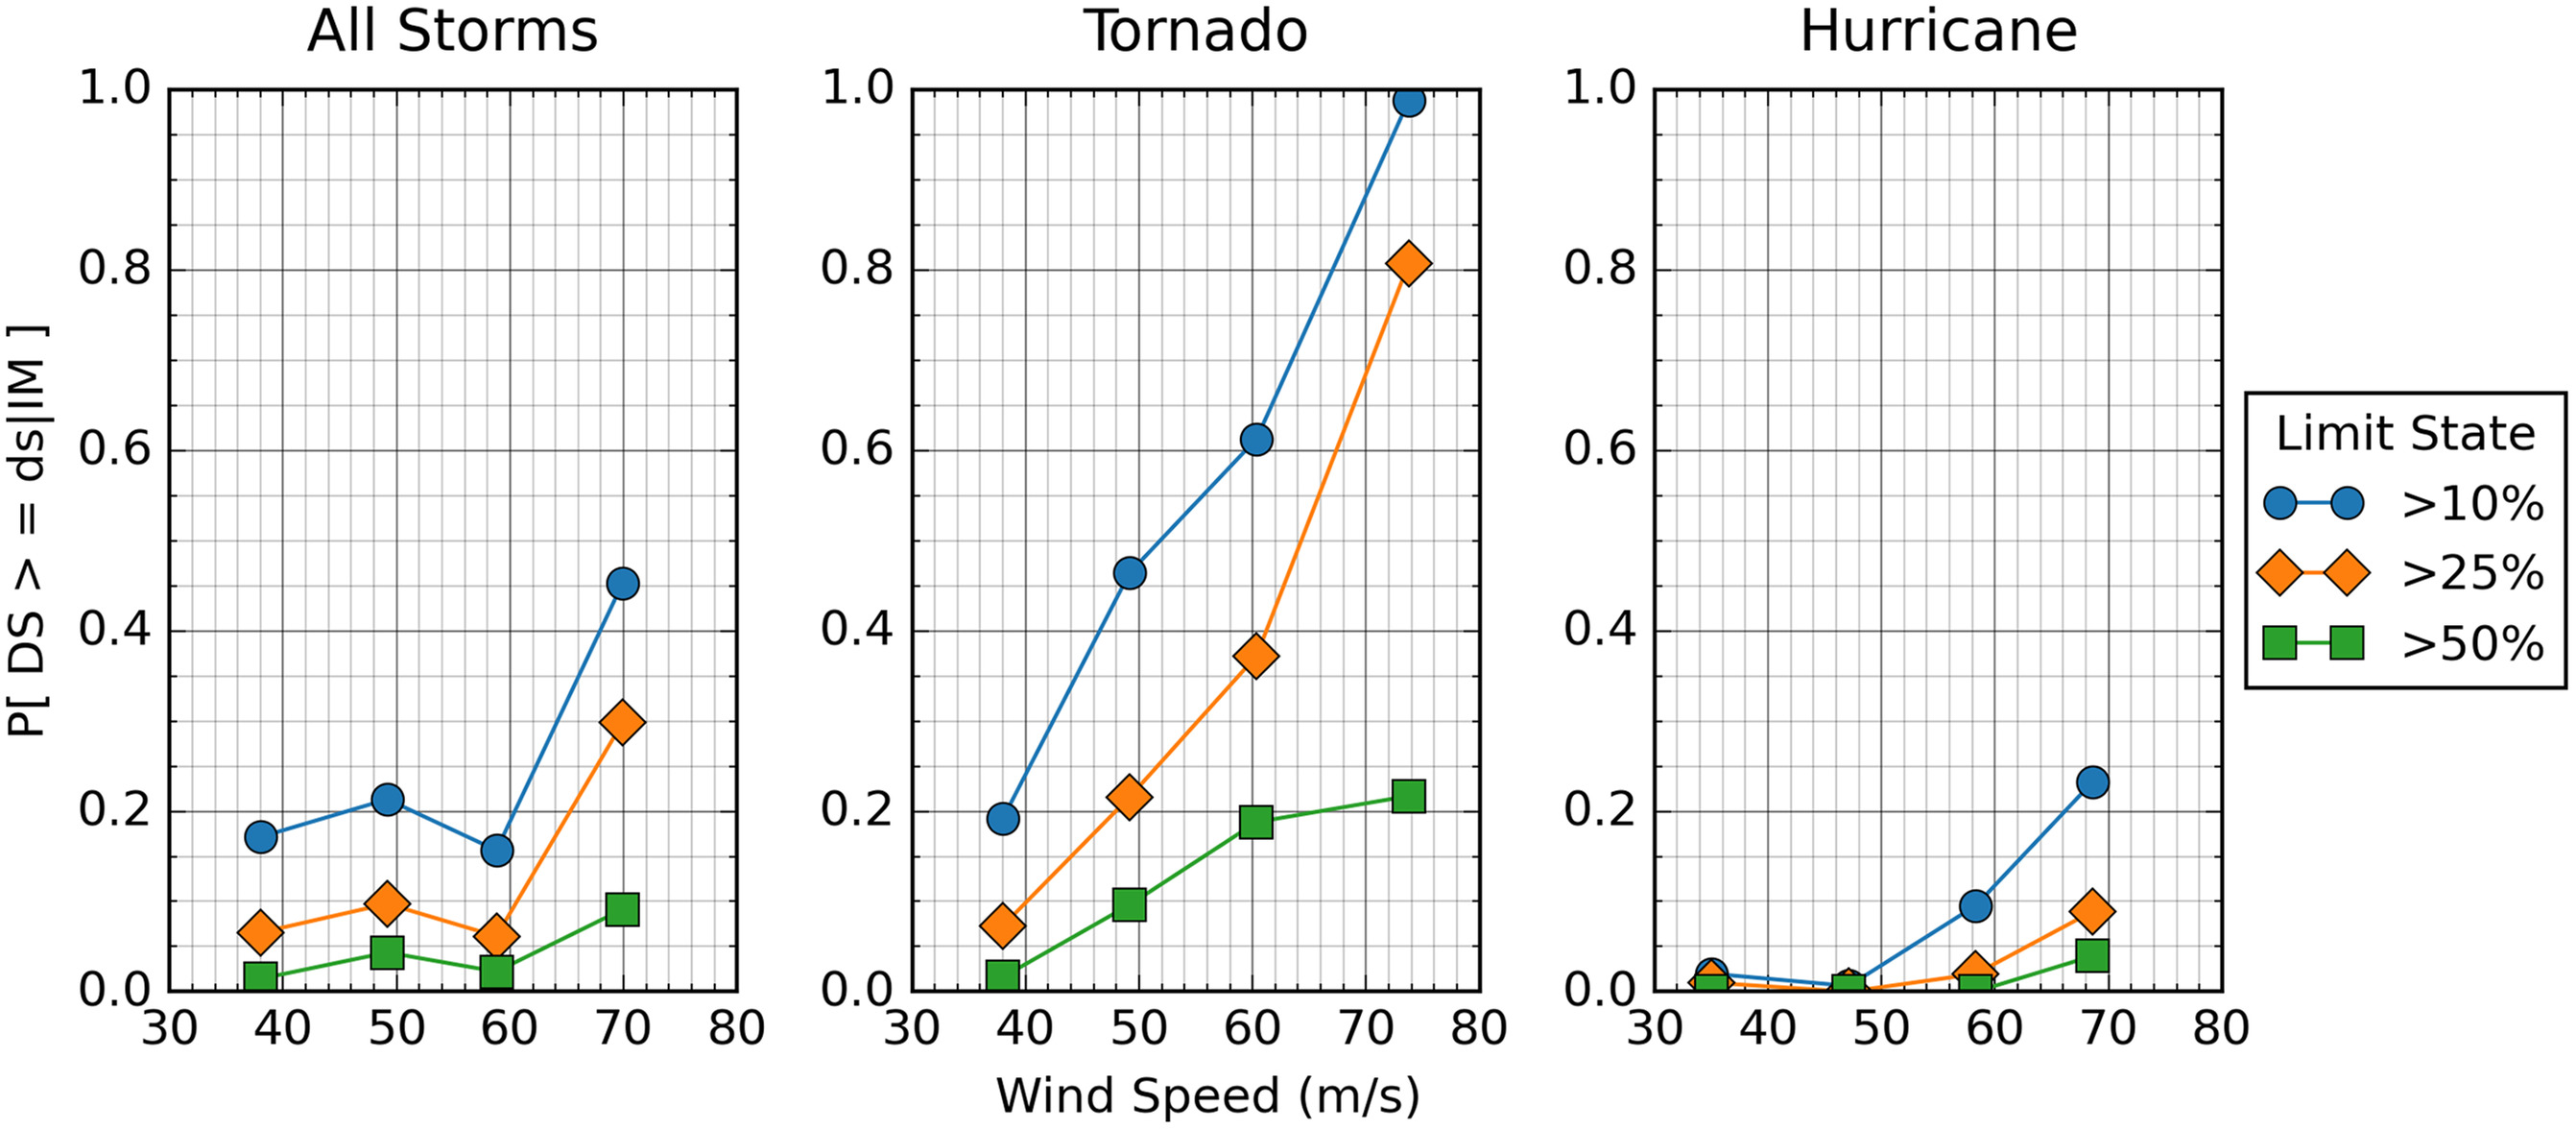
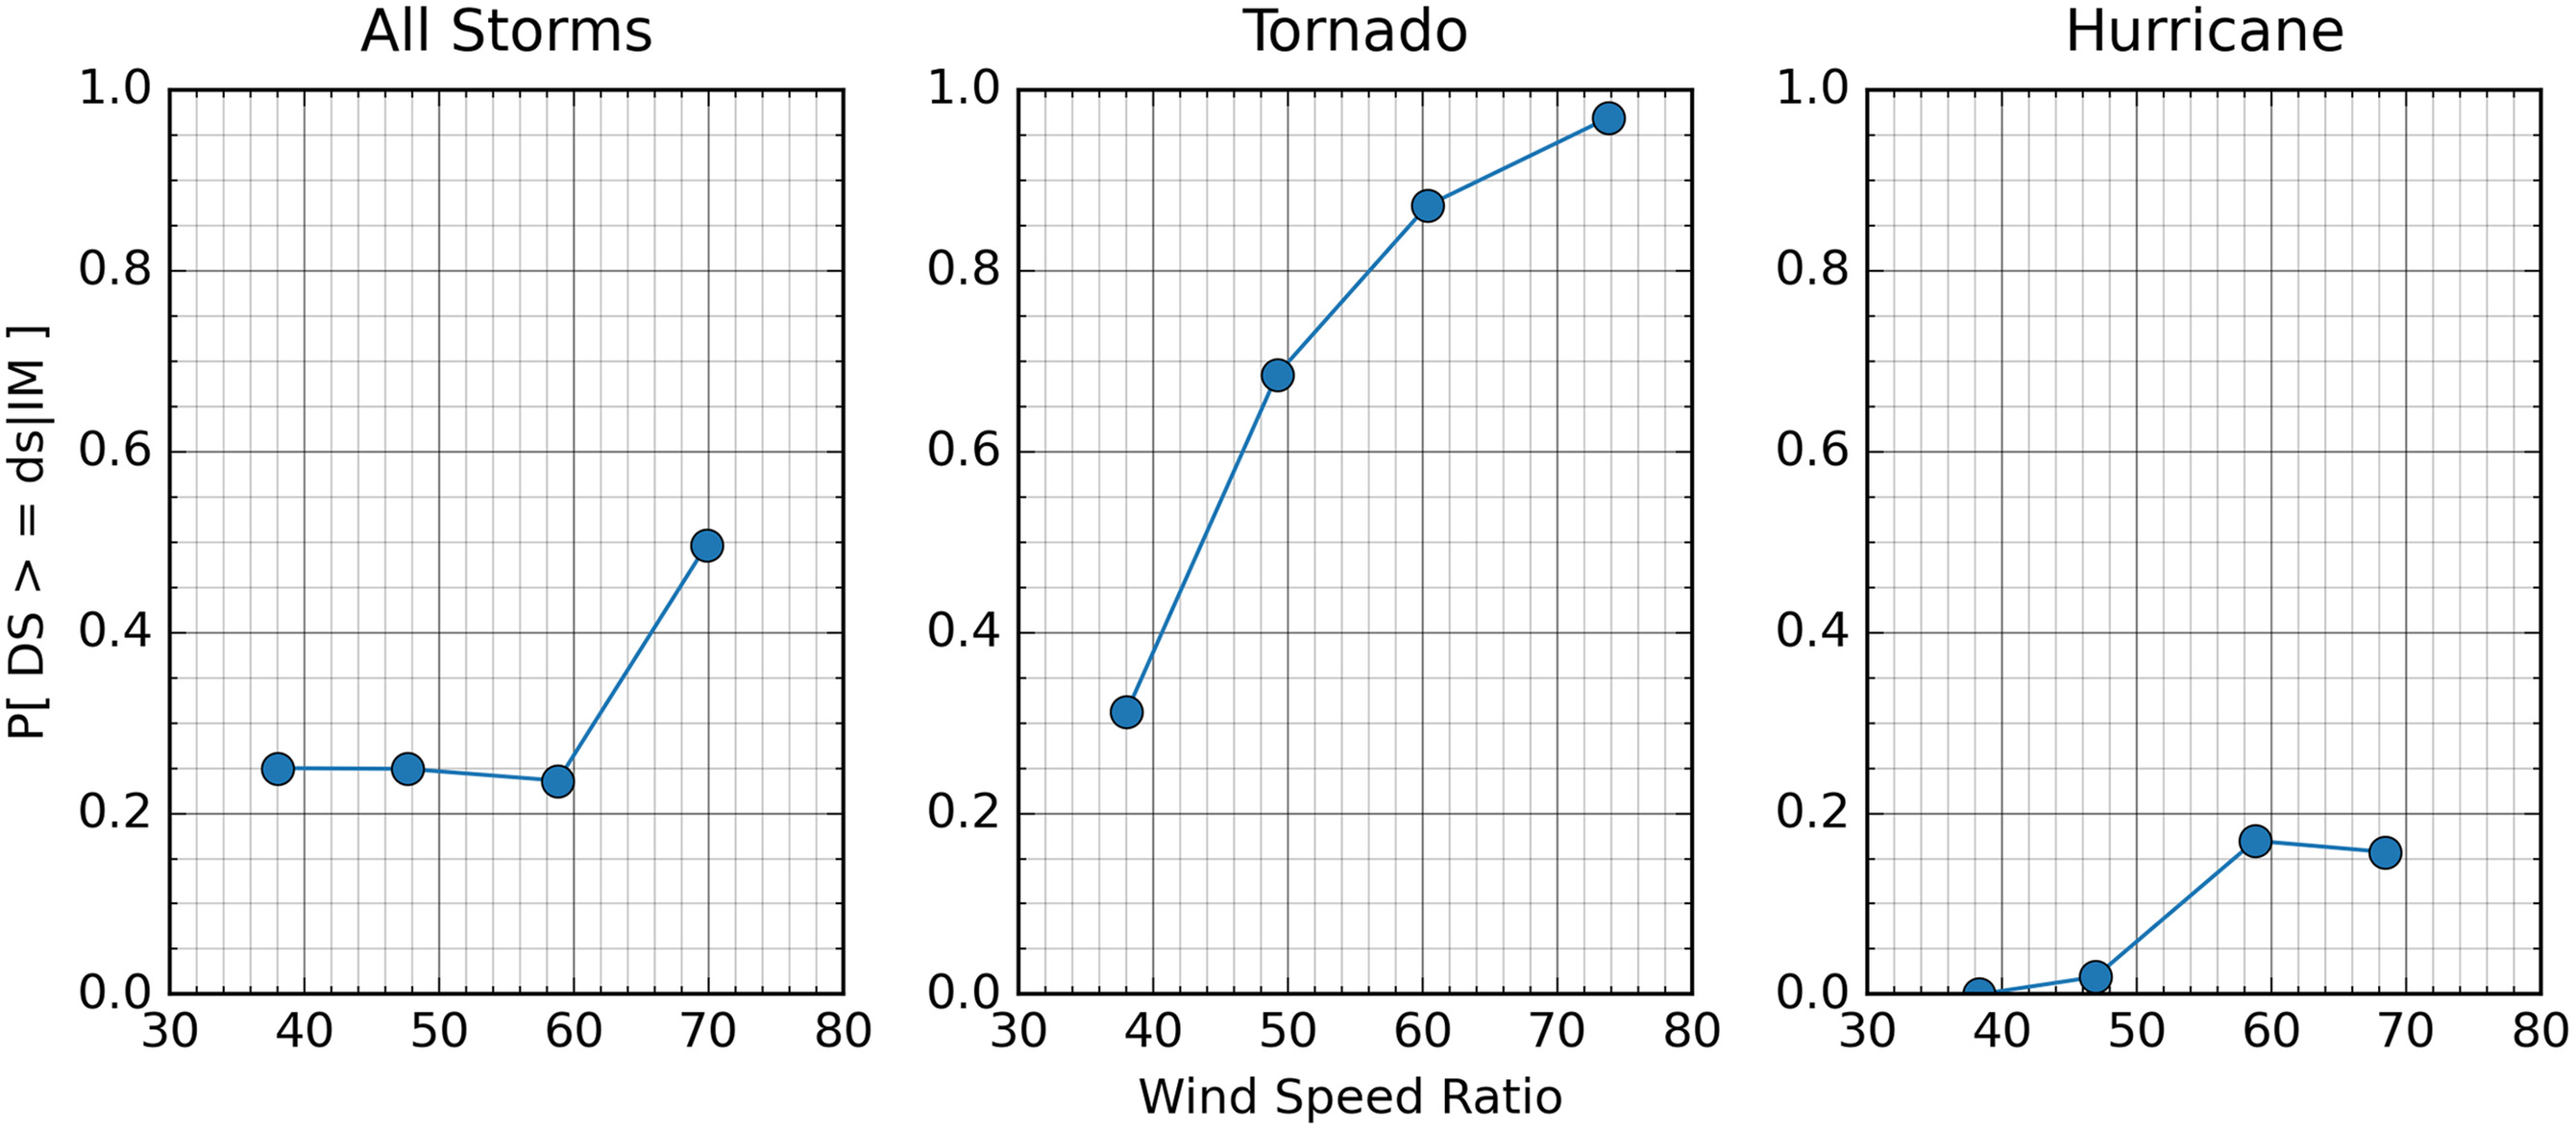
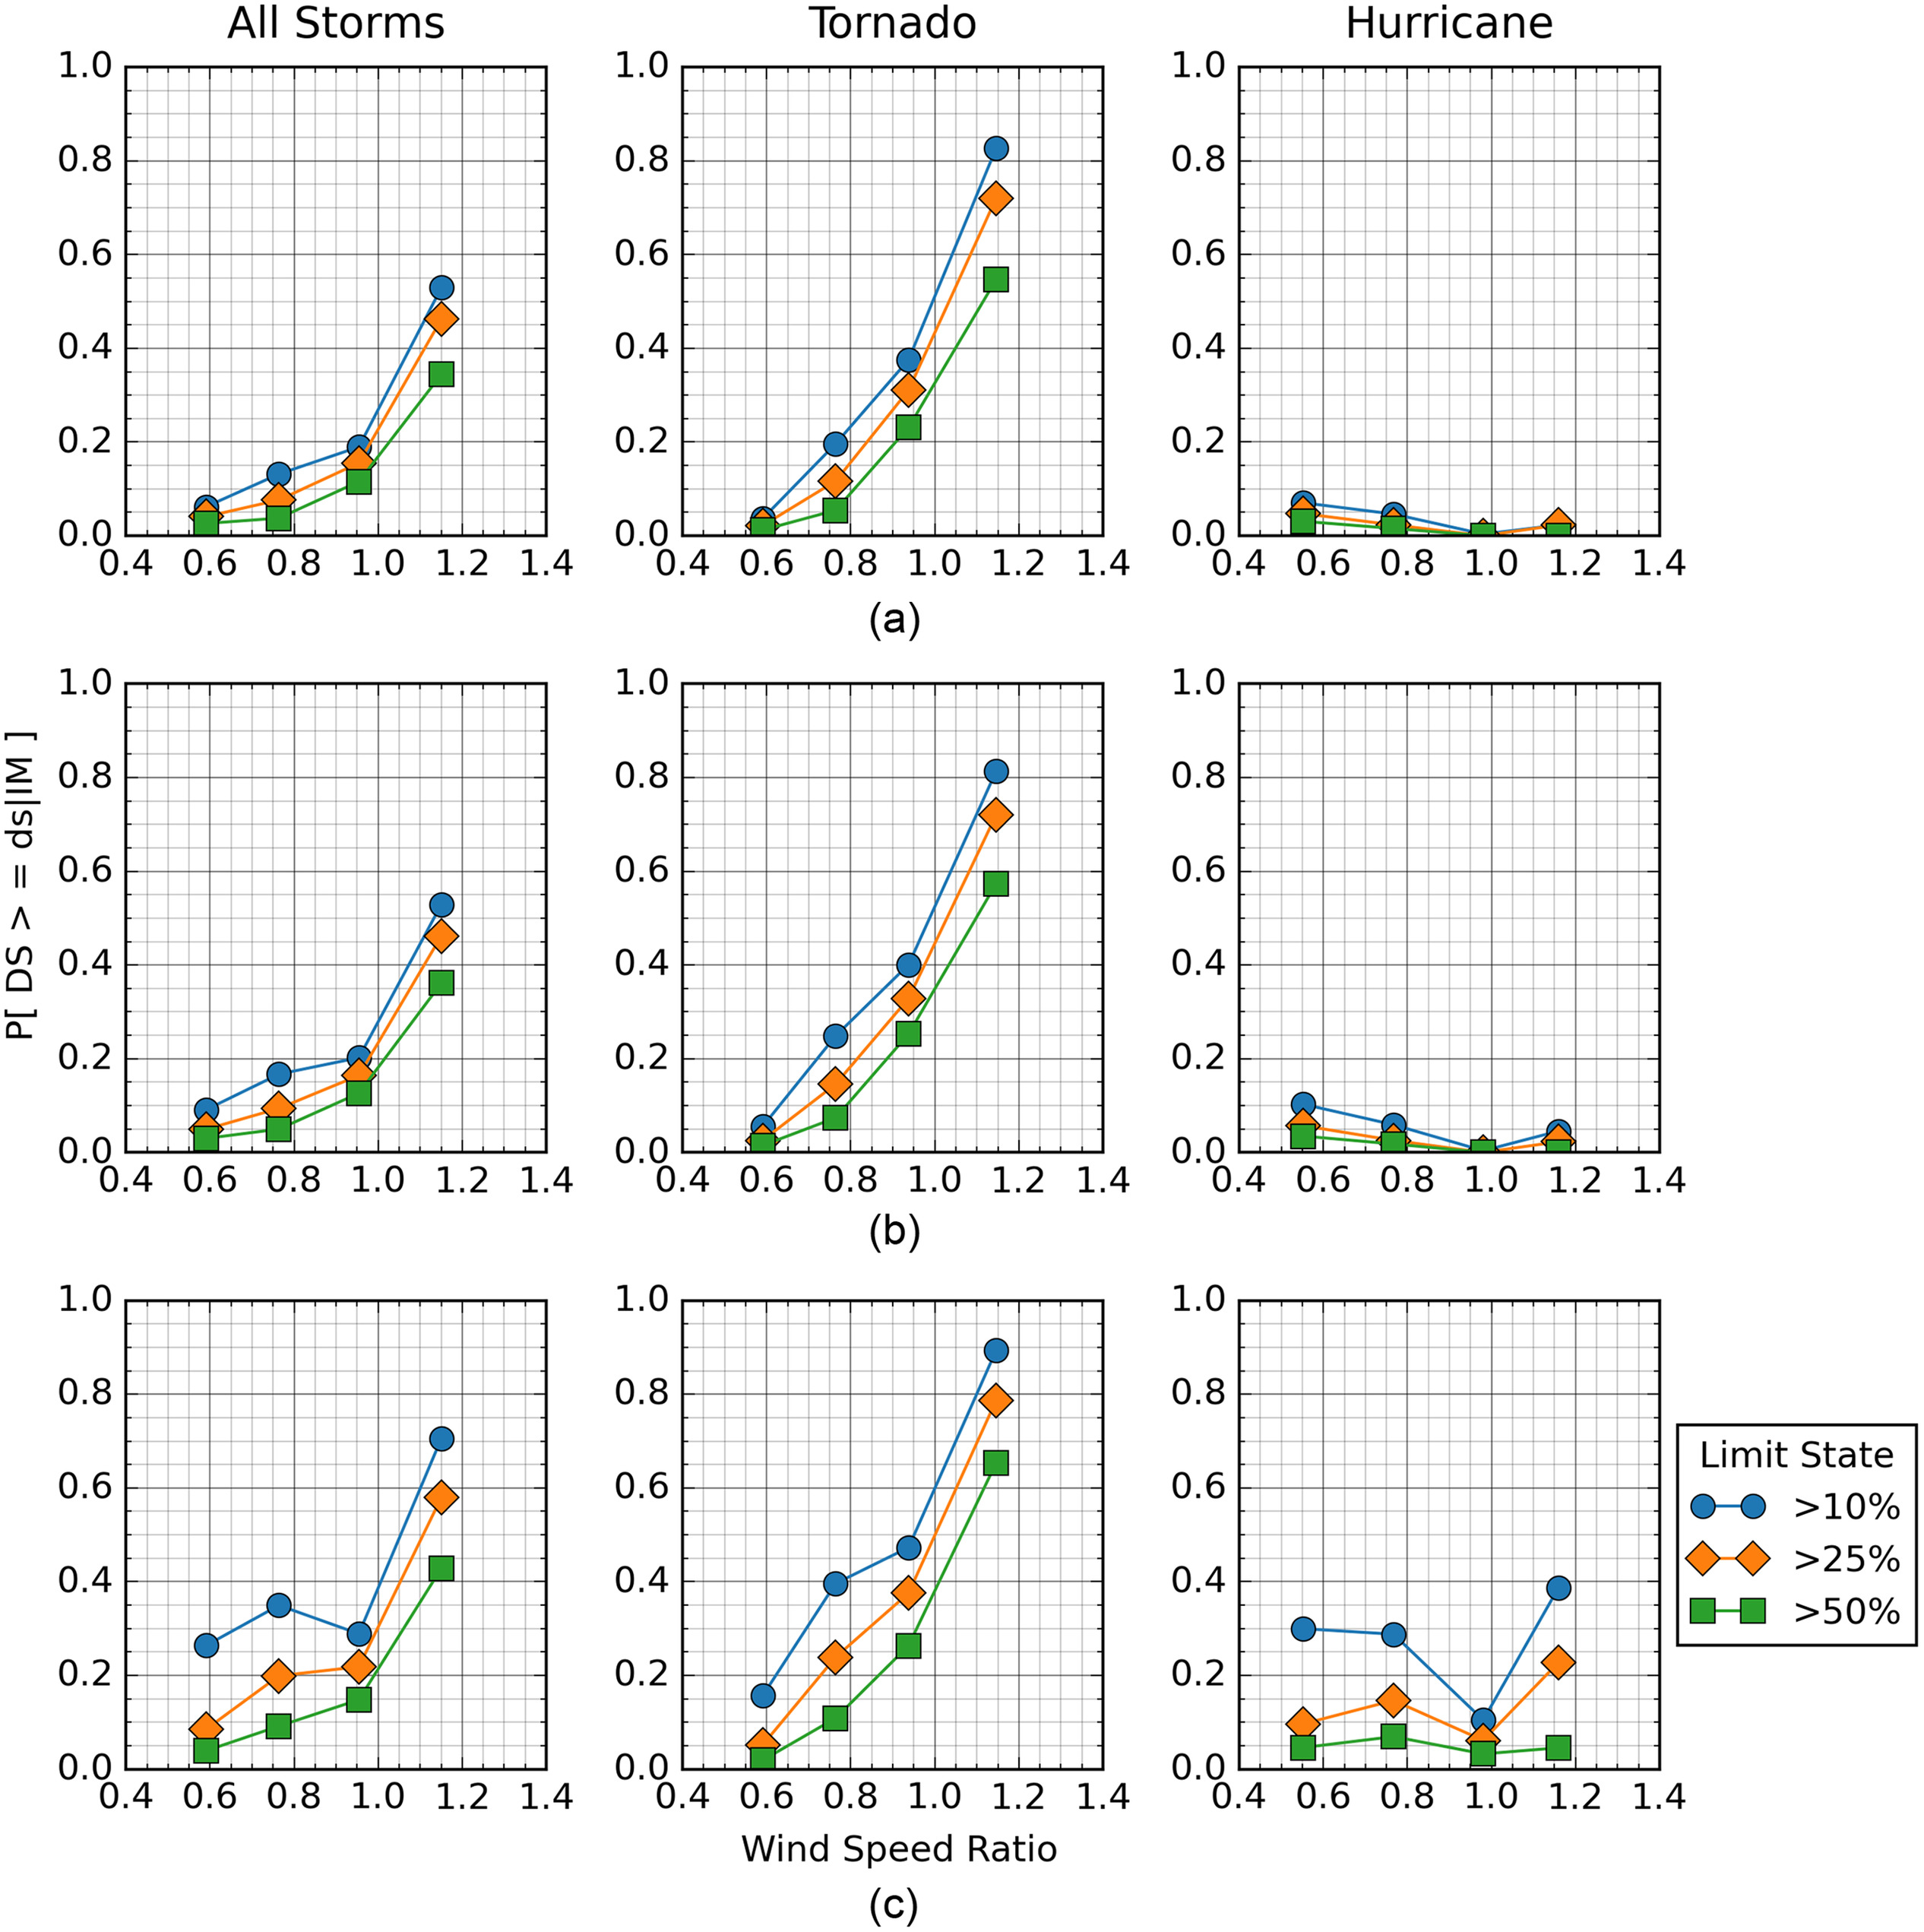
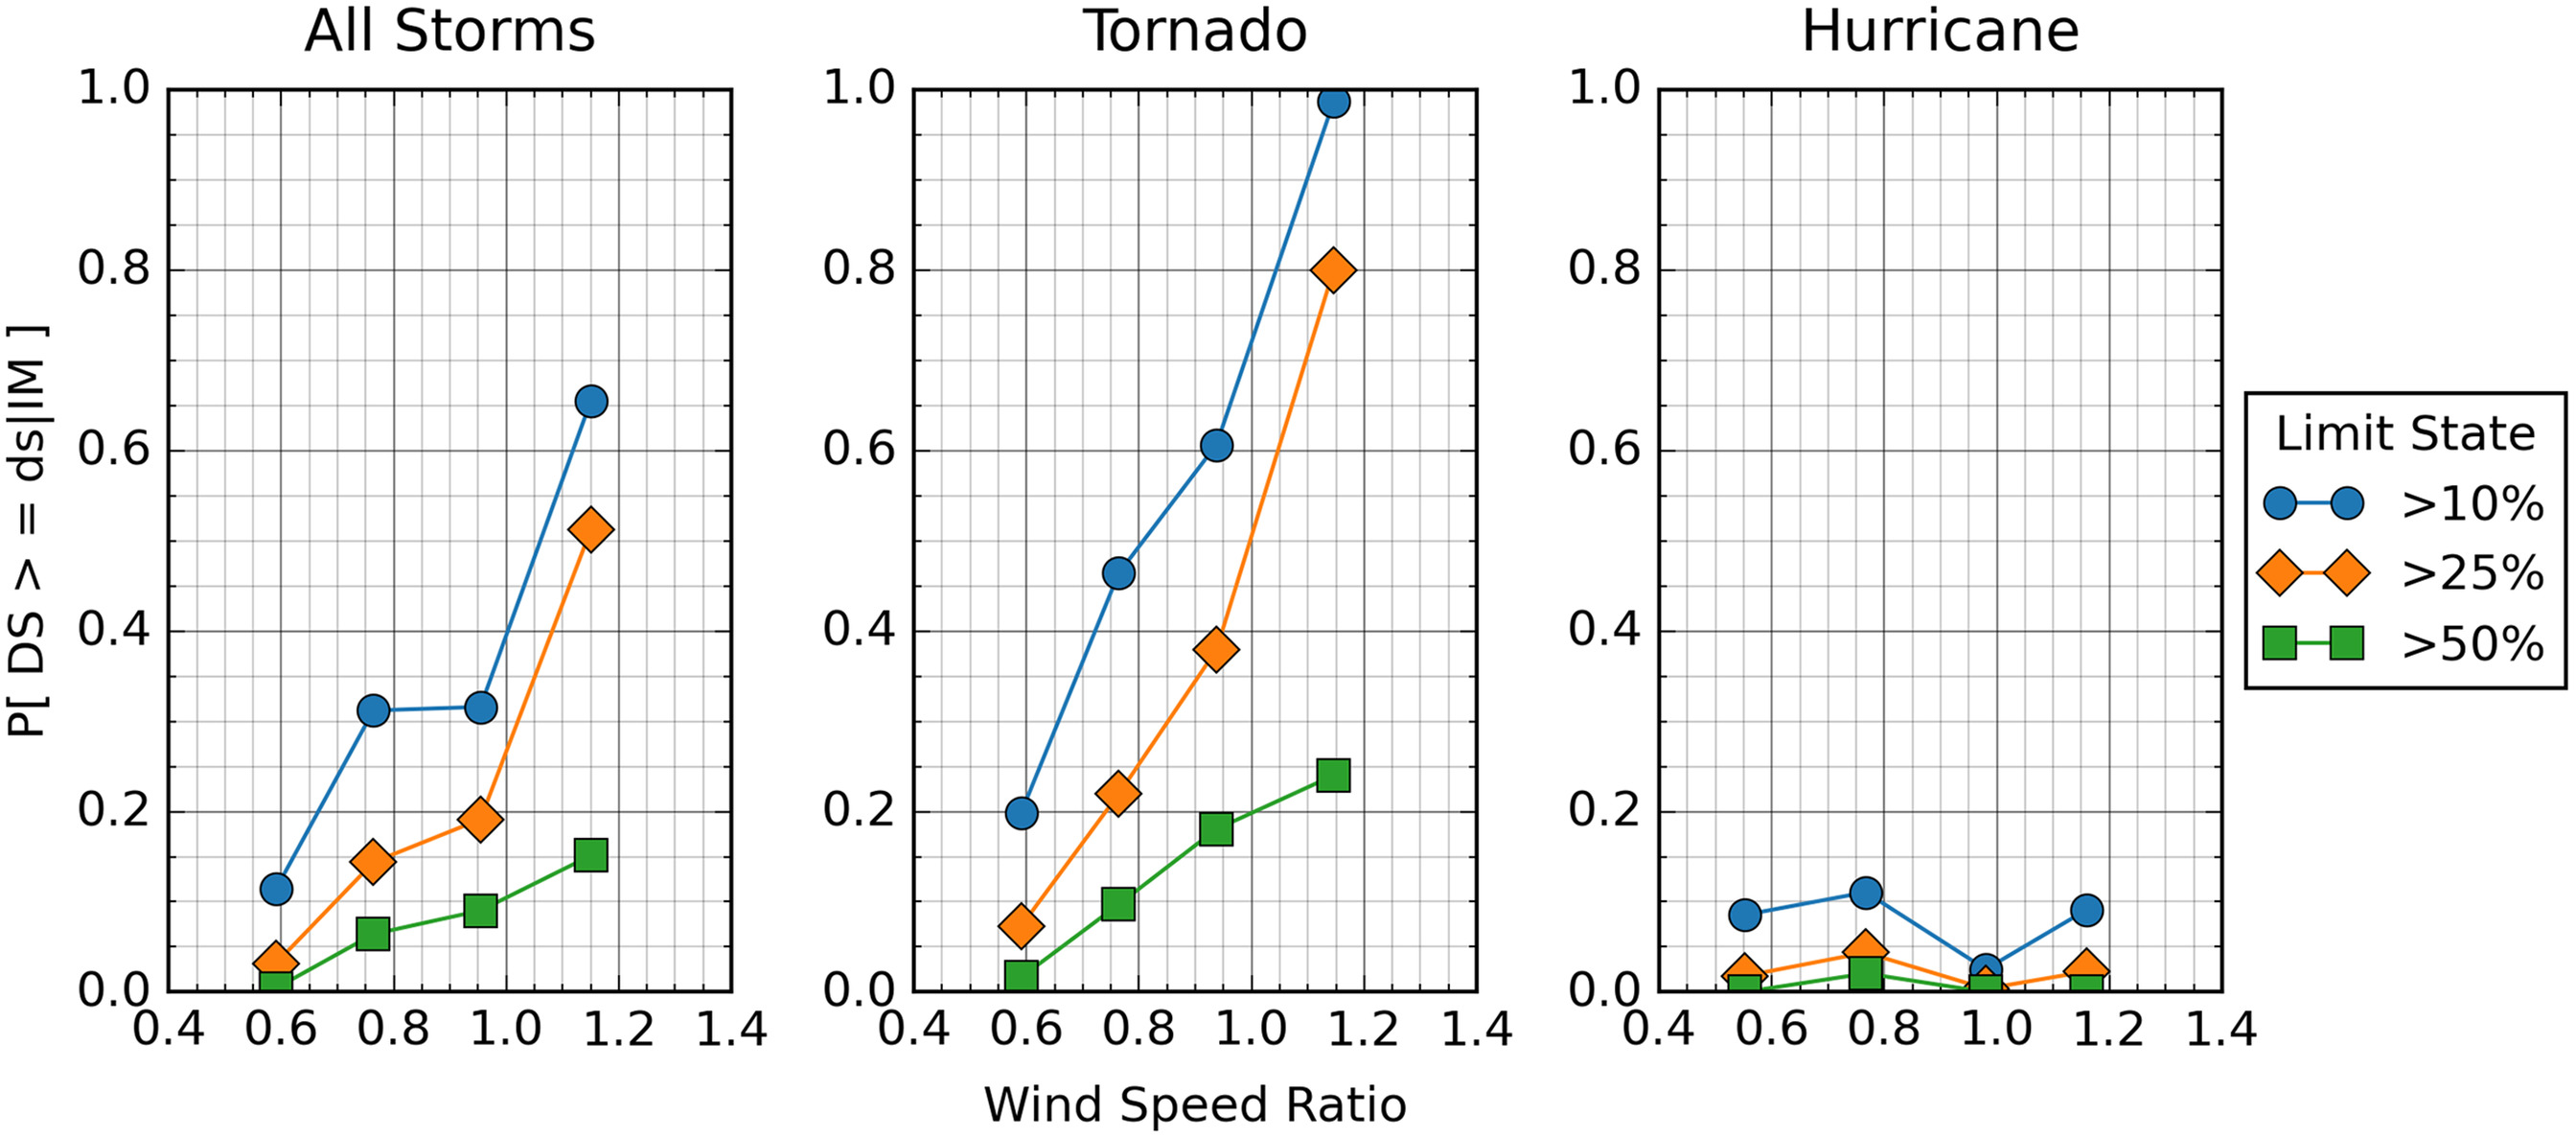
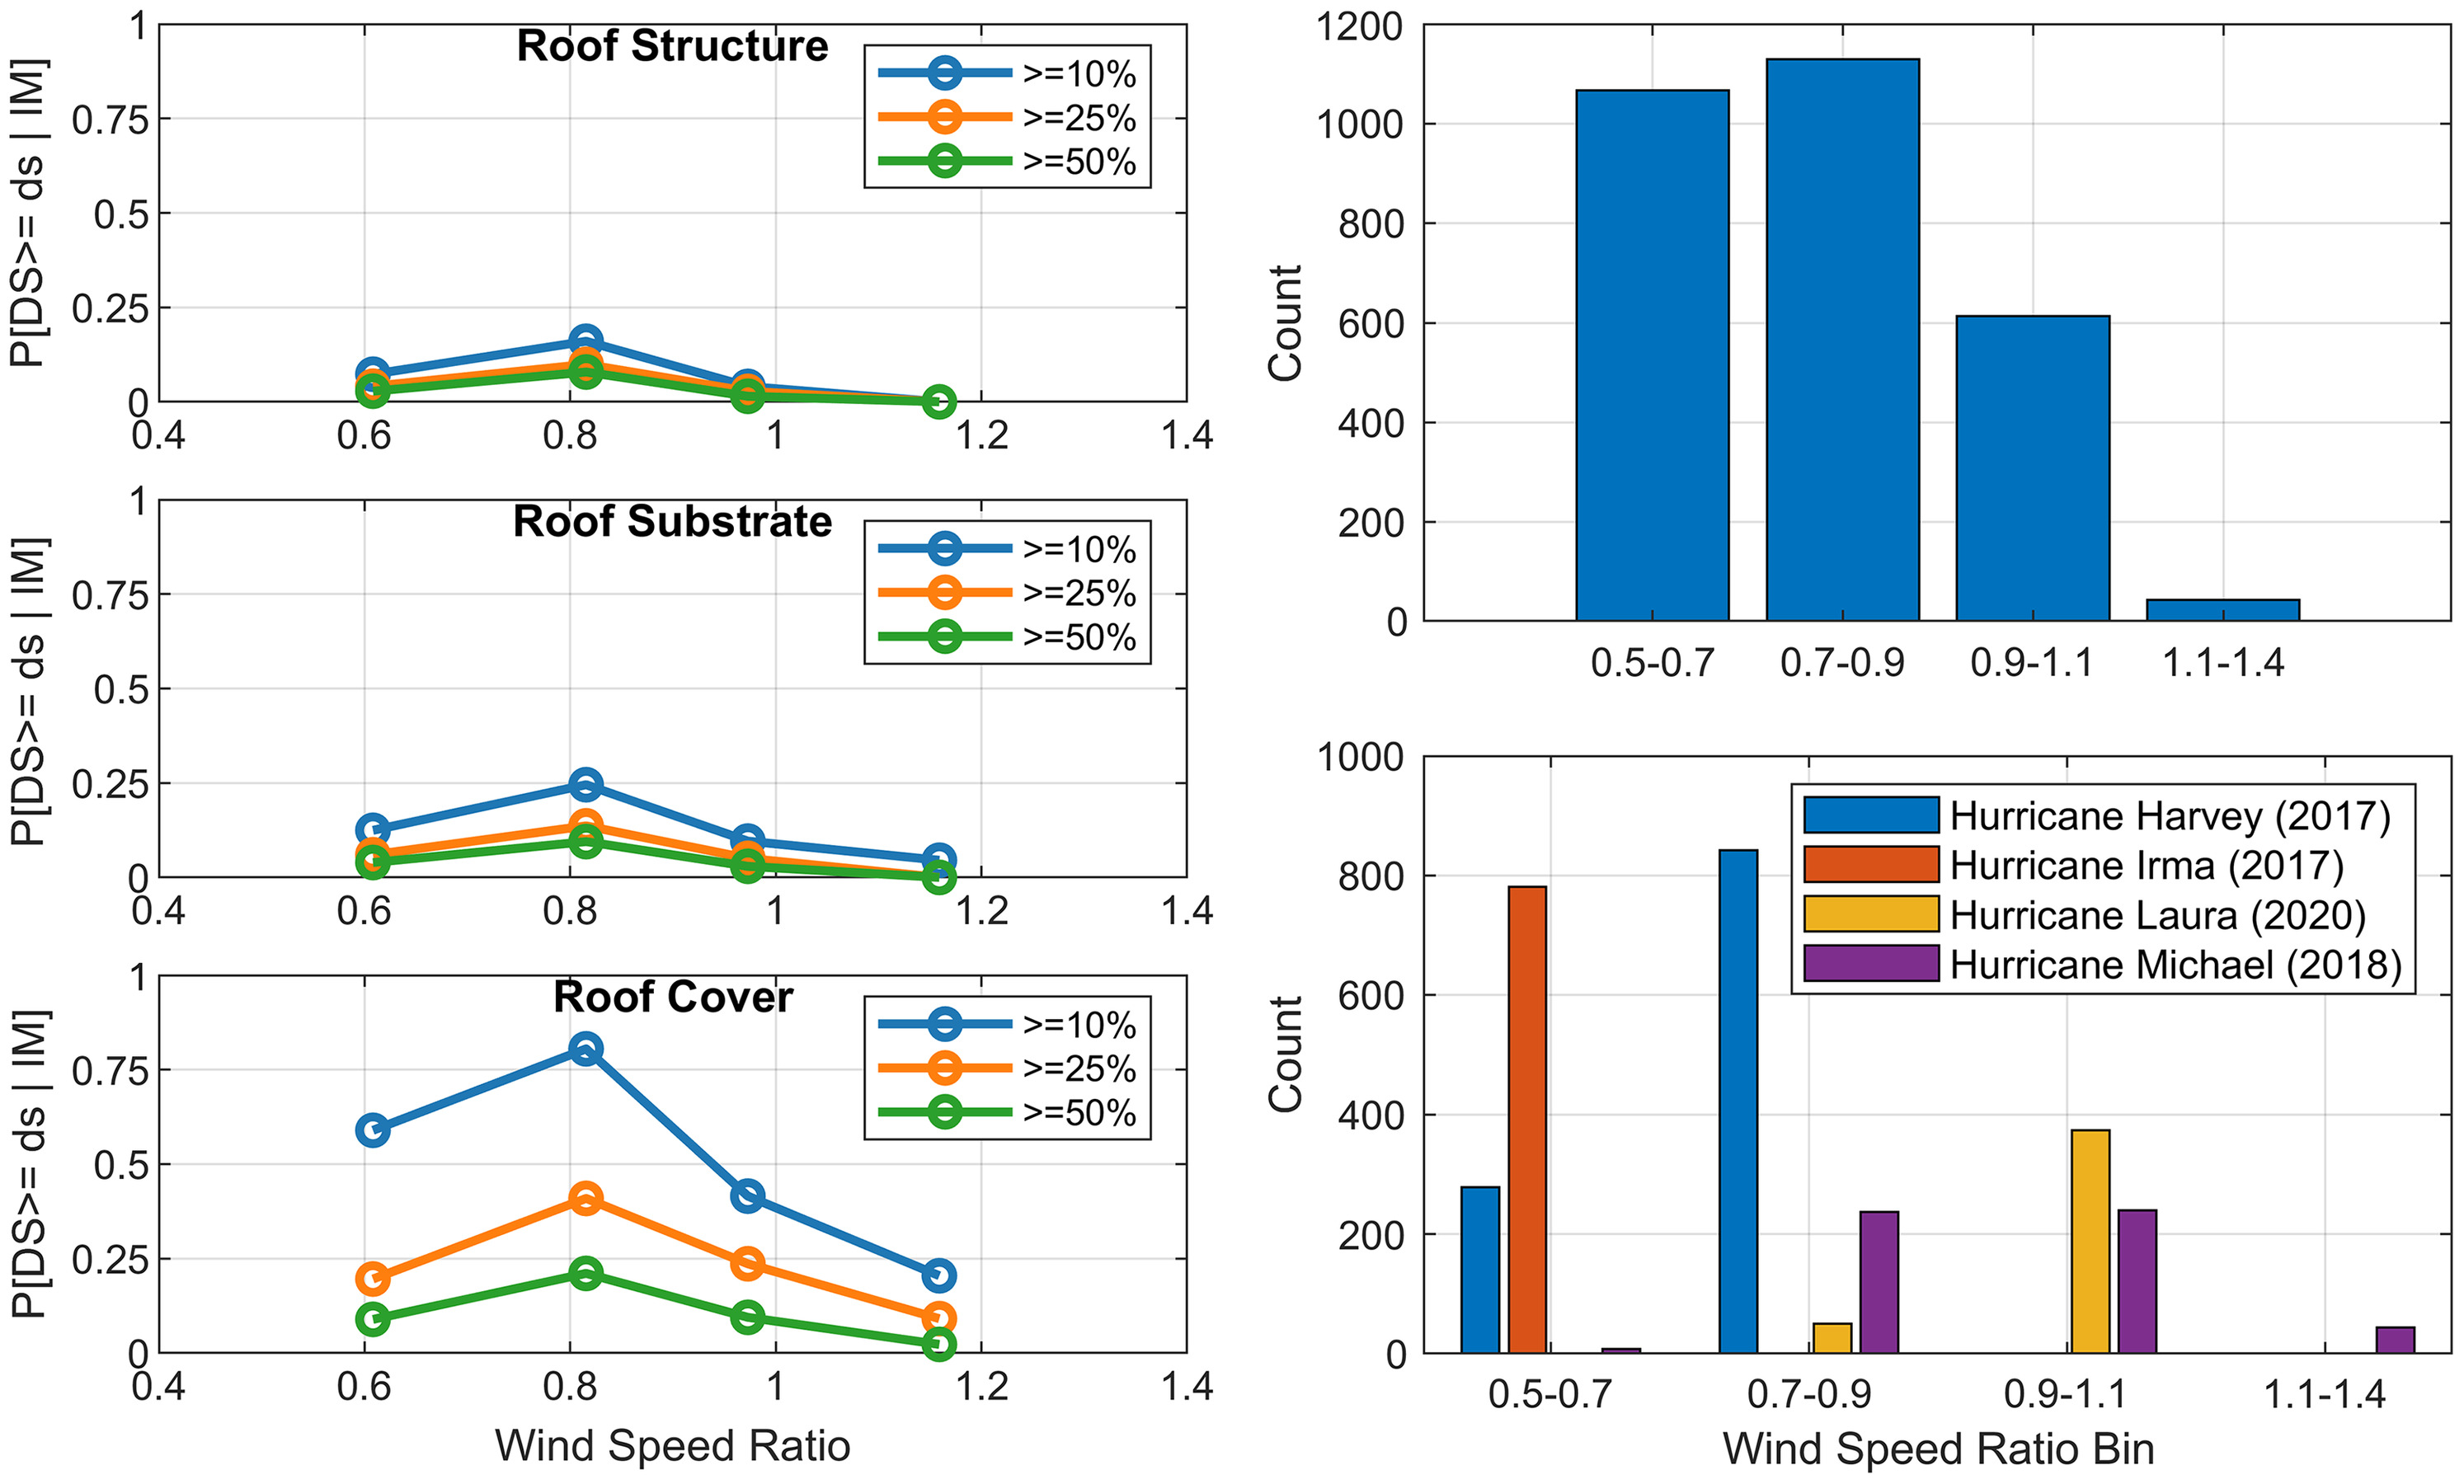
In light of this observation, and given that the basic wind speed should be a factor in how much damage a building experiences under a given wind speed, empirical fragility functions were also generated using a wind speed ratio (WSR), defined as the estimated wind speed divided by the basic wind speed, as the hazard intensity measure (Figs. 17–20). Here, the basic wind speed is derived from the referenced standard in the building code in force at time of construction, after first standardizing all basic wind speeds to ultimate values (nominally 700-year mean reoccurrence interval). This was accomplished by multiplying ASCE 7-05 basic wind speeds by the square root of the 1.6 wind load factor used for strength design (Coulbourne and Line 2011). Conditioned on wind speed ratio, the difference in building performance between hurricanes and tornadoes is even more stark. Under tornado loading, the WSR–damage relationship is distinctly monotonic for all components, while for hurricanes the relationship is scattered, with generally higher damage rates at lower WSR than at higher WSR. This counterintuitive trend is a byproduct of other confounding factors, two of which are posited as follows:
1.
The WiSPD is not equally represented by each hurricane in each WSR bin. The lower WSR are overly represented by Hurricanes Harvey (2017) and Irma (2017), while the higher WSR are overly represented by Hurricanes Michael (2018) and Laura (2020). Thus, regional effects due to differences in construction practices and code enforcement are not averaged out across each WSR bin, as illustrated in Fig. 21. For example, at the time of Hurricane Harvey (2017) in Texas, the state did not have a statewide building code, and the latest residential building code adopted by affected coastal jurisdictions was the 2006 IRC, potentially leaving these structures more vulnerable than regions in Louisiana or Florida affected by later storms. This disproportionately affects the lower WSR bins where Hurricane Harvey is overrepresented relative to the other storms. Hurricane Irma (2017), despite peak estimated gust wind speeds well below design in the Florida Keys, also produced unusually high damage rates, as described more fully in Prevatt et al. (2018), further contributing to enhanced damage probabilities. On the other side of the performance spectrum, the effect of regional differences is also illustrated in Figs. 13–17, as the highest wind speed bin is composed exclusively of Hurricane Michael (2018) homes. Many of these homes performed very well despite near- or above-design wind speeds, especially outside of surge-affected regions, resulting in a decrease in damage probabilities for this highest wind speed bin. The net effect is a nonmonotonic wind damage relationship when aggregated over all storms that is exacerbated when conditioning on the WSR.
2.
Related to (1), differences in the accuracy of the parametric hurricane wind field models between storms may also contribute to the observed nonmonotonic behavior of the hurricane WSR–damage relationship. For example, if the parametric wind field for Hurricane Michael overestimated the true wind speeds due to lack of surface observations near the core, it would have a disproportionate effect on the higher WSR bins. In contrast, peak wind speed estimates for 1,529 of the 1,608 tornado records rely on manual wind speed contours that were derived by the NWS using the EF scale, which uses observed damage to infer wind speeds. While the NWS contours smooth out some of the variability in wind estimates derived from individual structures, they are less constrained than parametric wind field models and, as a result, tend to produce a monotonic WSR–damage relationship, especially since the basic wind speed is similar across the tornado events.
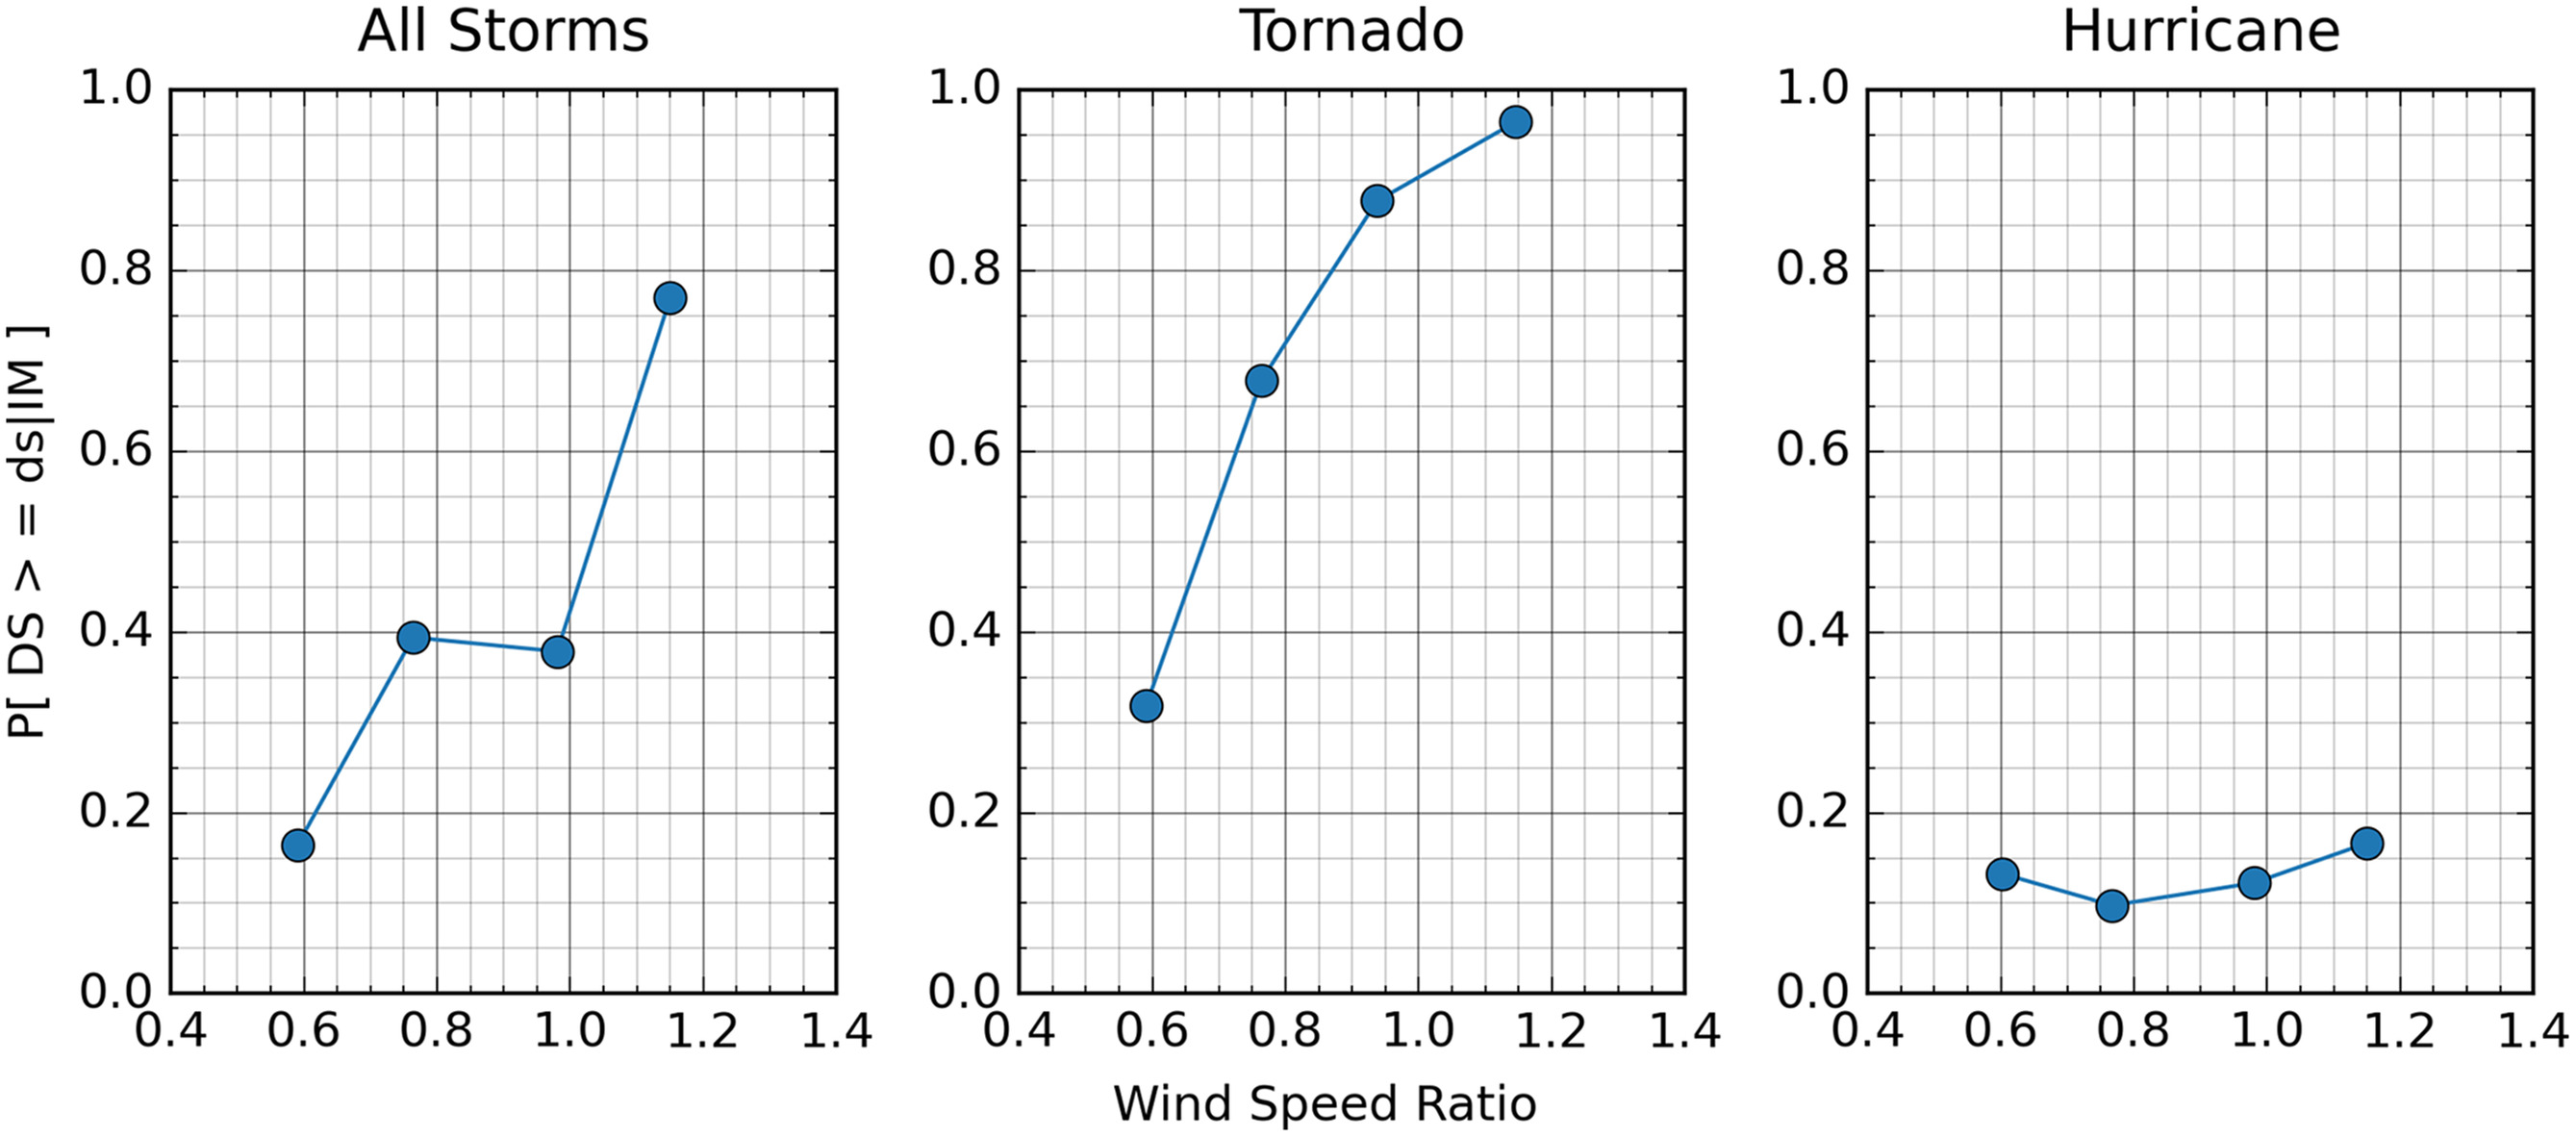
Beyond these systematic factors, other more localized confounding factors may be terrain effects, wind duration effects, and wind-borne debris effects on the wind loading side and year of construction, roof shape, and roof cover type on the resistance side. Ultimately, these initial presentations of a unified, multievent- and multistorm-type data set illustrate the complexity of the wind-damage relationship. Further, they reinforce the conclusion that conditioning wind damage relative to standardized wind speeds, whether storm-estimated or design, is at best unlikely to capture much of the variance in observations, especially over large regions, and at worst may produce physically inconsistent results.
Conclusions and Future Applications
This paper presents a unified, multievent, windstorm residential building performance data set for use as a testbed by the research community and highlights the primary characteristics of the data set from an attributes and damage perspective. It was created by assimilating reconnaissance data from eight past windstorms, i.e., four hurricanes and four tornadoes. An initial evaluation of the WiSPD v.1.0 data set finds that roof cover damage dominates in windstorms. Of the 3,732 homes experiencing some level of visible damage due to wind, only 1,491 (40%) suffered only roof cover damage. Further, roof cover damage was high on average, regardless of the year of construction or building code in force. Given the costly indirect effects of roof cover loss, e.g., interior damage, this data set highlights the importance of secondary water barriers and the need for more wind-resistant roof cover products. The study also finds that tornado damage tends to be greater than hurricane damage for equivalent estimated wind speeds, driven by higher fenestration damage ratios and roof structure damage. This is likely a byproduct of the differences between tornadoes and straight-line windstorms (e.g., debris clouds in tornadoes), and the higher vulnerabilities in construction in nonhurricane prone regions of the United States, where these tornado events occurred. Finally, the data set shows that the vertical load path in homes tends to be more vulnerable than the lateral load path, as roof structure and roof substrate damage is more common in hurricanes and tornadoes than wall-related structural failures. Homes tended to fail top-down structurally, and, while lateral loads may still be contributing to the vertical load path failures (through biaxial loading of roof-to-wall connections or shear-induced uplift of wall systems), racking and other shear-related failure mechanisms are uncommon. These initial findings only illustrate the knowledge contained within what promises to be a rich data set for further mining. A more detailed analysis is beyond the scope of this paper but is ongoing and will be presented in future studies.
Ultimately, this first version of the WiSPD is intended to be a starting point for a living data set that can be further enhanced, extended, and reused as a testbed by the research community for validations, benchmarks, training data, or even data-driven decision frameworks. The data set represents thousands of hours of efforts by the field reconnaissance teams that collected the data and the graduate and undergraduate students who processed, standardized, and enhanced the field data into this final data set. Notwithstanding, there remain many opportunities for further enhancements and improvements. As damage prediction models become more complex and granular in their simulation and prediction capabilities, their validation increasingly requires more robust field reconnaissance data containing information on the key physical and social parameters that are expected to be influential, if not directly causal, performance factors.
Version 1.0 of the WiSPD contains building attributes such as location, physical address, year of construction, building code in force (if known), number of stories, roof shape, roof cover type, wall cladding type, and first-floor elevation. Other attributes that would be expected to be meaningful to windstorm performance include mean roof height, roof slope, roof cover age, building footprint area and aspect ratio, foundation type, presence of building attachments (e.g., porch structures and large overhangs), and mitigation features (e.g., hurricane shutters). Some of these could be identified automatically with trained computer vision tools such as building recognition using artificial intelligence at large scale (Deierlein et al. 2020; Wang et al. 2021a) and confirmed by trained humans. Some of these attributes were quantified in a few storms but not all, and so are prime candidates for later versions of WiSPD if storms with missing data can be remined to fill in the gaps. Beyond the building attributes, surrounding conditions are also important, including, for example, the terrain class and shielding provided by adjacent buildings. Social factors could be integrated at the aggregate level through the social vulnerability index (Cutter 2003) or the national risk index (Zuzak et al. 2022) or at the individual house level by considering the rental status of the home, appraised value, and others. More refined hazard intensity estimates, particularly the addition of surge-related hazards and the use of parametric tornado wind field models, would also be beneficial. Precise details of the structural load path would also be beneficial, but typically such details are not available even to field teams (especially in well-performing homes) and must be inferred based on year of construction, building codes in force, knowledge of local construction practices, and other proxies. Damage could be defined more granularly by quantifying structural failure mechanisms rather than overall CLDP (e.g., shear wall uplift failure at foundation rather than just 20% wall structure damage), and damage could be quantified directionally by elevation or ASCE 7 pressure zone to enable more refined analysis or validations to be completed. Rigorously quantifying the uncertainty associated with the various features of the testbed is also needed (Tomiczek et al. 2022). Finally, aerial and ground-based imagery (which does exist for each house in the data set) could be synthesized in a standard form to effectively create a labeled data set useful for future computer vision tasks. Beyond the attribute enhancements, the data set could also benefit from additional sampling in the lower and highest wind speed ranges to better balance out the samples across the damaging wind gradient using existing post-storm aerial and surface-level panoramic imagery. Notwithstanding the recognition of these continued needs, we believe that the quantification of damage at the building component level, as demonstrated by this study, rather than only in broad global damage ratings, and the integration of multiple windstorm events and event types into a single unified testbed, is a significant step toward more useful reconnaissance data sets.
Supplemental Materials
File (supplemental_materials_nhrefo.nheng-1796_roueche.pdf)
- Download
- 104.48 KB
Data Availability Statement
All data and code generated or used during the study are available in the Natural Hazards Engineering Research Infrastructure DesignSafe platform in accordance with funder data retention policies (PRJ-4186, doi: https://doi.org/10.17603/ds2-ety5-qv78).
Acknowledgments
This work was sponsored in part by the National Science Foundation under grant CAREER-1944149 and research grants CMMI-1841667 and CMMI-2103550. Any opinions, findings, and conclusions or recommendations expressed in this material are those of the authors and do not necessarily reflect the views of the National Science Foundation.
References
ASCE. 2005. Minimum design loads for buildings and other structures. ASCE 7-05. Reston, VA: ASCE. https://doi.org/10.1061/9780784408094.
ASCE. 2013. Minimum design loads for buildings and other structures. ASCE 7-10. Reston, VA: ASCE. https://doi.org/10.1061/9780784412916.
ASCE. 2017. Minimum design loads for buildings and other structures. ASCE 7-16. Reston, VA: ASCE. https://doi.org/10.1061/9780784414248.
Atkins, N. T., K. M. Butler, K. R. Flynn, and R. M. Wakimoto. 2014. “An integrated damage, visual, and radar analysis of the 2013 Moore, Oklahoma, EF5 tornado.” Bull. Am. Meteorol. Soc. 95 (10): 1549–1561. https://doi.org/10.1175/BAMS-D-14-00033.1.
Beven, J. L., II, R. Berg, and A. Hagen. 2019. Tropical cyclone report: Hurricane Michael. Miami: National Hurricane Center.
Bhusar, A. A. 2017. “Development and validation of a tornado risk assessment tool for residential structures.” Master’s thesis, Engineering School of Sustainable Infrastructure and Environment, Univ. of Florida.
Blake, E., and D. Zelinsky. 2018. Tropical cyclone report: Hurricane Harvey. Miami, FL: National Hurricane Center.
Cangialosi, J. P., A. S. Latto, and R. Berg. 2021. Tropical cyclone report: Hurricane Irma. Miami: National Hurricane Center.
Coulbourne, W. L., and P. Line. 2011. “ASCE 7-10 changes to wind provisions and our approach to forensics.” In Proc., Structures Congress 2011, 1630–1636. Reston, VA: ASCE.
Coulbourne, W. L., and J. Miller. 2012. “Performance of school buildings in the Joplin, MO, tornado.” In Proc., Structures Congress 2012, 989–998. Reston, VA: ASCE.
Coulbourne, W. L., D. O. Prevatt, T. Eric Stafford, C. C. Ramseyer, and J. M. Joyce. 2015. Moore, Oklahoma, tornado of 2013: Performance of schools and critical facilities. Reston, VA: ASCE.
Cutter, S. L. 2003. “The vulnerability of science and the science of vulnerability.” Ann. Assoc. Am. Geogr. 93 (1): 1–12. https://doi.org/10.1111/1467-8306.93101.
Czajkowski, J., and J. Done. 2014. “As the wind blows? Understanding hurricane damages at the local level through a case study analysis.” Weather Clim. Soc. 6 (2): 202–217. https://doi.org/10.1175/WCAS-D-13-00024.1.
Deierlein, G. G., F. McKenna, A. Zsarnóczay, T. Kijewski-Correa, A. Kareem, W. Elhaddad, L. Lowes, M. J. Schoettler, and S. Govindjee. 2020. “A cloud-enabled application framework for simulating regional-scale impacts of natural hazards on the built environment.” Front. Built Environ. 6 (Nov): 558706. https://doi.org/10.3389/fbuil.2020.558706.
Edwards, R., J. G. LaDue, J. T. Ferree, K. Scharfenberg, C. Maier, and W. L. Coulbourne. 2013. “Tornado intensity estimation: Past, present, and future.” Bull. Am. Meteorol. Soc. 94 (5): 641–653. https://doi.org/10.1175/BAMS-D-11-00006.1.
Friedland, C. J. 2009. “Residential building damage from hurricane storm surge: Proposed methodologies to describe, assess and model building damage.” Doctoral dissertations, Dept. of Civil and Environmental Engineering, Louisiana State Univ. and Agricultural & Mechanical College.
Fujita, T. T. 1970. “The Lubbock tornadoes: A study of suction spots.” Weatherwise 23 (4): 161–173. https://doi.org/10.1080/00431672.1970.9932888.
Guimaraes, P., F. L. Hefner, and D. P. Woodward. 1993. “Wealth and income effects of natural disasters: An econometric analysis of Hurricane Hugo.” Rev. Reg. Stud. 23 (2): 97–114. https://doi.org/10.52324/001c.9106.
Gurley, K. R., and F. J. Masters. 2011. “Post-2004 hurricane field survey of residential building performance.” Nat. Hazard. Rev. 12 (4): 177–183. https://doi.org/10.1061/(ASCE)NH.1527-6996.0000044.
Jaffe, A. L., and G. A. Kopp. 2021. “Internal pressure modelling for low-rise buildings in tornadoes.” J. Wind Eng. Ind. Aerodyn. 209 (Feb): 104454. https://doi.org/10.1016/j.jweia.2020.104454.
Jain, A., A. A. Bhusar, D. B. Roueche, and D. O. Prevatt. 2020. “Engineering-based tornado damage assessment: Numerical tool for assessing tornado vulnerability of residential structures.” Front. Built Environ. 6 (Jun): 89. https://doi.org/10.3389/fbuil.2020.00089.
Keith, E. L., and J. D. Rose. 1994. “Hurricane Andrew—Structural performance of buildings in south Florida.” J. Perform. Constr. Facil. 8 (3): 178–191. https://doi.org/10.1061/(ASCE)0887-3828(1994)8:3(178).
Kijewski-Correa, T., et al. 2018a. Hurricane Harvey (Texas) supplement—Collaborative research: Geotechnical extreme events reconnaissance (GEER) association: Turning disaster into knowledge. Austin, TX: Designsafe-CI. https://doi.org/10.17603/DS2Q38J.
Kijewski-Correa, T., et al. 2018b. “Performance of low-rise construction under wind and coastal hazards during the landfall of Hurricane Harvey.” Proc., 8th Congress on Forensic Engineering, 1017–1027. Reston, VA: ASCE.
Kijewski-Correa, T., et al. 2018c. RAPID: A coordinated structural engineering response to Hurricane Irma (in Florida). Austin, TX: Designsafe-CI. https://doi.org/10.17603/DS2TX0C.
Kijewski-Correa, T., D. B. Roueche, K. M. Mosalam, D. O. Prevatt, and I. Robertson. 2021. “StEER: A community-centered approach to assessing the performance of the built environment after natural hazard events.” Front. Built Environ. 7 (May): 636197. https://doi.org/10.3389/fbuil.2021.636197.
Kovar, R. N., T. M. Brown-Giammanco, and F. T. Lombardo. 2018. “Leveraging remote-sensing data to assess garage door damage and associated roof damage.” Front. Built Environ. 4 (Oct): 61. https://doi.org/10.3389/fbuil.2018.00061.
Kuligowski, E. D., F. T. Lombardo, L. Phan, M. L. Levitan, and D. P. Jorgensen. 2014. National institute of standards and technology (NIST) technical investigation of the May 22, 2011, Tornado in Joplin, Missouri. Gaithersburg, MD: NIST.
Lombardo, F. T., D. B. Roueche, and D. O. Prevatt. 2015. “Comparison of two methods of near-surface wind speed estimation in the 22 May, 2011 Joplin, Missouri Tornado.” J. Wind Eng. Ind. Aerodyn. 138 (Mar): 87–97. https://doi.org/10.1016/j.jweia.2014.12.007.
Massarra, C. C., C. J. Friedland, B. D. Marx, and J. C. Dietrich. 2019. “Predictive multi-hazard hurricane data-based fragility model for residential homes.” Coast. Eng. 151 (Sep): 10–21. https://doi.org/10.1016/j.coastaleng.2019.04.008.
McDonald, J. R., K. C. Mehta, D. A. Smith, and J. A. Womble. 2012. “The enhanced Fujita scale: Development and implementation.” In Proc., Forensic Engineering 2009: Pathology of the Built Environment, 719–728. Reston, VA: ASCE.
Minor, J. E., J. R. McDonald, and K. C. Mehta. 1977. Tornado: An engineering-oriented perspective. Norman, OK: National Severe Storms Laboratory, National Oceanic and Atmospheric Administration.
Molthan, A. L., L. A. Schultz, K. M. McGrath, J. E. Burks, J. P. Camp, K. Angle, J. R. Bell, and G. J. Jedlovec. 2020. “Incorporation and use of Earth remote sensing imagery within the NOAA/NWS damage assessment toolkit.” Bull. Am. Meteorol. Soc. 101 (3): E323–E340. https://doi.org/10.1175/BAMS-D-19-0097.1.
NCEI (National Centers for Environmental Information). 2022. Storm events database—Event details. Asheville, NC: NCEI.
No Code. n.d. “No confidence—Federal alliance for safe homes—FLASH.” Accessed December 12, 2023. https://inspecttoprotect.org/.
Pasch, R., R. Berg, D. P. Roberts, and P. P. Papin. 2021. Tropical cyclone report: Hurricane Laura. Miami: National Hurricane Center.
Paul, B. K., and D. Che. 2011. “Opportunities and challenges in rebuilding tornado-impacted Greensburg, Kansas as ‘stronger, better, and greener’.” GeoJournal 76 (Feb): 93–108. https://doi.org/10.1007/s10708-010-9404-4.
Peek, L., J. Tobin, R. M. Adams, H. Wu, and M. C. Mathews. 2020. “A framework for convergence research in the hazards and disaster field: The natural hazards engineering research infrastructure CONVERGE facility.” Front. Built Environ. 6 (Jul): 110. https://doi.org/10.3389/fbuil.2020.00110.
Pinelli, J.-P., et al. 2018. “Overview of damage observed in regional construction during the passage of Hurricane Irma over the State of Florida.” In Proc., 8thth Congress on Forensic Engineering, 1028–1038. Reston, VA: ASCE.
Pinelli, J.-P., M. Esteva, E. M. Rathje, D. Roueche, S. J. Brandenberg, G. Mosqueda, J. Padgett, and F. Haan. 2020. “Disaster risk management through the DesignSafe cyberinfrastructure.” Int. J. Disaster Risk Sci. 11 (6): 719–734. https://doi.org/10.1007/s13753-020-00320-8.
Pistrika, A., and S. Jonkman. 2010. “Damage to residential buildings due to flooding of New Orleans after Hurricane Katrina.” Nat. Hazards 54 (Aug): 413–434. https://doi.org/10.1007/s11069-009-9476-y.
Prevatt, D. O., et al. 2018. “Performance of structures under successive hurricanes: Observations from Puerto Rico and the US Virgin Islands after Hurricane Maria.” In Proc., 8th Congress on Forensic Engineering, 1049–1059. Reston, VA: ASCE.
Prevatt, D. O., W. Coulbourne, A. J. Graettinger, S. Pei, R. Gupta, and D. Grau. 2012a. Joplin, Missouri, Tornado of May 22, 2011: Structural damage survey and case for tornado-resilient building codes. Reston, VA: ASCE.
Prevatt, D. O., J. W. van de Lindt, E. W. Back, A. J. Graettinger, S. Pei, W. Coulbourne, R. Gupta, D. James, and D. Agdas. 2012b. “Making the case for improved structural design: Tornado outbreaks of 2011.” Leadersh. Manage. Eng. 12 (4): 254–270. https://doi.org/10.1061/(ASCE)LM.1943-5630.0000192.
Prevatt, D. O., J. W. van de Lindt, A. Graettinger, W. Coulbourne, R. Gupta, S. Pei, S. Hensen, and D. Grau. 2011. Damage study and future direction for structural design following the Tuscaloosa tornado of 2011, 56. Tuscaloosa, AL: Univ. of Alabama.
Ramseyer, C., L. Holliday, and R. Floyd. 2016. “Enhanced residential building code for tornado safety.” J. Perform. Constr. Facil. 30 (4): 04015084. https://doi.org/10.1061/(ASCE)CF.1943-5509.0000832.
Roueche, D., et al. 2020a. “StEER field assessment structural team (FAST).” In StEER—Hurricane Michael. Austin, TX: Designsafe-CI. https://doi.org/10.17603/ds2-5aej-e227.
Roueche, D., et al. 2021a. “Hybrid preliminary virtual reconnaissance report-early access reconnaissance report (PVRR-EARR).” In StEER—Hurricane Laura. Austin, TX: Designsafe-CI. https://doi.org/10.17603/DS2-NG93-SE16.
Roueche, D., T. Kijewski-Correa, K. M. Mosalam, D. O. Prevatt, and I. Robertson. 2019. StEER: Virtual assessment structural team (VAST) handbook: Data enrichment and quality control (DE/QC) for US windstorms. Alexandria, VA: National Science Foundation.
Roueche, D. B., F. T. Lombardo, R. J. Krupar III, and D. J. Smith. 2018a. Collection of perishable data on wind- and surge-induced residential building damage during hurricane harvey (TX). Austin, TX: Designsafe-CI. https://doi.org/10.17603/DS2DX22.
Roueche, D. B., F. T. Lombardo, and D. O. Prevatt. 2017. “Empirical approach to evaluating the tornado fragility of residential structures.” J. Struct. Eng. 143 (9): 04017123. https://doi.org/10.1061/(ASCE)ST.1943-541X.0001854.
Roueche, D. B., F. T. Lombardo, D. J. Smith, and R. J. Krupar III. 2018b. “Fragility assessment of wind-induced residential building damage caused by Hurricane Harvey, 2017.” In Proc., 8th Congress on Forensic Engineering, 1039–1048. Reston, VA: ASCE.
Roueche, D. B., and D. O. Prevatt. 2013. “Residential damage patterns following the 2011 Tuscaloosa, AL and Joplin, MO tornadoes.” J. Disaster Res. 8 (6): 1061–1067. https://doi.org/10.20965/jdr.2013.p1061.
Roueche, D. B., D. O. Prevatt, and F. L. Haan. 2020b. “Tornado-induced and straight-line wind loads on a low-rise building with consideration of internal pressure.” Front. Built Environ. 6 (Feb): 18. https://doi.org/10.3389/fbuil.2020.00018.
Saffir, H. S. 1991. “Hurricane Hugo and implications for design professionals and code-writing authorities.” J. Coastal Res. 8: 25–32.
Somes, N. F., R. D. Dikkers, and T. H. Boone. 1971. Lubbock tornado: A survey of building damage in an urban area. Gaithersburg, MD: NIST.
Sparks, P. R., S. D. Schiff, and T. A. Reinhold. 1994. “Wind damage to envelopes of houses and consequent insurance losses.” J. Wind Eng. Ind. Aerodyn. 53 (1): 145–155. https://doi.org/10.1016/0167-6105(94)90023-X.
Thom, H. C. S., and R. D. Marshall. 1971. “Wind and surge damage due to Hurricane Camille.” J. Waterway Harbors Coastal Eng. Div. 97 (2): 355–363. https://doi.org/10.1061/AWHCAR.0000085.
Tomiczek, T., J. Helgeson, E. Sutley, D. Gu, S. Hamideh, and P. S. Crawford. 2022. “A framework for characterizing uncertainty factors in postdisaster structural performance assessment data.” Nat. Hazards Rev. 24 (1): 02522001.
Tomiczek, T., A. Kennedy, Y. Zhang, M. Owensby, M. E. Hope, N. Lin, and A. Flory. 2017. “Hurricane damage classification methodology and fragility functions derived from Hurricane Sandy’s effects in coastal New Jersey.” J. Waterway, Port, Coastal, Ocean Eng. 143 (5): 04017027. https://doi.org/10.1061/(ASCE)WW.1943-5460.0000409.
van de Lindt, J. W., A. Graettinger, R. Gupta, T. Skaggs, S. Pryor, and K. J. Fridley. 2007. “Performance of wood-frame structures during Hurricane Katrina.” J. Perform. Constr. Facil. 21 (2): 108–116. https://doi.org/10.1061/(ASCE)0887-3828(2007)21:2(108).
Vickery, P. J., F. Liu, and F. Lavelle. 2018. NIST/ARA Hurricane Michael rapid response windfield estimate. Raleigh, NC: Applied Research Associates.
Vickery, P. J., P. F. Skerlj, J. Lin, L. A. Twisdale, M. A. Young, and F. M. Lavelle. 2006. “HAZUS-MH hurricane model methodology. II: Damage and loss estimation.” Nat. Hazards Rev. 7 (2): 94–103. https://doi.org/10.1061/(ASCE)1527-6988(2006)7:2(94).
Vickery, P. J., D. Wadhera, M. D. Powell, and Y. Chen. 2009. “A hurricane boundary layer and wind field model for use in engineering applications.” J. Appl. Meteorol. Climatol. 48 (2): 381–405. https://doi.org/10.1175/2008JAMC1841.1.
Wakimoto, R. M., and P. G. Black. 1994. “Damage survey of Hurricane Andrew and its relationship to the eyewall.” Bull. Am. Meteorol. Soc. 75 (2): 189–202. https://doi.org/10.1175/1520-0477(1994)075%3C0189:DSOHAA%3E2.0.CO;2.
Wang, C., Q. Yu, K. H. Law, F. McKenna, X. Y. Stella, E. Taciroglu, A. Zsarnóczay, W. Elhaddad, and B. Cetiner. 2021a. “Machine learning-based regional scale intelligent modeling of building information for natural hazard risk management.” Autom. Constr. 122 (Feb): 103474. https://doi.org/10.1016/j.autcon.2020.103474.
Wang, C., K. Zhong, B. Cetiner, T. Kijewski-Correa, A. Zsarnóczay, F. McKenna, and G. Deierlein. 2021b. SimCenter Hurricane Testbed: Lake Charles, LA. Austin, TX: Designsafe-CI. https://doi.org/10.17603/ds2-jpj2-zx14.
Wood, R., et al. 2020. “Early access reconnaissance report (EARR).” In StEER -3 March 2020 Nashville Tornadoes. Austin, TX: Designsafe-CI. https://doi.org/10.17603/ds2-2zs2-r990.
Wurman, J., and K. Kosiba. 2018. “The role of small-scale vortices in enhancing surface winds and damage in Hurricane Harvey (2017).” Mon. Weather Rev. 146 (3): 713–722. https://doi.org/10.1175/MWR-D-17-0327.1.
Xian, S., N. Lin, and A. Hatzikyriakou. 2015. “Storm surge damage to residential areas: A quantitative analysis for Hurricane Sandy in comparison with FEMA flood map.” Nat. Hazards 79 (3): 1867–1888. https://doi.org/10.1007/s11069-015-1937-x.
Zuzak, C., M. Mowrer, E. Goodenough, J. Burns, N. Ranalli, and J. Rozelle. 2022. “The national risk index: Establishing a nationwide baseline for natural hazard risk in the US.” Nat. Hazards 114 (2): 2331–2355. https://doi.org/10.1007/s11069-022-05474-w.
Information & Authors
Information
Published In

Natural Hazards Review
Volume 25 • Issue 2 • May 2024
Copyright
This work is made available under the terms of the Creative Commons Attribution 4.0 International license, https://creativecommons.org/licenses/by/4.0/.
History
Received: Nov 4, 2022
Accepted: Oct 13, 2023
Published online: Dec 30, 2023
Published in print: May 1, 2024
Discussion open until: May 30, 2024
Authors
Metrics & Citations
Metrics
Citations
Download citation
If you have the appropriate software installed, you can download article citation data to the citation manager of your choice. Simply select your manager software from the list below and click Download.