Abstract
Expanding sanitary sewer networks is vital for meeting the Sustainable Development Goals (SDGs) for urban areas. Uncertain future design conditions threaten this infrastructure expansion; notably, climate change has been described as the biggest threat to achieving the SDGs. However, the literature on how climate change can affect sanitation is sparse, especially in low- and middle-income countries, where infrastructure is most needed. We created a simple hydraulic model that quantitatively examines how the uncertainty-induced threats related to urbanization, stormwater inflow, and climate change might affect designed sanitary sewers. Our sanitary sewer model allows a designer or operator to estimate how urban development (e.g., population growth, water consumption, and expansion of impervious areas), stormwater infow, or changing rainfall patterns (e.g., climate change scenarios) would affect the performance of a sanitary sewer network. We identified that the fraction of stormwater inflow entering the sanitary sewers is the most significant threat to urban sewers. Applying the model to three case studies in Brazil revealed that the fraction of stormwater inflow in sanitary sewers is at least 1.8 times more influential than the other considered uncertainties. Stormwater inflow collected in the sanitary system leaves the network vulnerable to extreme rainfall events, consequently leaving the design guidelines vulnerable to climate change, which may compromise their ability to achieve the SDGs. Our model quantitatively demonstrates the essential role that minimizing inflow must play in ensuring climate resilient sanitation and in maximizing the utilization of sanitary sewers.
Practical Applications
Safely managing human waste is critical to the health and well-being of humans, especially in cities. Investments in resilient sanitation infrastructure can generate a significant return on investment in health-related benefits. However, if not accounted for, climate change effects can compromise the ability to provide safe sanitation. While 3.5 billion people still need sanitation infrastructure today, methods of expanding sewer systems amid climate change are unclear. In this paper, we provided a simple model that gives a designer or operator insights into the implications of how various sources of uncertainty (urbanization, stormwater inflow, and climate change) can affect the performance of sanitary sewers. Applying the proposed model to three regional capital cities in Brazil, we demonstrated that the biggest threat to urban sewers, even compared to urbanization and climate change, is the fraction of stormwater entering a sanitary sewer. When building or expanding sanitary sewers, inaccurate estimates of how much stormwater will enter the sanitary system can lead to sewage overflow, which might result in health, environmental, and economic hazards. Minimizing the fraction of stormwater that enters the sanitary system would increase the resilience of the sewer network against extreme rainfall events that would increase due to climate change.
Introduction
Achieving sustainable, universal access to water and sanitation under climate change has been described as the “defining challenge for the SDG (Sustainable Development Goal) period” (Howard et al. 2016). The latest Intergovernmental Panel on Climate Change (IPCC) stated that “key infrastructure systems including sanitation … will be increasingly vulnerable if design standards do not account for changing climate conditions” (IPCC 2023). Nevertheless, the literature on how climate change will affect sanitation infrastructure is sparse (Mikhael et al. 2021). The problem is more significant in low- and middle-income countries (LMICs), where there is little evidence of how utilities are addressing climate change risks (Howard et al. 2016).
Magnifying the climate change risks, sanitation infrastructure has not kept pace with rapid urbanization and population growth, compounding a worldwide, urban sanitation crisis (Satterthwaite et al. 2019). In 2022, 3.5 billion people did not have access to safely managed sanitation (JMP 2023); achieving universal access to “adequate and equitable sanitation” (United Nations Sustainable Development Goal 6.2) will require expanding sanitary sewer networks, especially in growing and dense urban centers in LMICs (Satterthwaite et al. 2019; Zhong et al. 2023). But current tools and theories used to design and expand sanitary sewer networks, particularly in LMICs, do not sufficiently account for urbanization and climate change.
Infrastructure implemented today must be capable of accommodating or mitigating the future threats of climate change and urbanization over its long lifetime (75–100 years; Burian et al. 1999) to provide robust sanitation (World Bank 2020). Failing to adequately consider uncertainties throughout the long lifetime of infrastructure systems can result in too little or too much capacity, with dangerous or costly consequences (Boland and Loucks 2021). Far from robustly accounting for uncertainty, many design guidelines rely on deterministic projections (e.g., forecasts) to estimate future load, which includes sewage, groundwater infiltration, and some amount of stormwater. Groundwater infiltration is groundwater that continuously enters the system through cracked or broken sewers throughout the sewer’s lifetime. Stormwater can enter the sewer in two ways:
1.
Directly, via inflow: Stormwater directly enters the sewer through cross-connections between sanitary and stormwater networks, roof downspouts (often illegally) connected to the sanitary sewers, or broken maintenance hole covers (Department of Human Settlements 2019; Nasrin et al. 2017; Kesik 2015); and
2.
Indirectly, via infiltration: Stormwater enters sewers via cracked and broken pipes and joints during and following rainfall.
Stormwater inflow causes large peak flows during and following a rainfall event and results in a faster response from the network than stormwater or groundwater infiltration, and it is the main concern affecting the operation of sanitary sewers. During extreme rainfall events, or when the volume of inflow exceeds expectations, inflow collected in the infrastructure might surpass its capacity, leading to sanitary sewer overflows (SSOs). These overflows pose health, environmental, and economic risks (Owolabi et al. 2022; Jagai et al. 2017), which are likely to become more prevalent with urbanization and climate change.
Well-planned sanitation infrastructure must account for uncertainty in future sanitary sewer loads caused by urbanization and climate change. Urbanization can change sanitary loads through
•
lifestyle shifts that affect water consumption;
•
population growth, often rapid and uncertain (United Nations 2019a); and
•
land use changes, often increasing impervious areas (Brelsford et al. 2020; Zhong et al. 2023).
Climate change will also affect sanitary loads by magnifying the already naturally high rainfall variation (IPCC 2014), thereby magnifying the amount of stormwater that could enter the sanitary sewer network as inflow.
Most sanitary sewer guidelines account for stormwater inflow in the sanitary sewer, either explicitly or implicitly. For example, South Africa’s design guidelines explicitly state that sewer pipes should be designed such that 15%–30% of the full flow capacity is reserved to accommodate inflow from stormwater cross-connections; thus, their pipes are designed to potentially flow fully during a rainfall event (Department of Human Settlements 2019). Conversely, other guidelines leave spare capacity (e.g., a maximum depth of flow in Brazil) without explicitly identifying that this capacity could convey collected stormwater inflow during rainfall events. Some guidelines include spare capacity, in addition to explicitly considering inflow; for example, the City of Toronto’s guidelines require that the maximum design flow, including a predicted inflow of for new sewers (Qazi 2021), is only 80% of the pipe’s full flow capacity. But while guidelines make deterministic predictions about inflow, its true value is highly uncertain. Inflow measurements from cities across North America, Europe, and China vary fivefold (ranging from 14% to 80% of the total flow; e.g., Diem et al. 2022; Jenssen Sola et al. 2018; Rödel et al. 2017). Inflow is also an important concern for low-cost sanitary sewers promoted for use in Brazil and other LMICs. These condominial sewers connect groups of users with shallower and smaller-diameter pipes as if they were all residents in a single condominium building (Mara 2013, 2018; Neder 2000). Whenever sewer designs do not explicitly account for inflow, stormwater inflows can compromise the safe collection of sewage (Neder 2000).
As a complement to case studies and field measurements, modeling tools provide insights into the physics and mathematics of how future uncertainties may affect an infrastructure system. Such modeling tools hold particular promise in LMICs, where system complexity and data sparsity can impede the use of traditional, detailed modeling tools. Unfortunately, however, most sanitary sewer modeling tools disregard the role of stormwater in sanitary sewers (e.g., Duque et al. 2022) and/or require more input data than can be gathered in many LMICs (e.g., Navin et al. 2019; Ahmadi et al. 2018). Hence, new modeling tools are urgently needed to support the expansion of sanitary sewers in LMICs, where data is scarce, but the uncertainties of urbanization and climate change abound.
This study aimed to create and learn from a model of sanitary sewer performance under the uncertain threats of urbanization and climate change in data-scarce environments. First, we constructed a simple sewer hydraulic model that quantitatively contrasts the current, deterministic design projections with the possible future flows. Uniquely, our model explicitly accounts for climate change using a new variable representing the fraction of stormwater flow collected in a sanitary sewer network. Next, we demonstrate the model by applying it to three regional capital cities in Brazil (Recife, Manaus, and Curitiba). We then analyze the sensitivity of the proposed model for a 10% error in each input estimator. Finally, we combine insights from our model, its demonstration, and its sensitivity to discuss the vulnerabilities of sanitary sewer systems to stormwater.
Sanitary Sewer Network Model
Sources of Uncertainty
We considered five sources of uncertainty for future networks in LMICs: sewage production per capita, population growth, impervious areas, the fraction of stormwater that enters the sanitary network, and changing precipitation intensity due to climate change (IPCC 2023; United Nations 2019b; ISF-UTS and SNV 2019; UN-Habitat 2007; Astaraie-Imani et al. 2012).
The amount of sewage produced per capita is directly influenced by the daily per capita water consumption and the rate of the consumed water that returns to the sewer system as sewage. The amount of water consumed is influenced by water management actions (e.g., the water price and changes in demographic and economic composition) (Ashoori et al. 2017; Astaraie-Imani et al. 2012) and climate change (Wang et al. 2016). The effect of climate change on consumption is unclear. Although climate change–induced increases in temperature would likely increase water demand, the water consumption per capita is expected to decrease in water-scarce locations (Greve et al. 2018).
Sewer designs are based on estimates of the final population to be served by the infrastructure. However, population growth in many LMICs is highly uncertain (United Nations 2019b); cities in LMICs are expected to accommodate 2 billion new urban inhabitants by 2050 (United Nations 2019b). Moreover, UN-Habitat estimates that 95% of urban development is unplanned in LMICs (UN-Habitat 2007), leading to uncertain land-use patterns and likely increases in paved surfaces (i.e., impervious areas; Brelsford et al. 2020), consequently increasing the potential runoff into the sanitary network.
Sanitary sewers are designed to collect some stormwater (Department of Human Settlements 2019). However, varied construction quality and design criteria change how much storm runoff enters the sanitary sewers (Kesik 2015). The ingress of stormwater into sanitary sewers occurs mainly due to cross-connections between the stormwater and sanitary sewage systems and unexpected connections of stormwater sources occurring on private property (e.g., when a home’s roof drainage is connected to the sanitary system; Department of Human Settlements 2019). However, little is known about the degree to which stormwater enters sanitary sewers in LMICs. Given that stormwater inflow continues to be a systemic issue for sanitary sewers in well-regulated and managed sanitary networks, stormwater inflow is likely problematic in many LMICs.
Global climate change is expected to increase extreme weather events worldwide by increasing rainfall intensity and frequency and/or by increasing drought (IPCC 2014). An increase in intense rainfall events due to climate change directly magnifies the relevance of stormwater inflow in sanitary networks; excess inflow in the network can lead to SSOs, compromising the safe operation of sanitary sewers. For Brazil, intense rainfall is expected to become more frequent (Santos et al. 2020). Simulations of how climate change will affect rainfall in Brazil show regionalized effects, with rainfall intensity increasing year-round in the Southeast and South Regions; and increasing only seasonally in the North Region (Santos et al. 2020).
Mathematical-Hydraulic Model
We developed a simple mathematical-hydraulic sanitary sewer model to compare quantitatively the uncertainties related to sewage production per capita, population growth, impervious areas, the fraction of stormwater that enters the network, and climate change. We contrasted two estimates for flow rates (loads): projected flows and possible flows. The projected flow refers to the deterministic load that sanitary sewers are designed to accommodate at the end of their design lifetime. In contrast, we estimate a range of the possible flows based on our quantifications of future uncertainties. Thus, while every deterministically designed sewer has only one projected flow, there is a range of possible flows in that sewer, which varies throughout its lifetime. Over the infrastructure’s design lifetime, if the possible load ends up being the same value as the projected load, the future system behaves as predicted, and the design is likely to perform as required at a minimal cost. If the possible load is higher than the projected one, the infrastructure is underdesigned, and dangerous and costly overflows are likely to occur more often than desired. Conversely, if the possible load is smaller than the projected one, the infrastructure is overdesigned—the sewer cost more to build than it might otherwise have.
We compared projected and possible loads on the sewer network based on the peak flow in the system: sanitary sewage (accounting for groundwater infiltration) and stormwater inflow [Eq. (1)]. To quantify the fraction of stormwater collected in the system, we created a variable (), which represents the percentage of the area’s total stormwater runoff () that ends up in the sanitary system. If , no stormwater enters the sanitary sewers; thus, the system behaves like a perfectly separate sanitary system. If , the system behaves like a combined sewer, collecting all of the area’s runoff along with its sewage. In practice, some stormwater during rainfall events enters the sanitary system; hence, . For most systems, however, the value of is highly unknown, especially at the design stage. For simplicity, we omit the effects of stormwater infiltration. Hence, we model the flow in a sanitary sewer as:where is the total flow in the system; is the flow due to the fraction of stormwater that is collected in the sanitary system, which is a fraction () of the area’s total stormwater runoff (); and is the sewage flow rate during dry weather conditions, accounting for the peak sewage production per capita, the population served by the network, and the groundwater infiltration flow [Eq. (2)]. We defined the peak sewage production per capita () as the average sewage production per capita () multiplied by a peak factor () (i.e., ), the initial population (), and a total population growth factor (g). We approximated the groundwater infiltration flow () as the product of infiltration rate and upstream area (A)where in year t, is the peak sewage production; (capita) is the initial population; is the cumulative population growth factor from the beginning of operation until year t; is the infiltration coefficient; and A () is the area served by the infrastructure.
(1)
(2)
Our mathematical model captures two sources of increases in the population served by the sanitary sewer: densification (serving new people in a serviced area), extensification (serving new people in new areas). In both cases, increased population could represent new people in that area or previously unserved populations. In our model, initial population () represents all people in the area who will be immediately connected to the system. The population growth factor could be used to capture the area’s densification throughout the lifetime of the infrastructure, the system serving a growing proportion of the residents in the area, and/or a growth of the infrastructure to serve new people in a new area. Our use of a constant area (A) omits extensification as a source of population growth. We estimate based on population projections, which limits our analysis to modeling population growth–driven densification.
We estimated the possible stormwater flow rate using the rational method. For separate sanitary sewers, only a fraction () of all available stormwater runoff would flow into the sanitary system. Introducing allowed us to account for three uncertainties explicitly: (1) ease of stormwater inflow into the sanitary sewer; (2) impervious surfaces (through the runoff coefficient, C); and (3) rainfall intensity in the catchment area (i), which is likely affected by climate change. Therefore, = CiA.
Projected Load
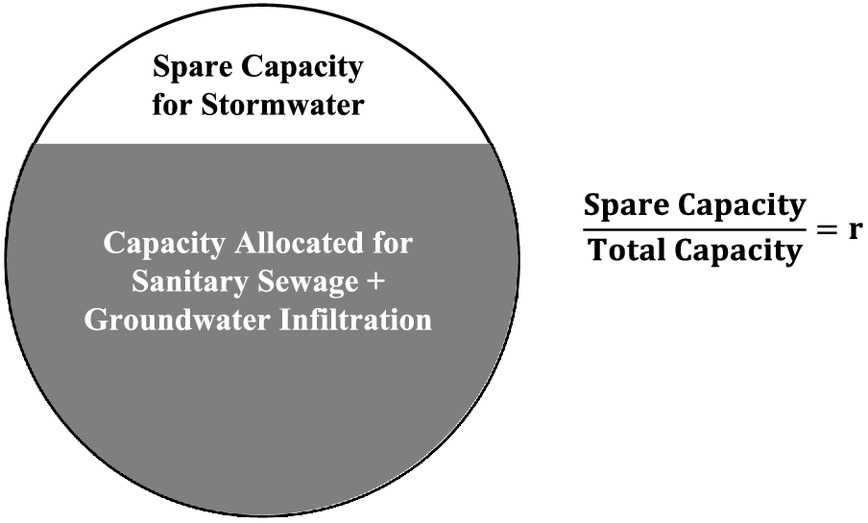
We modeled the sanitary sewers as being designed to accommodate a deterministic projected load during wet weather at the end of the infrastructure lifetime (); a similar approach is used in design guidelines from South Africa (Department of Human Settlements 2019) and Toronto (Qazi 2021). In the South African design guidelines, total capacity is based on the projected dry weather flow plus an additional fraction of the total capacity reserved for wet weather flow (Department of Human Settlements 2019). Following this method, we used our projected dry weather flow as a basis for projecting the required total capacity [, Eq. (2); Fig. 1]. As the wet weather is projected to be a fraction (r) of the total capacity, the total capacity is of the dry weather flow [Eq. (3); Fig. 1]. Using this method, therefore, the sewer’s total projected (full) flow can be computed based on its dry weather flow alone:where is the projected flow at the end of the sewer’s design life (T); is the percentage spare capacity allowance criteria; and is the cumulative population growth factor from the beginning of the operation until the end of its design life (T).
(3)
Projected Value of ,
The practice of designing sanitary sewers to handle stormwater using spare capacity [Eq. (3)] obscures the connection between spare capacity and projected stormwater inflow and between projected storm intensity and projected stormwater inflow. The variable can help make a guideline’s projections about storm intensity, stormwater, and inflow explicit. We define as the fraction of stormwater that a guideline implicitly projects to be collected by a sanitary sewer at the end of its lifetime. For a design storm of intensity (i) in a catchment of area (A) with the runoff coefficient (C), the projected value of iswhere is the fraction of stormwater that a guideline implicitly projects to be collected by a sanitary sewer at the end of its lifetime.
(4)
Possible Load
To model the possible future load (), we adapted Eq. (1) to include time variations in per capita sewage production, served population, runoff coefficient, and climate change intensity. We estimated the design rainfall intensity using the intensity-duration-frequency (IDF) curve. We considered the design storm to have a return period of 2 years, and we used an approximation relating to the catchment’s length and the maximum design velocity in a pipe to estimate the time of concentration ().
We represented the impact of climate change over time as a multiplier, cc(t), of the rainfall intensity (i); hence, the climate change–influenced intensity is: , similar to the methodology proposed by Urich and Rauch (2014). We estimated the pre–climate change rainfall intensity based on a return period of 2 years and the time of concentration. Combining these definitions, we arrived at our model for the peak possible future flow for a sanitary sewer in year t aswhere () is the uncertain future flow during year t; () is the peak sewage production at time t; g (t) is the cumulative population growth factor from the initial time to the given year t; t (years) is the year under study; C(t) is the runoff coefficient in year t; and () is the climate-change-magnified rainfall in year t.
(5)
Model Assessment
We used the ratio of possible and projected flow rates () as a performance metric for sewer design. The ratio reflects the state of the infrastructure’s design. While implies an underdesigned infrastructure, reflects an overdesigned one. Thus, means a well-functioning infrastructure at the lowest possible cost.
We demonstrate the potential utility of the model quantitatively by exploring its predictions about the effects of each source of uncertainty in three Brazilian cities. Specifically, we performed a one-way sensitive analysis to evaluate the relationship between each source of uncertainty and the ratio of the projected and possible flows in the sewer at the end of its design lifetime. We visualized the resulting estimates of the uncertainty-induced threats to sanitary sewer performance with tornado plots.
We also evaluated how uncertainties would evolve over time. While the projected load is fixed, the possible load evolves over time (with uncertainty increasing with time). We explored this temporal variation under three fixed values of : minimum, baseline, and maximum. Given the absence of data on , we estimated its possible range based on the range of projections for it obtained using different design guidelines. For each case, we performed a one-way sensitivity analysis for each uncertainty and year throughout the infrastructure’s design lifetime. We visualized the results as a continuous stack of tornado plots for each year.
Application
Expansion of Sanitary Sewers in Brazil
We applied the proposed model as a demonstrative example in Brazil, where the government aims to increase the percentage of the population with sanitation services from 55% to 90% by 2033 (Brazil 2020). We applied our model to three of Brazil’s regional capital cities: Manaus (in the heart of the Amazon rainforest), Recife (located on the northeast coast), and Curitiba (in the southern part of the country). Notably, Recife has been ranked as the 16th most vulnerable city to climate change worldwide (IPCC 2014) and has received approximately $89 million of investment since 2018 to expand its sanitary sewer coverage in the next decade (by kilometers; Secovipe 2019).
Parameter Estimation
In this demonstrative application, we assumed that the sanitary sewer would be implemented in an area with an initial population () without access to a sewer infrastructure with an initial population density (). We assumed that the area served would remain constant during the infrastructure design’s lifetime and that the population growth would densify the served area. In the model, we took the groundwater infiltration coefficient () as fixed and modeled the uncertainty associated with: population growth (g), per capita demand (), peak per capita demand (—affected by and the peak factor, see Table S1 ), runoff coefficient (C), , and climate-affected rainfall intensity ().
To estimate the possible load, we also estimated based on Eq. (4), which requires an estimate of the spare capacity (r). The parameter estimates adopted for our examples in Recife, Curitiba, and Manaus are presented in Table 1 (see Tables S3 –S5 for more detailed information). To compare the case study cities, we modeled a neighborhood-sized area of 1.5 square kilometers, with an initial a population served () of 10,000, representing an initially dense neighborhood ( inhabitants per square kilometer; Dijkstra et al. 2021). We assumed that the operation started in 2020 and the infrastructure design lifetime was 30 years.
| Metric | Recife baseline [min, max] | Curitiba baseline [min, max] | Manaus baseline [min, max] | Source |
|---|---|---|---|---|
| Sewage production per capita () | 82 [80, 122] | 108 [77, 172] | 87 [56, 128] | Water consumption (SNIS 2023) return rate (ABNT 1986) |
| Population growth factor (%) | 7 [, 18] | 9 [, 18] | 33 [17, 43] | Baseline (IBGE 2023) min and max (United Nations 2019a) |
| (%) | 0.009 [0.005,0.21] | 0.012 [0.008, 0.26] | 0.010 [0.006, 0.20] | Fig. 2 |
| Impervious areas | 0.6 [0.3, 0.9] | 0.6 [0.3, 0.9] | 0.6 [0.3, 0.9] | Authors’ assumption |
| Climate change () | 88 [88, 148] | 81 [65, 136] | 102 [82, 171] | See Table |
We based our projected and possible average per capita sewage production () values based on available water data and a return rate of 80%, as recommended by Brazilian guidelines (ABNT 1986). We estimated the baseline (projected) sewage production per capita () based on each city’s initial (2020) average water consumption, as reported in Brazil’s National System for Water and Sanitation Data (SNIS) database (SNIS 2023). We took this initial as constant in time as our baseline scenario. Minimum and maximum estimates of per capita water consumption were unavailable for our case study cities; instead, we analyzed the water consumption in all capital cities in the same geographic region of Brazil (Northeast for Recife, North for Manaus, and South for Curitiba) and took the minimum and maximum values as the lowest and highest observed values in all capital cities within the same region. Finally, we modeled the possible per capita sewage production () as evolving linearly from the baseline (in 2020) to the minimum and maximum values in 2050 (the end of the infrastructure design’s lifetime).
The baseline (projected) population growth (g) was taken from the Brazilian Institute of Geography and Statistics (IBGE 2023). The lower and upper bounds were based on population growth rate projections for Brazil from the United Nations World Population Prospects (United Nations 2019a). The runoff coefficient, C, varies from 0 to 1, depending on land use. We assumed a constant baseline value of 0.6, simulating a residential area, with a linear increase in uncertainty over time, ultimately resulting in the minimum (maximum) bound being 50% (+50%) different from the baseline by 2050. While the lower bound () represents a significant increase in green spaces (i.e., creation of parks), the upper bound () represents a significant increase in impermeable surfaces (e.g., roads and parking lots; Chin 2013).
The initial rainfall intensity (i) was calculated using each city’s IDF for the baseline case (Table S2 ; Weschenfelder et al. 2014; Fendrich 1989; Monteiro and Braga 2018). We used a return period of 2 years and a time of concentration () of . To understand the impacts of climate change, we assumed that the time of concentration of the rainfall event would not change and the city’s rainfall intensity would increase or decrease by a factor, cc(t). The cc(t) variable was based on forecasts of how each city’s rainfall intensity would change due to climate change. For Recife, the estimations of the rainfall intensity were based on a local report by Júlio et al. (2019), Manaus and Curitiba were based on Santos et al. (2020). These localized estimates of changes in rainfall intensity are based on global models of climate change, which themselves are highly uncertain (Gettelman and Rood 2016).
Fraction of Stormwater Entering the Sanitary Sewer,
Our analytical focus on the fraction of stormwater entering the system () is novel, so values are not yet reported for sanitary sewer networks. Instead, we inferred plausible values of based on the recommended spare capacity in different design guidelines [, according to Eq. (4)]. To allow for the possibility that Brazil’s guidelines insufficiently account for stormwater inflow, we assessed the boundaries of using three guidelines: for Brazil (ABNT 1986), South Africa (Department of Human Settlements 2019), and Toronto (Qazi 2021). These guidelines differ as to how they anticipate and distinguish stormwater inflow and spare capacity (for air flow). We analyzed the Brazilian guidelines because of the cities’ locations in the application. South Africa is considered an emerging economy and a region-influencing country, as is Brazil (Kingah and Quiliconi 2016); importantly, South Africa has recently updated its sanitary sewer design guidelines (Department of Human Settlements 2019). Toronto also has recently updated its sanitary sewer guidelines, and, during the past decade, efforts have been made in the region to improve the management of stormwater inflow and infiltration in the sanitation infrastructure (Kesik 2015; Sandink and Robinson 2022).
For each studied city in Brazil, we computed what its would be if it were designed using each of these guidelines. To calculate , two types of variables are needed: (1) variables intrinsic to the guideline being used; and (2) variables inherent to the city that the system is being designed for. First, the values of spare capacity (r), the sewage peak factor () and the infiltration coefficient () can be found in the design guidelines (see Supplemental Materials Section S.1.1 and Table S1 for detailed information). Second, the runoff coefficient (C), the rainfall intensity (), the population density (), the sewage production (), and the population growth rate (g) rely on the cities’ unique characteristics. Therefore, the values of vary based on both the city and the design guideline used.
While Brazil and South Africa have country-level guidelines, Canadian guidelines vary by city. Both Brazilian and South African guidelines include a range of possible infiltration coefficients (), resulting in a range of possible values (Fig. 2). South Africa’s guidelines also have a peak factor range, magnifying the range of the possible values of (Fig. 2; see Supplemental Materials Section S.1.1 for more detailed information). Comparing the countries, Brazilian guidelines resulted in the lowest value of . Absent direct comparisons between construction quality in these contexts, we included all three guidelines in our range of possible values of . We based our analysis of uncertainty on the baseline case for in the scenario where the network would be designed following Brazilian guidelines, with , , and . We took the maximum and minimum values of for each city, based on the highest and lowest possible values of resulting from applying any of the three guidelines to that city for all (Fig. 2).
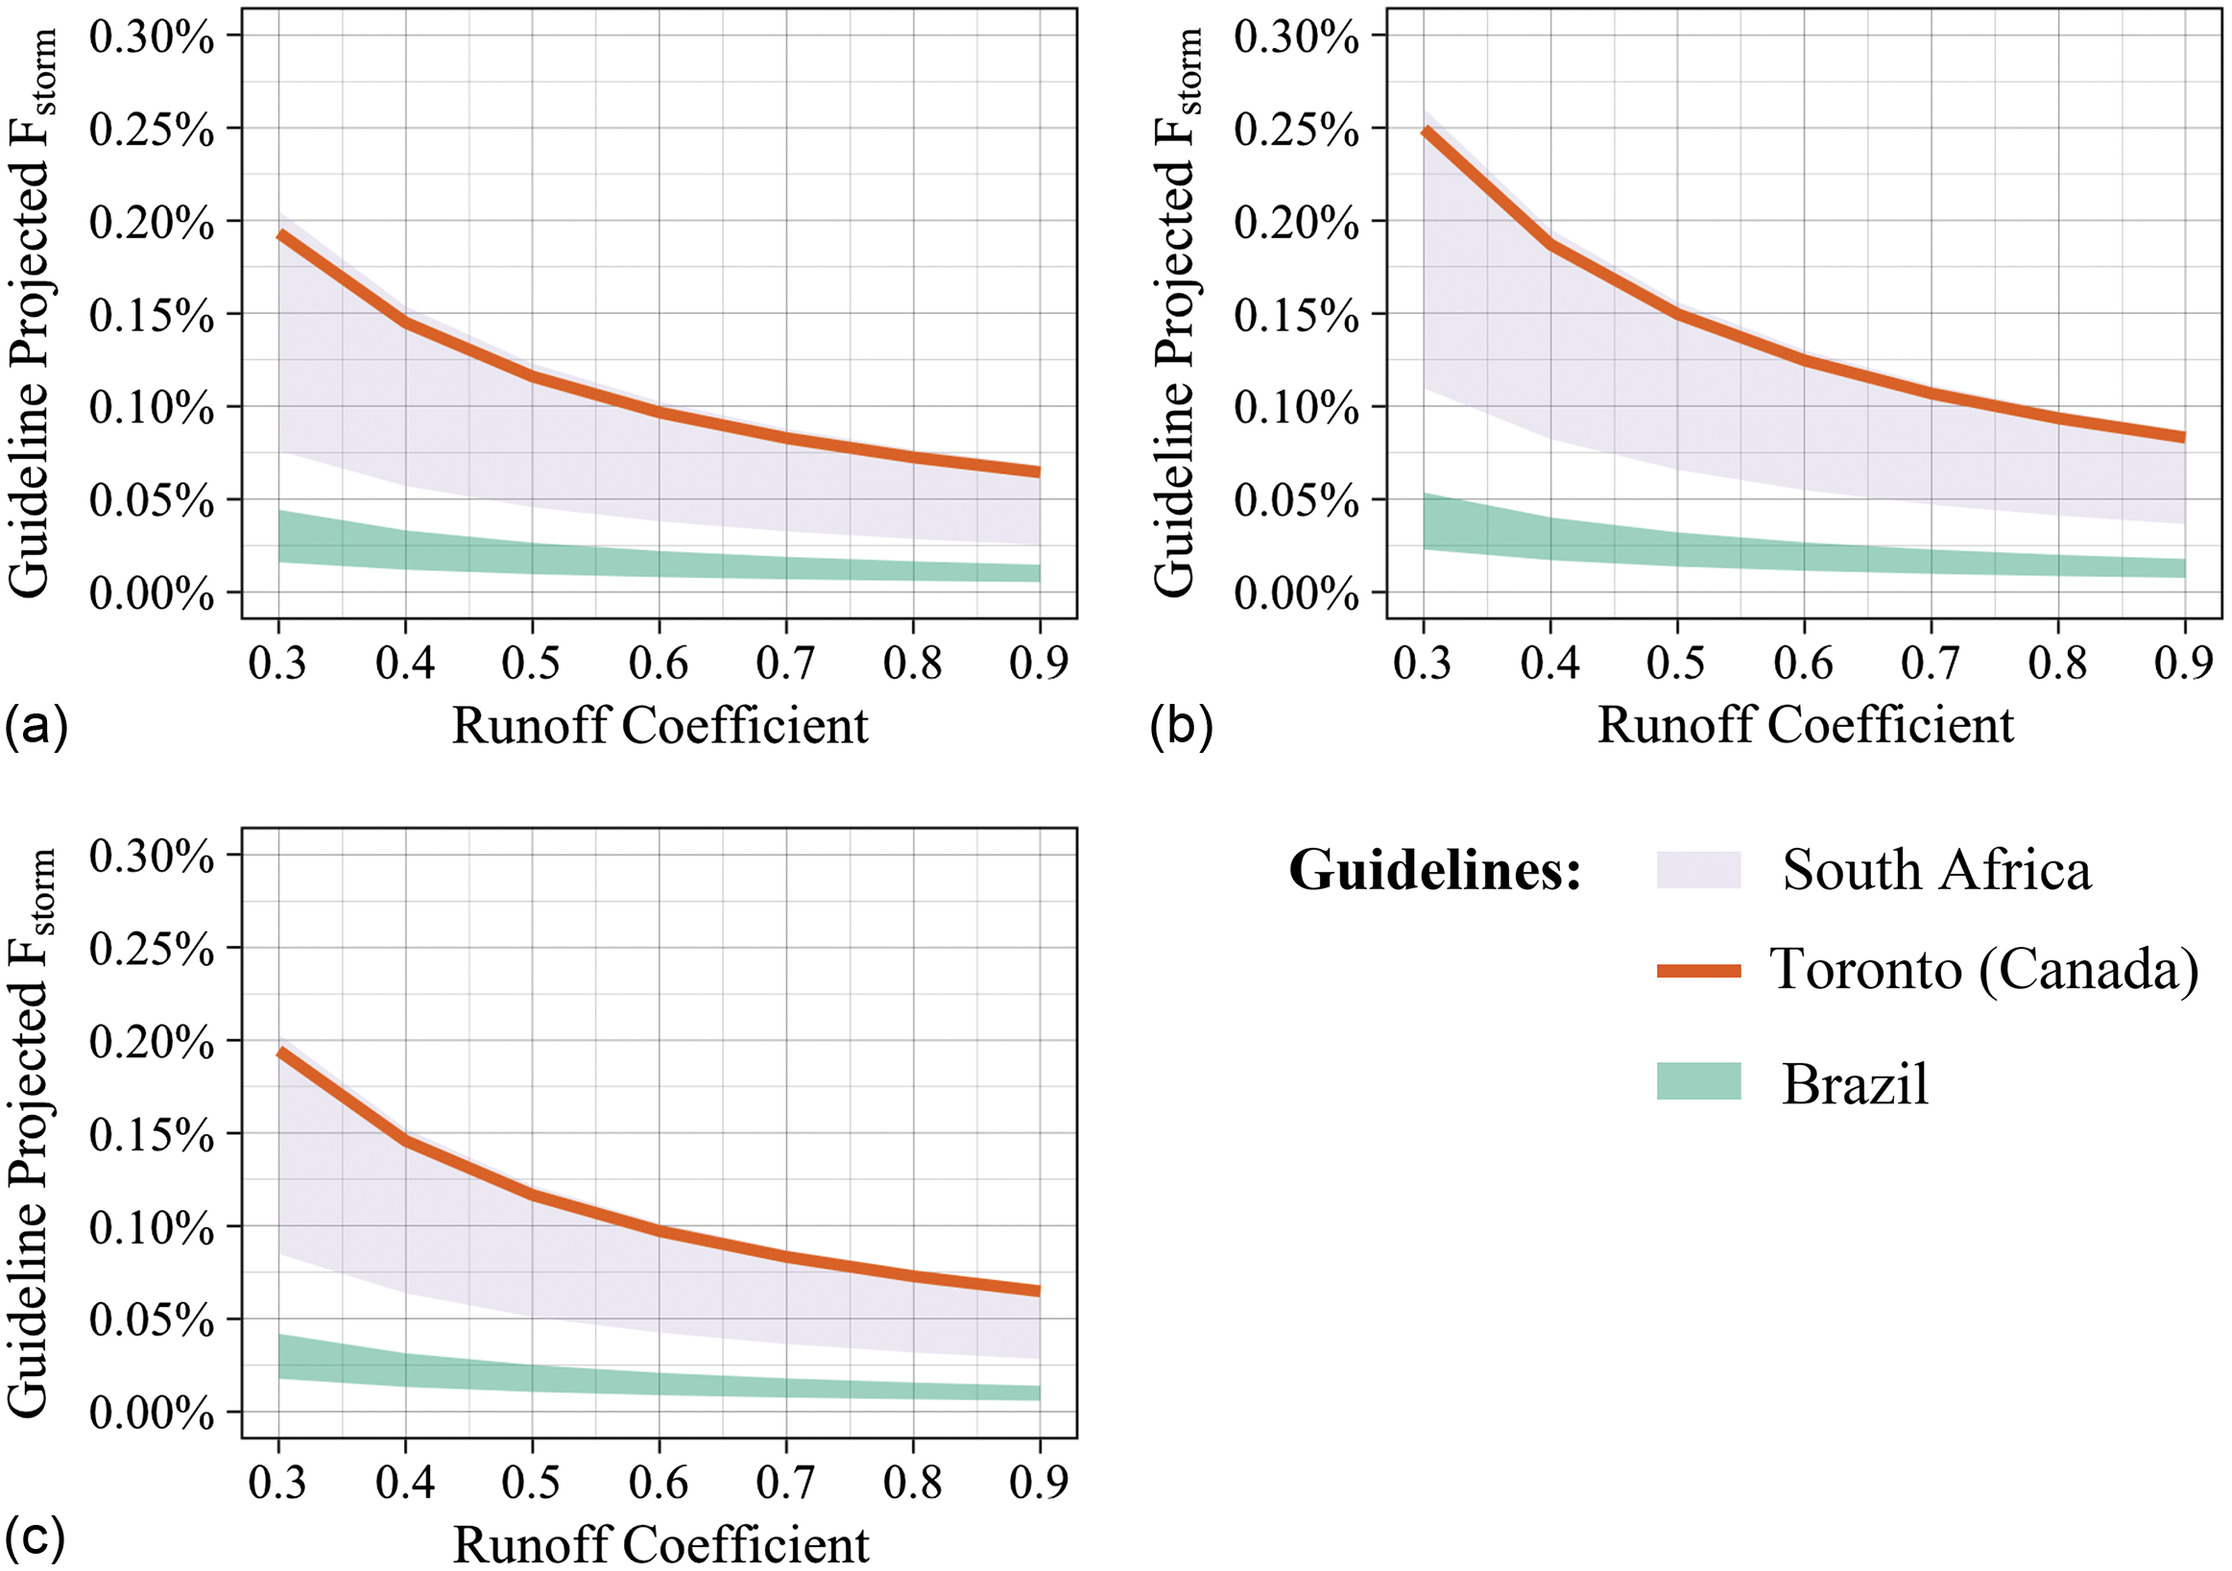
Our computation of guideline-projected values ranged from 0.005% (in Recife when using Brazil’s guideline) to 0.26% (in Curitiba when using South Africa’s guideline); see Fig. 2. This wide range of is in part due to our use of three guidelines. If we had used only Brazilian guidelines, the uncertainty range of would have been 11-fold instead of 52-fold. Based on this sizable difference, we include a supplementary analysis based only on Brazil’s guidelines in the Fig. S1 . While both Recife [Fig. 2(a)] and Manaus [Fig. 2(c)] had similar ranges of guideline-projected , Curitiba’s lower rainfall intensity resulted in the highest values of [Fig. 2(b)]. The intensity of projected rainfall () is inversely correlated with [Eq. (4)]: a lower projected rainfall intensity results in lower projected stormwater runoff, which in turn increases the projected fraction of stormwater inflow that can safely be collected in the system.
Uncertainty at the End of the Infrastructure Lifetime
At the end of the infrastructure design lifetime (; year 2050), a one-way sensitivity analysis showed that the fraction of stormwater entering the sanitary sewer is the most relevant uncertainty for all three cities. In each city, stormwater inflow could cause the possible load to exceed the projected load by more than 2.6 times [Fig. 3(a)], dominating the range of uncertainty. For each city, was at least 1.7 times more important than the per capita sewage production and at least 2.4 times more important than climate change [Fig. 3(a)].
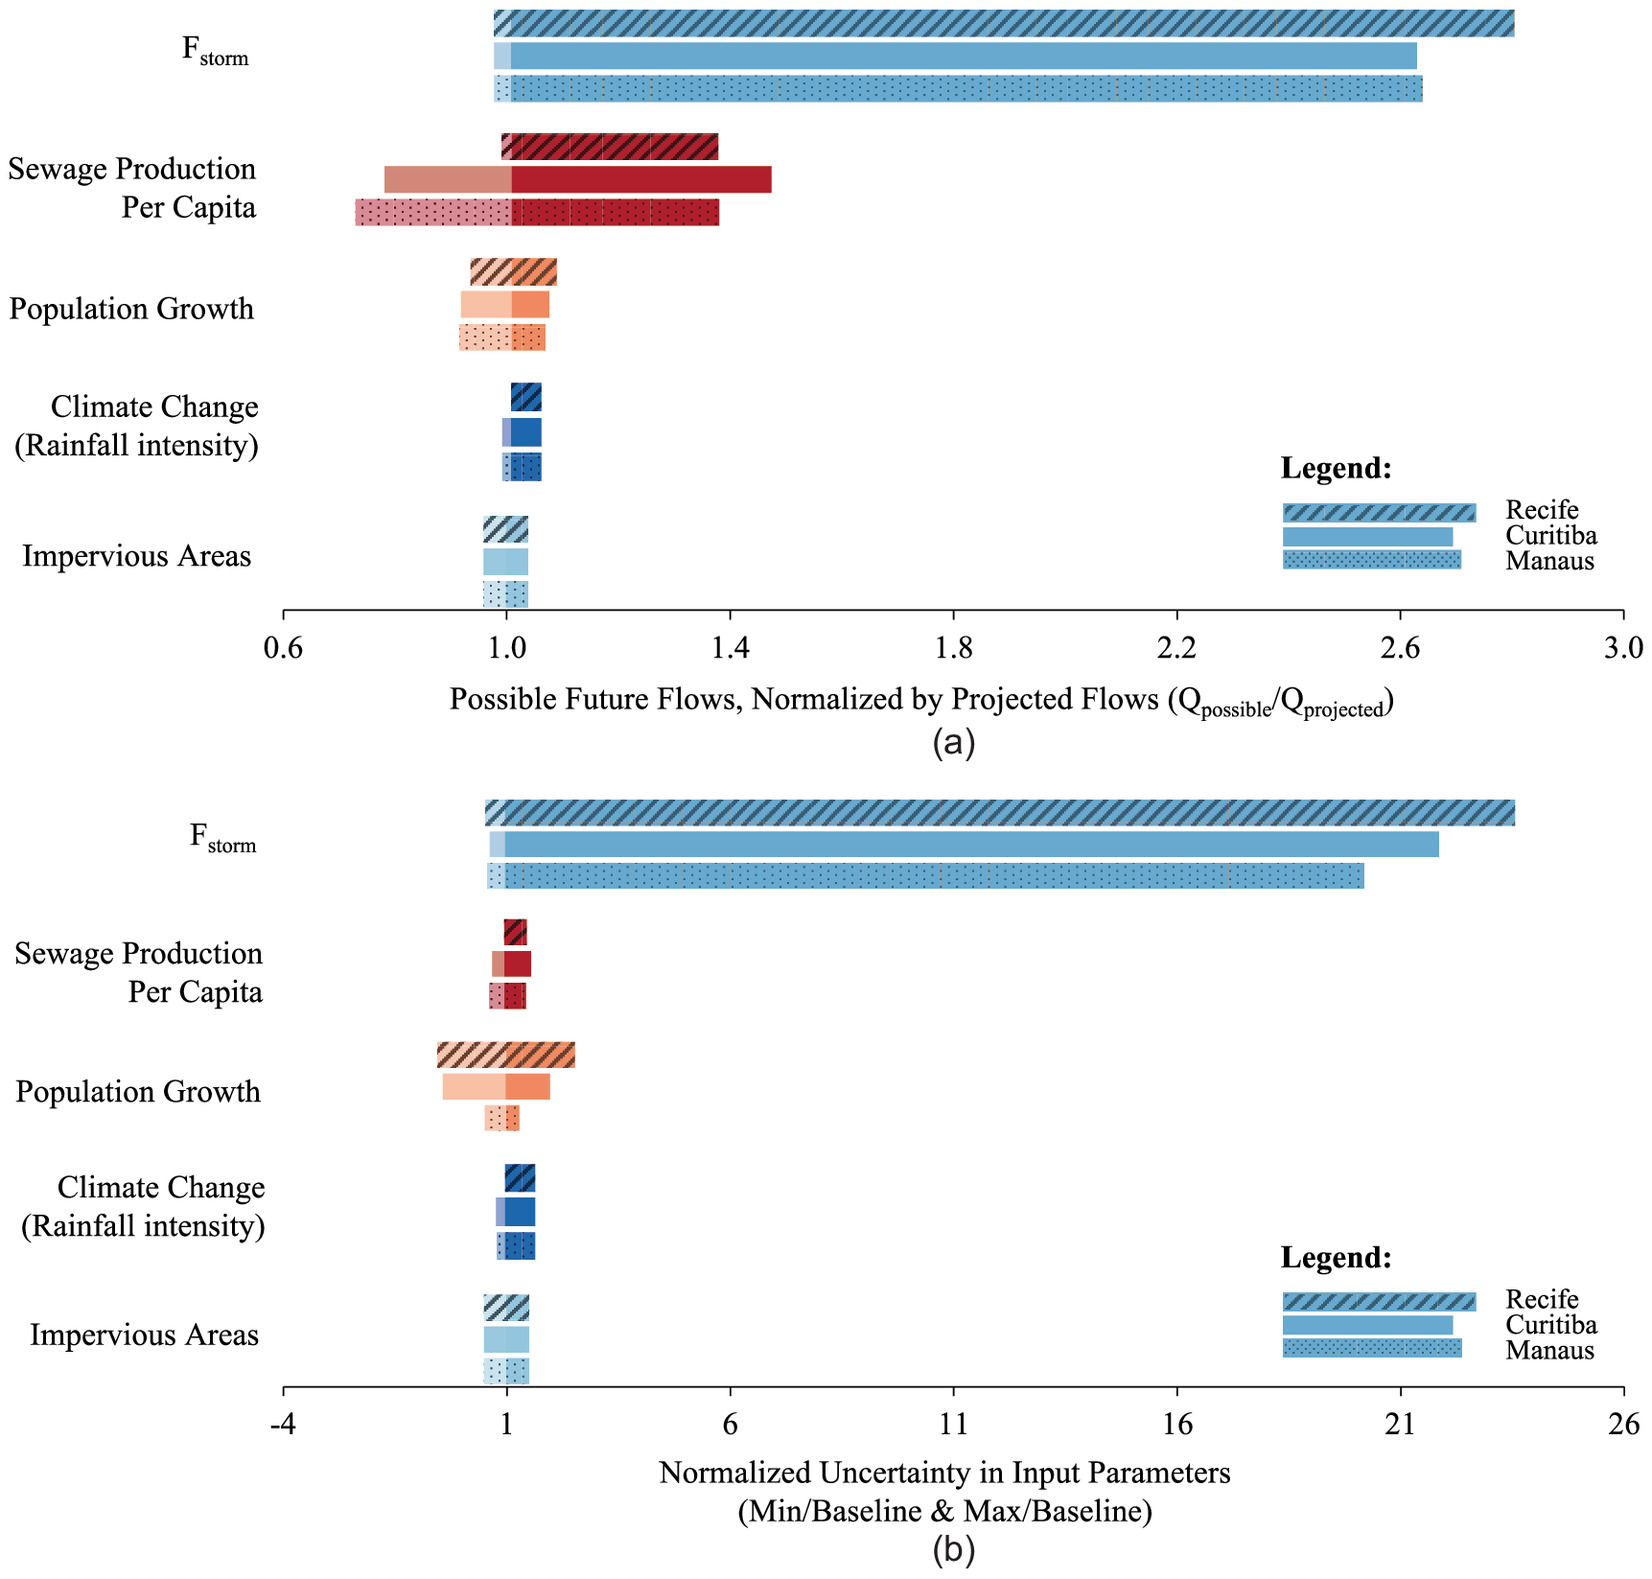
The dominance of in the output of our uncertainty analysis is the direct result of our projected uncertainty. For each city, the ratio of possible maximum and minimum values in 2050 is , an order of magnitude larger than the next largest range [ for sewage production in 2050; see Fig. 3(b)]. This large range is in part a result of our use of multiple guidelines (Fig. 2). Since is a novelty of the study, measured values of are not available; instead, we used Brazil’s design guidelines, as well as two others, to allow for the possibility that is underestimated in Brazil’s guidelines. A supplemental analysis based only on Brazil’s guidelines found that the importance of had a similar magnitude as (and was slightly smaller than) the per capita sewage production (Fig. S1 ).
Both the climate change factor and the runoff coefficient resulted in a similar variation in the ratio in 2050 [Fig. 3(a)], which suggests a concerning limit to our ability to control stormwater flows through increased green space control. For example, Júlio et al. (2019) predicted that climate change will increase rainfall by 68% in Recife, which our model suggests would increase the sanitary sewer flows rate by approximately 5% in 2050. Mitigating this 5% increase in sewer flows would require a reduction of more than 68% in the C factor, which is likely impossible in an urban environment (baseline , a 68% reduction would be ).
Uncertainties associated with the sewage flow (per capita sewage production and population growth factor) affect the flow rate more than the climate change and runoff coefficients. In 2050, the range of possible per capita sewage production rates could increase (decrease) the possible flow rate by 37% to 47% ( to ), depending on the city. The range of possible population growth rates could increase (decrease) flows by 6% to 8% ( to ), again depending on the city. Controlling both variables represents an important opportunity to limit sewer flow rates. For example, decreasing water consumption (perhaps by regulating the water price) reduces sewage production, thus decreasing the flow rate. Alternatively, controlling a city’s master plan can result in different rates for the population growth in the sewer-served area, also affecting the sewer’s flow rate.
Temporal Uncertainty
While many parameters are known in 2020 and become uncertain as 2050 approached, is uncertain at time zero (2020). In each of the three cities (Recife, Curitiba, and Manaus), uncertainty evolves asymmetrically due to the asymmetrical nature of the estimators used for population growth, sewage production per capita, and climate change (Fig. 4 and Table 1). While sewage production per capita and population growth effects are independent of [Eq. (1) and Fig. 4], larger initial values of magnify the effects of climate change and runoff coefficient uncertainties [Fig. 4(c)].
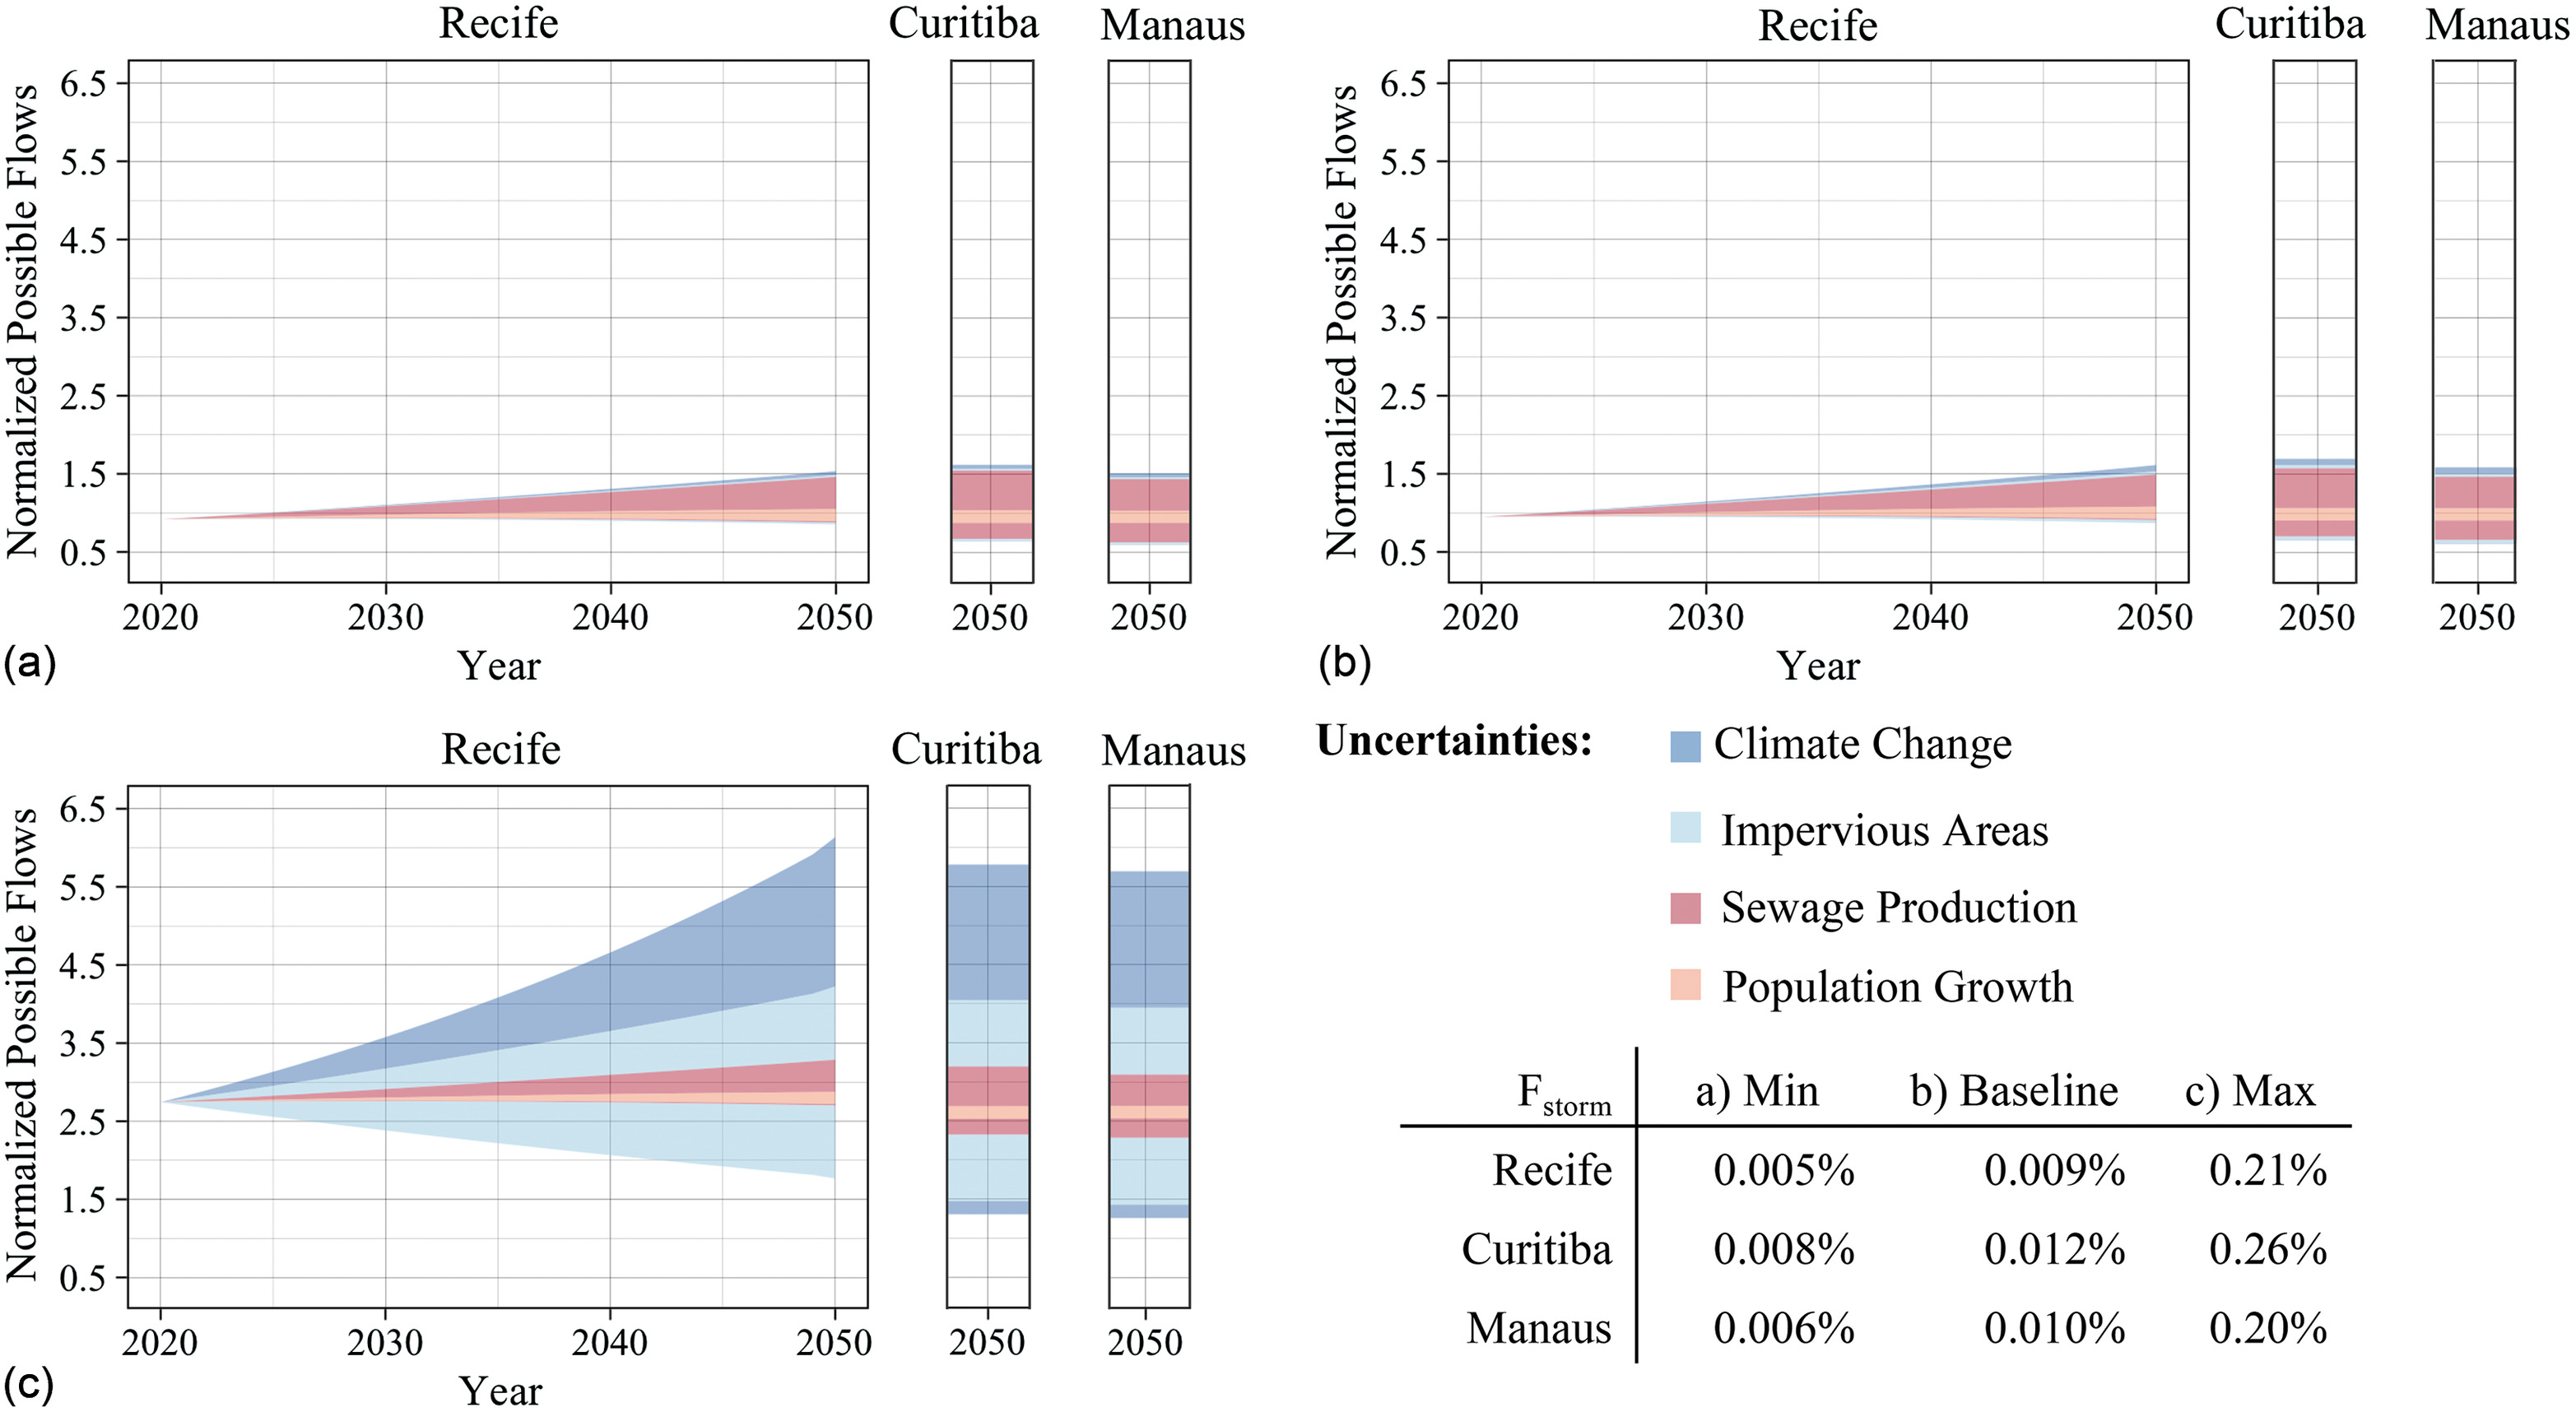
Controlling the amount of stormwater that enters the system () is the most important variable for reducing the inflow and the flow rate in the sanitary sewer throughout the sewer’s lifespan. Decreasing reduces the total inflow in the system, offering a way to mitigate the possible impacts of other uncertainties or the baseline. Conversely, if is equal to or less than the value projected in our baseline design [as in Figs. 4(a and b)], reducing sewage production becomes the most effective way to reduce sewer flows during the sewer’s lifespan. In these cases, the uncertainty of sewage production per capita and population growth has a larger effect than uncertainty of climate change, similar to the results shown in Fig. 3.
Sensitivity Analysis
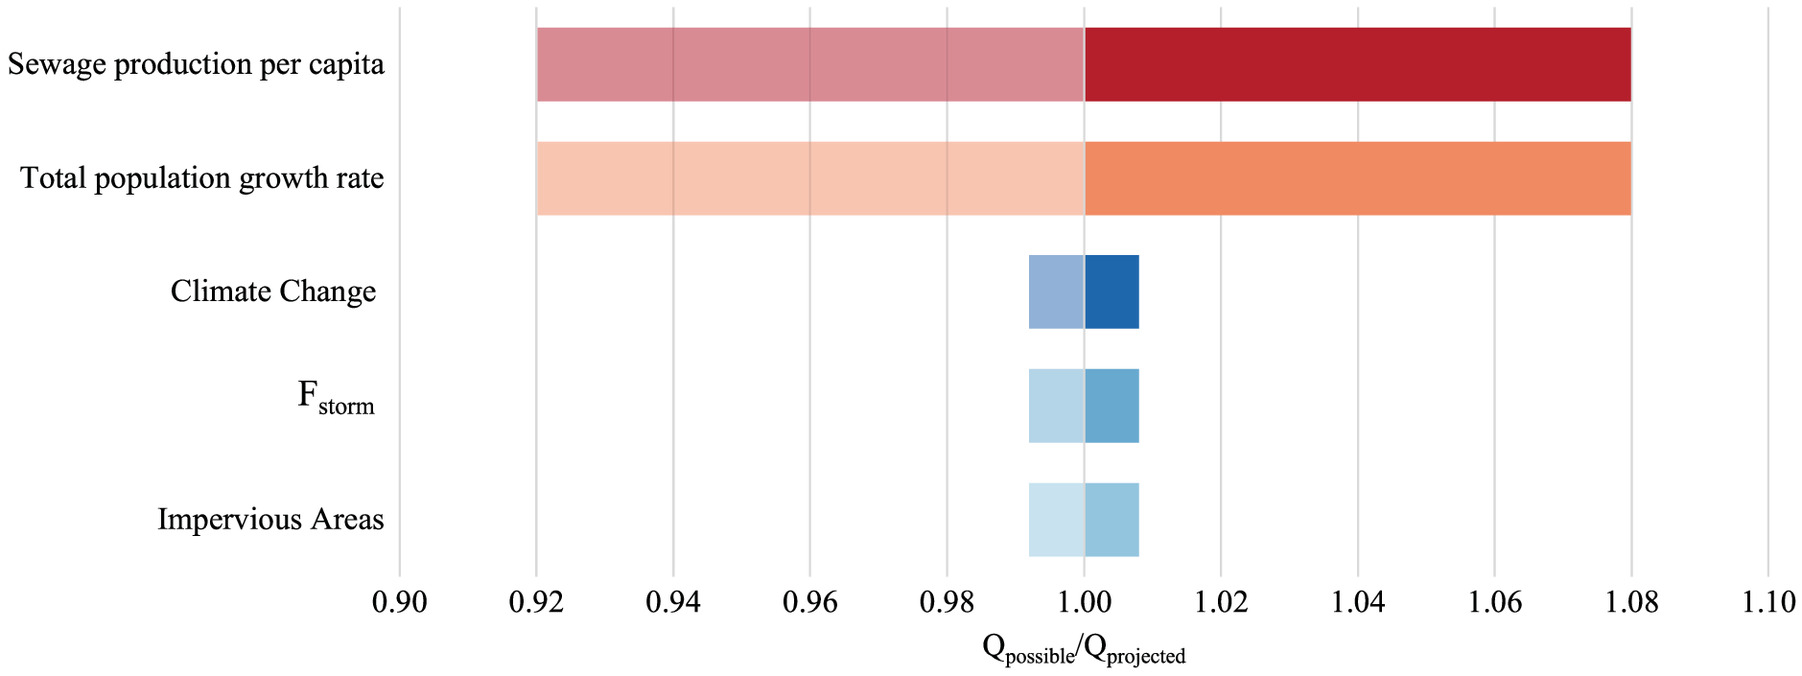
Fig. 5 shows the sanitary sewer model sensitivity for change in all five variables. An increase or decrease of 10% in any inflow-related variables (i.e., runoff coefficient, , and climate change) affects the sanitary sewer performance similarly and subtly by a factor of for the baseline values of . Conversely, an increase or decrease of 10% in the sewage production or population growth had a larger, direct effect, altering flows by an increase or decrease of 8% compared to the baseline case. The low baseline level of means that sewer flows are dramatically more sensitive to changes in sewage production variables (sewage production and population growth) than stormwater-related ones. For example, sewer flows can be reduced by 5% in the baseline case by either reducing per capita sewage production by 6.25% (e.g., by using water management strategies) or reducing the runoff coefficient by 62.5% (from to ). Inflow management and water demand control are key to sewer performance.
Discussion
Our proposed variable enables a direct comparison of inflow into sewer networks in different climate regions and can be used to explicitly model the impacts of climate change and impervious areas. Conventionally, stormwater is accounted for in terms of its percentage of sanitary flows (e.g., Jenssen Sola et al. 2018; Rödel et al. 2017). But measuring stormwater inflow as a percent of total flow confounds sewer construction quality with city and climate characteristics (Diem et al. 2022). allowed us to consistently compare utilities based on the degree of sewer separation in cities with different (and changing) climates. In this respect, is similar to other cross-context benchmarks like the International Infrastructure Leakage Index, which is a dimensionless indicator to compare the performance of water distribution systems worldwide (Alegre et al. 2016; Lambert and McKenzie 2002; Winarni 2009).
Actual values of stormwater entering the sewer network depend on the city’s climate and the construction quality of the infrastructure. To estimate stormwater inflow in our study of three cities in Brazil, we used three guidelines (for Brazil, South Africa, and Toronto), resulting in a theoretical range of for each city (Fig. 2). This range was much larger than if we had used only Brazil’s guidelines; South Africa’s and Toronto’s guidelines offered upper-bound values for . Our additional analysis based only on Brazilian guidelines found that was one of the two most important sources of uncertainty. To avoid the need for such assumptions, future studies quantifying stormwater inflow and infiltration in Brazil will be essential to enhancing the resilience of sanitary sewers in the country. Mitigating the amount of stormwater that can flow into sanitary sewers is a critical climate change mitigation strategy. Previous research on sewer capacity has focused on overflows in combined sewers (), where overflow events are expected to increase (in frequency and volume) due to climate change (McGrath et al. 2019; Urich and Rauch 2014; Riechel et al. 2016). That climate-change-mitigation research focuses on reducing stormwater runoff to reduce sewer overflows (through retention and detention strategies; McGrath et al. 2019; Urich and Rauch 2014; Mugume et al. 2015). Distinctly, our model emphasizes the importance and controllability of . The effects of extreme rainfall events are mediated (magnified or mitigated) by .
Our work demonstrates that as stormwater inflow is progressively reduced (i.e., approaches 0), sanitary sewers become more resilient to the impacts of climate change. In this respect, our findings extend the recommendations from the World Bank and other organizations on building climate-resilient infrastructure (Kirshen et al. 2015), which emphasizes replacing combined sewers with separate storm and sanitary sewers. Building on that work, our research emphasizes the importance of construction quality and inflow minimization. Beneficially, reductions in inflow also free up sewer capacity to support urbanization and water consumption increases (Toronto Water, Environment and Energy Division 2018; Mass DEP 2017).
Sanitary sewers need not operate with high values of . While is critical, its value is highly uncertain, rendering it almost twice as influential as other uncertainties that we considered. Understanding, measuring, and reducing should become a key part of commissioning, operating, and improving sanitary sewers, particularly in LMICs, where data on inflows (let alone ) is concerningly absent. This finding also extends to condominial sewers; while they are considered a successful low-cost sanitation technology by some (Mara 2013), the unexpected collection of stormwater in this infrastructure could compromise the safety of their sewage collection during rainfall events. Utilities should focus on mitigating and minimizing the paths by which stormwater enters sanitary sewers, reducing cross-connections between sanitary and stormwater systems, separating the household storm drains and laterals from the sanitary network, using watertight connections at maintenance holes and pipe junctions, and inspecting and testing the sanitary sewer network at commissioning and as part of routine maintenance (Kesik 2015).
Reductions in are complemented by reductions in sanitary flows. Where is small, utilities can further reduce the risk of sewer overflows by reducing sanitary flows. Specifically, we recommend that utilities pursue inflow reduction while also working to reduce sewage production by reducing water consumption (e.g., via increased tariffs) and reduce population growth in areas with limited sewage capacity and/or in areas prone to inflow (e.g., via the city master plans; Mahaut and Andrieu 2019). Where such reductions are not possible, intense efforts to reduce are recommended.
Integrating stormwater inflow into models of sanitary sewer is essential to a robust expansion of sewerage. To enable our model’s application to data-scarce environments (e.g., many LMICs), we introduced four key simplifications that limit the accuracy of our results. First, we modeled stormwater runoff using the rational method and limited our analysis to typical but fixed values for the design storm’s return period and time of concentration. Second, we modeled the worst-case scenario, when the peak stormwater flow occurs simultaneously with peak sewage flow, which overestimates the risk of overflow. Third, we simplified the effects of climate change, modeling the anticipated increases in the intensity of extreme storms, which are often underestimated; such underestimates would reduce our model’s predicted importance of both rainfall and . Finally, we used Brazilian guidelines as the baseline scenario for our uncertainty analysis; as those guidelines resulted in a small value of ; this baseline mitigated our predicted climate change effects.
Conclusion
Uncertainty must be considered at the design stage to ensure reliable sewer performance, especially in LMICs with sparse or unreliable historical data. Here, we developed a simple hydraulic-mathematical model that compares five uncertainties affecting the sanitary network: sewage production, population growth, impervious areas, the fraction of stormwater flowing into the sewer network, and climate-change-affected rainfall intensity. We identified that the fraction of stormwater inflow collected in the sanitary sewer is the biggest threat to urban sanitation. To achieve robust sanitary sewer expansion, it is critical to include stormwater considerations in the design and operation of sanitary sewers. The present level of imprecision about how much stormwater inflow is collected in sanitary systems leaves these networks vulnerable to extreme rainfall events, which may compromise the ability to achieve the SDGs. The proposed sanitary sewer model developed in this study can provide high-level insights to policymakers about the local threats to safe sanitation of future uncertainties. Furthermore, the model can be applied in places with scarce or unreliable historical data and future projections.
Supplemental Materials
File (supplemental materials_jwrmd5.wreng-6411_marega.pdf)
- Download
- 627.33 KB
Data Availability Statement
All data, models, and code generated or used during the study are available in an online repository in accordance with funder data retention policies: https://doi.org/10.5683/SP3/TLRPRX.
Acknowledgments
Support for D. Meyer and G. Marega was provided in part by the Natural Science and Engineering Research Council of Canada (NSERC; RGPIN-2019-04969), the Government of Canada’s New Frontiers in Research Fund (NFRF; NFRFE-2018-01627), and the University of Toronto’s Centre for Global Engineering.
References
ABNT (Associação Brasileira de Normas Técnicas). 1986. Projeto de Redes Coletoras de Esgoto Sanitário [Sanitary sewage collection networks project design guideline]. [In Portuguese.] NBR 9649. Rio de Janeiro, Brazil: ABNT.
Ahmadi, A., M. A. Zolfagharipoor, and M. Nafisi. 2018. “Development of a hybrid algorithm for the optimal design of sewer networks.” J. Water Resour. Plann. Manage. 144 (8): 04018045. https://doi.org/10.1061/(ASCE)WR.1943-5452.0000942.
Alegre, H., J. M. Baptista, E. Cabrera, F. Cubillo, P. Duarte, W. Hirner, W. Merkel, and R. Parena. 2016. Performance indicators for water supply services. London: International Water Association Publishing.
Ashoori, N., D. A. Dzombak, and M. J. Small. 2017. “Identifying water price and population criteria for meeting future urban water demand targets.” J. Hydrol. 555 (Dec): 547–556. https://doi.org/10.1016/j.jhydrol.2017.10.047.
Astaraie-Imani, M., Z. Kapelan, G. Fu, and D. Butler. 2012. “Assessing the combined effects of urbanisation and climate change on the river water quality in an integrated urban wastewater system in the UK.” J. Environ. Manage. 112 (Dec): 1–9. https://doi.org/10.1016/j.jenvman.2012.06.039.
Boland, J. J., and D. P. Loucks. 2021. “Infrastructure capacity planning for reducing risks of future hydrologic extremes.” Water Policy 23 (S1): 188–201. https://doi.org/10.2166/wp.2021.242.
Brazil. 2020. “Lei 14 026 de 15 de Julho de 2020: Novo Marco Legal do Saneamento Básico [The new framework for sanitation].” [In Portuguese.] Accessed July 24, 2024. https://www.planalto.gov.br/ccivil_03/_ato2019-2022/2020/lei/l14026.htm.
Brelsford, C., E. T. Coon, E. Moran, and M. Allen-Dumas. 2020. “Urban scaling as validation for predictions of imperviousness from population.” Geophys. Res. Lett. 47 (23): e2020GL089742. https://doi.org/10.1029/2020GL089742.
Burian, S. J., S. J. Nix, S. R. Durrans, R. E. Pitt, C.-Y. Fan, and R. Field. 1999. “Historical development of wet-weather flow management.” J. Water Resour. Plann. Manage. 125 (1): 3–13. https://doi.org/10.1061/(ASCE)0733-9496(1999)125:1(3).
Chin, D. A. 2013. Water resources engineering. Upper Saddle River, NJ: Pearson Education.
Department of Human Settlements. 2019. Sanitation on the neighbourhood planning and design guide. Pretoria, South Africa: Dept. of Human Settlements.
Diem, J. E., L. A. Pangle, R. A. Milligan, and E. A. Adams. 2022. “How much water is stolen by sewers? Estimating watershed-level inflow and infiltration throughout a metropolitan area.” J. Hydrol. 614 (Nov): 128629. https://doi.org/10.1016/j.jhydrol.2022.128629.
Dijkstra, L., A. J. Florczyk, S. Freire, T. Kemper, M. Melchiorri, M. Pesaresi, and M. Schiavina. 2021. “Applying the degree of urbanisation to the globe: A new harmonised definition reveals a different picture of global urbanization.” J. Urban Econ. 125 (Sep): 103312. https://doi.org/10.1016/j.jue.2020.103312.
Duque, N., P. M. Bach, L. Scholten, F. Fappiano, and M. Maurer. 2022. “A simplified sanitary sewer system generator for exploratory modelling at city-scale.” Water Res. 209 (Feb): 117903. https://doi.org/10.1016/j.watres.2021.117903.
Fendrich, R. 1989. Chuvas intensas na estação pluviográfica Curitiba. Prado Velho (PUC-PR) [Intense rains at the Curitiba rain gauge Prado Velho (PUC-PR)]. [In Portuguese.] Curitiba, Brazil: ISAM/Pontifícia Universidade Católica do Paraná.
Gettelman, A., and R. B. Rood. 2016. Demystifying climate models: A users guide to Earth system models. Berlin: Springer.
Greve, P., et al. 2018. “Global assessment of water challenges under uncertainty in water scarcity projections.” Nat. Sustainability 1 (9): 486–494. https://doi.org/10.1038/s41893-018-0134-9.
Howard, G., R. Calow, A. Macdonald, and J. Bartram. 2016. “Climate change and water and sanitation: Likely impacts and emerging trends for action.” Annu. Rev. Environ. Resour. 41 (1): 253–276. https://doi.org/10.1146/annurev-environ-110615-085856.
IBGE (Instituto Brasileiro de Geografia e Estatística). 2023. “Projeção Populacional Brasileira” [Brazilian population projection]. [In Portuguese.] Accessed September 19, 2023. https://cidades.ibge.gov.br/brasil/panorama.
IPCC (Intergovernmental Panel on Climate Change). 2014. Climate change 2014—Synthesis report: Contribution of working groups I, II and III to the fifth assessment report of the intergovernmental panel on climate change. Geneva: IPCC.
IPCC (Intergovernmental Panel on Climate Change). 2023. Climate change 2022—Impacts, adaptation and vulnerability: Working group II contribution to the sixth assessment report of the intergovernmental panel on climate change. Cambridge, UK: Cambridge University Press.
ISF-UTS and SNV (Insitute for Sustainable Futures—University of Technology Sydney and SNV). 2019. Considering climate change in urban sanitation: Conceptual approaches and practical implications. Hague, Netherlands: SNV.
Jagai, J. S., S. DeFlorio-Barker, C. J. Lin, E. D. Hilborn, and T. J. Wade. 2017. “Sanitary sewer overflows and emergency room visits for gastrointestinal illness: Analysis of Massachusetts data, 2006–2007.” Environ. Health Perspect. 125 (11): 117007. https://doi.org/10.1289/EHP2048.
Jenssen Sola, K., J. T. Bjerkholt, O. G. Lindholm, and H. Ratnaweera. 2018. “Infiltration and inflow (I/I) to wastewater systems in Norway, Sweden, Denmark, and Finland.” Water 10 (11): 1696. https://doi.org/10.3390/w10111696.
JMP (Joint Monitoring Programme). 2023. Progress on household drinking water, sanitation and hygiene 2000–2022: Special focus on gender. New York: United Nations Children’s Fund and World Health Organization.
Júlio, G., M. Amoni, H. Pereira, S. Margulis, G. Pitta, and I. Martins. 2019. Análise de Riscos e Vulnerabilidades Climáticas e Estratégia de Adaptação do Município de Recife PE. Resumo para Tomadores de Decisão [Analysis of climate risks and vulnerabilities and adaptation strategy of the municipality of Recife PE: Summary for decision makers]. [In Portuguese.] Recife, Brazil: Prefeitura de Recife and Banco de Desarrollo da América Latina.
Kesik, T. 2015. Best practices guide: Management of inflow and infiltration in new urban developments. Toronto: Institute for Catastrophic Loss Reduction.
Kingah, S., and C. Quiliconi. 2016. Global and regional leadership of BRICS countries. United Nations University series on regionalism. Cham, Switzerland: Springer International Publishing.
Kirshen, P., L. Caputo, R. M. Vogel, P. Mathisen, A. Rosner, and T. Renaud. 2015. “Adapting urban infrastructure to climate change: A drainage case study.” J. Water Resour. Plann. Manage. 141 (4): 04014064. https://doi.org/10.1061/(ASCE)WR.1943-5452.0000443.
Lambert, A. O., and D. R. D. McKenzie. 2002. “Practical experience in using the infrastructure leakage index.” In Vol. 2 of Proc., Int. Water Association Conf. (IWA)—Leakage Management: A Practical Approach. London: International Water Association.
Mahaut, V., and H. Andrieu. 2019. “Relative influence of urban-development strategies and water management on mixed (separated and combined) sewer overflows in the context of climate change and population growth: A case study in Nantes.” Sustainable Cities Soc. 44 (Jan): 171–182. https://doi.org/10.1016/j.scs.2018.09.012.
Mara, D. 2013. “Pits, pipes, ponds—And me.” Water Res. 47 (7): 2105–2117. https://doi.org/10.1016/j.watres.2013.01.051.
Mara, D. 2018. “‘Top-down’ planning for scalable sustainable sanitation in high-density low-income urban areas: Is it more appropriate than ‘bottom-up’ planning?” J. Water Sanit. Hyg. Dev. 8 (2): 165–175. https://doi.org/10.2166/washdev.2018.101.
Mass DEP (Massachusetts Department of Environmental Protection). 2017. Guidelines for performing infiltration/inflow analyses and sewer system evaluation surveys. Boston: Mass DEP.
McGrath, G., T. Kaeseberg, J. D. Reyes Silva, J. W. Jawitz, F. Blumensaat, D. Borchardt, P. Mellander, K. Paik, P. Krebs, and P. S. C. Rao. 2019. “Network topology and rainfall controls on the variability of combined sewer overflows and loads.” Water Resour. Res. 55 (11): 9578–9591. https://doi.org/10.1029/2019WR025336.
Mikhael, G., L. Hyde-Smith, B. Twyman, D. S. Trancón, E. Jabagi, and E. Bamford. 2021. Climate resilient urban sanitation: Accelerating the convergence of sanitation and climate action. Eschborn, Germany: Deutsche Gesellschaft für Internationale Zusammenarbeit GmbH.
Monteiro, M. M., and E. M. Braga. 2018. “Análise da Equação IDF de Manaus” [Analysis of the Manaus IDF equation]. [In Portuguese.] Accessed July 25, 2024. https://www.even3.com.br/anais/5sicasa/93264-analise-da-equacao-idf-de-manaus/.
Mugume, S. N., K. Diao, M. Astaraie-Imani, G. Fu, R. Farmani, and D. Butler. 2015. “Enhancing resilience in urban water systems for future cities.” Water Supply 15 (6): 1343–1352. https://doi.org/10.2166/ws.2015.098.
Nasrin, T., A. Sharma, and N. Muttil. 2017. “Impact of short duration intense rainfall events on sanitary sewer network performance.” Water 9 (3): 225. https://doi.org/10.3390/w9030225.
Navin, P. K., Y. P. Mathur, and D. Kumar. 2019. “Layout optimization of sewer network using minimum cumulative flow in the sewer network.” In Advances in waste management: Select proceedings of recycle, edited by A. S. Kalamdhad, J. Singh, and K. Dhamodharan, 333–343. Singapore: Springer.
Neder, K. D. 2000. Condominial sewerage design and implementation manual. Brasilia, Brazil: Companhia de Saneamento Ambiental do Distrito Federal.
Owolabi, T. A., S. R. Mohandes, and T. Zayed. 2022. “Investigating the impact of sewer overflow on the environment: A comprehensive literature review paper.” J. Environ. Manage. 301 (Aug): 113810. https://doi.org/10.1016/j.jenvman.2021.113810.
Qazi, G. 2021. Design criteria for sewers and watermains. Toronto: City of Toronto.
Riechel, M., A. Matzinger, E. Pawlowsky-Reusing, H. Sonnenberg, M. Uldack, B. Heinzmann, N. Caradot, D. von Seggern, and P. Rouault. 2016. “Impacts of combined sewer overflows on a large urban river—Understanding the effect of different management strategies.” Water. Res. 105 (Nov): 264–273. https://doi.org/10.1016/j.watres.2016.08.017.
Rödel, S., F. W. Günthert, and T. Brüggemann. 2017. “Investigating the impacts of extraneous water on wastewater treatment plants.” Water Sci. Technol. 75 (4): 847–855. https://doi.org/10.2166/wst.2016.570.
Sandink, D., and B. Robinson. 2022. “Wastewater system inflow/infiltration and residential pluvial flood damage mitigation in Canada.” Water 14 (11): 1716. https://doi.org/10.3390/w14111716.
Santos, D. J. D., G. U. Pedra, M. G. B. da Silva, C. A. Guimarães Júnior, L. M. Alves, G. Sampaio, and J. A. Marengo. 2020. “Future rainfall and temperature changes in Brazil under global warming levels of 1.5oC, 2oC and 4oC.” Sustentabilidade Debate 11 (3): 57–90. https://doi.org/10.18472/SustDeb.v11n3.2020.33933.
Satterthwaite, D., V. A. Beard, D. Mitlin, and J. Du. 2019. Untreated and unsafe: Solving the urban sanitation crisis in the global South. Washington, DC: World Resources Institute.
Secovipe. 2019. “Investimentos anunciados para o estado podem impactar no mercado imobiliário” [Investments announced for the state could affect the real estate market]. [In Portuguese.] Accessed September 19, 2023. https://secovi-pe.com.br/noticias/Novidade/1981/investimentos-anunciados-para-o-estado-podem-impactar-no-mercado-imobiliario.
SNIS. 2023. “Sistema Nacional de Saneamento Básico” [National sanitation information system]. [In Portuguese.] Accessed July 24, 2024. http://www.snis.gov.br/.
Toronto Water, Environment and Energy Division. 2018. Downtown water strategy. Toronto: Toronto Water, Environment and Energy Division.
UN-Habitat (United Nations Human Settlements Programme). 2007. Global report on human settlements: Enhancing urban safety and security. London: UN-Habitat.
United Nations. 2019a. Probabilistic population projections rev. 1 based on the World Population Prospects 2019. New York: Dept. of Economic and Social Affairs, Population Division.
United Nations. 2019b. World urbanization prospects: 2018: Highlights. New York: Dept. of Economic and Social Affairs, Population Division.
Urich, C., and W. Rauch. 2014. “Exploring critical pathways for urban water management to identify robust strategies under deep uncertainties.” Water Res. 66 (Dec): 374–389. https://doi.org/10.1016/j.watres.2014.08.020.
Wang, X., J. Zhang, S. Shahid, E. Guan, Y. Wu, J. Gao, and R. He. 2016. “Adaptation to climate change impacts on water demand.” Mitigation Adapt. Strategies Global Change 21 (1): 81–99. https://doi.org/10.1007/s11027-014-9571-6.
Weschenfelder, A. B., K. Pickbrenner, and J. A. Pinto. 2014. Atlas Pluviométrico do Brasil; Equações Intensidade-Duração-Frequência. Município: Recife. Estação Pluviográfica: Aeroporto de Recife Código 82899. Porto Alegre, Brazil: Companhia de Pesquisa de Recursos Minerais.
Winarni, W. 2009. “Infrastructure Leakage Index (ILI) as water losses indicator.” Civ. Eng. Dimens. 11 (2): 126–134.
World Bank. 2020. Resilient water infrastructure design brief. Washington, DC: World Bank.
Zhong, C., H. Guo, I. Swan, P. Gao, Q. Yao, and H. Li. 2023. “Evaluating trends, profits, and risks of global cities in recent urban expansion for advancing sustainable development.” Habitat Int. 138 (Aug): 102869. https://doi.org/10.1016/j.habitatint.2023.102869.
Information & Authors
Information
Published In

Journal of Water Resources Planning and Management
Volume 150 • Issue 11 • November 2024
Copyright
This work is made available under the terms of the Creative Commons Attribution 4.0 International license, https://creativecommons.org/licenses/by/4.0/.
History
Received: Sep 28, 2023
Accepted: May 3, 2024
Published online: Aug 16, 2024
Published in print: Nov 1, 2024
Discussion open until: Jan 16, 2025
Authors
Metrics & Citations
Metrics
Citations
Download citation
If you have the appropriate software installed, you can download article citation data to the citation manager of your choice. Simply select your manager software from the list below and click Download.