Geographic Information System Mapping Tool for Rainwater Harvesting in the United States
Publication: Journal of Water Resources Planning and Management
Volume 150, Issue 5
Abstract
The Rainwater Harvesting Tool is a publicly available web-based geographic information system tool. It was developed using geospatial analysis in combination with historic zone improvement plan (ZIP) Code–level monthly average precipitation and evapotranspiration data across the US to help select potential locations for harvesting rainwater. Rainwater harvesting can provide a key alternative water source for a variety of uses, including landscape irrigation, vehicle washing, cooling tower make-up, dust suppression, and toilet flushing. Rainwater harvesting can help to diversify water sources for institutional, commercial, and residential buildings and offset the use of treated potable water. This tool aims to help organizations strategically target locations in which to implement rainwater harvesting systems. The metric used in the tool is called the rainwater harvesting potential, which is a normalized metric. The rainwater harvesting potential describes the amount of rainwater that reasonably can be collected and stored at a specific location. This metric was used to rank areas delineated by ZIP Codes across the US from lowest to highest to show the relative availability of rainwater for harvesting. Two mapping layers are included in the tool: a layer that shows the general year-round rainwater harvesting potential, and a layer that specifically shows the potential for harvesting rainwater to supply irrigation water. The Rainwater Harvesting Tool allows users to view the overall trends across the US and view the data at a scale at which the ZIP Code boundaries are clearly delineated. The tool can be used to help organizations with buildings located in multiple regions to strategically identify where to install rainwater harvesting systems and prioritize locations that may be optimal for rainwater harvesting.
Practical Applications
The Rainwater Harvesting Tool is a web-based geographic information system tool, which is free and available to the public. The tool presents the rainwater harvesting potential across the US to help determine locations that are potentially good candidates for harvesting rainwater and capable of meeting the water demands of institutional, commercial, and residential buildings. Rainwater can supply water for irrigation, cooling towers, vehicle washing, toilet flushing, and so forth, and offsets the use of treated potable water. The tool contains two mapping layers. The first shows the general potential for capturing rainwater and indicates the relative ability of a given location to collect rainwater throughout the year for beneficial use. The second identifies areas with favorable precipitation patterns for collecting rainwater during the irrigation season. The Rainwater Harvesting Tool provides interactive functions within a single browser session. Users enter specific locations (by ZIP Code), and the tool outputs a relative rank of the harvesting potential. The amount of rain potentially harvested each month also is provided. This portfolio planning, decision support tool can be utilized by organizations to target locations that are most conducive for rainwater harvesting across many locations.
Introduction
The growth of the global population is driving a drastic increase in the demand for water. Water scarcity, in which the demand for water exceeds the supply, currently affects one-third of the global population and is expected to affect half of the global population by 2050 (He et al. 2021). According to the World Resources Institute’s Aqueduct Country Rankings and Water Risk Atlas, the US has an overall medium-high baseline water stress, with areas of particularly high water risk in the West and South (WRI 2021). Nearly one-sixth of US river basins are unable to meet societal water demands, and population movements to these already stressed areas have made the issues even worse (Marston et al. 2020; Fuller and Harhay 2010). Economic factors make the current water supply inaccessible to some, and climate change makes the use of all available water resources more pertinent (Dolan et al. 2021). Such financial limitations to water access can arise from different factors, such as political and ethnic conflicts or the relatively low water price paid by irrigators compared with the higher prices paid by commercial or residential users (Guarino 2017). Furthermore, a Pacific Northwest National Laboratory report based on American Water Works Association water rate surveys showed that mean water rates in the US have been increasing since 2008 (Unger et al. 2023).
Because the current availability of freshwater is not adequate to meet the increasing global demand for water (resulting from growing populations both globally and in the US), there is a need to identify and develop alternative methods for harvesting water, which could yield social and economic benefits for many areas (Nechifor and Winning 2018). For example, the US–Mexico border suffers from sociopolitical issues concerning how the US and Mexican governments can share limited resources (Roggenburg et al. 2021). Similarly, the states of Florida and Georgia had a decades-long dispute over the consumption of water from the Chattahoochee River, culminating in a Supreme Court case ruling in 2021 (Mitchell Williams 2021). Sustainable sources of alternative water can help bring socioeconomic stability to such regions.
Alternative water sources are sustainable sources of water, not supplied from fresh surface water or groundwater, that potentially can offset the demand for freshwater. Examples of alternative water sources include harvested rainwater, greywater, and reclaimed wastewater. Rainwater harvesting (RWH) involves capturing, diverting, and storing rainwater from rooftops for later use. RWH is suitable for residential, commercial, and institutional buildings. The focus of this article is on the use of RWH for commercial and institutional buildings. Common uses for rainwater in commercial and institutional settings include applications that require nonpotable water, such as landscape irrigation, ornamental pond and fountain fillings, make-up water for cooling towers, and toilet and urinal flushing. RWH can be used to help offset the use of potable water and thereby lower the demand from public supplies. According to the EPA, commercial and institutional sector water use represents 17% of the total withdrawals from US public water supplies. Irrigation can be a large user of water in this sector. For example, the EPA reports that landscape irrigation represents 22% of the total water used in office buildings. Hotels consume 16% of the total water used in irrigation, and educational facilities use 28% of the total in irrigation (EPA 2023).
Along with offsetting the consumption of freshwater, RWH can help to manage stormwater by reducing the amount of runoff. This eases flooding and erosion by allowing the slowed runoff to soak into the ground and return to the groundwater table, turning stormwater problems into water supply assets. Less runoff also means less contamination of surface water from sediment, fertilizers, pesticides, and other pollutants that may be transported with rainfall runoff.
Alternative water can serve as a vital water supply to institutional and commercial buildings in support of water resilience by diversifying water sources. RWH systems should be implemented strategically by targeting areas in which there is good potential for harvesting rainwater using the rainwater harvesting potential (RWHP). This strategic approach is especially important for large enterprise organizations that may be able to implement multiple commercial or institutional projects across various locations in the US. Because of their larger size, commercial and institutional buildings (compared with residential buildings) represent a much larger possible source of harvested rainwater. Thus, there is a need for tools that can assist in managing a portfolio of possible RWH implementations at multiple commercial and institutional buildings. The widespread development of such portfolio management tools could lead to easier implementation of commercial RWH projects and, as a result, greater use of alternative water.
Literature Review
The current literature presents a range of methods for studying and evaluating the RWHP. However, there is a distinct lack of this information being presented in a format that can be used for large-scale commercial and institutional portfolio management of multiple RWH projects. Previous studies generally used methods that fall into two main categories:
1.
data analysis, simulation, and modeling; and
2.
GIS mapping and imaging.
The focus and objectives of these studies varied significantly even within these categories, but none focused on the strategic adaptation of the results to the implementation and management of RWH for multiple buildings across a geographically diverse area. This section reviews the overall trends found in the current literature, and further details on the specific studies reviewed in this section are presented in Table 1.
| Reference | Study type | Goal or novelty | Methods and results |
|---|---|---|---|
| Malinowski et al. (2015) | Data analysis, simulation, or modeling | Evaluating the potential reduction of potable water | Used rainfall data to find the savings potential and estimated that replacing irrigation and outdoor water use with RWH in the US would result in as much as a 40% reduction in outdoor water use or a water savings of (3.8 billion kWh and $270 million in annual savings). |
| Dallman et al. (2021) | Data analysis, simulation, or modeling | Evaluating the potential reduction of potable water | Used rainfall data in California to find that RWH for outdoor use (especially irrigation) is cost-effective, but indoor use is not, because of the extra installation costs of pipes, pumps, and filters that are not typical of outdoor-only systems. |
| Leonard and Gato-Trinidad (2021) | Data analysis, simulation, or modeling | Evaluating the potential reduction of potable water | Used consumption data to examine household water use and found average potable water use to be 4.1 L less per person per day (3.2%) for properties using RWH () compared with those without (). |
| Semaan et al. (2021) | Data analysis, simulation, or modeling | Evaluate increases in reliability and the resilience of the water system | Simulations of communal RWH systems in Houston and in Jacksonville, Florida, found higher reliability and resilience compared with those of private single-household systems and regional supply due to the increased adaptability and storage capacity of communal storage. |
| Zheng et al. (2021) | Data analysis, simulation, or modeling | Evaluate increases in reliability and the resilience of the water system | Simulations of communal RWH systems in Melbourne, Australia found higher reliability and resilience compared with those of private single-household systems and regional supply due to the increased adaptability and storage capacity of communal storage. |
| Jones and Hunt (2010) | Data analysis, simulation, or modeling | Optimize the design of RWH systems | Developed a downloadable model using 30 years (1971–2000) of rainfall data to design RWH systems (finding the optimum roof area, cistern size, and water usage for 208 rain barrels) in North Carolina. The study also monitored water levels in RWH systems at three sites: toilets at a nature education center, an irrigated landscape, and a car wash station. The results indicated that knowledge of the anticipated water use at a location is important for estimating the appropriate size of the RWH system. |
| Marchi et al. (2016) | Data analysis, simulation, or modeling | Optimize the design of RWH systems | This case study in the north of Adelaide, South Australia considered the seasonal variation and future climate change in an approach to optimize stormwater harvesting design. |
| Aladenola and Adeboye (2010) | Data analysis, simulation, or modeling | Optimize the design of RWH systems | Used rainfall data from 1998 along with the roof area and water demand in a spreadsheet to estimate the optimal size of a rainwater tank in Nigeria. |
| Imteaz et al. (2012) | Data analysis, simulation, or modeling | Optimize the design of RWH systems | Used rainfall data from 1998 along with the roof area and water demand in a spreadsheet to estimate the optimal size of a rainwater tank in Nigeria. |
| Luo and Li (2021) | Data analysis, simulation, or modeling | Unique simulation method | Used detailed data (meteorology, soil, elevation, land use, and other data) from humid regions in China to find the RWHP in these previously unassessed areas. The results showed the spatial and temporal variation of the RWHP and its potential to alleviate agricultural drought. |
| Zhang et al. (2014) | Data analysis, simulation, or modeling | Unique simulation method | A detailed model capturing the hydrologic processes and the complex physical mechanisms of rainfall onto soil was used to assess the RWHP in the Loess Plateau in China and its variation over the last 4 decades using daily precipitation and temperature data. |
| Mahmoud et al. (2014) | Data analysis, simulation, or modeling | Unique simulation method | Evaluated daily rainfall data in Sudan to calculate likelihood of rain volumes and the associated amount of runoff to make RWH recommendations to manage this excess stormwater. |
| Garg et al. (2022) | Data analysis, simulation, or modeling | Unique simulation method | This study performed in India monitored agricultural watersheds to develop a rainfall–runoff–soil loss relationship and analyze the effects of RWH on the ecosystem. The potential RWH zones across India were determined using daily gridded rainfall data, and the developed models were used to identify the most appropriate locations to harvest rainwater. |
| Maqsoom et al. (2021) | Data analysis, simulation, or modeling | Unique simulation method | A building information model with monthly rainfall data was used to simulate a few residential building types in a city in Pakistan. The results showed that RWH can meet the water needs of up to five individuals within a building in this city. |
| Alataway and El Alfy (2019) | Data analysis, simulation, or modeling | Unique simulation method | In Central Saudi Arabia, a theoretical water budget approach was validated against water level measurements in four reservoirs and then used to show that significant amounts of water can be harvested in the reservoirs. |
| Ennenbach et al. (2018) | GIS, mapping, and imaging | Evaluate resource availability compared with demand | Spatial analysis methods were applied to daily gridded precipitation data in the US in the period 1979–2014 to generate a county-level map of precipitation, thereafter using a weather generator to make a synthetic time series of the precipitation. |
| Grant et al. (2018) | GIS, mapping, and imaging | Evaluate resource availability compared with demand | In Escambia County, Florida, GIS maps and utility data were used to assess the potential reduction in potable water usage by RWH in residential households. The results showed that 62% of residential households could harvest more water than needed based on monthly medians of rainfall for the years 1950–2014 and water utility data for 42,028 households. |
| Lupia et al. (2017) | GIS, mapping, and imaging | Evaluate resource availability compared to demand | In Rome, monthly precipitation and temperature data were used with satellite images to calculate the rooftop area and garden area for evaluating the RWH potential and irrigation requirements. The study presents an approach for estimating the extent to which rooftop gardens can be self-sufficient in a particular location. |
| Hari et al. (2018) | GIS, mapping, and imaging | Evaluate resource availability compared to demand | A study based in India reported the use of a Google satellite image to calculate the roof area. The average annual rainfall in the area was assumed to be 820 mm, and the RWHP was calculated as the product of the rainfall, roof area, and runoff coefficient. With annual water demand assumed to be multiplied by the population and 365 days, the RWHP was calculated and found to be sufficient to meet domestic demands in the area. |
| Yiğit et al. (2020) | GIS, mapping, and imaging | Remote imaging and analysis | Mersin University campus in Turkey used drones to find potential roofs that can collect rainwater and calculated the areas using object-based classification. Thirty years of annual precipitation data and the number of green areas on campus were used to calculate the rainwater needs during different irrigation periods. The results of the study showed that rain can meet up to half the university’s need depending on the frequency of watering. |
| Villar-Navascués et al. (2020) | GIS, mapping, and imaging | Remote imaging and analysis | A 30-year data set was used in Spain to find the RWHP per capita as the product of the roof area, rainfall, runoff coefficient, and monthly precipitation. Supervised classification was used to evaluate the spatial distribution of runoff coefficients from different roof types. Thereafter, spatial clustering was performed, which revealed a high RWHP in low-density urban areas. |
| Al-Ghobari and Dewidar (2021) | GIS, mapping, and imaging | Creation of a geographic map of the RWHP | In Saudi Arabia, rainfall, soil, land-use, slope, and drainage data were input to GIS software and combined with a detailed runoff model to create a map of areas that have a low, medium, or high suitability for RWH. |
| NREL (2018) | GIS, mapping, and imaging | Creation of a geographic map of the RWHP | The National Renewable Energy Laboratory used GIS software to create publicly available maps of solar radiation, wind speeds, hydrogen, geothermal, and biomass availability across the US. These maps help inform energy planning across the country, but no such tools exist for evaluating the RWHP. |
Most of the reviewed literature used rainfall data for modeling and simulating the RWHP with varying levels of calculation complexity. The focus of previous modeling and simulation studies varied from water management using simple rainfall data (Malinowski et al. 2015) to detailed hydrological simulations (Zheng et al. 2021). Some studies focused on evaluating the potential reduction in potable water use as a result of using harvested rainwater. Regardless of the size of the system, RWH generally replaces potable water use and results in reduced demand on the potable sources (Malinowski et al. 2015; Leonard and Gato-Trinidad 2021; Dallman et al. 2021).
RWH systems can provide benefits beyond a simple reduction in potable water use, such as increases in the reliability and resilience of the water system. Simulations of communal RWH systems found a higher reliability and resilience compared with those of private single-household systems and regional supply due to the increased adaptability and storage capacity of communal storage (Semaan et al. 2021; Zheng et al. 2021). Some studies also focused on how rainfall data can inform the optimal design of RWH systems, but those studies cannot be used easily to evaluate a geographic location for RWH suitability (Jones and Hunt 2010; Marchi et al. 2016; Aladenola and Adeboye 2010; Imteaz et al. 2012).
Many different modeling approaches were proposed in the literature to evaluate the RWHP using unique simulation models. Those studies largely investigated a single region or location, and did not create a geospatial tool that can be used to target the RWHP across a large geographic area. Several studies assessed temporal and spatial precipitation data to evaluate the variation for a region (Luo and Li 2021; Zhang et al. 2014; Mahmoud et al. 2014; Garg et al. 2022; Alataway and El Alfy 2019). The unique modeling approaches in those studies may be applicable to evaluate the RWHP in other cities and geographic areas, but the results are not directly usable by an organization for planning RWH projects across a large area.
A common analysis method for evaluating the RWHP is to use GIS software, mapping tools, and remote sensing for a visual geographical representation of various RWH parameters. Some studies evaluated resource availability, and some compared this with the estimated demand (Ennenbach et al. 2018; Grant et al. 2018; Lupia et al. 2017; Hari et al. 2018). Remote sensing and image analysis studies focus on automating the generation of RWH parameters over a large spatial area (Yiğit et al. 2020; Villar-Navascués et al. 2020).
Some mapping studies are intended to provide a reference map for the RWHP across a large geographic region (Al-Ghobari and Dewidar 2021). This type of RWHP assessment in a GIS environment is a broadly applicable method that can be applied to study other areas of the world to identify sites with a high RWHP. However, such static maps do not provide the functions required for an organization to check the details of a specific area or manage multiple sites in the same way that an interactive tool can enable. Similar GIS-based maps exist for other topics (solar radiation, wind speeds, hydrogen, geothermal, and biomass availability) across the US (NREL 2018). These maps inform energy planning across the country, but no such maps or tools exist for evaluating the RWHP in the US.
Table 1 provides an overview of the individual studies reviewed and discussed in aggregate herein. The key information includes the type of study, the goal or novelty, and the methods and results. Any other desired information is presented in the provided references. The overall conclusion drawn from this literature review is that the current literature does not include significant work on multiproject planning or portfolio management tools for commercial organizations. There is a limited amount of RWHP mapping in previous studies, and the maps generated from these studies are not part of an interactive tool that is intended for use by RWH project managers for large organizations. Therefore, a study or methodology that is useful to large-scale organizations with multiple possible properties and projects will fill this gap in the current literature.
Objective of the Present Tool
Pacific Northwest National Laboratory (PNNL) created the Rainwater Harvesting Tool for the Department of Energy’s Federal Energy Management Program (FEMP). The tool is web-based and publicly available. The Rainwater Harvesting Tool is a portfolio planning, decision support tool that aims to help organizations to strategically target locations that are most conducive for RWH across a large number of locations. The tool contains two RWH mapping layers to help identify favorable RWH locations in the US. The first layer shows the area-specific general potential for RWH. The second layer specifically identifies areas in the US that are conducive to storing rainwater for future supplemental irrigation during the irrigation season. This paper describes the methods used to build the Rainwater Harvesting Tool developed at PNNL.
Most other studies evaluated the ability of RWH to meet the demand in a particular region based on existing infrastructure. The main conclusions of those studies generally were in the context of whether RWH can help supplement or replace the water supply for the studied region, and usually involved the application of similar methods to evaluate other regions. The novelty of many such previously reported studies lies in the remote sensing or GIS approach for finding roof areas and spatial variation, the optimization of the rain barrel size, or the prediction of demand.
The method described here uses a monthly rainfall data set in the US to create maps of the RWHP that can be used to help strategically identify locations across the US that are conducive to RWH. The novelty of this work lies in the use of a GIS to create a tool for commercial and institutional portfolio management and the strategic implementation of RWH projects across the US. This approach to creating easily interpretable evaluations of the RWHP that are usable for large-scale multiproject planning was not found in the current literature. This strategic approach should be used to support the widespread implementation of RWH. The applicability of this work and the resulting tool for institutional and commercial project portfolios rather than single building residential projects further distinguish the focus of this work from those of many previous studies. In addition, identifying sites for possible RWH projects is the overall goal for this tool, which differs from much of the existing literature that focused on novel data analysis, modeling and simulation, or GIS methods without a focus on how this information should be used in the strategic implementation of RWH. Furthermore, the web tool developed in this work is a unique publicly available software tool that can be used by any parties interested in assessing the RWHP.
Methods
The Rainwater Harvesting Tool is a GIS-based tool with two data layers. The first layer indicates the relative suitability of a geographic area for collecting rainwater throughout the year. This measurement reveals areas that can consistently collect and store rainwater over the course of the year, making RWH generally more conducive. The second mapping layer targets irrigation, identifying the relative suitability of a geographic area for collecting rainwater during the irrigation season [determined using evapotranspiration (ET) data].
A spatial analysis was conducted to create these two mapping layers. The primary data required for generating the mapping layers included monthly data of US zone improvement plan (ZIP) Code–level precipitation and ET (ET is used only in the irrigation layer). Precipitation and ET data from the International Water Management Institute (IWMI Climate Atlas 2010) Climate Atlas were used in the analysis, which represent 30 years of historical data between 1961 and 1990. This data set was provided to PNNL by the EPA in 2010. These and other data sets used for the development of the final spatial data layers are listed in Table 2. Because these data sets are at the monthly and ZIP Code levels, they provided the required granularity to create the mapping layers. Current precipitation and ET data at the ZIP Code level by month were not available at the time that the tool was created.
| Data | Data type | Data source | Resolution | Coordinate system |
|---|---|---|---|---|
| Precipitation data | Tabular | International Water Management Institute (IWMI), 1961–1990 | Monthly, US ZIP Code level | Not applicable |
| ZIP Code boundaries | Spatial | US Postal Service | ZIP Code level | World Geodetic System 1984 |
| Evapotranspiration dataa | Tabular | IWMI, 1961–1990 | Monthly, US ZIP Code level | Not applicable |
| US state boundaries | Spatial | US Census Bureau TIGER/Line Shapefiles, 2015 | US state level | North American Datum 1983 |
a
Evapotranspiration data were used only in the RWHP for the irrigation mapping layer.
Year-Round Rainwater Harvesting Potential
The first mapping layer of the tool was created using a RWHP that indicates the relative potential to collect rainwater throughout the year. This section describes the general methods used to develop the RWHP and GIS-mapping layer.
First, the annual rainfall available for harvesting in each ZIP Code was estimated by summing the total precipitation during the frost-free months (measured in centimeters). Precipitation during frost–free months was used in this application because it is common for rain to be harvested only during frost-free months to avoid issues with water freezing in the RWH system. Frost-free months were identified using the typical dates for the last frost in spring and the first frost in fall.
Next, the number of months per year with at least 2.5 cm (1 in.) of rainfall, called the storage potential, was determined. The storage potential assesses the distribution of rainfall throughout the year, which can be stored for use in subsequent months. For example, this measurement can reveal areas in the US that can consistently collect and store rainwater in many months throughout the year, making RWH generally more conducive.
It was determined that more than 2.5 cm (1 in.) of rainfall in a month yields a volume of water that would provide an adequate minimum of excess water for storage. This determination was based on an example wherein storing the precipitation from a () roof with 2.5 cm (1 in.) of rain garnered approximately 28,000 L (7,375 gal.) for harvesting with an 85% collection efficiency. An office building with a roof of this size is a standard-sized US office building (EIA 2015). A volume of 28,000 L meets approximately 30% of the typical monthly water use demand of an office building, which was determined to be an adequate amount of supplemental water to offset potable water. This assumes that the water demand is 49 L (13 gal.) per person per day (EPA 2012) with an occupancy of 93 people [based on () per person (ICC 2018)].
Attributes were added to the data set to show the total number of frost-free months and the total number of months in which rainfall was greater than 2.5 cm (1 in.). Frost-free indicators, which are the typical last and first frost dates, were added for each ZIP Code.
These values were joined with the ZIP Code spatial data using the ArcGIS Desktop 10.3.1 software developed by Environmental Systems Research Institute, Inc. (ESRI). Two data layers were created to show the intersection of the total annual rainfall and storage potential in each ZIP Code (Fig. 1). The general RWHP metric was created from this overlay.
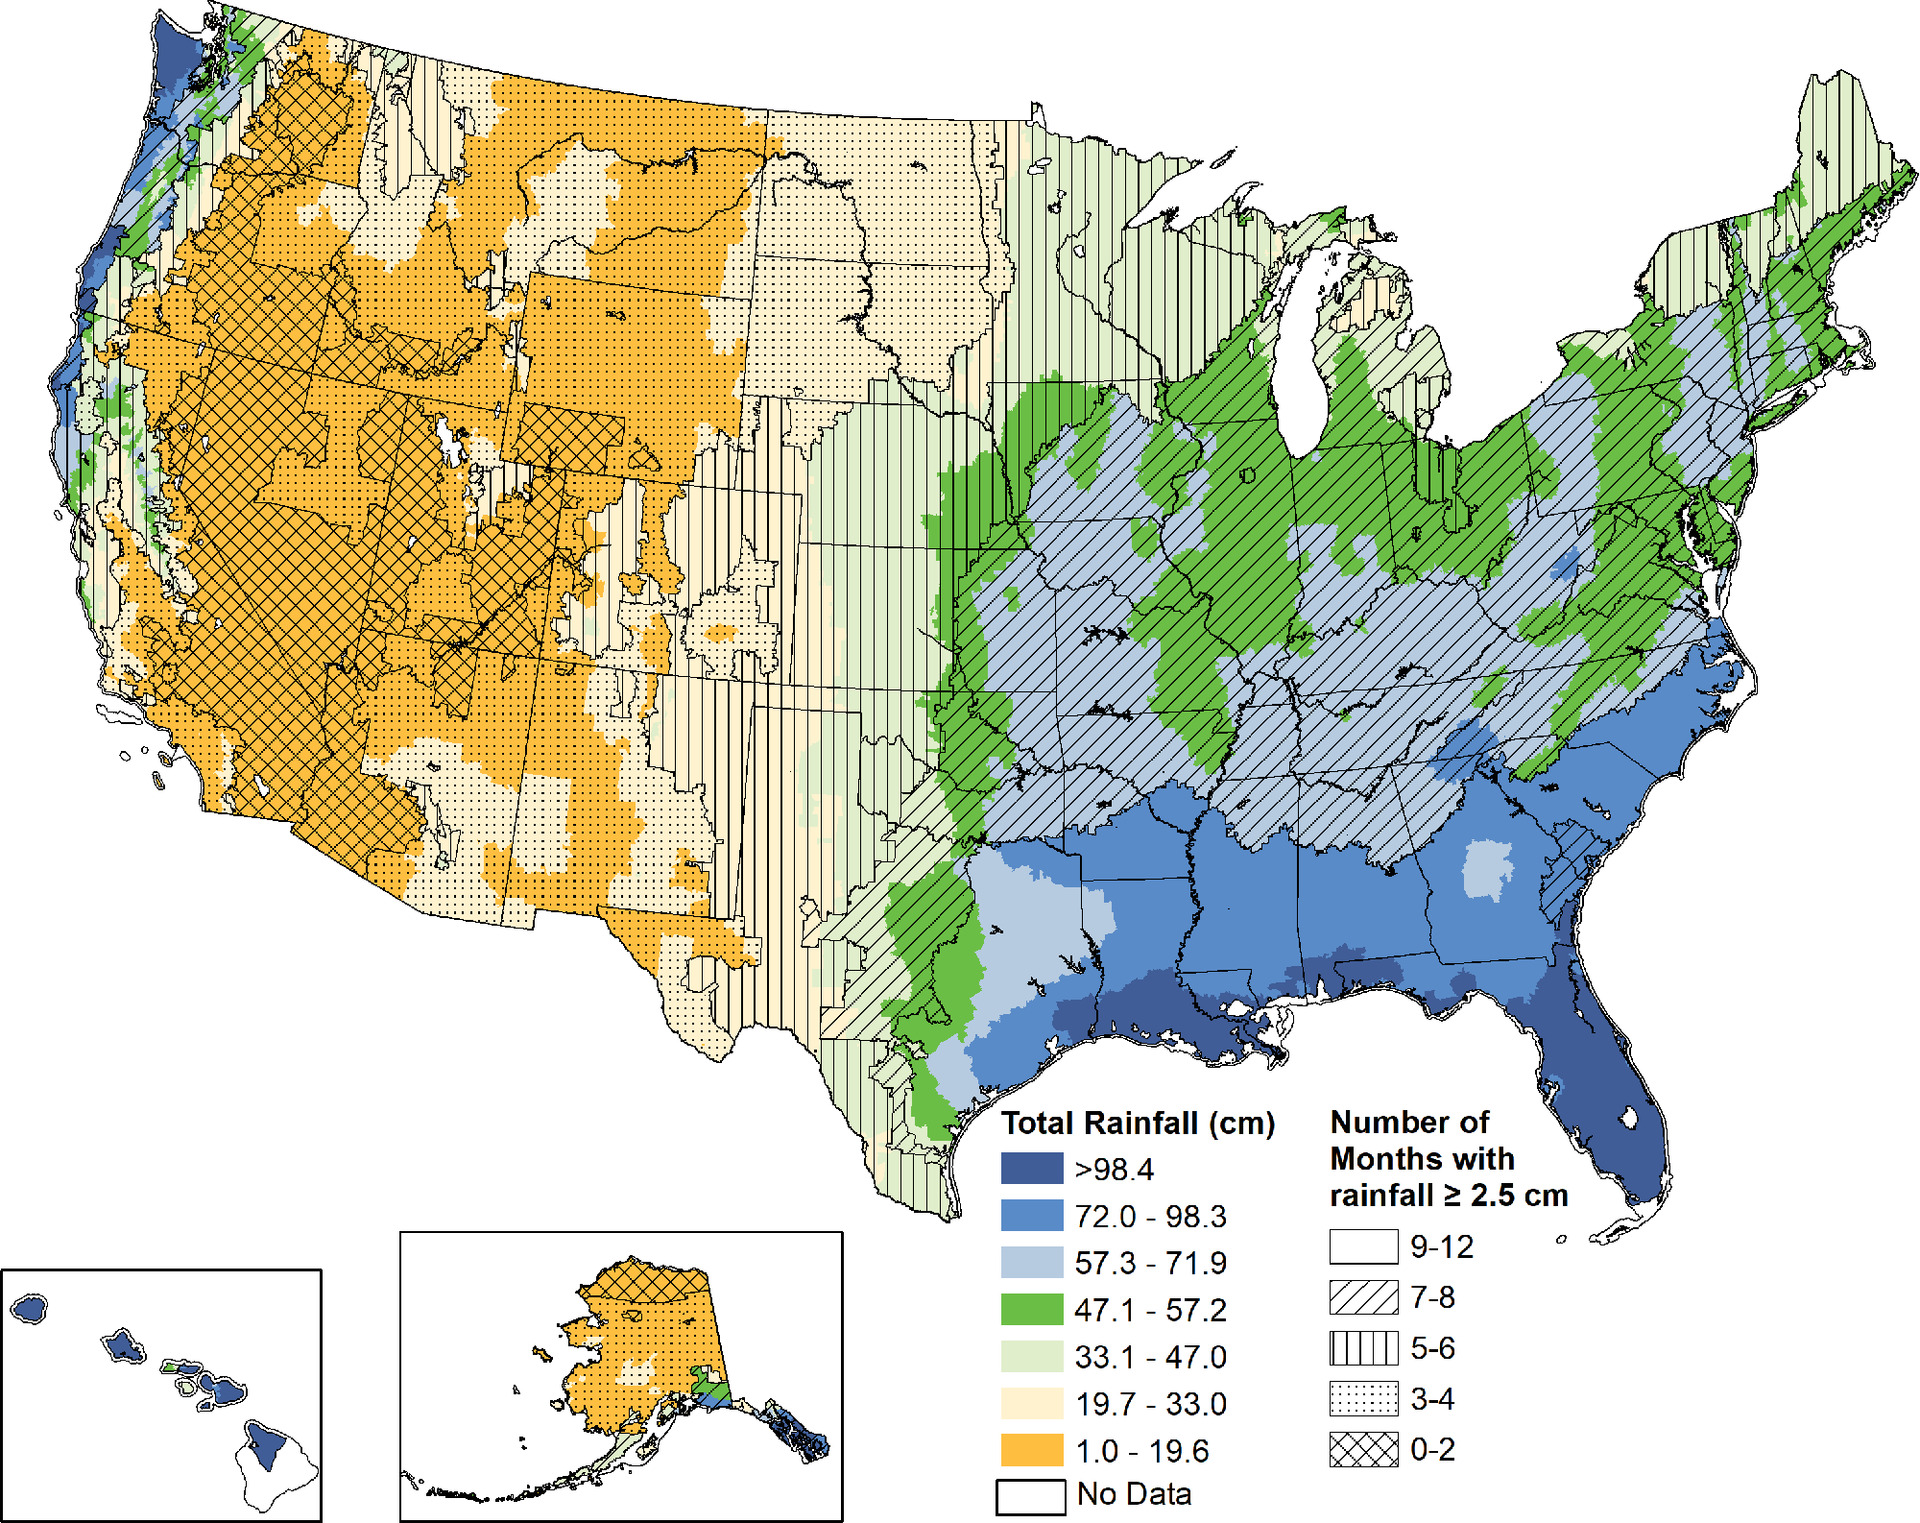
The natural breaks data partitioning method was used to classify the data into distinct groups of the total annual rainfall (Fig. 1). This method classifies a set of data into groups with similar values and helps to distinguish these groups. The natural breaks method was determined to be appropriate because the US has a wide range of climate regions, from arid desert to temperate rainforest. Using the natural breaks method for regions in which there is not a wide variety of climates may not be the best approach because it may not partition the data into meaningful bins. Other data classification methods should be examined to provide better partitioning for the total amount of rainfall for these regions in other parts of the world.
The groups with the two highest amounts of total annual rainfall [72.0–98.3 and 98.5–380.8 cm (28.3–38.7 and 38.8–146.0 in., respectively)] were combined to form a single tier [72.0–380.8 cm (28.3–146.0 in.)] because it was assumed that anything over 71.9 cm (28.3 in.) would provide a significant amount of water for use.
The storage potential layer was divided into groups using a manual interval classification method. The middle three groups were divided evenly into 2-month intervals (Months 7–8, 5–6, and 3–4) of rainfall exceeding 2.5 cm (1 in.), whereas the groups representing Months 9–12 and 0–2 were allotted intervals of 4 and 3 months, respectively.
These two mapping layers then were used to develop a final ranking of the RWHP from highest to lowest. Regions in which the total annual rainfall was greater than 71.9 cm (28.3 in.) and the storage potential was 9–12 months were ranked as having the highest RWHP. Regions in which the total annual rainfall was between 57.3 cm and 71.9 cm (22.6–28.3 in.) for a storage potential of greater than 6 months or the total annual rainfall was greater than 71.9 cm (28.3 in.) for a storage potential of less than 9 months were ranked as having a high RWHP. These two distinct categories make up the high tier because areas with ample rain but a storage potential of 6–9 months were not deemed to be optimal for the highest RWHP tier. The medium-high, medium, low, and lowest rankings were binned based only on the rainfall data layer, and not the storage potential data layer. This was because the vast majority of these areas have a storage potential of less than 9 months, which was considered to be less attractive for RWH. Table 3 lists the details of the ranks that were used to create a map showing the areas that are most conducive for RWH.
| Rank | Total annual rainfall during frost-free months (cm) | Total annual rainfall during frost-free months (in.) | Number of months with | Ranking notes |
|---|---|---|---|---|
| Lowest | 1.0–19.6 | 0.4–7.7 | Any | Areas with little rainwater, making harvesting very limited |
| Low | 19.7–33.0 | 7.8–13.0 | Any | Areas with low rainwater, making harvesting limited |
| Medium | 33.1–47.0 | 13.1–18.5 | Any | Areas with adequate rainfall for harvesting |
| Medium-high | 47.1–57.2 | 18.6–22.5 | Any | Areas with significant rainfall, making harvesting feasible |
| High | 57.3–71.9 | 22.6–28.3 | Areas with significant rainfall, making harvesting very attractive | |
| Highest | 9–12 | Areas with significant rainfall and storage potential, making harvesting optimal |
Rainwater Harvesting Potential for Irrigation
The second mapping layer shows the areas in the US that have sufficient rainfall preceding the times of highest irrigation requirement (using monthly ET data), which can be collected to offset the use of potable water specifically for irrigation. The RWHP for irrigation was determined by collecting data on the period of surplus rainwater availability that can be stored by a RWH system for use in the following months when there is a need for supplemental irrigation during the irrigation season. This analysis combined monthly precipitation with ET rates for each ZIP Code to determine the times when a surplus of rainfall is available for storage by a RWH system. ET represents the total amount of water that a plant requires to stay healthy, which includes the total amount of water lost to the atmosphere due to evaporation (e.g., water loss from the soil) and plant transpiration (water loss from the plant itself). Some factors that can affect ET are solar radiation, the air temperature, the air humidity, and wind.
The following steps were used to develop the RWHP for irrigation:
1.
The 30-year historical average monthly data for precipitation and the reference ET (ETo) categorized by ZIP Code for frost-free months were collected. The ETo is the ET rate of a hypothetical reference crop that is an actively growing, well-watered plant of uniform height.
2.
The ET for cool season turf for each ZIP Code, using alfalfa as the ETo plant (FAO 1998), was determined. To determine the ET for cool season turf grass, the ETo was multiplied by the plant coefficient for cool season turf, 0.8. Cool season grass was selected, assuming that it is prevalent in commercial landscaping.
3.
The monthly ET was subtracted from the monthly rainfall to determine the supplemental irrigation required for each frost-free month. Negative values represent the total amount of supplemental irrigation required for the given turf landscape (negative numbers indicate that the amount of rainfall does not meet the turf’s water requirements). Positive numbers indicate that the amount of rainfall exceeds the turf’s water requirements, which approximates the amount of water that may be applied in the current month or stored for a future time. Supplemental irrigation is the amount of water in addition to natural rainfall water is needed by the grass to maintain its health.
4.
The supplemental irrigation required for all frost-free months was added to estimate the total amount of irrigation required for the irrigation season.
5.
The number of months in which the amount of monthly rainfall exceeds the monthly ET, called months with positive rainfall, was determined. This provides an approximate measure of the number of months in which surplus rainfall can be stored by a RWH system. The stored rainfall potentially could be used the following month to supply future irrigation needs. This variable is not meant to represent an exact amount of water stored, but rather gives a rough estimate of the potential to store and supply water for future irrigation needs.
6.
The total supplemental irrigation required (Step 4) was mapped with ArcGIS using the natural breaks method to form natural groups (Fig. 2). Commensurate with the mapping layer for year-round RWH described previously, the natural breaks method was determined to be an appropriate approach because the US has a wide range of climatic regions, from arid desert to temperate rainforest.
7.
The months with positive rainfall (Step 5) was superimposed on a map plotting the total supplemental irrigation required (Step 6) to reveal the regions in the US that may have additional rainwater available for future irrigation via storage by the RWH system (Fig. 2).
8.
The RWHP for irrigation was ranked from lowest to highest based on the level of surplus water available for storage and irrigation needs. Table 4 provides the scale used for the ranking.

| Rank | Annual rainfall minus evapotranspiration (cm) | Annual rainfall minus evapotranspiration (in.) | Months with positive rainfall available for storage | Ranking notes |
|---|---|---|---|---|
| Not recommended | to | to | Areas with very high evapotranspiration (ET) and very little rainwater, making harvesting unfeasible | |
| Lowest | to | to | Areas with high ET and little rainwater, making harvesting very limited | |
| Low | to | to | Areas with high ET and low rainwater, making harvesting somewhat limited | |
| Medium | to | to | Areas in which ET typically exceeds rainfall; adequate rainfall can be stored for irrigation during drier times | |
| Medium-high | to | to | 2–6 | Areas in which ET typically exceeds rainfall; a significant amount of rainfall can be stored for irrigation during drier times |
| High | to 35.3 | to 13.9 | Areas in which ET closely matches rainfall, so the collection and storage of rainwater for irrigation during drier times is very feasible | |
| Highest | to 35.3 | to 13.9 | 4–9 | Areas in which ET closely matches rainfall, so the collection and storage of rainwater for irrigation during drier times is optimal |
| Rainfall exceeds reference evapotranspiration (ETo) | 35.4–259.1 | 14.0–102 | N/A | Areas in which ample rainfall exceeds ET, and RWH for irrigation may not be necessary |
Rainwater Harvesting Tool
The mapping layers described in the previous sections were used to create the Rainwater Water Harvesting Tool with a goal of providing an accessible and easy to understand format that allows users to ascertain the RWHP of specific locations across the US. The tool can be used to manage a large portfolio of multiple commercial RWH projects. To this end, the Rainwater Harvesting Tool was created using ESRI’s ArcGIS Online software (AGOL). This platform was chosen as the development environment for the tool because it allowed for the quick development of an interactive web application, provided most of the necessary tools for that development without need for a stand-alone server, and encompassed the need for a spatial data web environment.
The two spatial data layers (RWHP, and RWHP for irrigation) were reviewed and loaded into a geodatabase using ESRI’s ArcGIS Pro version 2.8. The geodatabase was uploaded to AGOL’s cloud service and imported into a web map on which the data could be visualized. Pop-up informational windows were customized for appropriate interpretation of the data during user interaction, and include a simple chart showing the average monthly rainfall in addition to the basic ZIP Code attribute information.
ArcGIS Web AppBuilder was used to create a new application to act as a container for the web map and provide most of the interactive elements for the user. The final step in application development was to move the interactive web application into a dashboard-style container to include a slide-out informational widget without having to code it from scratch inside the web application.
Results and Discussion
The final static maps visualize the results of the overlay analysis for year-round RWH and RWH conducive for supplementing irrigation during the irrigation season (Figs. 3 and 4, respectively). The maps provide a ZIP Code–level, accurate view of the areas of relative feasibility for harvesting rainwater and harvesting rainwater for irrigation purposes.


Although ZIP Codes were used to create the maps, the boundaries are not shown in the static maps because they added no additional information. The evolution of the static maps to provide more specific information to the user led to the interactive Rainwater Harvesting Tool.
The Rainwater Harvesting Tool (Fig. 5) allows the user to view the overall trends across the US while also allowing the user to zoom in to a scale at which the ZIP Code boundaries are clearly delineated. Additionally, the user can select a ZIP Code zone in the map tool, and a pop-up window in the map provides specific information about the monthly rainfall during frost-free months for that specific ZIP Code (Fig. 6).

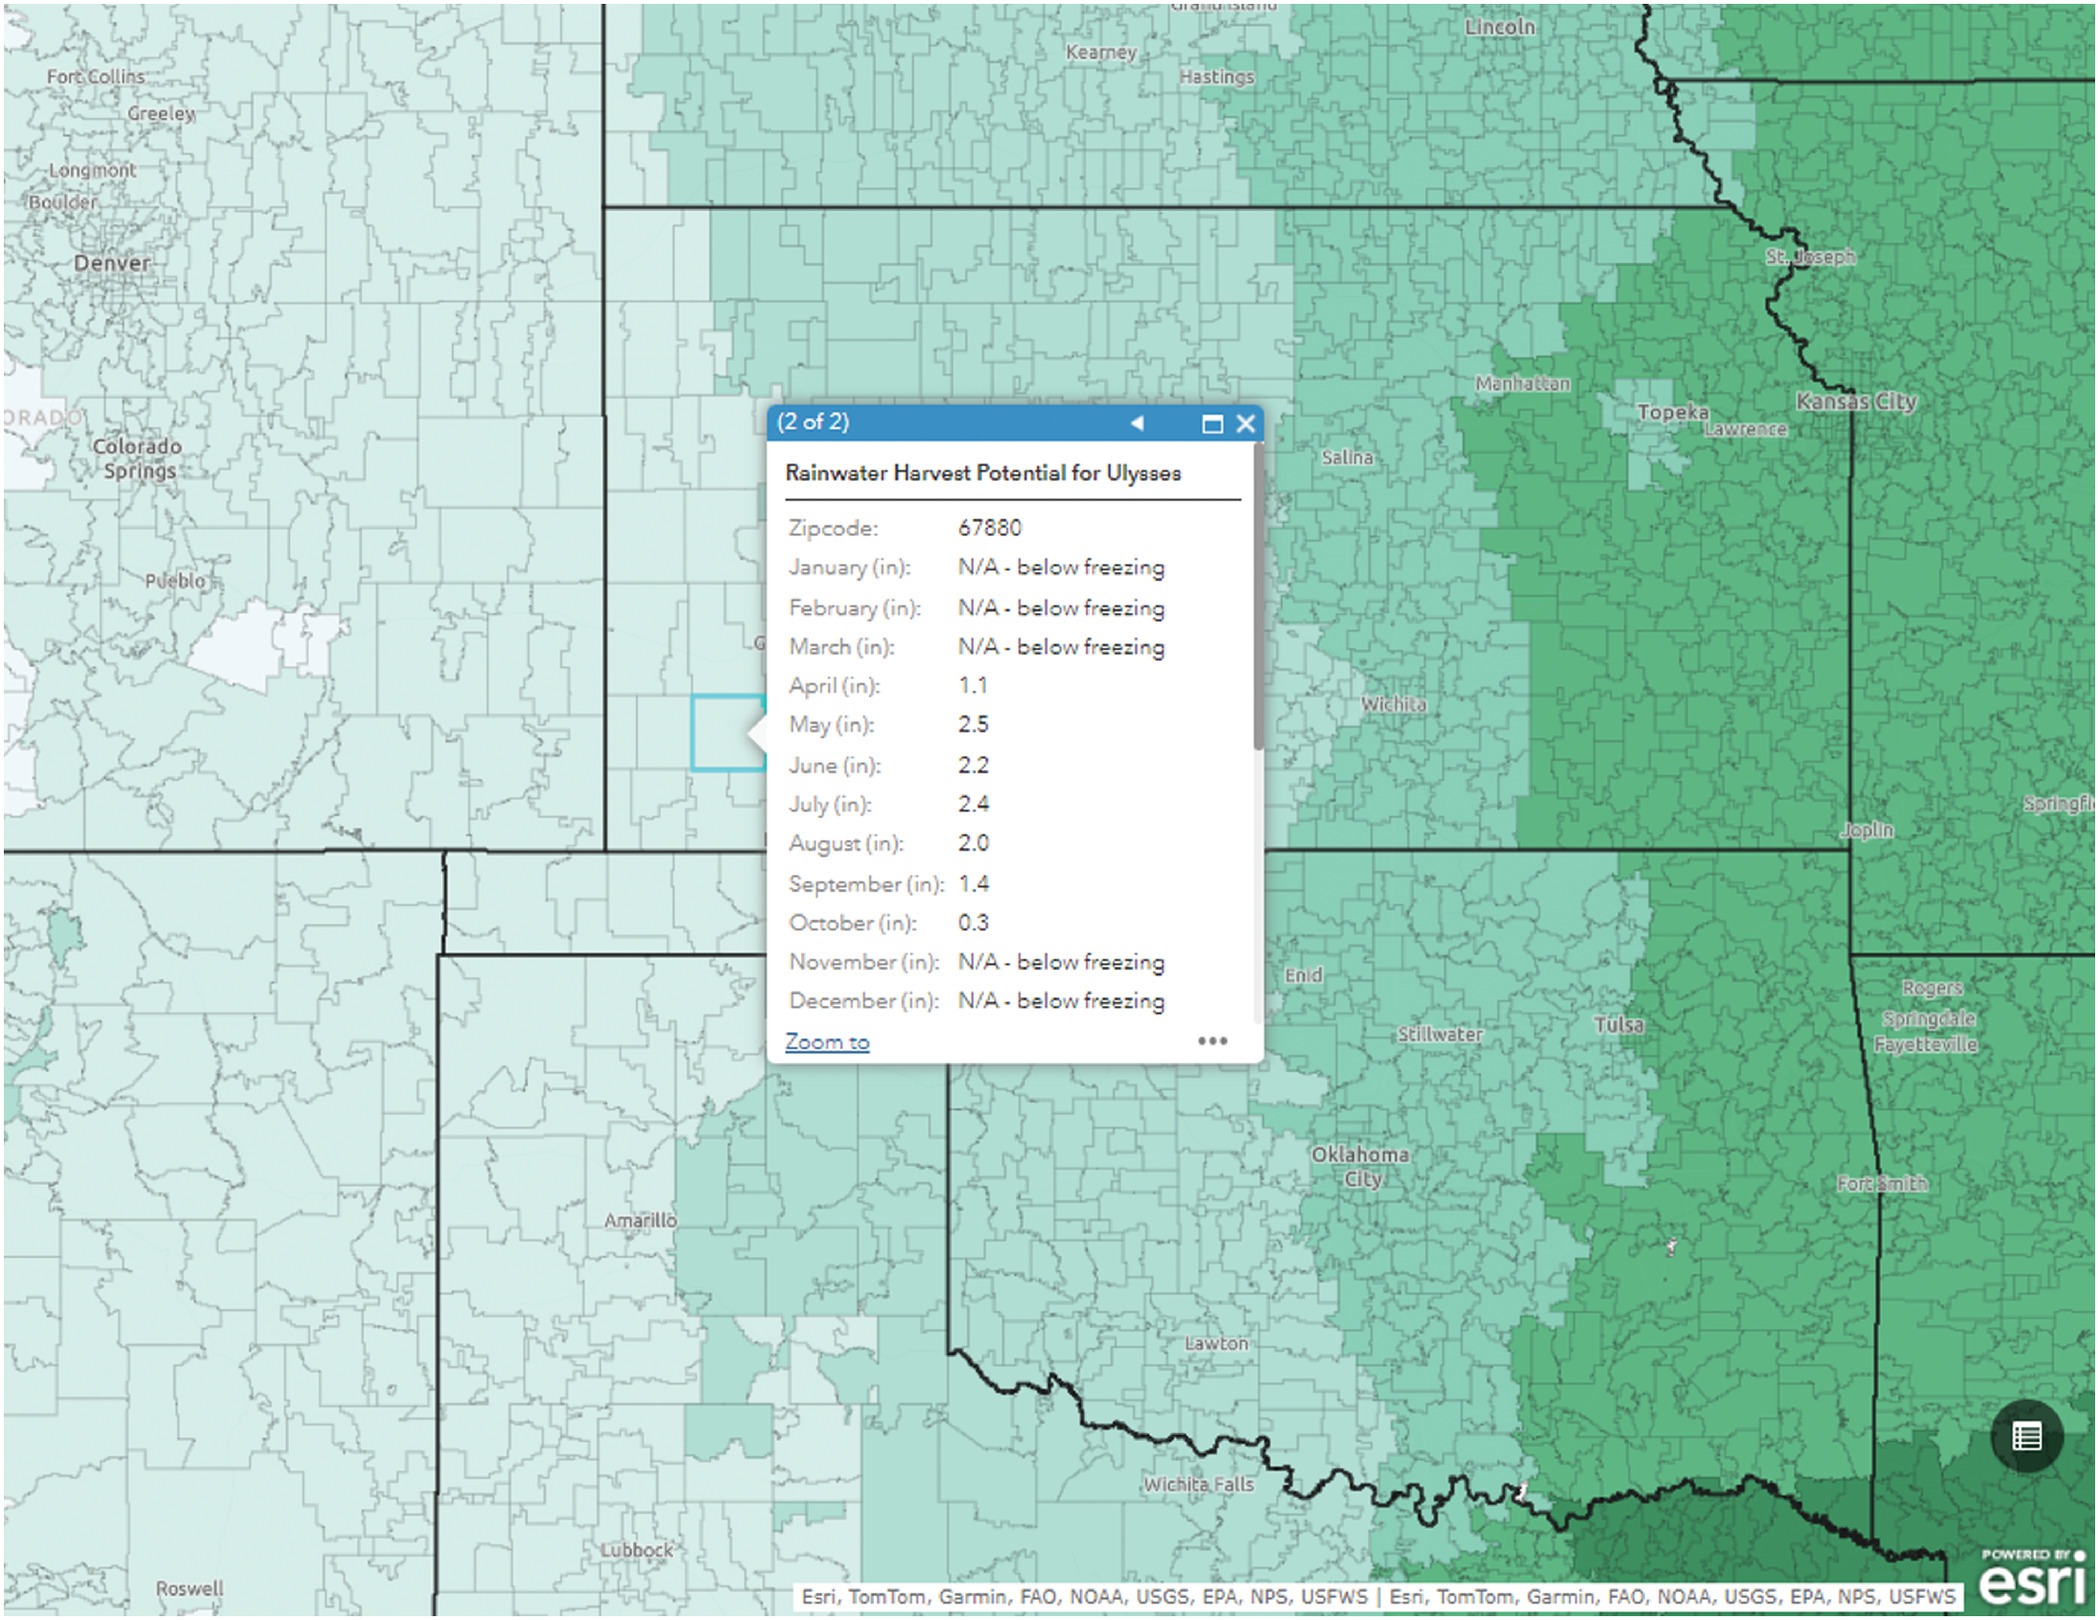
The Rainwater Harvesting Tool provides interactive functions for users in a single interactive browser instance. The widgets included in the tool allow the user to access specific ZIP Code data necessary to estimate the collection potential, download selected data, and perform location searches. The widgets form a tool set that allows the user to investigate the RWHP at a single site or multiple sites using simple actions that most users will recognize from other interactive web mapping applications.
The Rainwater Harvesting Tool can be used to help an organization with buildings in multiple regions strategically identify where to install RWH systems. The tool results can help to prioritize locations that may be optimal for RWH projects. An organization can determine potential locations for RWH projects, estimate the amount of water needed, and then map its building inventory over the appropriate RWHP map. A list of suitable sites can be developed to prioritize the sites with the best potential for implementing RWH projects.
The Rainwater Harvesting Tool also can be used to estimate the volume of rainfall that can be collected from roofs or hard surfaces. The following calculation is used to estimate the volume of rainwater available for harvesting:where
•
Catchment area is the size of the roof or hard surface where rainfall will be collected.
•
Monthly rainfall is the number of centimeters of rainfall for the month (obtained from the Rainwater Harvesting Tool).
•
Collection efficiency is a factor applied to the total monthly harvesting potential to account for losses in the system. A typical system efficiency is between 0.75 and 0.9 (Texas Water Development Board 2005), depending on how efficiently the RWH system collects rainfall, which is driven primarily by the water lost from various parts of the RWH process. These include roof collection (the type of material impacts losses, e.g., a rough surface equals more water lost), first flush, evaporation, spillage from gutters, and leaks in the system.
•
The conversion factor of 10 converts the volume of rainfall (in centimeters per square meters of area) to liters.
The three test locations in Fig. 7 (Seattle; Salt Lake City; and Tallahassee, Florida) were selected to represent different regions around the US to demonstrate the above outlined application of the Rainwater Harvesting Tool and the application of the tool to the RWHP for irrigation. A catchment area of () was used to represent a typical commercial building roof footprint. A magnified view of each of the sites and their RWHP data are shown in Fig. 8.

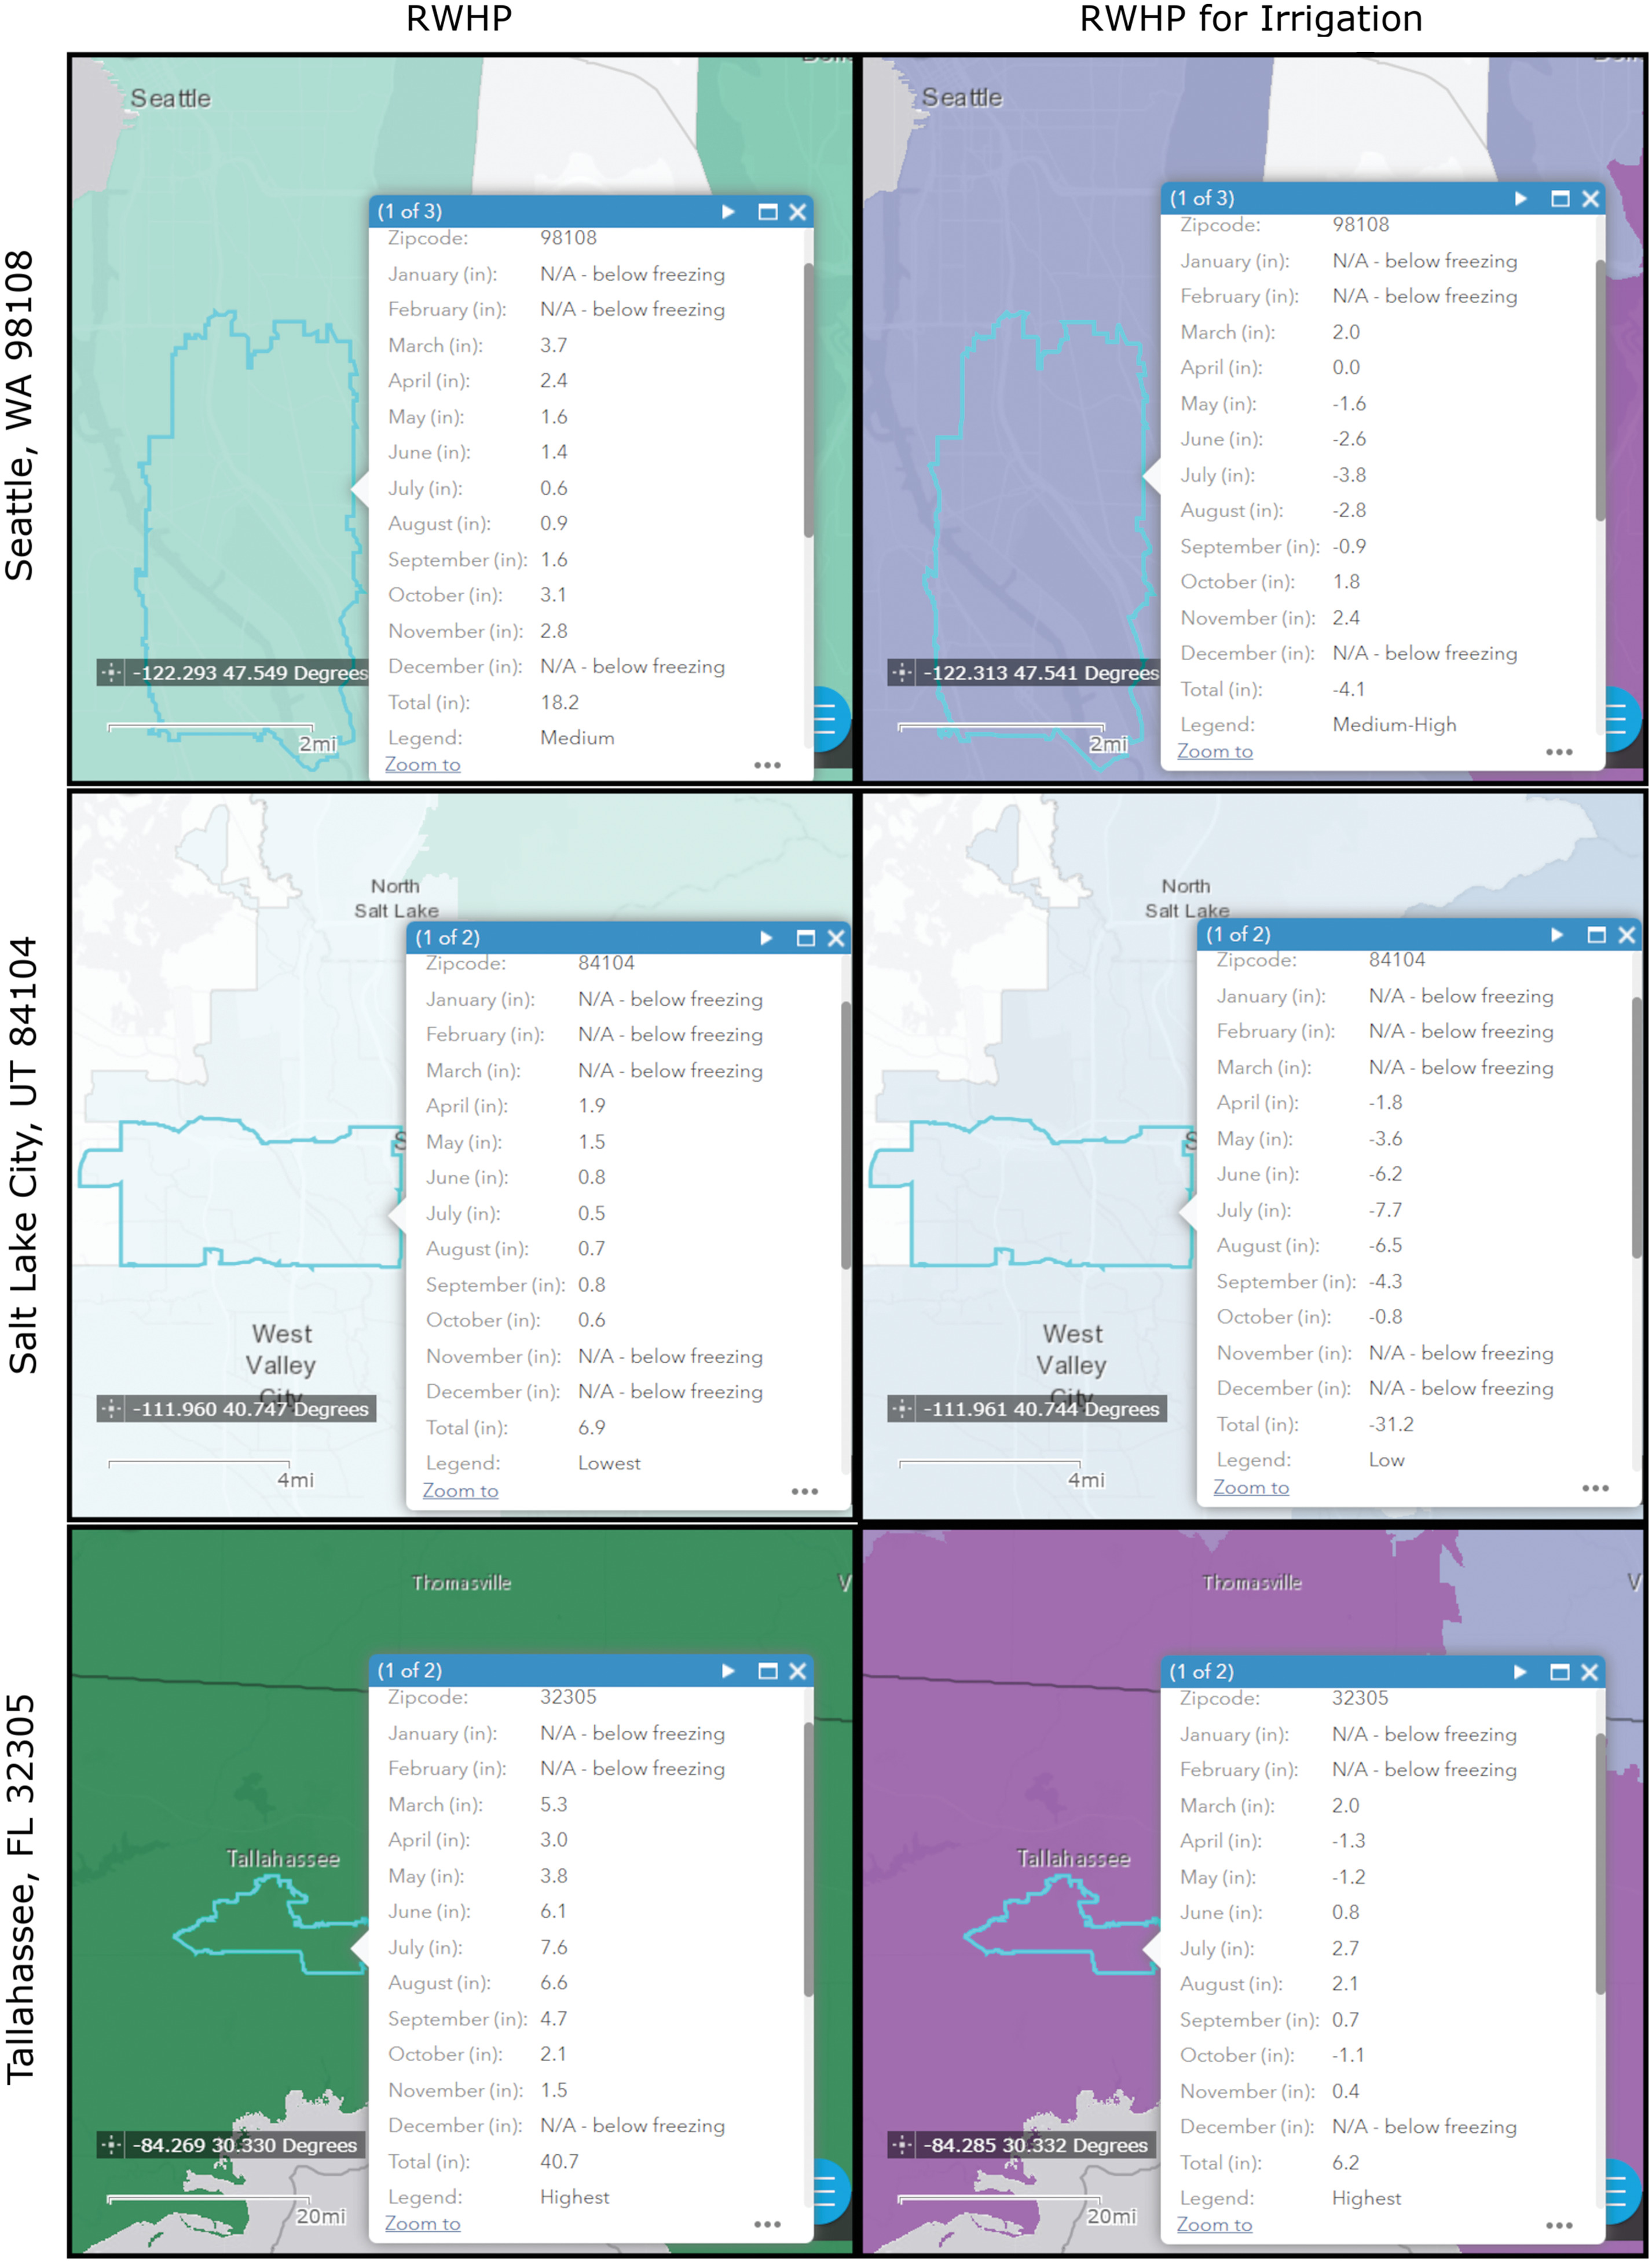
In a situation in which a planner needs to choose a site for a new facility based on the RWHP alone, the planner might propose that the best location for a new RWH facility would be near Tallahassee (Table 5). This test scenario also could help to prioritize improvements across existing facilities: the facility in Seattle should be prioritized for RWH over a facility in Salt Lake City, where a RWH system might not be as effective. Examining these locations to assess the feasibility of RWH for irrigation purposes produced similar results, whereby Tallahassee had a higher potential for storing water for future irrigation needs.
| Site | ZIP Code | Number of frost-free months with rainfall | Example catchment area, [ ()] | Total annual rainfall [cm (in.)] | Year-round rainwater harvesting potential rank | Annual rainwater harvest potential [L (gal.)] | Total annual rainfall minus reference ET [cm (in.)] | RWHP rank for irrigation |
|---|---|---|---|---|---|---|---|---|
| Seattle | 98108 | 9 | 1,300 (14,000) | 46 (18.2) | Medium | 479,589 (126,694) | () | Medium-high |
| Salt Lake City | 84104 | 7 | 18 (6.9) | Lowest | 181,018 (47,820) | () | Low | |
| Tallahassee, Florida | 32305 | 9 | 103 (40.7) | Highest | 1,070,280 (282,738) | 15.7 (6.2) | Highest |
Note: Annual totals include frost-free months only.
The use of this publicly available tool is not limited to institutional or commercial entities. Residential users interested in RWH can quickly evaluate if the climate and rainfall in their area is conducive to RWH.
Conclusion
The approach used to develop the maps can be applied to rainfall data sets outside the US in which there is a similar wide range of climate types. The goal of showing the RWHP over large geographic areas (on a national scale) has not been studied in detail, because the current literature has more local case studies or citywide mapping. A large-scale portfolio management approach that can used for multiple commercial and institutional properties is a more broadly applicable first step than local case studies for organizations implementing RWH projects across a wide geographic distance. After this first step of site identification, local case studies can be a useful and detailed tool for evaluating or designing specific RWH projects and systems on a case-by-case basis. For organizations with large portfolios of properties and possible RWH projects, tools such as the one presented in this work can continue to function as an overall high-level management tool, whereas local studies are used for individual projects. The use of ET data and monthly variation to determine the RWHP categories for irrigation is another aspect of this approach that can be applied to other data sets. Although annual rainfall data and hydrological modeling can show the high-level potential for RWH, a real site may need consistent rainfall throughout a year to fully realize the benefits.
The data used to develop the maps have limitations. Daily precipitation is best for determining how much rainfall is available for harvesting. The maps developed in this study were based on the historical monthly average rainfall, which does not account for daily, monthly, or yearly variations such as large rain events or rainy periods or years or dry times or years. For example, if all rain falls at the beginning of the month, there may not be enough harvested rainwater for irrigation at the end of the month. This issue often is addressed through proper RWH system sizing to ensure a sufficient storage capacity. However, the Rainwater Harvesting Tool does not provide daily data that can be used for these capacity calculations. Thus, the feasibility of a RWH project may depend on the system design, and the suitability of an area for a particular project may change after further analysis. However, the Rainwater Harvesting Tool can provide a starting point for this analysis.
The next steps in this work include the incorporation of state regulations for RWH. With no federal law regarding RWH, it is up to individual states to decide what regulations apply to RWH. Some states do not have specific regulations about RWH, whereas some states have regulations on RWH within plumbing codes. Moreover, some states offer incentives of varying magnitudes for implementing RWH. Maps of regulations across the US already have been created and are publicly available online. Incorporating a layer of these regulations, incentives, and technical resources on RWH for each state into the online Rainwater Harvesting Tool will further increase the applicability of the tool’s results. Organizations can determine where RWH is regulated and supported, and which areas have good potential for harvesting rainwater. A list of suitable sites can be developed to prioritize the sites with the best potential for implementing RWH projects.
Data Availability Statement
Data (US ZIP Code–level precipitation and evapotranspiration), models, or code used in this the study were provided by a third party. Direct request for these materials may be made to the provider as indicated in the Acknowledgments.
Acknowledgments
The authors thank the US Department of Energy’s Federal Energy Management Program (FEMP) for providing funding for this work and to give their sincere gratitude to Jason Koman (FEMP) for providing oversight and direction. The authors are grateful to the US Environmental Protection Agency for providing the ZIP Code–level precipitation and evapotranspiration data. Finally, the authors want to thank their colleagues at Pacific Northwest National laboratory (PNNL), Amy Solana for her technical review and Kacoli Sen for her editorial review.
References
Aladenola, O. O., and O. B. Adeboye. 2010. “Assessing the potential for rainwater harvesting.” Water Resour. Manage. 24 (10): 2129–2137. https://doi.org/10.1007/s11269-009-9542-y.
Alataway, A., and M. El Alfy. 2019. “Rainwater harvesting and artificial groundwater recharge in arid areas: Case study in Wadi Al-Alb, Saudi Arabia.” J. Water Resour. Plann. Manage. 145 (1): 05018017. https://doi.org/10.1061/(ASCE)WR.1943-5452.0001009.
Al-Ghobari, H., and A. Z. Dewidar. 2021. “Integrating GIS-based MCDA techniques and the SCS-CN method for identifying potential zones for rainwater harvesting in a semi-arid area.” Water 13 (5): 704. https://doi.org/10.3390/w13050704.
Dallman, S., A. M. Chaudhry, M. K. Muleta, and J. Lee. 2021. “Is rainwater harvesting worthwhile? A benefit–cost analysis.” J. Water Resour. Plann. Manage. 147 (4): 04021011. https://doi.org/10.1061/(ASCE)WR.1943-5452.0001361.
Dolan, F., J. Lamontagne, R. Link, M. Hejazi, P. Reed, and J. Edmonds. 2021. “Evaluating the economic impact of water scarcity in a changing world.” Nat. Commun. 12 (1): 1915. https://doi.org/10.1038/s41467-021-22194-0.
EIA (Energy Information Administration). 2015. “Average size of new commercial buildings in the United States continues to grow.” Accessed December 16, 2015. https://www.eia.gov/todayinenergy/detail.php?id=21152.
Ennenbach, M. W., P. Concha Larrauri, and U. Lall. 2018. “County-scale rainwater harvesting feasibility in the United States: Climate, collection area, density, and reuse considerations.” JAWRA J. Am. Water Resour. Assoc. 54 (1): 255–274. https://doi.org/10.1111/1752-1688.12607.
EPA (Environmental Protection Agency). 2012. “Water use tracking.” Accessed May 10, 2018. https://www.energystar.gov/sites/default/files/buildings/tools/DataTrends_Water_20121002.pdf.
EPA (Environmental Protection Agency). 2023. “Types of facilities.” Accessed August 1, 2023. https://www.epa.gov/watersense/types-facilities.
FAO (Food and Agriculture Organization of the United Nations). 1998. “Crop Evapotranspiration—Guidelines for computing crop water requirements.” Accessed June 15, 2015. https://www.fao.org/3/X0490E/x0490e00.htm.
Fuller, A. C., and M. O. Harhay. 2010. “Population growth, climate change and water scarcity in the southwestern United States.” Am. J. Environ. Sci. 6 (3): 249–252. https://doi.org/10.3844/ajessp.2010.249.252.
Garg, K. K., V. Akuraju, K. H. Anantha, R. Singh, A. M. Whitbread, and S. Dixit. 2022. “Identifying potential zones for rainwater harvesting interventions for sustainable intensification in the semi-arid tropics.” Sci. Rep. 12 (1): 3882. https://doi.org/10.1038/s41598-022-07847-4.
Grant, A. T. J., N. L. McKinney, and R. Ries. 2018. “An approach to quantifying rainwater harvesting potential using imagery, geographic information systems (GIS) and LiDAR data.” Water Supply 18 (1): 108–118. https://doi.org/10.2166/ws.2017.026.
Guarino, A. S. 2017. “The economic implications of global water scarcity.” Res. Econ. Manage. 2 (1): 51. https://doi.org/10.22158/rem.v2n1p51.
Hari, D., K. Ramamohan Reddy, K. Vikas, N. Srinivas, and G. Vikas. 2018. “Assessment of rainwater harvesting potential using GIS.” IOP Conf. Ser. Mater. Sci. Eng. 330 (1): 012119. https://doi.org/10.1088/1757-899X/330/1/012119.
He, C., Z. Liu, J. Wu, X. Pan, Z. Fang, J. Li, and B. A. Bryan. 2021. “Future global urban water scarcity and potential solutions.” Nat. Commun. 12 (1): 4667. https://doi.org/10.1038/s41467-021-25026-3.
ICC (International Code Council). 2018 “International Building Code Section 1004: Occupant load.” Accessed December 4, 2023. https://codes.iccsafe.org/content/IBC2018/chapter-10-means-of-egress#IBC2018_Ch10_Sec1004.
Imteaz, M. A., O. B. Adeboye, S. Rayburg, and A. Shanableh. 2012. “Rainwater harvesting potential for southwest Nigeria using daily water balance model.” Resour. Conserv. Recycl. 62 (May): 51–55. https://doi.org/10.1016/j.resconrec.2012.02.007.
IWMI (International Water Management Institute) Climate Atlas. 2010. Historical precipitation and ET data between 1961 and 1990. Richland, WA: Pacific Northwest National Lab.
Jones, M. P., and W. F. Hunt. 2010. “Performance of rainwater harvesting systems in the southeastern United States.” Resour. Conserv. Recycl. 54 (10): 623–629. https://doi.org/10.1016/j.resconrec.2009.11.002.
Leonard, D., and S. Gato-Trinidad. 2021. “Effect of rainwater harvesting on residential water use: Empirical case study.” J. Water Resour. Plann. Manage. 147 (4): 05021003. https://doi.org/10.1061/(ASCE)WR.1943-5452.0001354.
Luo, K., and Y. Li. 2021. “Assessing rainwater harvesting potential in a humid and semi-humid region based on a hydrological model.” J. Hydrol.: Reg. Stud. 37 (Oct): 100912. https://doi.org/10.1016/j.ejrh.2021.100912.
Lupia, F., V. Baiocchi, K. Lelo, and G. Pulighe. 2017. “Exploring rooftop rainwater harvesting potential for food production in urban areas.” Agriculture 7 (6): 46. https://doi.org/10.3390/agriculture7060046.
Mahmoud, W. H., N. A. Elagib, H. Gaese, and J. Heinrich. 2014. “Rainfall conditions and rainwater harvesting potential in the urban area of Khartoum.” Resour. Conserv. Recycl. 91 (Sep): 89–99. https://doi.org/10.1016/j.resconrec.2014.07.014.
Malinowski, P. A., A. S. Stillwell, J. S. Wu, and P. M. Schwarz. 2015. “Energy-water nexus: Potential energy savings and implications for sustainable integrated water management in urban areas from rainwater harvesting and gray-water reuse.” J. Water Resour. Plann. Manage. 141 (12): A4015003. https://doi.org/10.1061/(ASCE)WR.1943-5452.0000528.
Maqsoom, A., B. Aslam, S. Ismail, M. J. Thaheem, F. Ullah, H. Zahoor, M. A. Musarat, and N. I. Vatin. 2021. “Assessing rainwater harvesting potential in urban areas: A building information modelling (BIM) approach.” Sustainability 13 (22): 12583. https://doi.org/10.3390/su132212583.
Marchi, A., G. C. Dandy, and H. R. Maier. 2016. “Integrated approach for optimizing the design of aquifer storage and recovery stormwater harvesting schemes accounting for externalities and climate change.” J. Water Resour. Plann. Manage. 142 (4): 04016002. https://doi.org/10.1061/(ASCE)WR.1943-5452.0000628.
Marston, L., G. Lamsal, Z. H. Ancona, P. Caldwell, B. D. Richter, B. L. Ruddell, R. R. Rushforth, and F. K. Davis. 2020. “Reducing water scarcity by improving water productivity in the United States.” Environ. Res. Lett. 15 (9): 094033. https://doi.org/10.1088/1748-9326/ab9d39.
Mitchell Williams. 2021. “Florida v. Georgia: U.S. Supreme Court addresses decades-long water conflict.” Accessed August 1, 2023. https://www.jdsupra.com/legalnews/florida-v-georgia-u-s-supreme-court-6555838/#:∼:text=The%20Supreme%20Court%20of%20the,-Chattahoochee-Flint%20River%20Basin.
Nechifor, V., and M. Winning. 2018. “Global economic and food security impacts of demand-driven water scarcity—Alternative water management options for a thirsty world.” Water 10 (10): 1442. https://doi.org/10.3390/w10101442.
NREL (National Renewable Energy Laboratory). 2018. “Solar resource data, tools, and maps.” Accessed February 1, 2023. https://www.nrel.gov/gis/solar.html.
Roggenburg, M., D. M. Warsinger, H. Bocanegra Evan, and L. Castillo. 2021. “Combatting water scarcity and economic distress along the US-Mexico border using renewable powered desalination.” Appl. Energy 291 (Jun): 116765. https://doi.org/10.1016/j.apenergy.2021.116765.
Semaan, M., S. D. Day, M. Garvin, N. Ramakrishnan, and A. Pearce. 2021. “Distributed rainwater harvesting: Novel approach to rainwater harvesting systems for single-family households.” J. Water Resour. Plann. Manage. 147 (10): 04021061. https://doi.org/10.1061/(ASCE)WR.1943-5452.0001441.
Texas Water Development Board. 2005. Texas manual on rainwater harvesting. 3rd ed. Austin, TX: TWDB Publication.
Unger, S., E. Kilgannon, D. Elliott, K. Cort, and K. Stoughton. 2023. Water and wastewater annual price escalation rates for selected cities across the United States. Richland, WA: Pacific Northwest National Lab.
Villar-Navascués, R., A. Pérez-Morales, and S. Gil-Guirado. 2020. “Assessment of rainwater harvesting potential from roof catchments through clustering analysis.” Water 12 (9): 2623. https://doi.org/10.3390/w12092623.
WRI (World Resources Institute). 2021. “Aqueduct.” Accessed August 1, 2023. https://www.wri.org/aqueduct/tools.
Yiğit, A. Y. Y., O. Orhan, and A. Ulvi. 2020. “Investigation of the rainwater harvesting potential at the Mersin University, Turkey.” Mersin Photogramm. J. 2 (2): 64–75.
Zhang, B., P. Wu, X. Zhao, X. Gao, and Y. Shi. 2014. “Assessing the spatial and temporal variation of the rainwater harvesting potential (1971–2010) on the Chinese Loess Plateau using the VIC model.” Hydrol. Processes 28 (3): 534–544. https://doi.org/10.1002/hyp.9608.
Zheng, H., Y. Liu, J. Langford, and Z. Zheng. 2021. “Water supply reliability of a joint rainwater storage and on-stream reservoir system.” J. Water Resour. Plann. Manage. 147 (9): 04021053. https://doi.org/10.1061/(ASCE)WR.1943-5452.0001411.
Information & Authors
Information
Published In

Journal of Water Resources Planning and Management
Volume 150 • Issue 5 • May 2024
Copyright
This work is made available under the terms of the Creative Commons Attribution 4.0 International license, https://creativecommons.org/licenses/by/4.0/.
History
Received: Apr 26, 2023
Accepted: Dec 7, 2023
Published online: Mar 4, 2024
Published in print: May 1, 2024
Discussion open until: Aug 4, 2024
ASCE Technical Topics:
- Cooling towers
- Data analysis
- Drinking water treatment
- Engineering fundamentals
- Environmental engineering
- Geographic information systems
- Geomatics
- Information systems
- Mapping
- Measurement (by type)
- Methodology (by type)
- Metric systems
- Rain water
- Research methods (by type)
- Structural engineering
- Structures (by type)
- Surveying methods
- Systems engineering
- Towers (by type)
- Water (by type)
- Water and water resources
- Water management
- Water treatment
Authors
Metrics & Citations
Metrics
Citations
Download citation
If you have the appropriate software installed, you can download article citation data to the citation manager of your choice. Simply select your manager software from the list below and click Download.