Lake Impoundment in Advance of Post-Flood Period Based on Large-Scale Numerical Simulation
Publication: Journal of Water Resources Planning and Management
Volume 149, Issue 8
Abstract
Influenced by climate warming and human disturbance, the contradiction between flood control and water supply of the rivers-connected lake is becoming more prominent, and the prevailing dispatch system mainly aimed at flood control is a serious challenge for storage allocation. This paper presents a lake impoundment in advance method during flood recession period, which preliminarily explores the traditional dispatch model and couples it with a high-precision hydrodynamic model. A one- and two-dimensional coupled hydrodynamic model was constructed for integrated flood regulation in the “river-lake-flood detention basin” system. Then a sample library of water storage strategies was developed, which combined impounding times and gate operation schemes based on previous engineering experience. Thus, by combining large-scale numerical simulations of flood scenarios and risk-benefit assessment, the dispatching schemes facilitating the combined use of gates during the post-flood period under different wet-dry conditions were determined. The results show that: (1) the hydrological-hydrodynamic model has high accuracy for realizing the elaborate simulation of flood evolution and inundation dynamic between lands and lakes, with the average error controlled from 0.03 to 0.14 m, (2) the strategy extraction method of post-flood impoundment in advance for the lake basin is proposed, which takes the impounding times, gate scheduling rules, and inflow scenarios into account comprehensively, and (3) under the optimal storage strategies, the water storage efficiency is significantly improved, with the water level overrun rate controlled at 19.24%, the terminal storage level raised by 0.96 m, and the storage capacity increased by on average. The outcomes will provide support for flood control and water storage improvement during the post-flood period, which is beneficial to the utilization and management of flood resources.
Introduction
Affected by global climate warming and high-intensity human disturbance, extreme flood-drought events have increased significantly, and the hydrological situation of rivers and lakes is varying inordinately. However, the prevailing dispatch system generally takes flood control as the priority task, and limited by the regulation ability of hydraulic engineering, more than 60% of runoff enters the sea through floods (Hu et al. 2004), which makes a serious shortage of water supply in the nonflood period. Moreover, the rivers-connected lakes, as the key node of flood-waterlogging and the effective reservoir for water impoundment and interbasin water diversion, have greatly shrunk with the storage and environmental capacity decreased, resulting in a serious threat to the storage allocation in recent years. In the field of “flood utilization,” natural flood potential is utilized through the coordinated operation of various projects to transform flood into conventional or usable water (Bouma et al. 2005; Ding et al. 2015; He et al. 2018). Thus, with the development, implementation, and popularity of the concept of integrated water resource utilization (Yutaka and Juha 2004; Jia and Li 2021), “flood utilization” has become the focus of efforts to alleviate regional water scarcity in the future.
Research on flood utilization has undergone developments in technology and methodology in terms of its fundamental theory and practical application (Lund 2021). The target of these studies is flooding that exceeds the standard levels under the conventional use and standardized scheduling of existing engineering. Presently, both Chinese and international scholars consider flood utilization as a measure to improve watershed water supply potential using various engineering methods. These can help intercept and store rainwater resources to the maximum extent, prolong the retention time of floodwater in rivers and flood detention basins, and combine storage, discharge, detention, diversion, and replenishment. Through scientific and reasonable scheduling and management, alleviate the pressure of water shortage during dry years (Raso et al. 2019), and meet the economic, social, and ecological water demand (Leno et al. 2014; Ji et al. 2020; Hua et al. 2020). According to the components of the basin flood control system (Wang et al. 2017), the current flood utilization methods primarily include the optimal control of reservoir flood-limited water level and beneficial dispatch (Jiang et al. 2015; Chang et al. 2017; Jiang et al. 2017; Ding et al. 2017; Xie et al. 2018), the ineffective use of flood storage and detention basins (Belikov et al. 2021; Wallington and Cai 2020), and the compensating operation of river and lake connectivity (Lai et al. 2013; Zhang et al. 2020b). Based on the existing studies, there is a knowledge gap in investing in flood utilization from the perspectives of scenario simulation, extraction of dispatching scheme, and risk-benefit analysis among different water bodies. Therefore, this study focused on the implementation pathways and technical difficulties for flood utilization of “rivers-connected” lakes, which have been insufficiently investigated by existing studies.
Large lakes in plains are generally characterized by the dual properties and functions of reservoirs and flood detention basins, but they differ based on the following aspects. (1) Unlike artificially constructed reservoirs, lakes usually exist in a radial river network system, which links rivers, seas, and lakes. The inflow and outflow conditions are extremely complex, and the concept of flood control design for dam sites is not available, (2) compared to valley reservoirs, the large area of lake surface results in extremely short rainfall-runoff time, which has a significant impact on the lake level. Consequently, large errors inevitably occur when using the traditional stage-discharge relationship curve (Luo et al. 2021a, b), (3) the lake and its surrounding terrain are complex, often affected by tides and wind. The hydrodynamic characteristics of lakes often present waves and shore currents (Zhang et al. 2020c). Besides, there are abundant flood detention basins around lakes, the activation of which also causes severe fluctuations in the lake levels, and (4) the presence of various hydraulic engineering facilities such as gates and dams in the plain river network has weakened the hydraulic conditions (Hao et al. 2009). The flood evolution simulation and optimized scheduling operations are closely related, so the problems of inaccuracy in flood simulation and the spatial and temporal variability of dispatching schemes must be urgently solved. However, the application of various advanced theories and methods remains difficult in the lake basin, further posing major challenges for scheduling lake water resources.
Impoundment in advance is an important method of “flood utilization” in lakes to alleviate water stress and ensure adequate water supply during the post-flood period. The selection of the impounding time (Li et al. 2006; Wang et al. 2020) and formulation of the dispatching scheme (Hu et al. 2018) are crucial to determining the comprehensive effect of flood risk and benefits to lakes by applying the schemes through real and designed simulations. As the dispatching process of the lake involves multiple control gates, external discharge culverts, and pumps (Wu et al. 2015), its hydrological and hydrodynamic elements are more sensitive to the response of different regional runoff components (Li et al. 2015). Moreover, the combined use of multiple discharge channels increases the complexity and flexibility of dispatching. Therefore, the hydro-hydrodynamic numerical model is often used to replace the traditional flood regulation calculation of reservoir and applied to simulate the flood evolution scenarios for rivers, lakes, and flood detention basins to extract the gate operation schemes (Zhang et al. 2020a). Owing to the complex hydrodynamics of river-lake coupled systems, developing a model that can fully meet the requirements of flood simulation and decision-making in such areas is extremely difficult. However, many scholars have explored and contributed significantly to the development of modeling algorithms (Tucciatelli and Termini 2000; Caleffi et al. 2003; Sosa et al. 2020) and application (Zhang et al. 2014; Han et al. 2014; Robi et al. 2019). Current hydrodynamic models that are more internationally recognized and widely used include the MIKE series, Environmental Fluid Dynamics Code (EDFC), and Delft3D models. These models are represented by analytical partial differential equations obtained by discretizing and solving the Saint-Venant equations and planar two-dimensional shallow water equations of motion, which are used to simulate the exchange of water flows among complex terrain, water system, and floodplain with high accuracy. Relying on flood reproduction techniques to restore the water surface characteristics and inundation conditions under real scenarios is crucial for flood prevention and mitigation, and redistribution of flood resources in the basin. Up to now, flood management methods that effectively combine flood movement simulation with an engineering-optimized scheduling model have not been reported, and studies to integrate the extraction of lake water storage dispatch schemes and risk-benefit assessment remain lacking.
Taking the typical Hongze Lake as an example, this study develops a hydrodynamic model for the rivers-connected lake with its flood detention basin by MIKE software. Then generalizes a bivariate storage strategy sample library composed of different impounding times and multistaged scheduling rules by the enumeration method. After that, the optimal solution of the storage strategies is approximated through large-scale elaborate numerical simulation combined with the evaluation and optimum seeking methods. Finally, we propose a set of post-flood impoundment in advance regulation for different inflow scenarios. This study excepts to provide systematic theories and technical methods for flood utilization and management in rivers-connected lakes.
Case Study
Description of Research Area
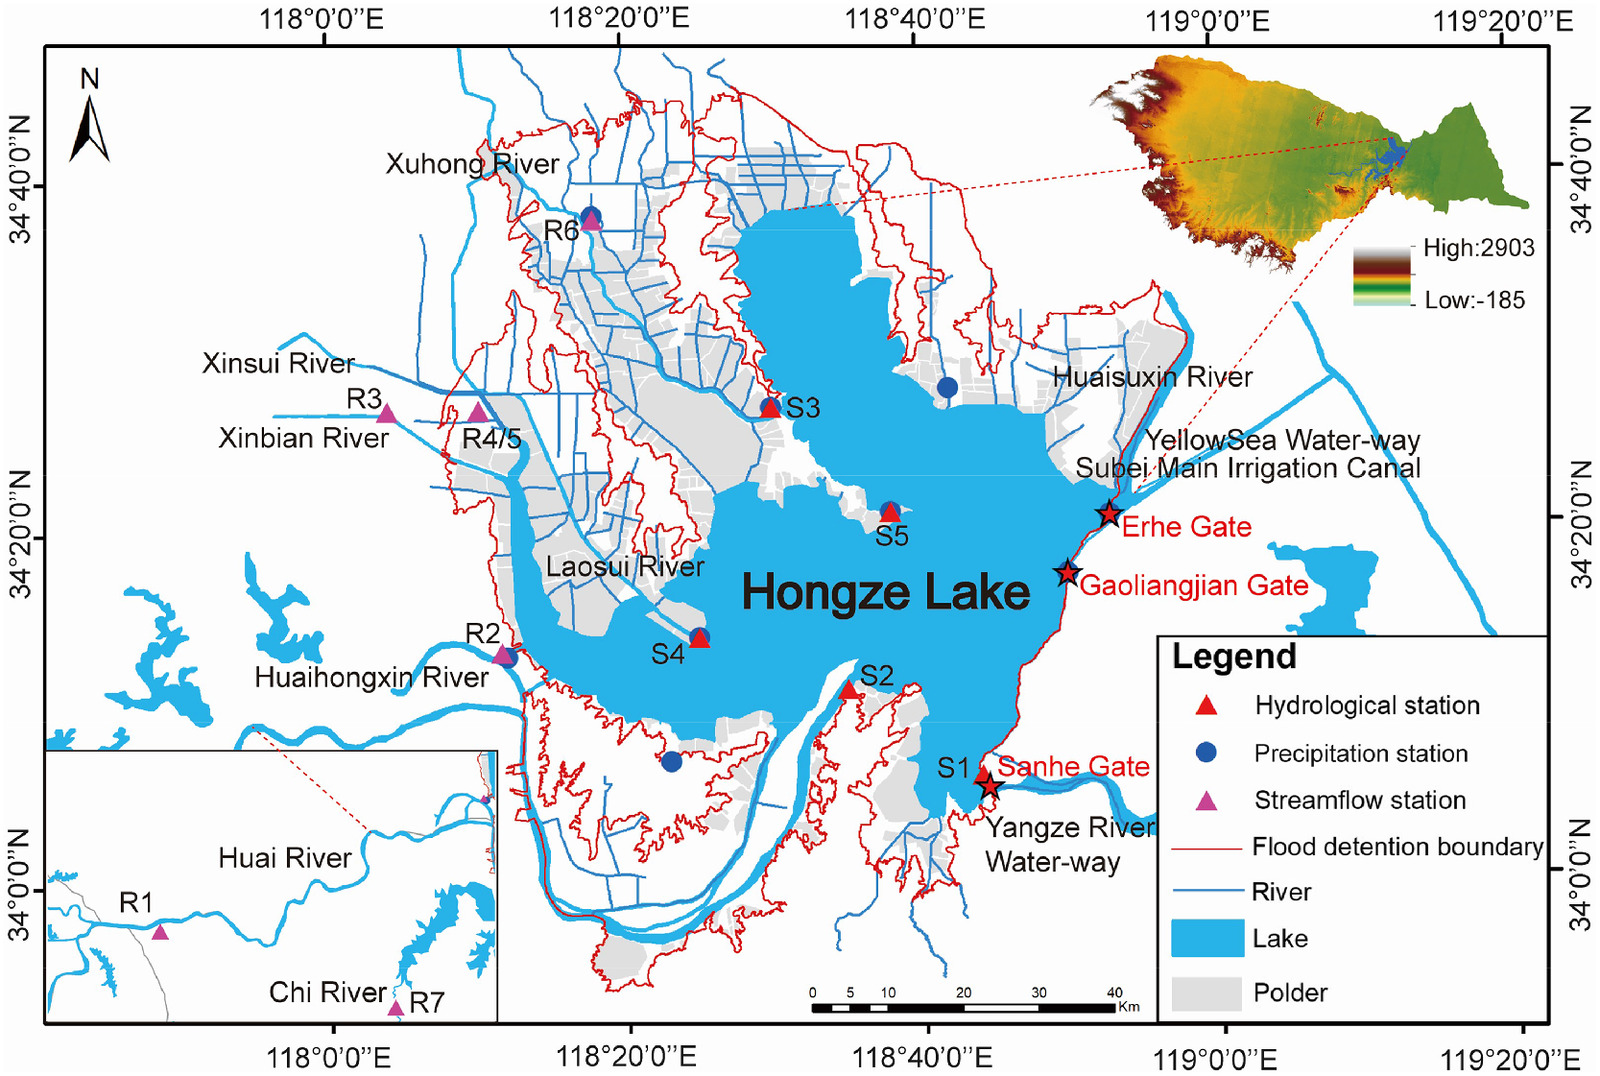
The research area considered in this paper is Hongze Lake, the fourth-largest freshwater lake in China and the largest lake-type reservoir in the Huai River Basin, located between 118°10′E-118°52′E and 33°06′N-33°40′N (Fig. 1). Significantly affected by the East Asian monsoon, the precipitation is unevenly distributed in space and time and is mostly concentrated from May to September, correspondingly the flood season is divided into three phrases, including the pre-flood period (May 1 to June 20), the main-flood period (June 21 to August 20) and the post-flood period (August 21 to September 30) (Wang et al. 2021), abbreviated as PRF, MAF, and POF, respectively.
Presently, the normal water level is 13.33 m, the corresponding water area is , and the reservoir capacity is . The dead water level, flood control level, design water level, and check water level are 11.13, 12.33, 15.83, and 16.83 m, respectively, based on the 1985 National Elevation Datum. The corresponding reservoir capacity for flood control is .
Seven major tributaries flow from the west into Hongze Lake, including the Huai, Huaihongxin, Xinsui, Laosui, Xinbian, Xuhong, and Chi Rivers. Of these, the Huai River is the main source of recharge, accounting for more than 70% of the total inflow. The main flood-control projects of Hongze Lake contain three parts, the drainage channels with corresponding hydraulic structures, Hongze-dike, and the flood detention basin. The four main drainage channels are Huai River-Yangze River waterway, North Jiangsu irrigation canal, Huai River-Yellow Sea waterway, and Huaisuxin River, and the corresponding control gates are the Sanhe Gate, Erhe Gate, and Gaoliangjian Gate.
Data Sources
The daily runoff data of the main channels into Hongze Lake (inflow and outflow) from 1959 to 2014 and daily precipitation, evaporation, and water level data around the lake area from 1979 to 2014 were obtained from the Huaihe River Commission, the Ministry(CN). The main monitoring points included the seven streamflow stations at Wujiadu (R1), Fengshan (R2), Tuanjiezha (R3), Sihongxin (R4), Sihonglao (R5), Jinsuozhen (R6), and Mingguang (R7), and the five hydrological stations at Jiangba (S1), Laozishan (S2), Xiangchengzhuang (S3), Linhuaitou (S4), and Shangzui (S5). The topographic and engineering information required for modeling Hongze Lake with its surrounding flood detention basin was obtained from a DEM topographic map, comprising river networks, cross sections, location of hydraulic structures and embankments, and land-use classifications. The previous information was obtained from the Water Resources Department, Jiangsu Province (CN).
Typical Years of Simulation
This paper focuses on the issue of water impoundment in the POF. Since the magnitude and duration of the flood in the MAF and POF would both influence the initial water level (model input) of the POF, the transition from the MAF to POF was considered when classifying the typical years. Based on the results of staged frequency distribution, the abundant-dry conversion, and flood magnitude of Hongze Lake from 1959 to 2018 are shown in Table 1. The frequency of 0%–37.5% is defined as high-flow, 37.5%–62.5% as medium-flow, 62.5% and above as low-flow according to the hydraulic design standards. The abundant-dry situations of the MAF and POF were combined in pairs, including high-high, high-medium, high-low; medium-high, medium-medium, medium-low; low-high, low-medium, and low-low. Thus, 9 typical years were identified according to the order of decreasing volume of water entering the lake in flood season, covering the vast majority of inflow conditions.
| Year | Inflow of MAF | Inflow of POF | Flood characteristics in POF | |||||
|---|---|---|---|---|---|---|---|---|
| Type | Frequency (%) | Type | Frequency (%) | Start date | End date | Peak flow () | Peak present date | |
| 2003 | High | 1.64 | High | 6.56 | August 23 | September 16 | 6,922.9 | August 30 |
| 2008 | Medium | 37.70 | High | 24.59 | August 20 | August 31 | 5,509.6 | August 24 |
| 2004 | Low | 60.66 | High | 27.87 | August 27 | September 5 | 3,470.3 | August 1 |
| September 20 | September 29 | 1,701.0 | September 23 | |||||
| 2000 | High | 24.59 | Medium | 44.26 | August 21 | September 20 | 2,242.5 | September 2 |
| September 24 | December 15 | 4,335.2 | October 4 | |||||
| 1985 | Medium | 65.57 | Medium | 52.46 | August 22 | September 10 | 1,616.8 | August 24 |
| September 15 | September 28 | 2,387.0 | September 20 | |||||
| 2011 | Low | 80.33 | Medium | 54.10 | August 24 | September 5 | 3,451.5 | August 27 |
| 1996 | High | 16.39 | Low | 63.93 | September 5 | September 30 | 2,260.3 | September 23 |
| 2006 | Medium | 36.07 | Low | 68.85 | August 25 | September 22 | 1,505.6 | September 11 |
| 1994 | Low | 95.08 | Low | 86.89 | August 26 | September 23 | 947.9 | September 10 |
Methodology
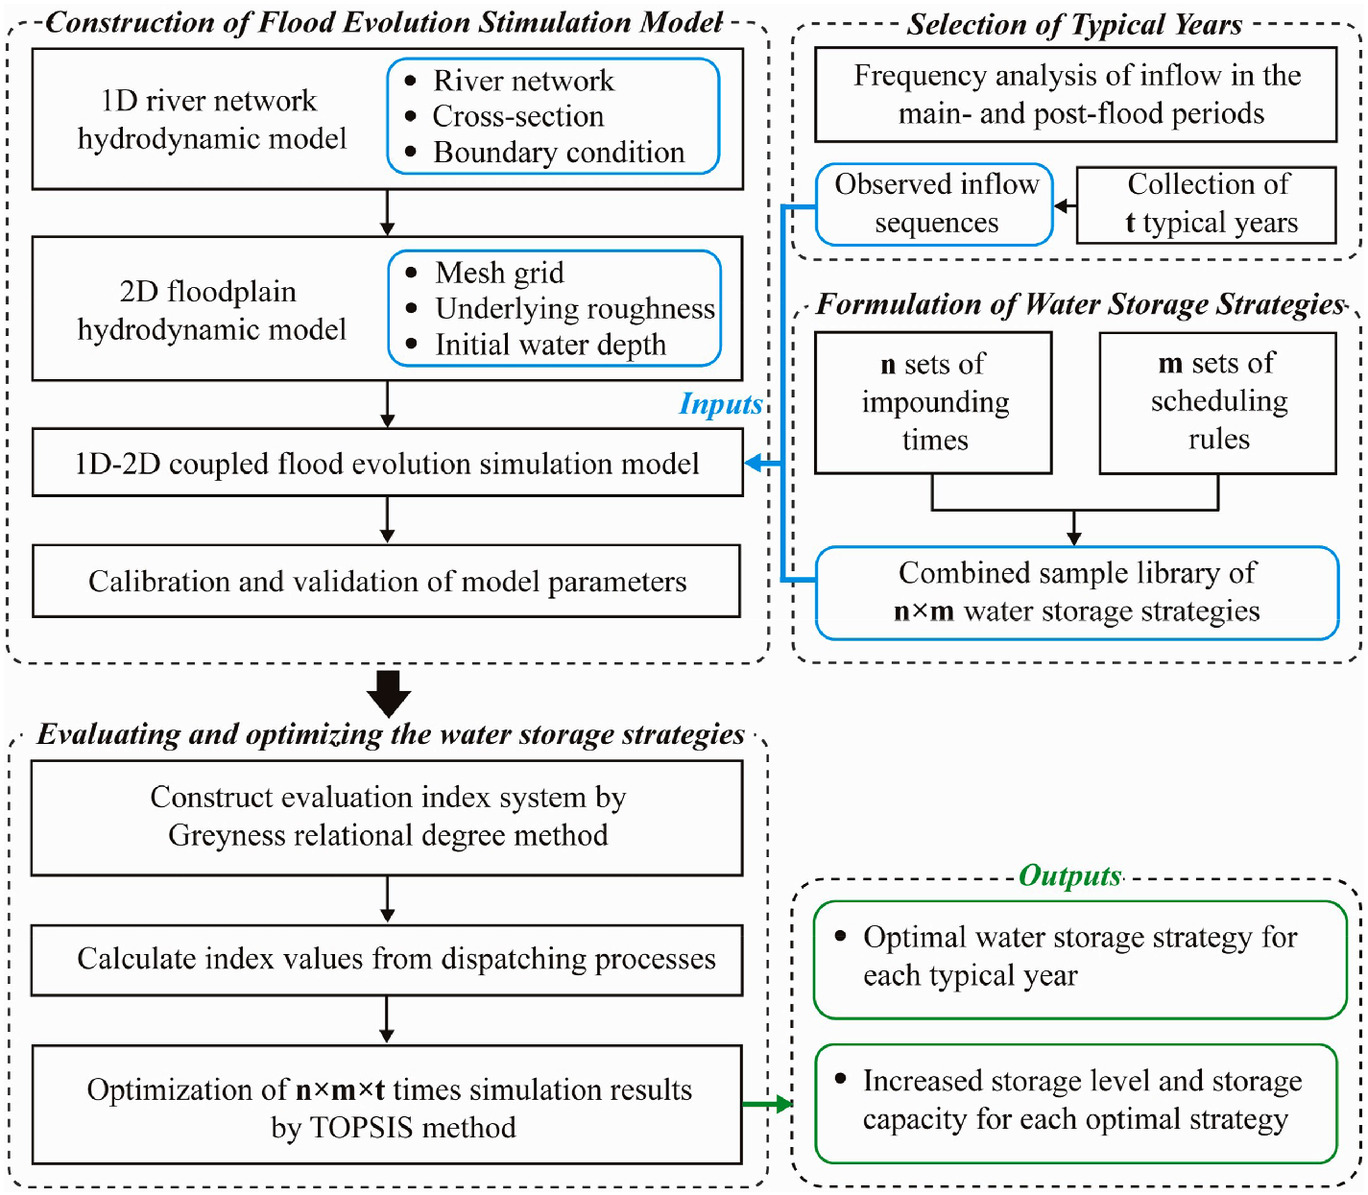
The research was carried out in three stages: (1) construction of the lake hydro-hydrodynamic model, (2) formulation of impounding time and scheduling rules in flood recession, and (3) optimizing and evaluating water storage strategies. Fig. 2 presents the methodological framework.
Lake Hydrological-Hydrodynamic Model Construction
This section established a one-dimensional (1D) river network hydrodynamic model based on MIKE 11 and a two-dimensional (2D) floodplain hydrodynamic model based on MIKE 21. The two models were coupled into the MIKE FLOOD (DHI 2013; Li et al. 2019) to achieve elaborate numerical simulations of flow movement and water exchange among rivers, Hongze Lake, and the floodplain. The basic principles and details of the model are as follows:
1.
1D river network hydrodynamic model
The 1D river network model is theoretically based on the Saint-Venant equations:where , , and = average water level, discharge, and acreage of the cross-section, respectively; = Chézy coefficient; = tributary flow; = gravity; = hydraulic radius; and = momentum correction coefficient.
(1)
(2)
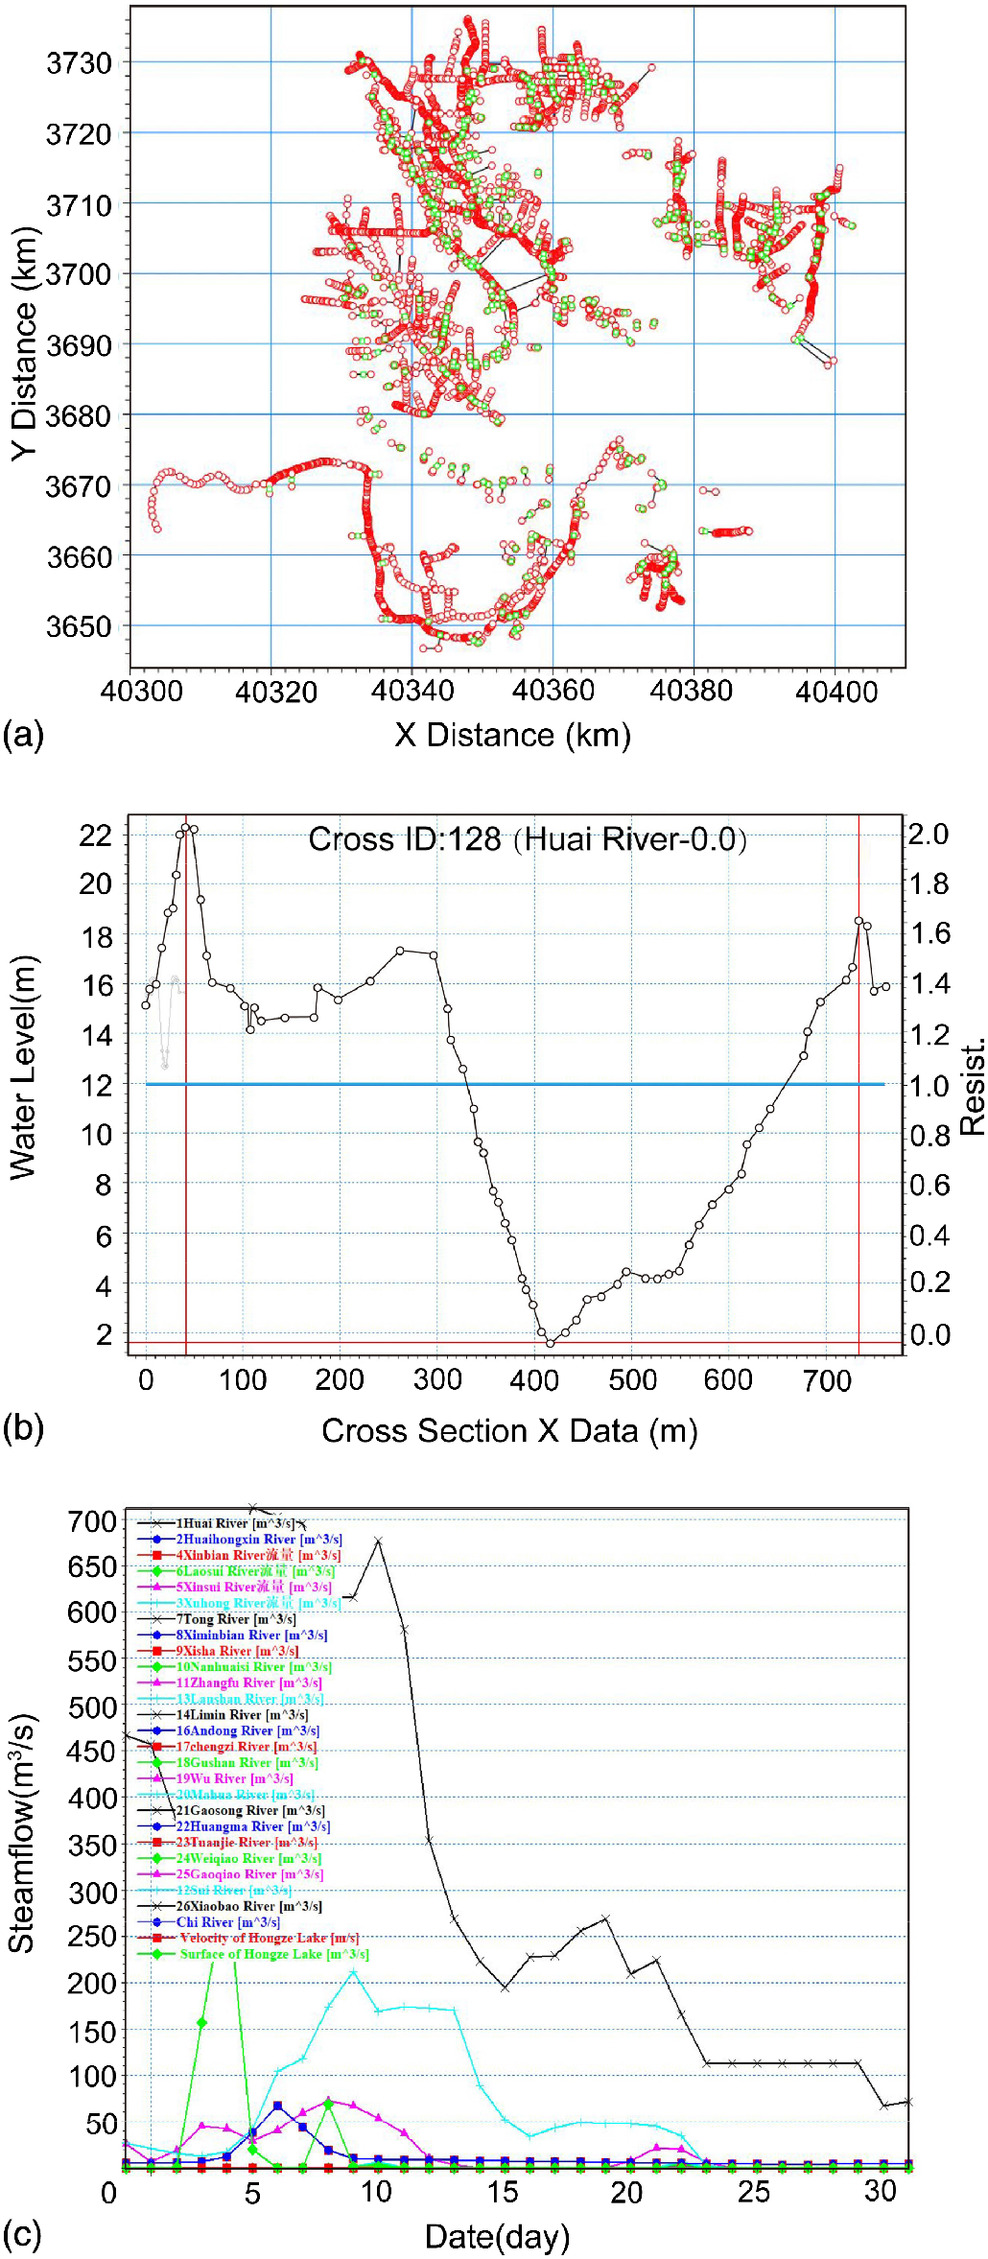
The equation system is discretized using the six-point implicit differential format proposed by Abbott and Ionescu, alternatively calculating the water level or flow quantity in an ordered grid. The discrete equations are solved using the 2D elimination method. In the 1D river network modeling, 128 rivers and ditches and 322 rivers in the polder, which significantly influence the regulation of Hongze Lake, were constructed. Meanwhile, 2135 river cross sections, bed roughness, and dispatching rules of relative hydraulic structures were described. This model simulates the gate opening and closing impact on flow movement under 1D conditions. The basic files applied in the model construction are shown in Fig. 3.
2.
2D floodplain hydrodynamic model
The 2D floodplain model obeys the assumptions of Boussinesq and hydrostatic pressure, theoretically based on the incompressible Reynolds-averaged Navier-Stokes equationwhere and = Cartesian coordinates; = total water depth; = source-sink term; and = components of velocity in and directions, respectively; and = average velocities; and = velocity of . The Coriolis force coefficient, , = angular velocity of Earth’s rotation, = geographical latitude; and = acceleration resulting from Earth’s rotation; = water level; = water density; = local atmospheric pressure; , , and = radiation stress component; , , and = horizontal viscous stress term; , , , and = components of water surface and streambed shear stress in and directions.
(3)
(4)
(5)
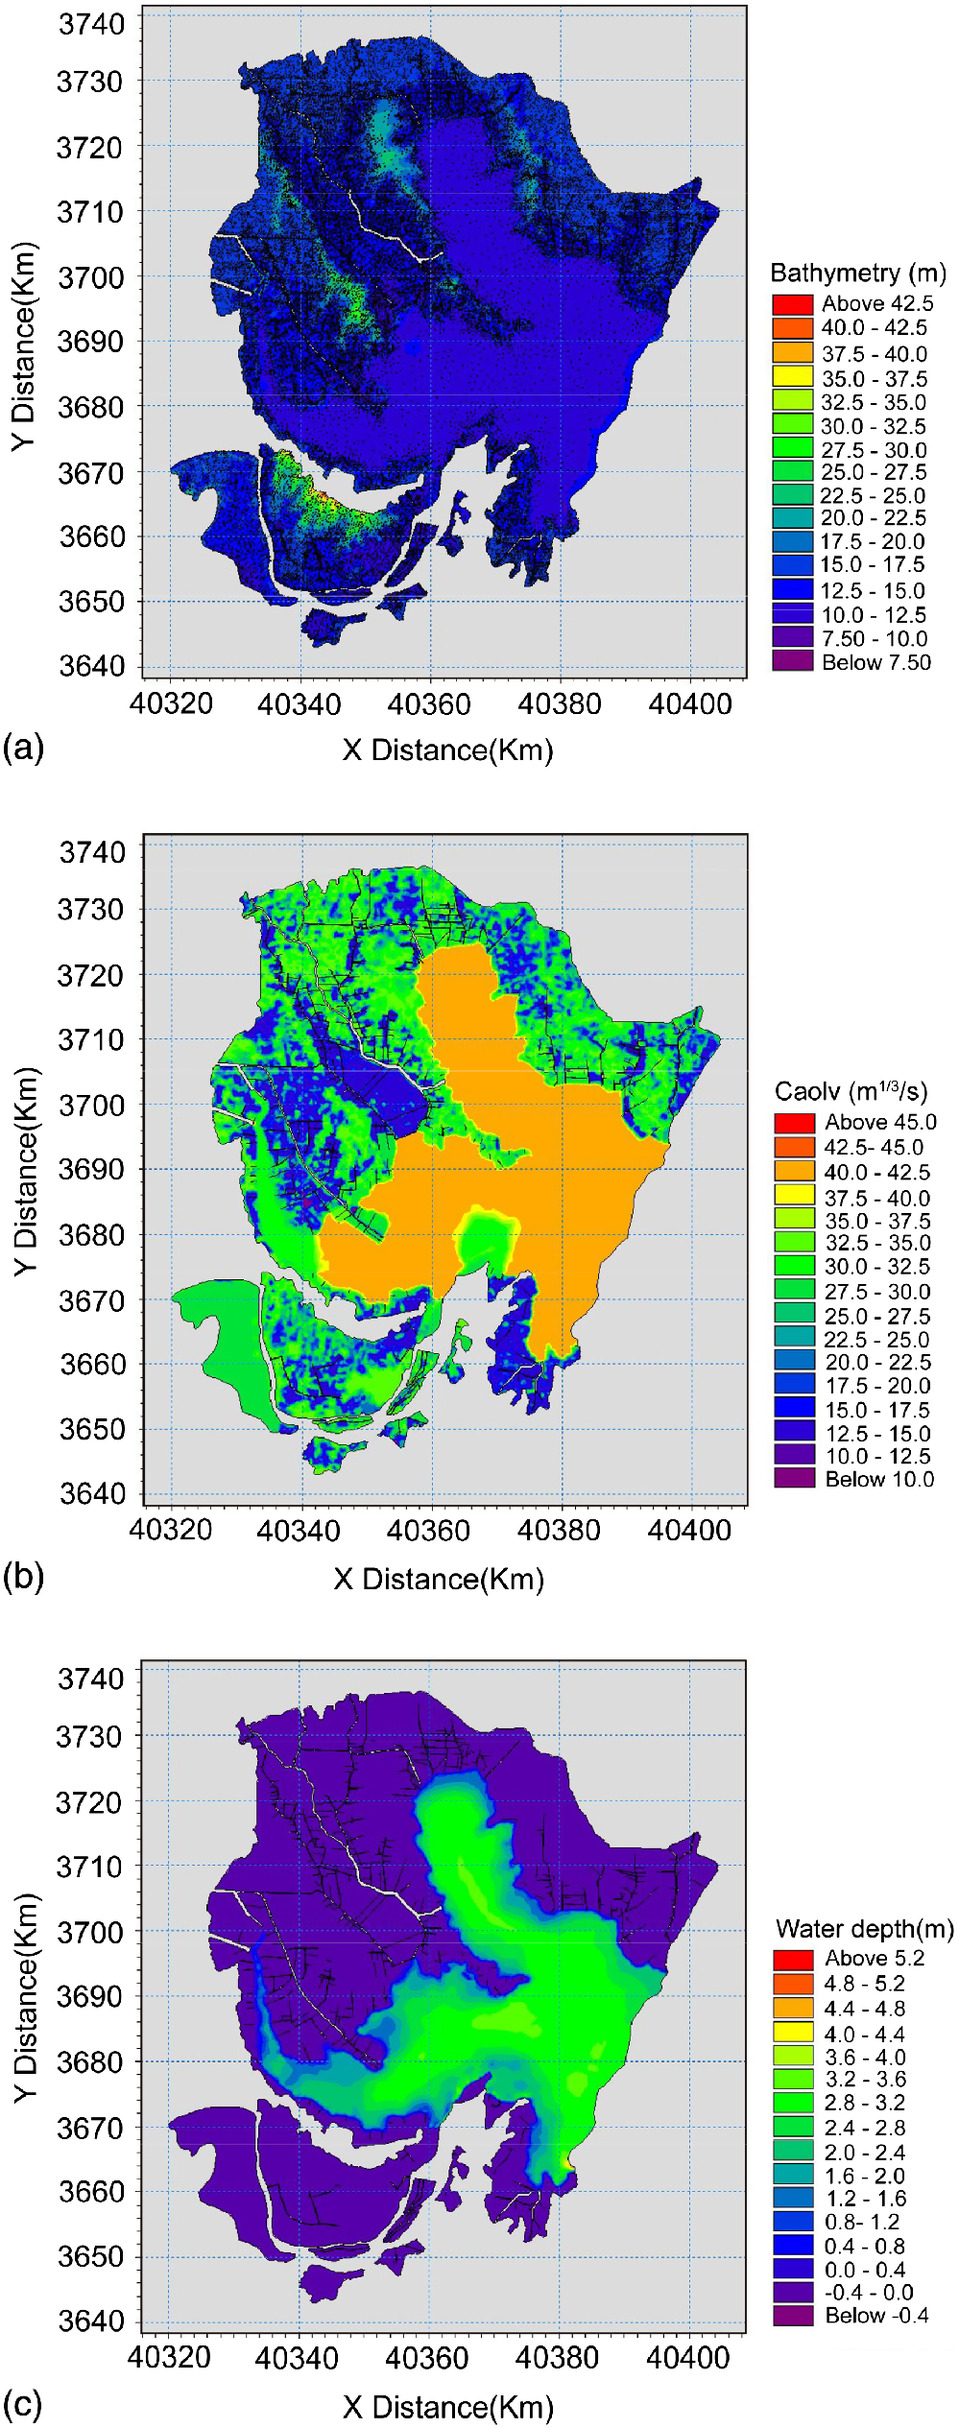
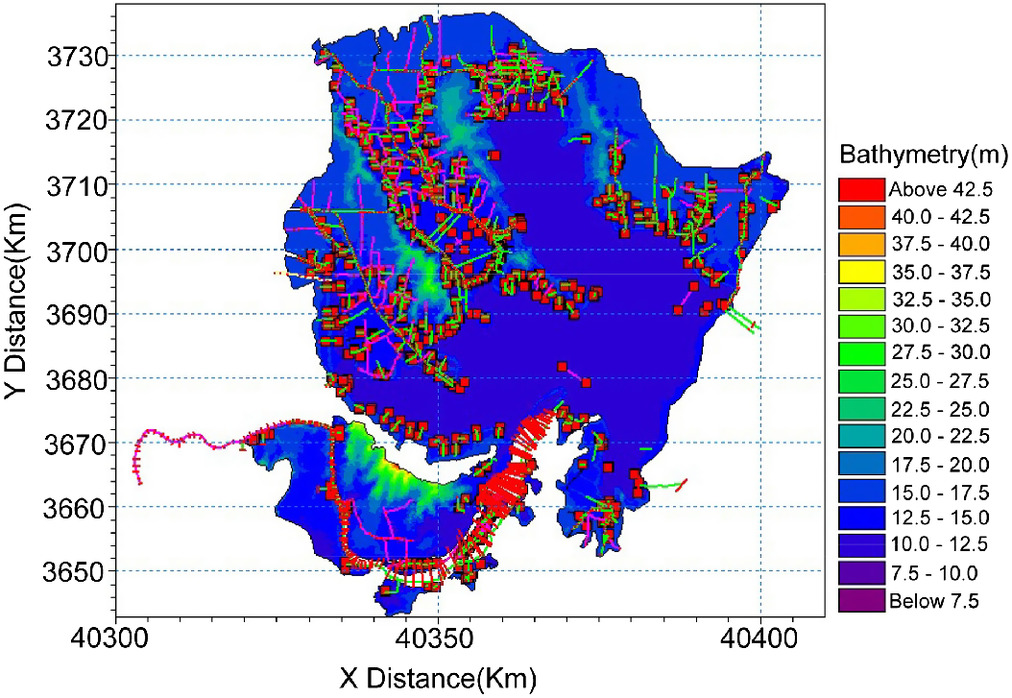
Here, the finite volume method and the two-step Runge-Kutta method with second-order accuracy are used to discretize the control equations of space-time. In the 2D hydrodynamic modeling of Hongze Lake, we introduced a 1:10,000-scale topographic map and high-resolution DEM, then delineated the study region into 85,894 unstructured triangular meshes and generalized roads with 1,634 segments. Subsequently, different roughness values were set according to the underlying surface. The rainfall-runoff process was set as the upper boundary of the model. Except for the seven controlled rivers, the hydrological calculations were performed on the small rivers around Hongze Lake and its surface, the former converged into the adjacent backbone rivers as point sources, and the latter was added as a source-sink term. This model calculated and simulated the inundation process of the lake water surging into the surrounding floodplain area. The files used in the model construction are shown in Fig. 4.
3.
1D-2D coupling flood evolution simulation model
The 1D-2D coupled flood evolution model was constructed to simulate the flood dynamic process among river networks, floodplains, and lakes. For the standard connection established between the inlet river channels and Hongze Lake, the dike-breaking gates and flood detention basin maps the line connector to the boundary of one or more grid units to form the coupled lines. While the 1D model provides boundary flow to the 2D model, the 2D model returns the average water level on the coupled line to the 1D model. The lateral connection between rivers in the polder and floodplain attaches the 2D grid units to the 1D river reaching from the side. The coupled line is determined by the coordinates to which the mapped grid units are involved. Here, we used the hydraulic structure flow equations to calculate the flow magnitude through the lateral connection. The schematic of the coupled lines for the standard and lateral connections is shown in Fig. 5.
Formulation of Impounding Time and Scheduling Rules
As the transition between flood season and nonflood season, the POF has the double tasks of flood control and water storage. Therefore, to optimize the lake’s storage strategy in this stage, the impounding time and scheduling rule were combined into a storage strategy sample library.
1.
Impounding time
The impounding time refers to the start time of the water storage scheduling. It typically takes the beginning of the POF as the first impounding time, and subsequently, develops several moments as the sample set (). By analyzing the concentration degree of the 50-y series of runoff, we confirmed that the runoff during the POF exhibits the characteristics of homogenization, which is especially evident after 2,000. Therefore, the impounding times were set at equal intervals. Plot the flood duration map and its nonexceedance probability graph, and count sustained days of flood duration under 95% frequency as a reasonable time interval. Then, the number of impoundment time samples () is defined as the total days of POF divided by , here .
2.
Scheduling rule
The setting of the post-flood storage scheduling rules for lakes aims to extend the upper and lower limits of regulation based on the existing dispatching scheme, so that the decision-makers can effectively adapt to different flood conditions. Accordingly, “” scheduling schemes were set, and the specific design process is as follows:
a.
Determine the operation range of water level as 12.33 to 13.33 m (Wang et al. 2021). When the water level is higher than 13.33 m, the main conflict is flood prevention and mitigation. In contrast, when it is below 12.33 m, the gates should strictly control the discharge flow to raise the water level moderately, which allows more water to be stored to prepare for the high agricultural water requirements during the nonflood season. For a water level of 13.33 m and above, the existing flood control scheduling rules remain unchanged.
b.
Select suitable storage gates. Analyzed the scheduling rules for all outlet gates within the operation range, and eliminated gates used in special conditions or with minor discharge capacity.
c.
Formulate reasonable discharge flow. Given the similarity of the runoff between PRF and POF, the discharge should be adjusted based on the former. If encountered with a large-grade flood, the water discharge should be reduced at a low water level below 12.83 m and increased for a water level above 13.33 m. If the lake could not reach a full status caused by the drought, water should not be discharged before the water level reaches 13.33 m.
Evaluating and Optimizing the Water Storage Strategies
The evaluation of water storage strategies was assessed in terms of flood control risks and storage benefits. Six indicators for flood prevention and water supply, were initially selected to constitute the evaluation system according to the crucial elements in water resource management and regulation of Hongze Lake (Zeng et al. 2003). The indicators and their formulas are shown in Table 2.
| Target Layer A | Standard Layer B | Index Layer Ca | Meaning of indicator | Formula | |
|---|---|---|---|---|---|
| Symbol | Index | ||||
| Water storage regulation of Hongze Lake in the POF | Flood control | WLORb | Duration which the lake water level exceeded the flood-limit level during storage | c | |
| HWL | The maximum water level during storage, which exhibits extreme characteristics of flood risk | ||||
| IA | Areas with maximum inundation depth greater than 7 cm (upper limit of water depth control in paddy fields) | d | |||
| Water supply | SLEP | Adherence of the lake water level to the normal water level at the end of the POF | |||
| ISC | Incremental water storage of implementation strategy compared to current flood scheduling rule | , e | |||
| SR | Ratio of the abandoned water to the total inflow during the POF | f | |||
a
WLOR is the water level overrun rate of Jiangba. HWL is the highest water level. IA is the inundation acreage. SLEP is the water storage level at the end of the POF. ISC is the increased storage capacity. SR is the spilling rate.
b
Jiangba station is the representative hydrological station of Hongze Lake.
c
is the number of days when the water level exceeds the flood-limit level ( varies linearly from 12.83 m to 13.33 m) for the corresponding period under the th strategy, and is the total days of POF.
d
is the inundated area of the th grid, is the total number of spatial grids, and is the water depth at the center of the grid.
e
is the stage-capacity curve of Hongze Lake and is the current dispatch scheme.
f
is the average discharge flow at gate during period , is the total inflow volume, is the total days of MAF, and is the number of gates.
The greyness relational degree method (Sun et al. 2018) was used to screen the top three indicators in terms of importance and construct a water storage strategy optimization system.
To eliminate the stochasticity of the hydrological process to the possible extent, several typical years were selected with the combination of wet-dry encounters in the MAF and POF. For storage strategies of each typical year, the technique for order preference by similarity to an ideal solution (TOPSIS) method (Walczak and Rutkowska 2017; Cunha et al. 2019) was applied to sort the simulation results to obtain the optimal strategy. The principle of the TOPSIS method is to accurately evaluate different schemes according to the approximation between the evaluation object and the optimal target. The basic calculation steps are as follows. First, for a typical year, the extremely small indicators (e.g., , , , and ) and intermediate indicators (e.g., ) were subjected to forward transformation and dimensionless processing, respectively. Subsequently, obtain the positive normalization matrix . Then, the positive ideal solution and negative ideal solution of the water storage strategy were defined to calculate the Euclidean distance and between and in groups of storage strategies. Finally, the relative closeness was obtained. The larger the value of , the closer the water storage strategy to the optimal solution, and thus, the water storage strategies were ranked. The calculation equations are as follows:where = value of the th index after forwarding; = initial value of the th index; and = maximum and optimal values of the original data, respectively; type = transformation type, min = smallest type, and middle = intermediate type; and = positive and negative ideal solutions of matrix ; and = Euclidean distances between the water storage strategy and and ; = number of strategy groups; = number of evaluation indexes; = weight of the th index; and = relative closeness of the th water storage strategy to the ideal solution.
(6)
(7)
(8)
(9)
Results and Discussion
Model Calibration and Validation
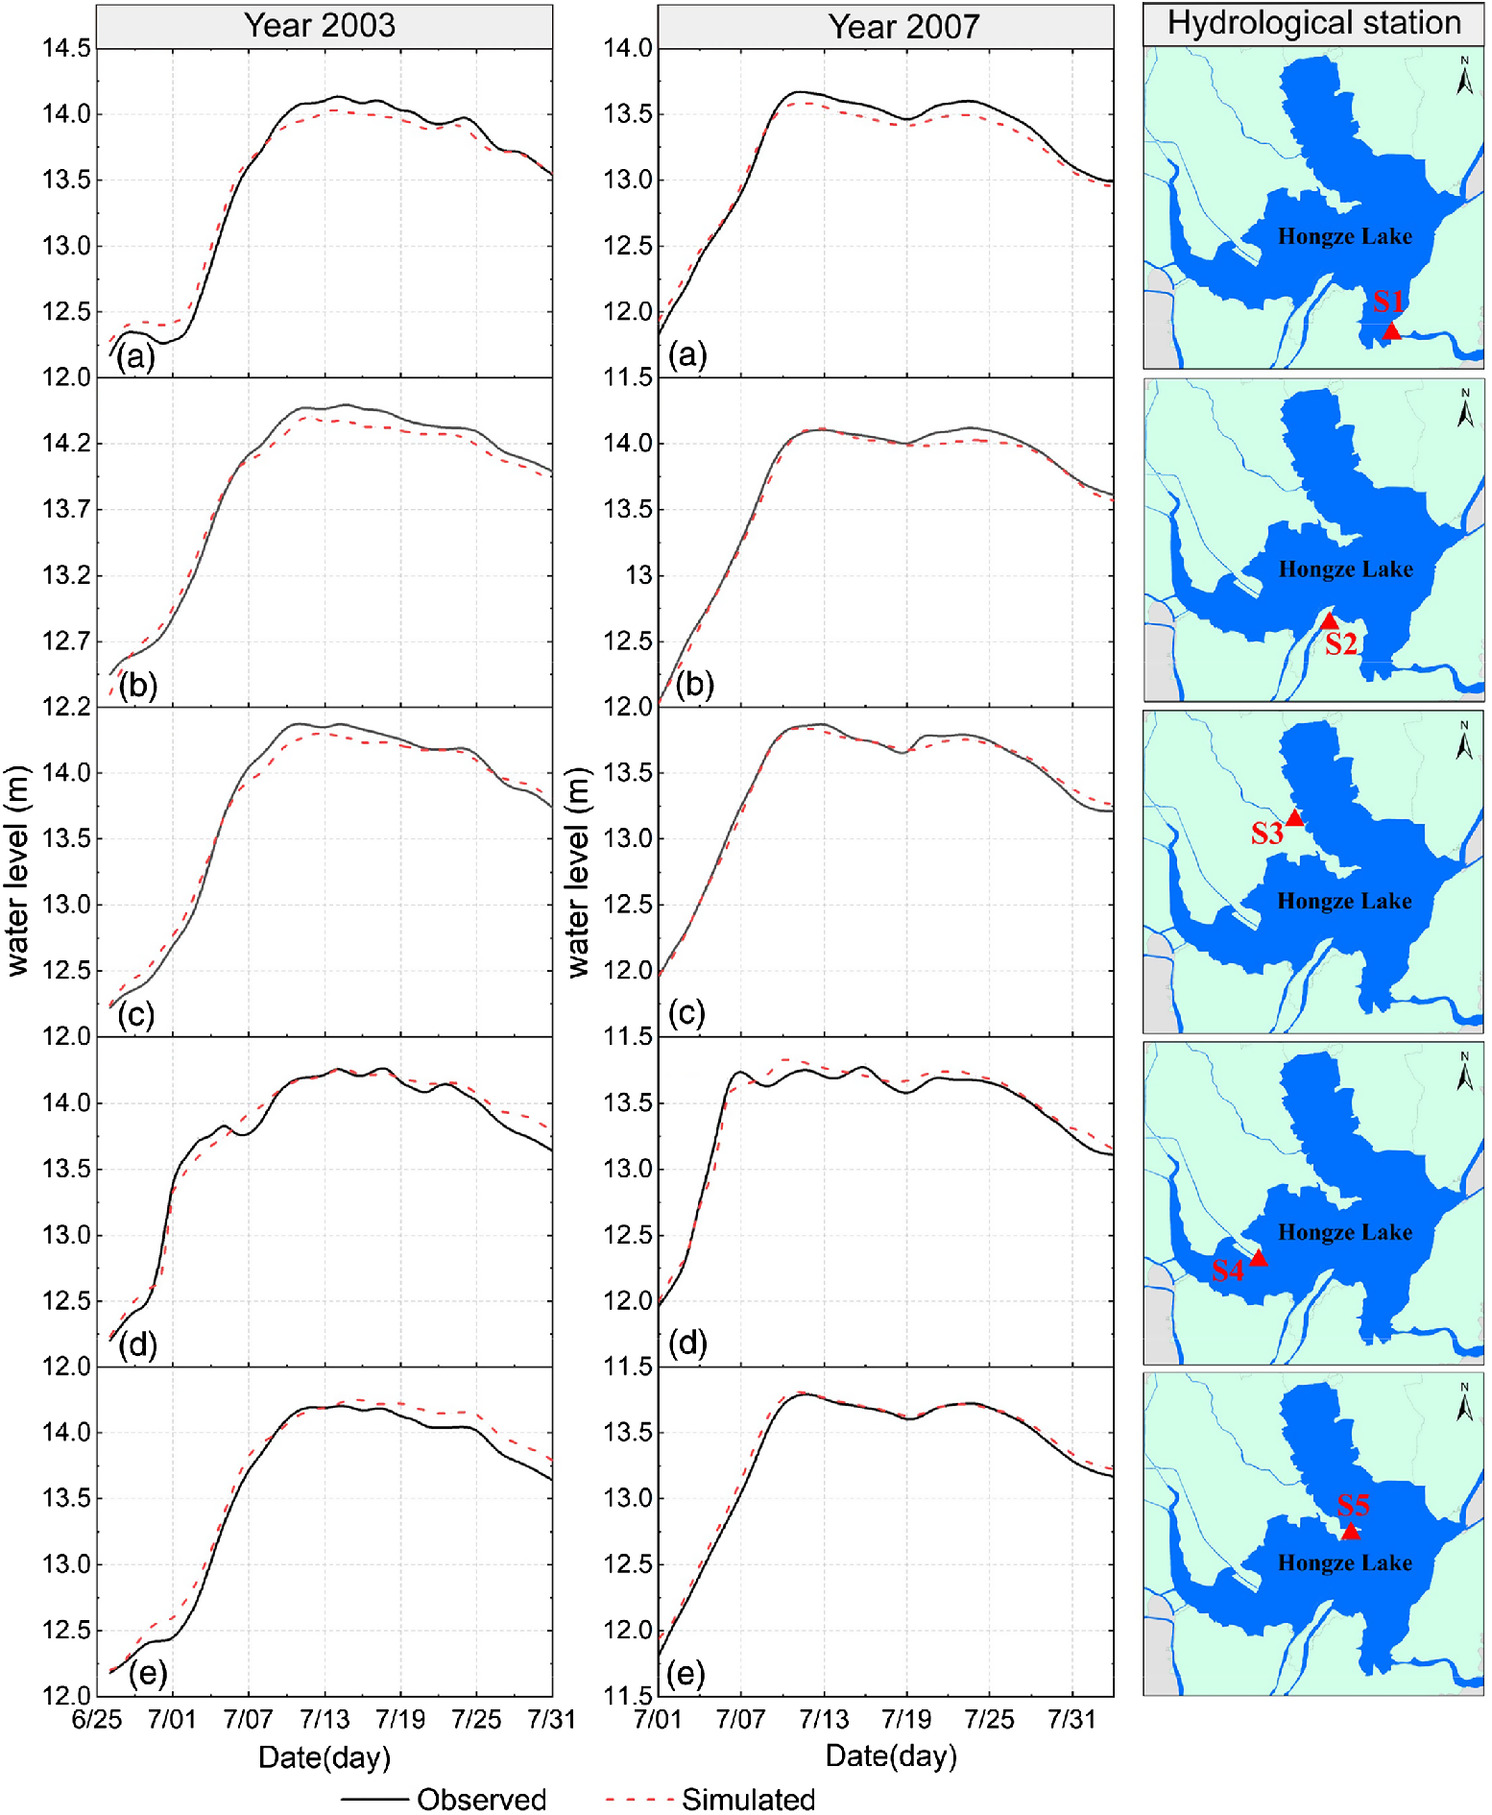
The key sensitive parameter affecting model uncertainty is the underlying surface roughness, which primarily includes the roughness of the 1D river and the roughness of the forest, grass, field, and urban land in the 2D floodplain. For the empirical roughness, 1996 and 2006 were selected for parameter calibration, and the results are shown in Table 3, which passed the rationality test. The model was validated using the typical flood processes of 2003 and 2007. The accuracy index was the deviation between the simulated and observed water level at five hydrological stations (S1–S5), as shown in Fig. 6. The water level processes and the flood peaks were essentially the same, which indicated that the model has high accuracy and can facilitate large-scale refined simulation.
| No. | Underlying surface type | Roughness | No. | Underlying surface type | Roughness |
|---|---|---|---|---|---|
| 1 | River channel | 0.018–0.025 | 7 | Green land | 0.04 |
| 2 | Lake surface | 0.025–0.033 | 8 | Highland | 0.05 |
| 3 | Paddy field | 0.075 | 9 | Dry land | 0.03 |
| 4 | Narrow forest belt | 0.13 | 10 | Urban green land | 0.04 |
| 5 | Unused grassland | 0.03 | 11 | Garden | 0.04 |
| 6 | Woodland | 0.13 | 12 | Urban area | 0.03 |
Formulation of Water Storage Strategies
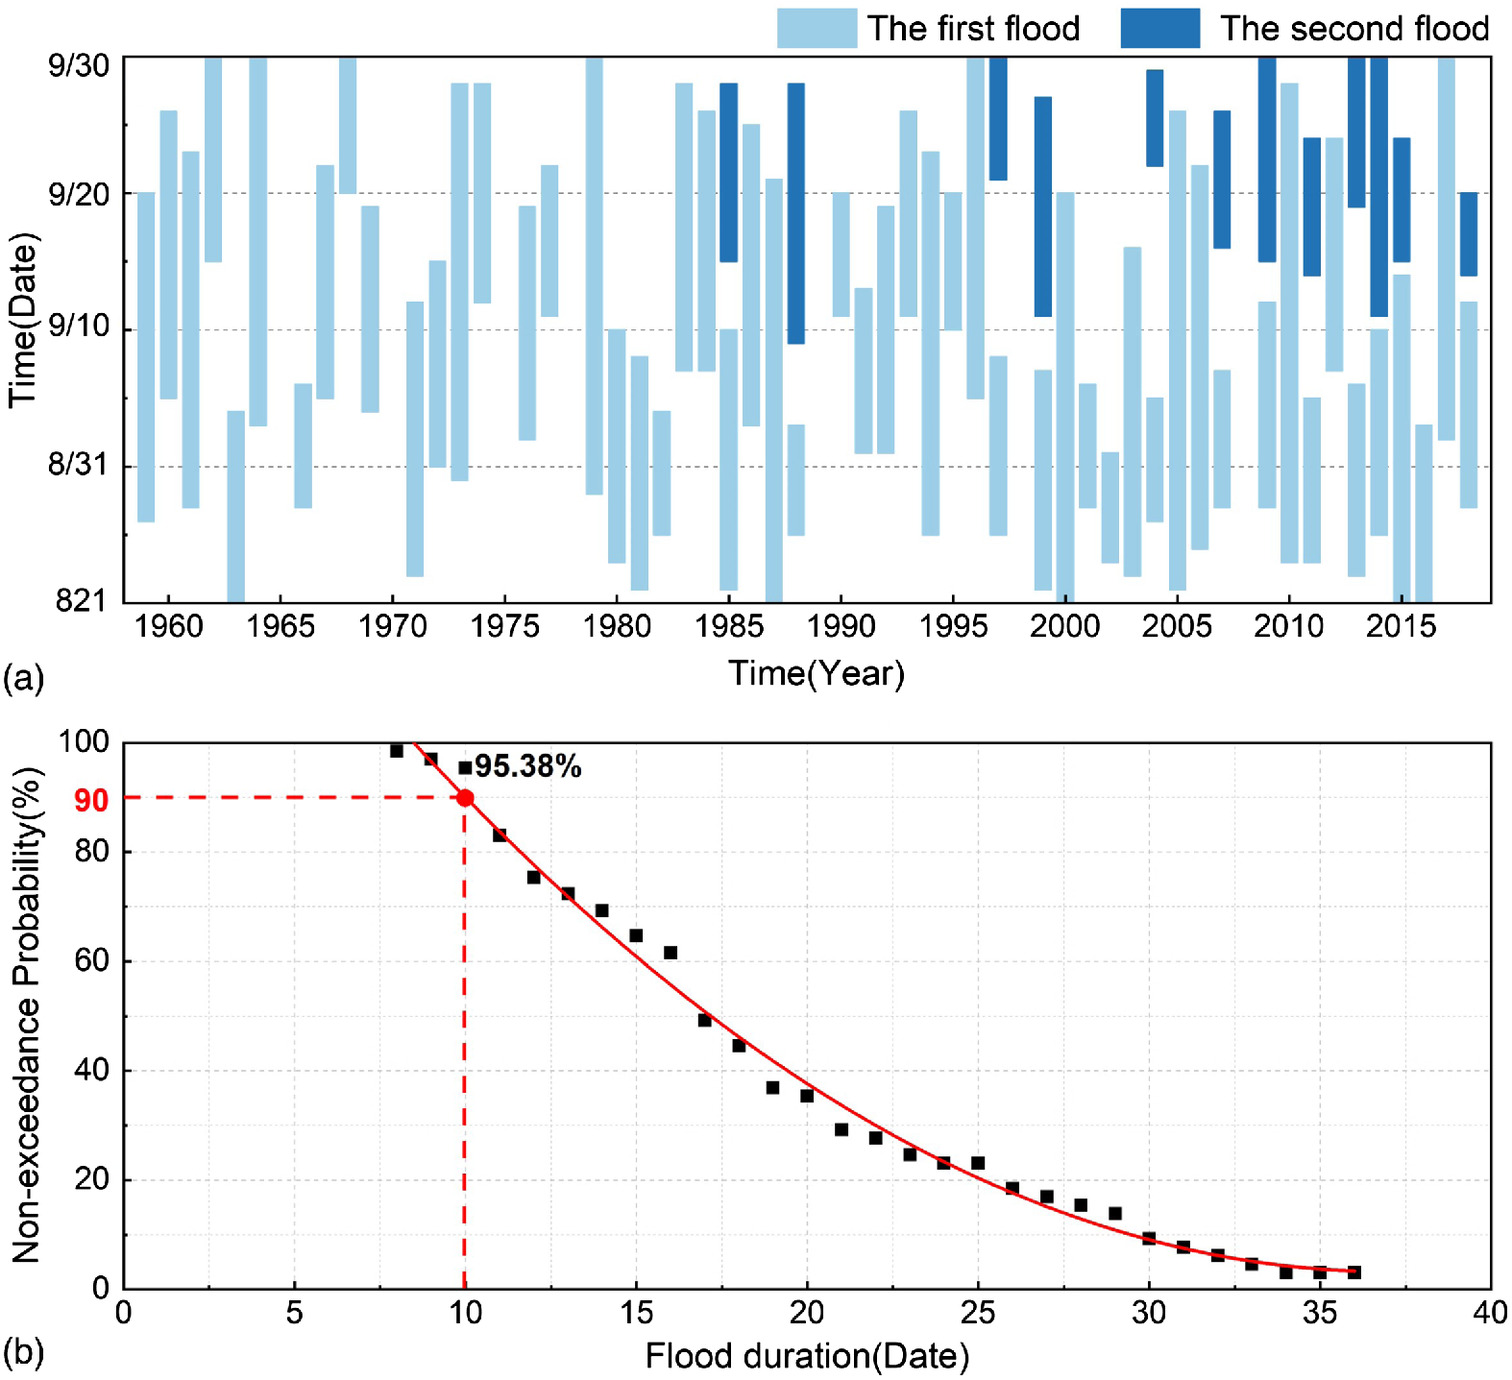
As shown in Fig. 7(a), 65 floods occurred in the POF from 1959 to 2018. Two floods occurred in the last 12 years, and the flood duration ranged from 7 to 36 days, which shows that the flood is relatively well distributed without any clustering characteristic. The flood-duration fitting curve, in Fig. 7(b), shows that floods with a duration of more than 10 days accounted for 95% of the total flood events. Therefore, 10 days was chosen as the storage interval, and four groups of impounding times were set as August 21, August 31, September 10, and September 20.
The formulation of the scheduling rules in the POF of Hongze Lake is shown in Table 4. Because there is no minimum discharge control constraint for the outflow, no lower bound was set for the discharge gates. Moreover, in the existing scheduling rules, Erhe Gate does not discharge when the lake’s water level is below 13.83 m, and only the scheduling rules of Sanhe and Gaoliangjian Gates were adjusted in this study to meet the storage demand of Hongze Lake. The results are as follows:
1.
From the perspective of safety and risk, the schemes of “discharge before storage (DBS)” and “storage before discharge (SBD)” were defined, respectively. The former focuses on flood prevention and the latter on water guarantee. Therefore, Schemes I to IV are referred to as DBS schemes (discharge starts when the lake level reaches 12.83 m); whereas, Schemes V to VIII are referred to as SDB schemes (discharge starts when the lake level reaches 13.33 m). Based on Scheme II of the PRF, we calculated the boundaries for the two scheduling rules based on the most abundant flood year 2003 and defined Schemes I and VIII.
2.
For the DBS schemes, since adopting the maximum outflow hasn’t met the requirements of the end water level already, we adjusted the outflow downward. Thus, Schemes III and IV were set under the principle of “decrease discharge at a low level, increase discharge at a high level.” Thus, forming Schemes II to IV with the gradually increasing flood risk.
3.
Similar to the DBS schemes, the SDB schemes should maintain equal discharge at 13.33 m water level to ensure a balance between safety- and risk-oriented scenarios. Simultaneously, under the principle of gradually increasing discharge, Schemes VI and VII were set. Thus, Schemes V to VIII with gradually decreasing flood control risk were formed.
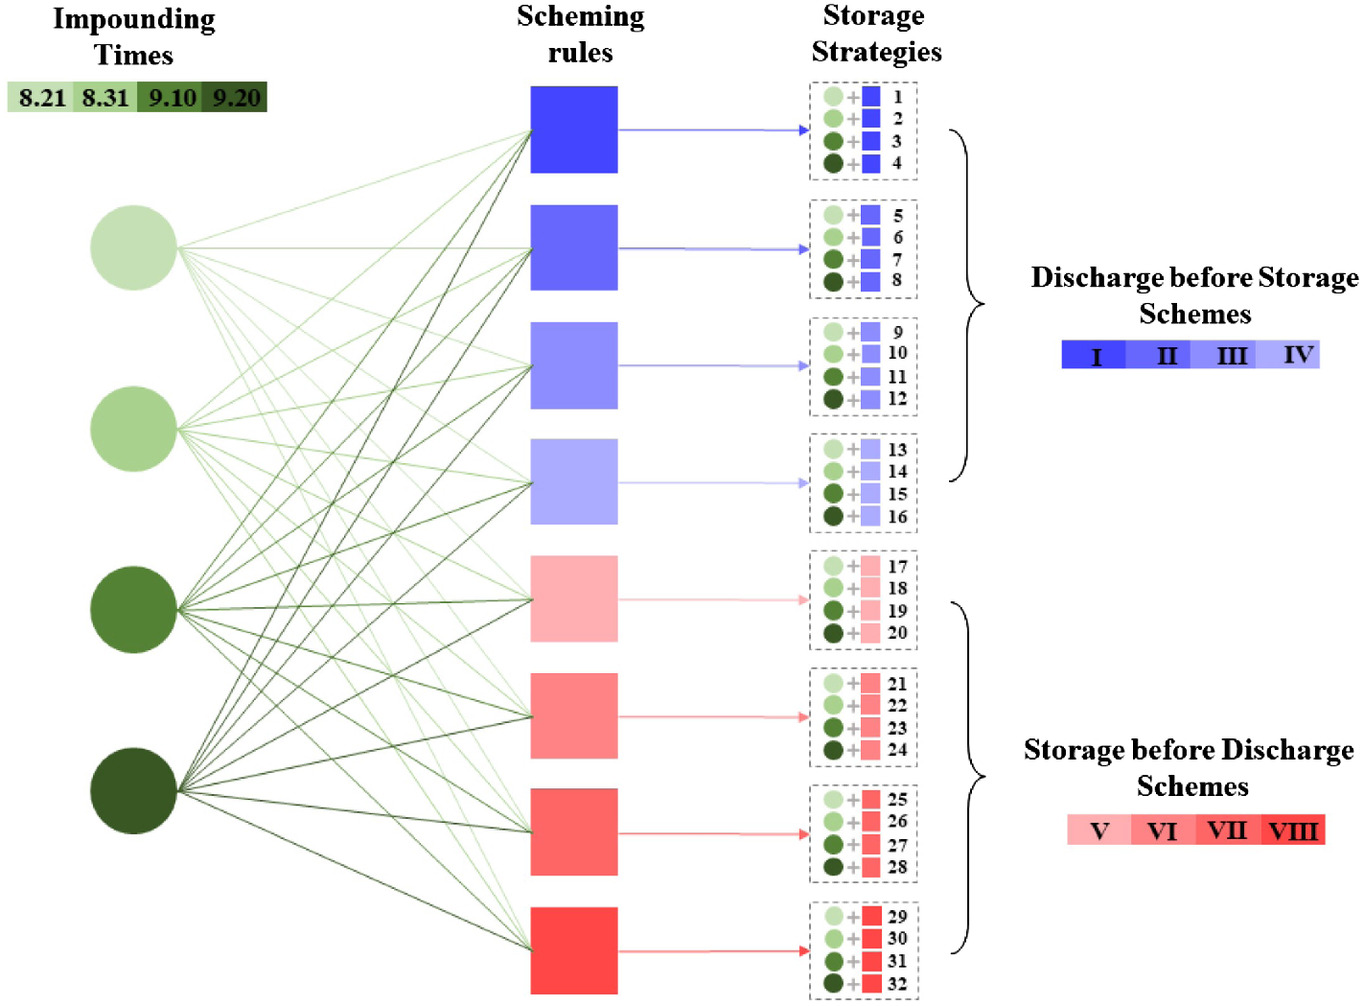
In summary, 32 groups of water storage strategies comprising 4 groups of impounding times and 8 groups of scheduling rules were established. Their combinations are shown in Fig. 8.
| Water level of Jiangba station (m) | Scheme I | Scheme II | Scheme III | Scheme IV | Scheme V | Scheme VI | Scheme VII | Scheme VIII | ||||||||
|---|---|---|---|---|---|---|---|---|---|---|---|---|---|---|---|---|
| SH | GLJ | SH | GLJ | SH | GLJ | SH | GLJ | SH | GLJ | SH | GLJ | SH | GLJ | SH | GLJ | |
| 12.33 | 0 | 0 | 0 | 0 | 0 | 0 | 0 | 0 | 0 | 0 | 0 | 0 | 0 | 0 | 0 | 0 |
| 12.83 | 1,000 | 600 | 1,000 | 600 | 0 | 0 | 0 | 0 | 0 | 0 | 0 | 0 | 0 | 0 | 0 | 0 |
| 13.33 | 2,000 | 800 | 1,000 | 800 | 500 | 650 | 2,000 | 800 | 500 | 650 | 1,000 | 800 | 2,000 | 800 | 3,000 | 800 |
| 13.83 | 8,600 | 1,000 | 8,600 | 1,000 | 8,600 | 1,000 | 8,600 | 1,000 | 8,600 | 1,000 | 8,600 | 1,000 | 8,600 | 1,000 | 8,600 | 1,000 |
Note: SH and GLJ represent Sanhe gate and Gaoliangjian gate, respectively.
Indicator Analysis of Hydrological-Hydrodynamic Simulation
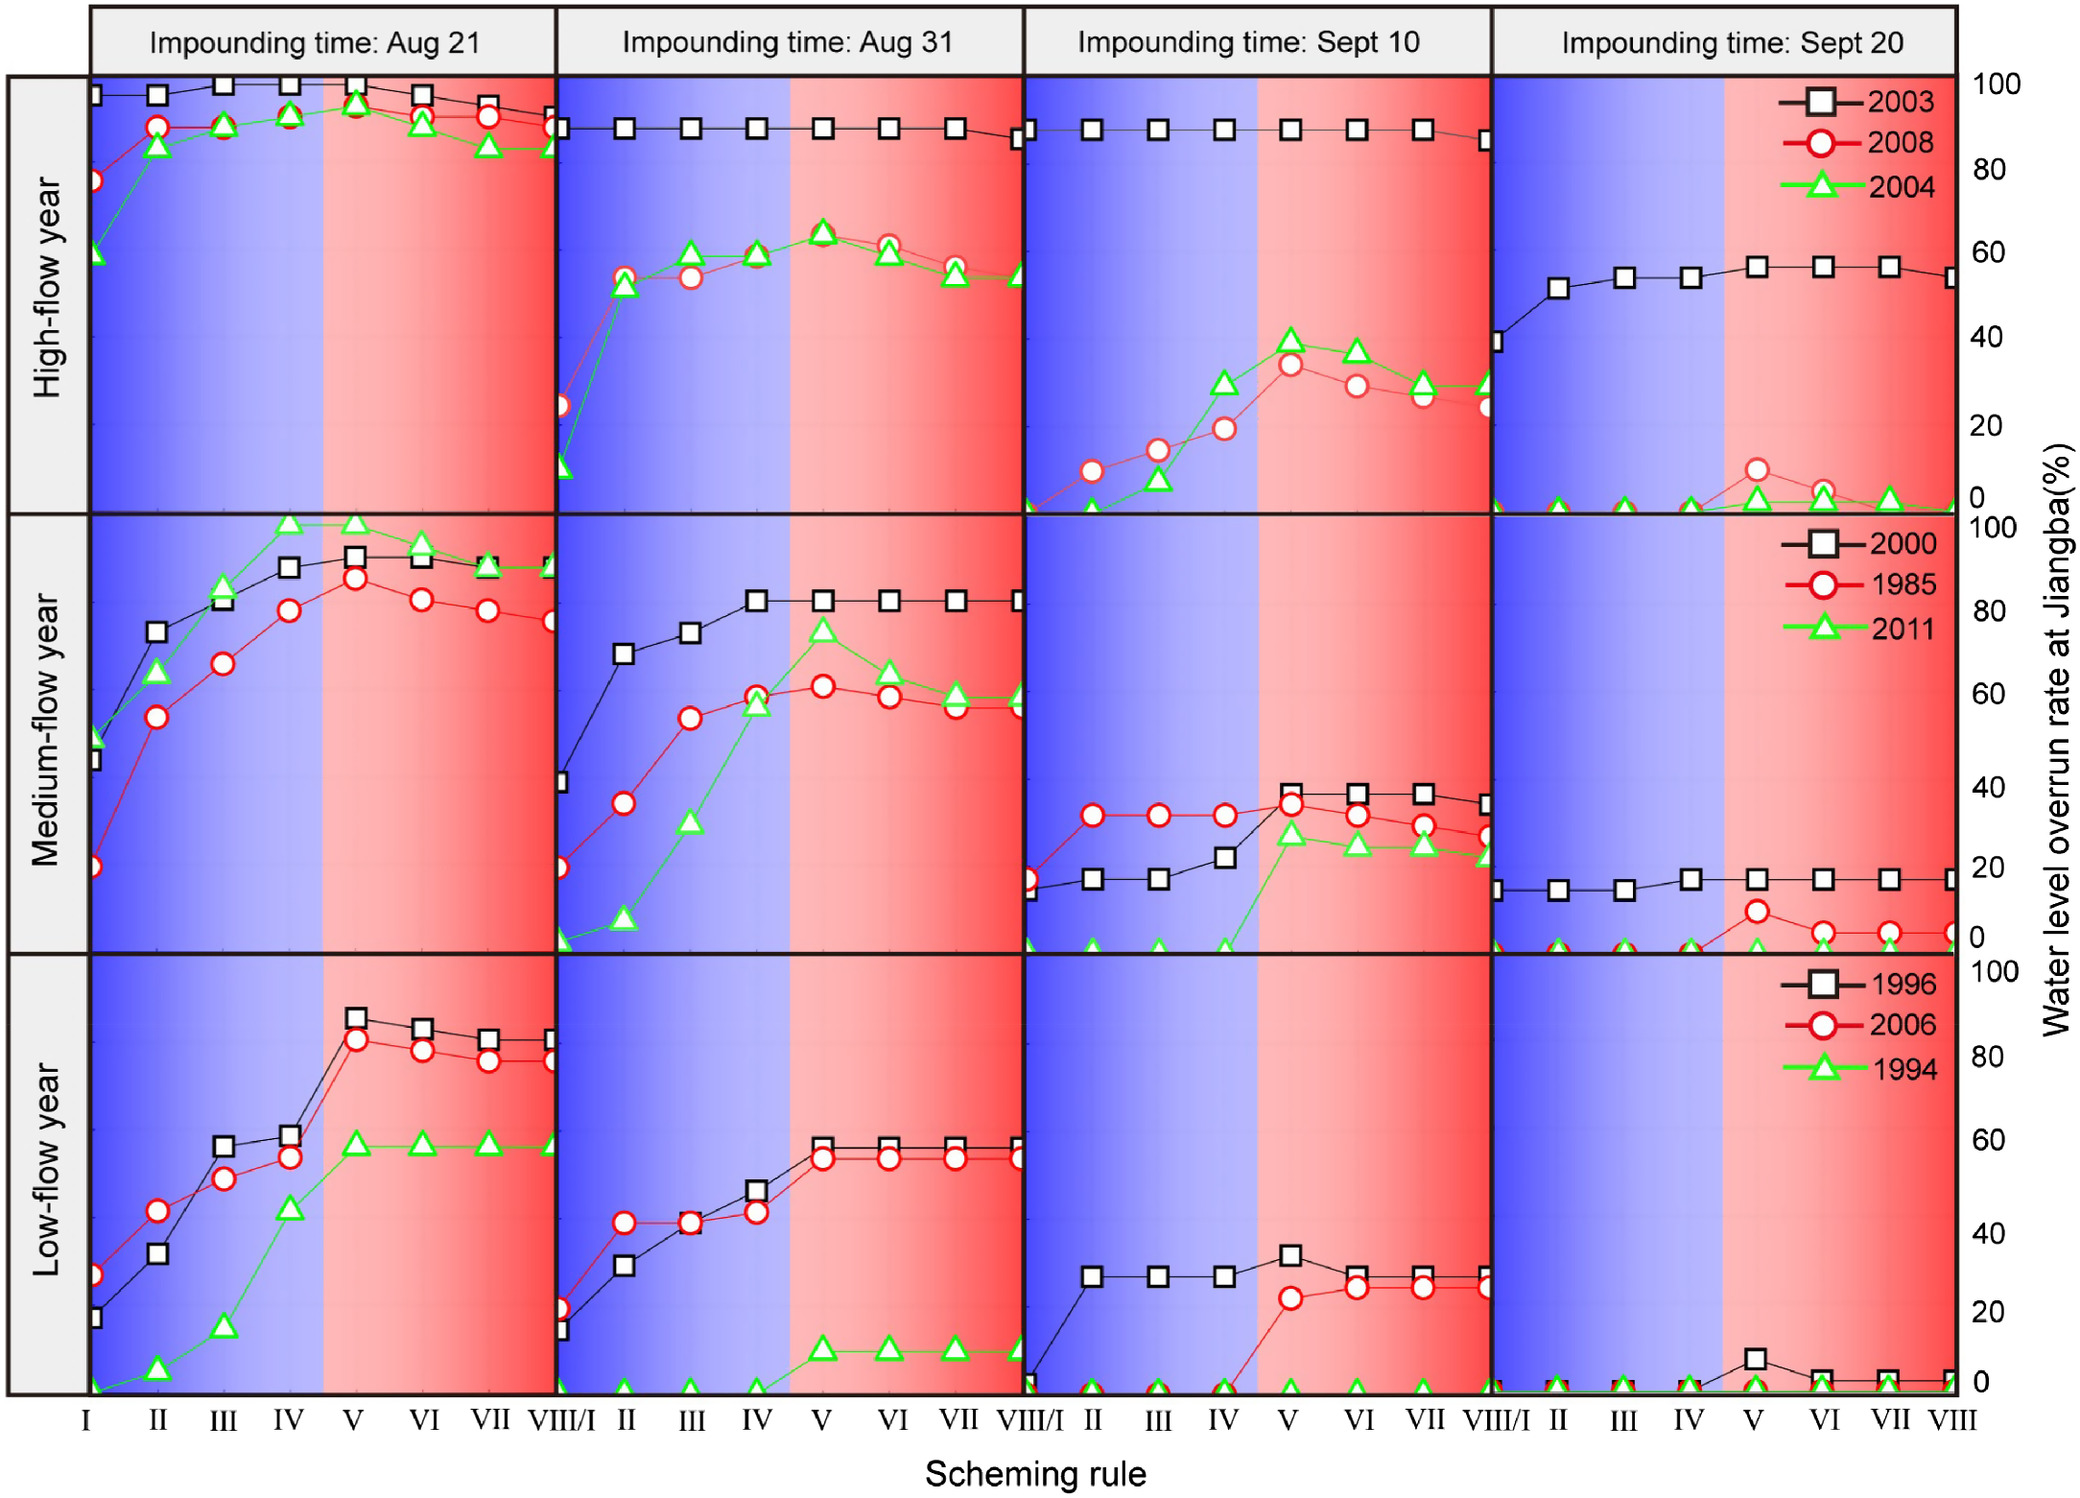
According to the rank of the six indicators by the grayness relational degree method, three indicators with “high” importance were selected as evaluation criteria, including WLOR, SLEP, and SR. Figs. 9–11 show the simulation results of 288 floods from 3 inflow scenarios, 4 impounding times and 8 scheduling rules. The analysis results are as follows:
1.
WLOR
From the perspective of scheduling rules, the overall risks of the DBS schemes are lower than those of the SDB schemes, and the discharge volume has a significant impact on the overrun rate. Regardless of the scheduling rules adopted, the impounding time always has a greater impact on the flood risk. In addition, delaying the impounding time lowers the flood risks. We conclude that delayed impounding time and a larger discharge could reduce the flood control risk regardless of the inflow abundance.
From the perspective of typical years, the water level overrun rate decreases in the order of high-, medium-, and low-flow years. From Schemes IV and VIII of the high-flow year group, we conclude that the SDB schemes with lower discharge efficiency and the DBS schemes with higher discharge efficiency are consistent in terms of the risk level. This feature gradually weakens in the medium- and low-flow year groups, indicating that the gambling between impounding time and scheduling rules becomes stronger with increasing inflow water. In addition, for years with larger flood magnitudes, such as 2003, the overrun rate exceeds 90% regardless of the scheme selected.
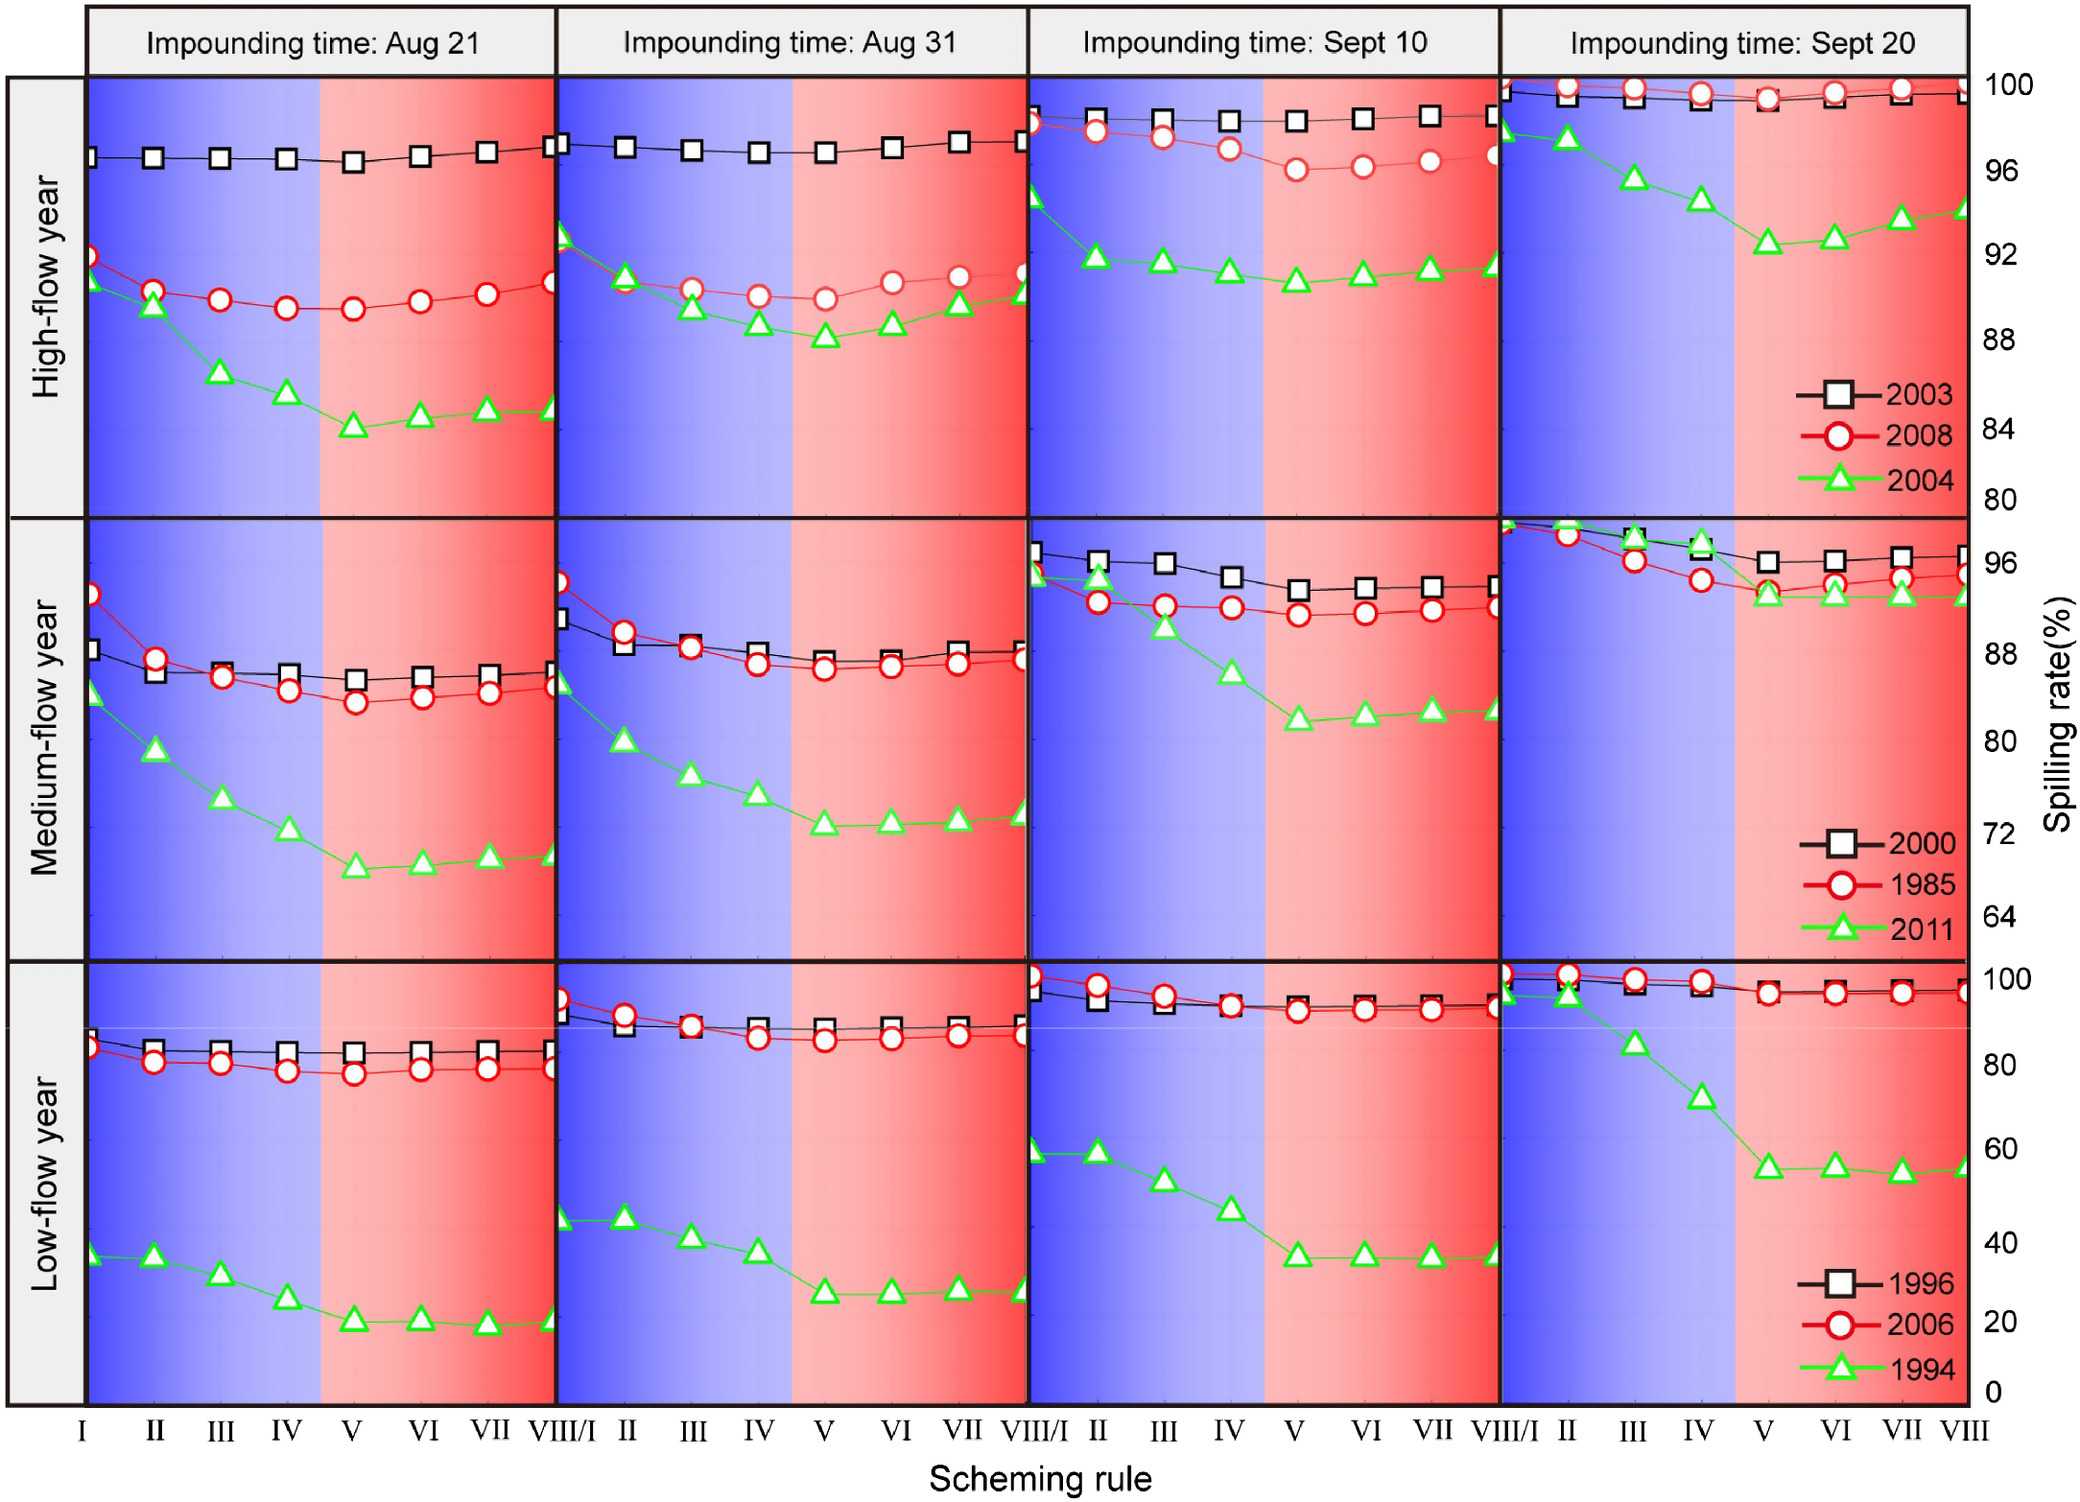
2.
SR
From the perspective of scheduling rules, the overall spilling rate of the DBS scheme is higher than those of the SDB, and the latter is greatly influenced by discharge variation. Regardless of the scheduling rules adopted, the impounding time always has a greater impact on the lake system’s spilling rate. When adopting different impounding times, the average variation amplitudes of total abandoned water in high-, medium-, and low-flow years were 7% (2003), 25.5% (2008), 44.2% (2004), 20% (2000), 16.9% (1985), 37.5% (2011), 21.3% (1996), and 36.9% (2006), respectively (1994 did not abandon water until September 10 and is not included in the calculation).
From the perspective of typical years, the spilling rate decreases in the order of high-, medium-, and low-low years. The spilling rates of Schemes IV and VIII are almost the same in 2003 and 2008, where the inflow magnitude is large. This also illustrates the competitive relationship between impounding time and scheduling rules. For the same impounding time, the spilling rate decreases from Schemes I to IV, and gradually increases from Schemes V to VIII. This trend is obvious in low-flow series with less inflow water.
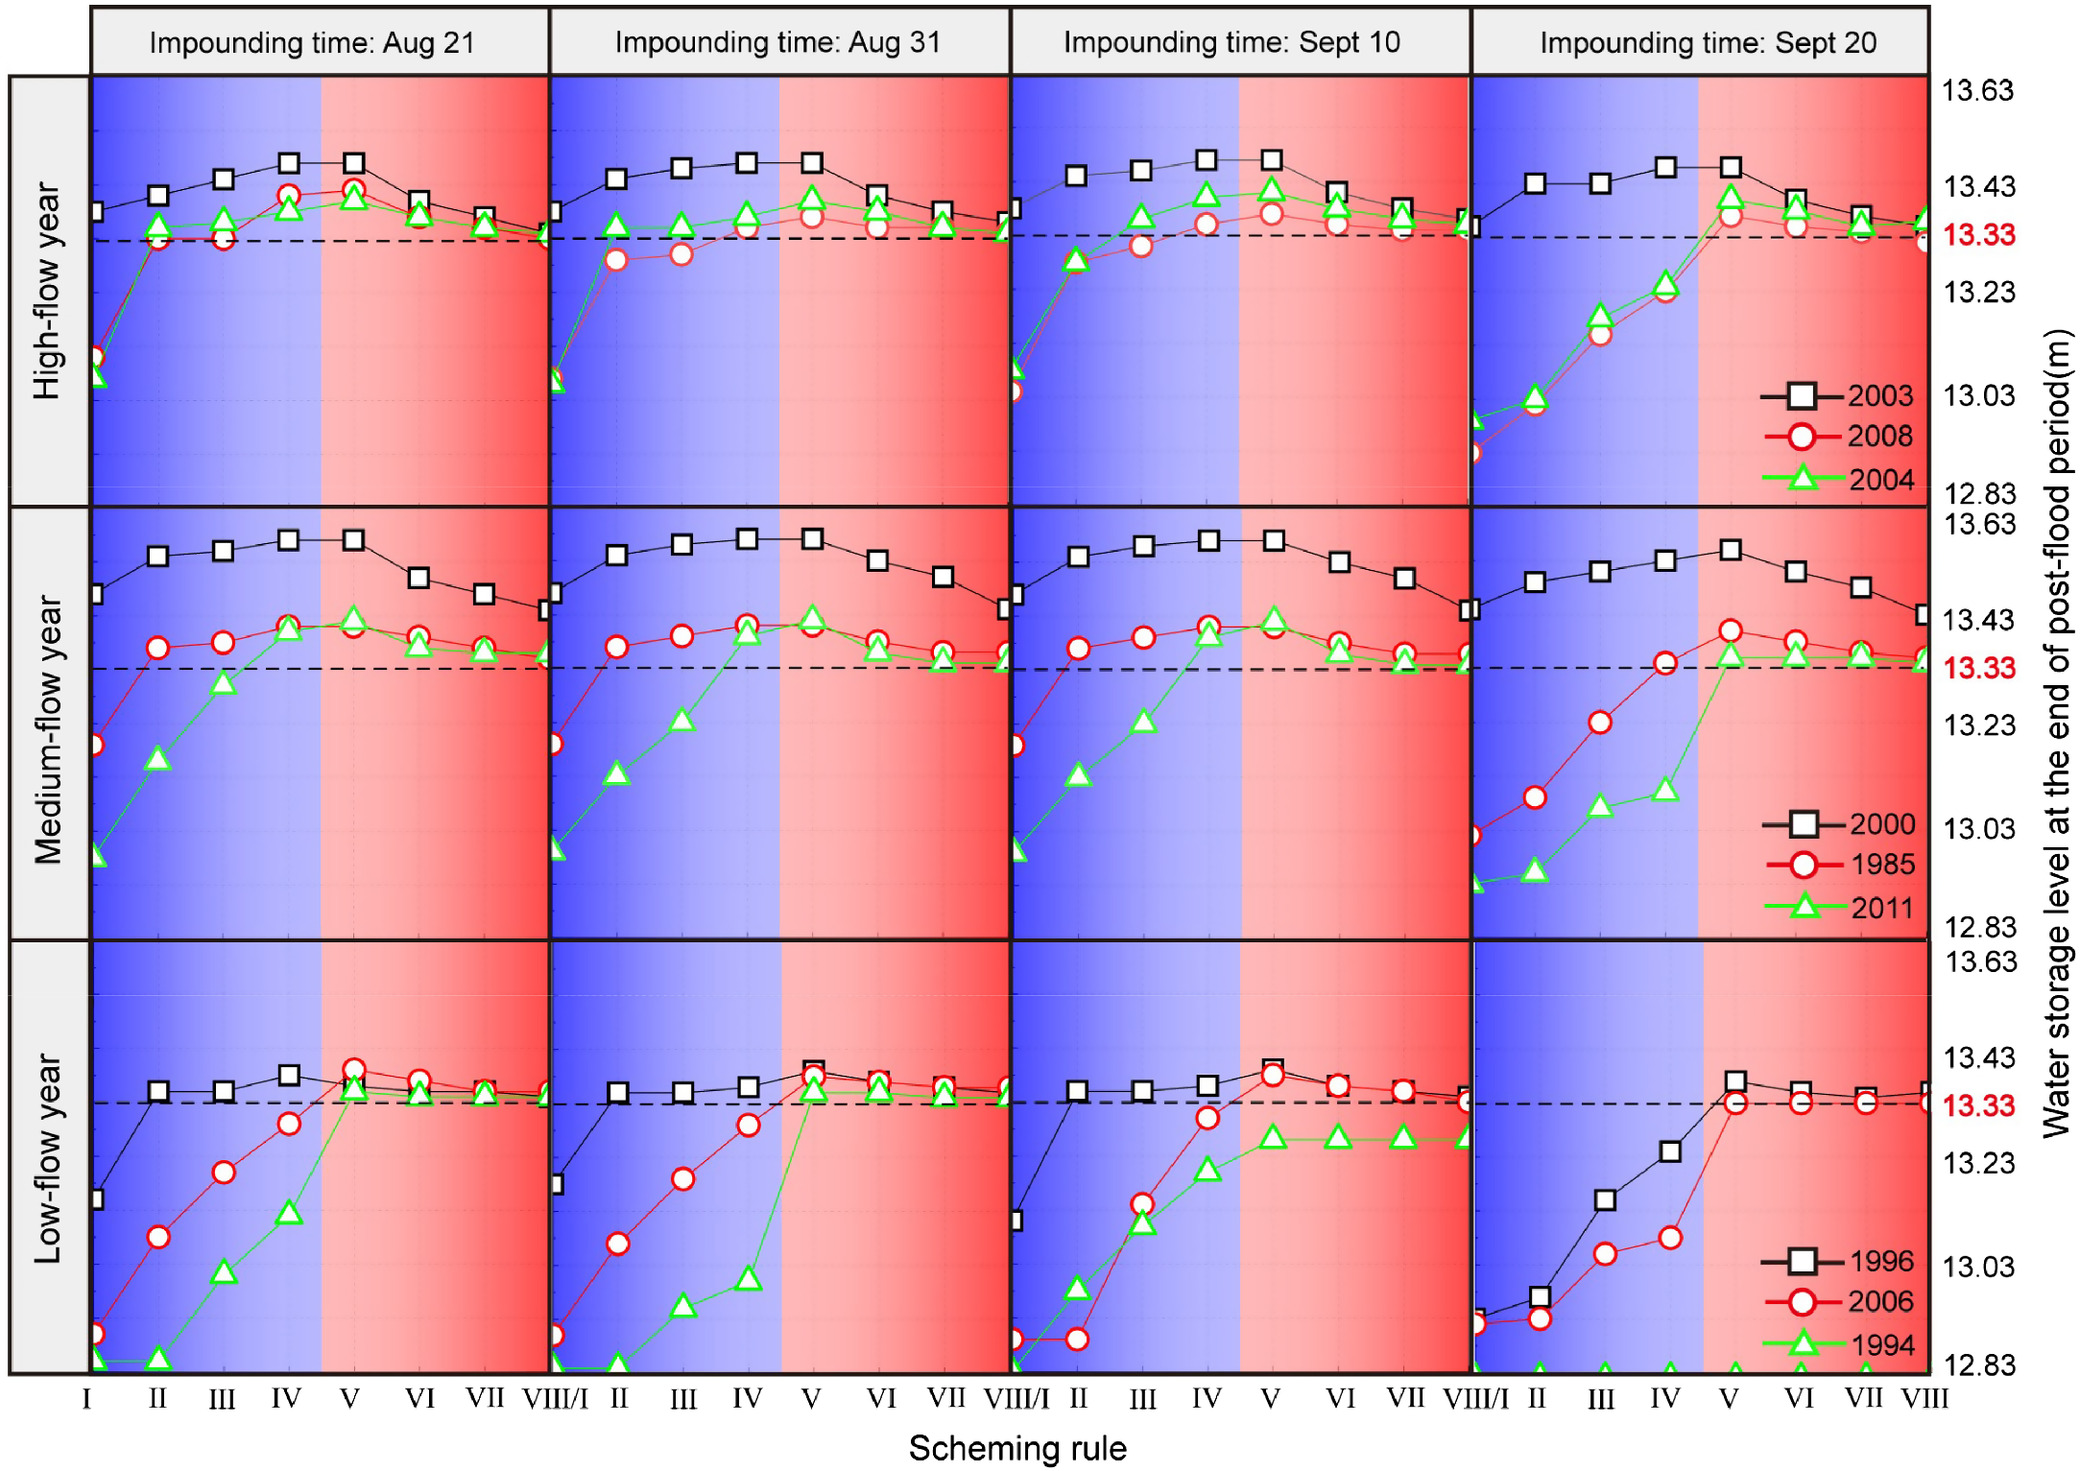
3.
SLEP
The ideal condition for water storage is to gradually raise the water level to the normal water level of 13.33 m at the end of the flood period to meet the high water demand during the non-flood season. From the perspective of scheduling rules, the approximation of SDB scheduling rules is better fitted to the ideal situation in general when comparing Schemes I to IV with Schemes V to VIII, indicating that the current storage scheduling rules could cover most of the floods in terms of magnitude and characteristic, and the lake level can quickly raise to the normal storage level of 13.33 m after flood regulation. Obviously, the storage task is better achieved with an earlier impounding time.
From the perspective of typical years, the storage level in the end flood period in the low-flow years is much lower than that in the medium- and high-flow years. During abundant inflow, the DBS schemes could make storage level the ideal index; however, it is prone to the over-storage phenomenon, and the risk is much higher than the SDB schemes. Therefore, it is necessary to weigh the contradiction between water storage and flood control and adjust their priorities according to the actual conditions.
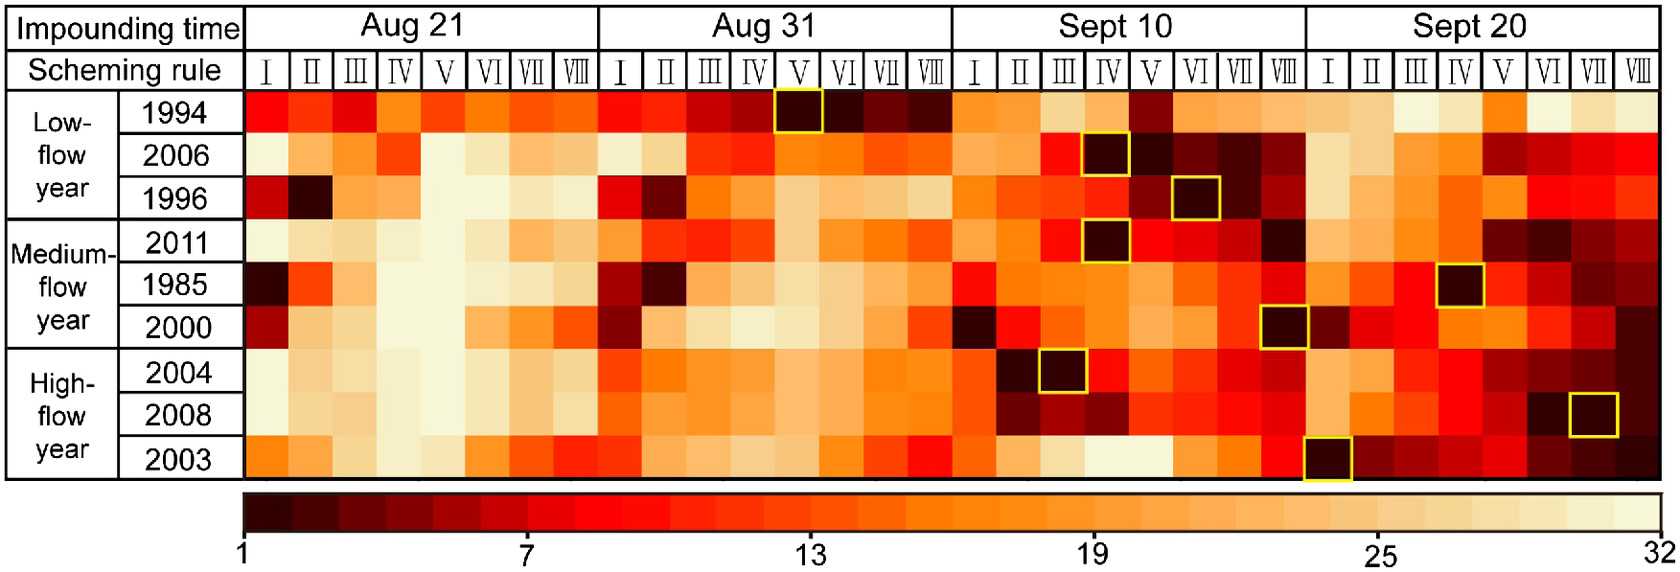
Dispatch Scheme Analysis and Storage Strategy Optimization
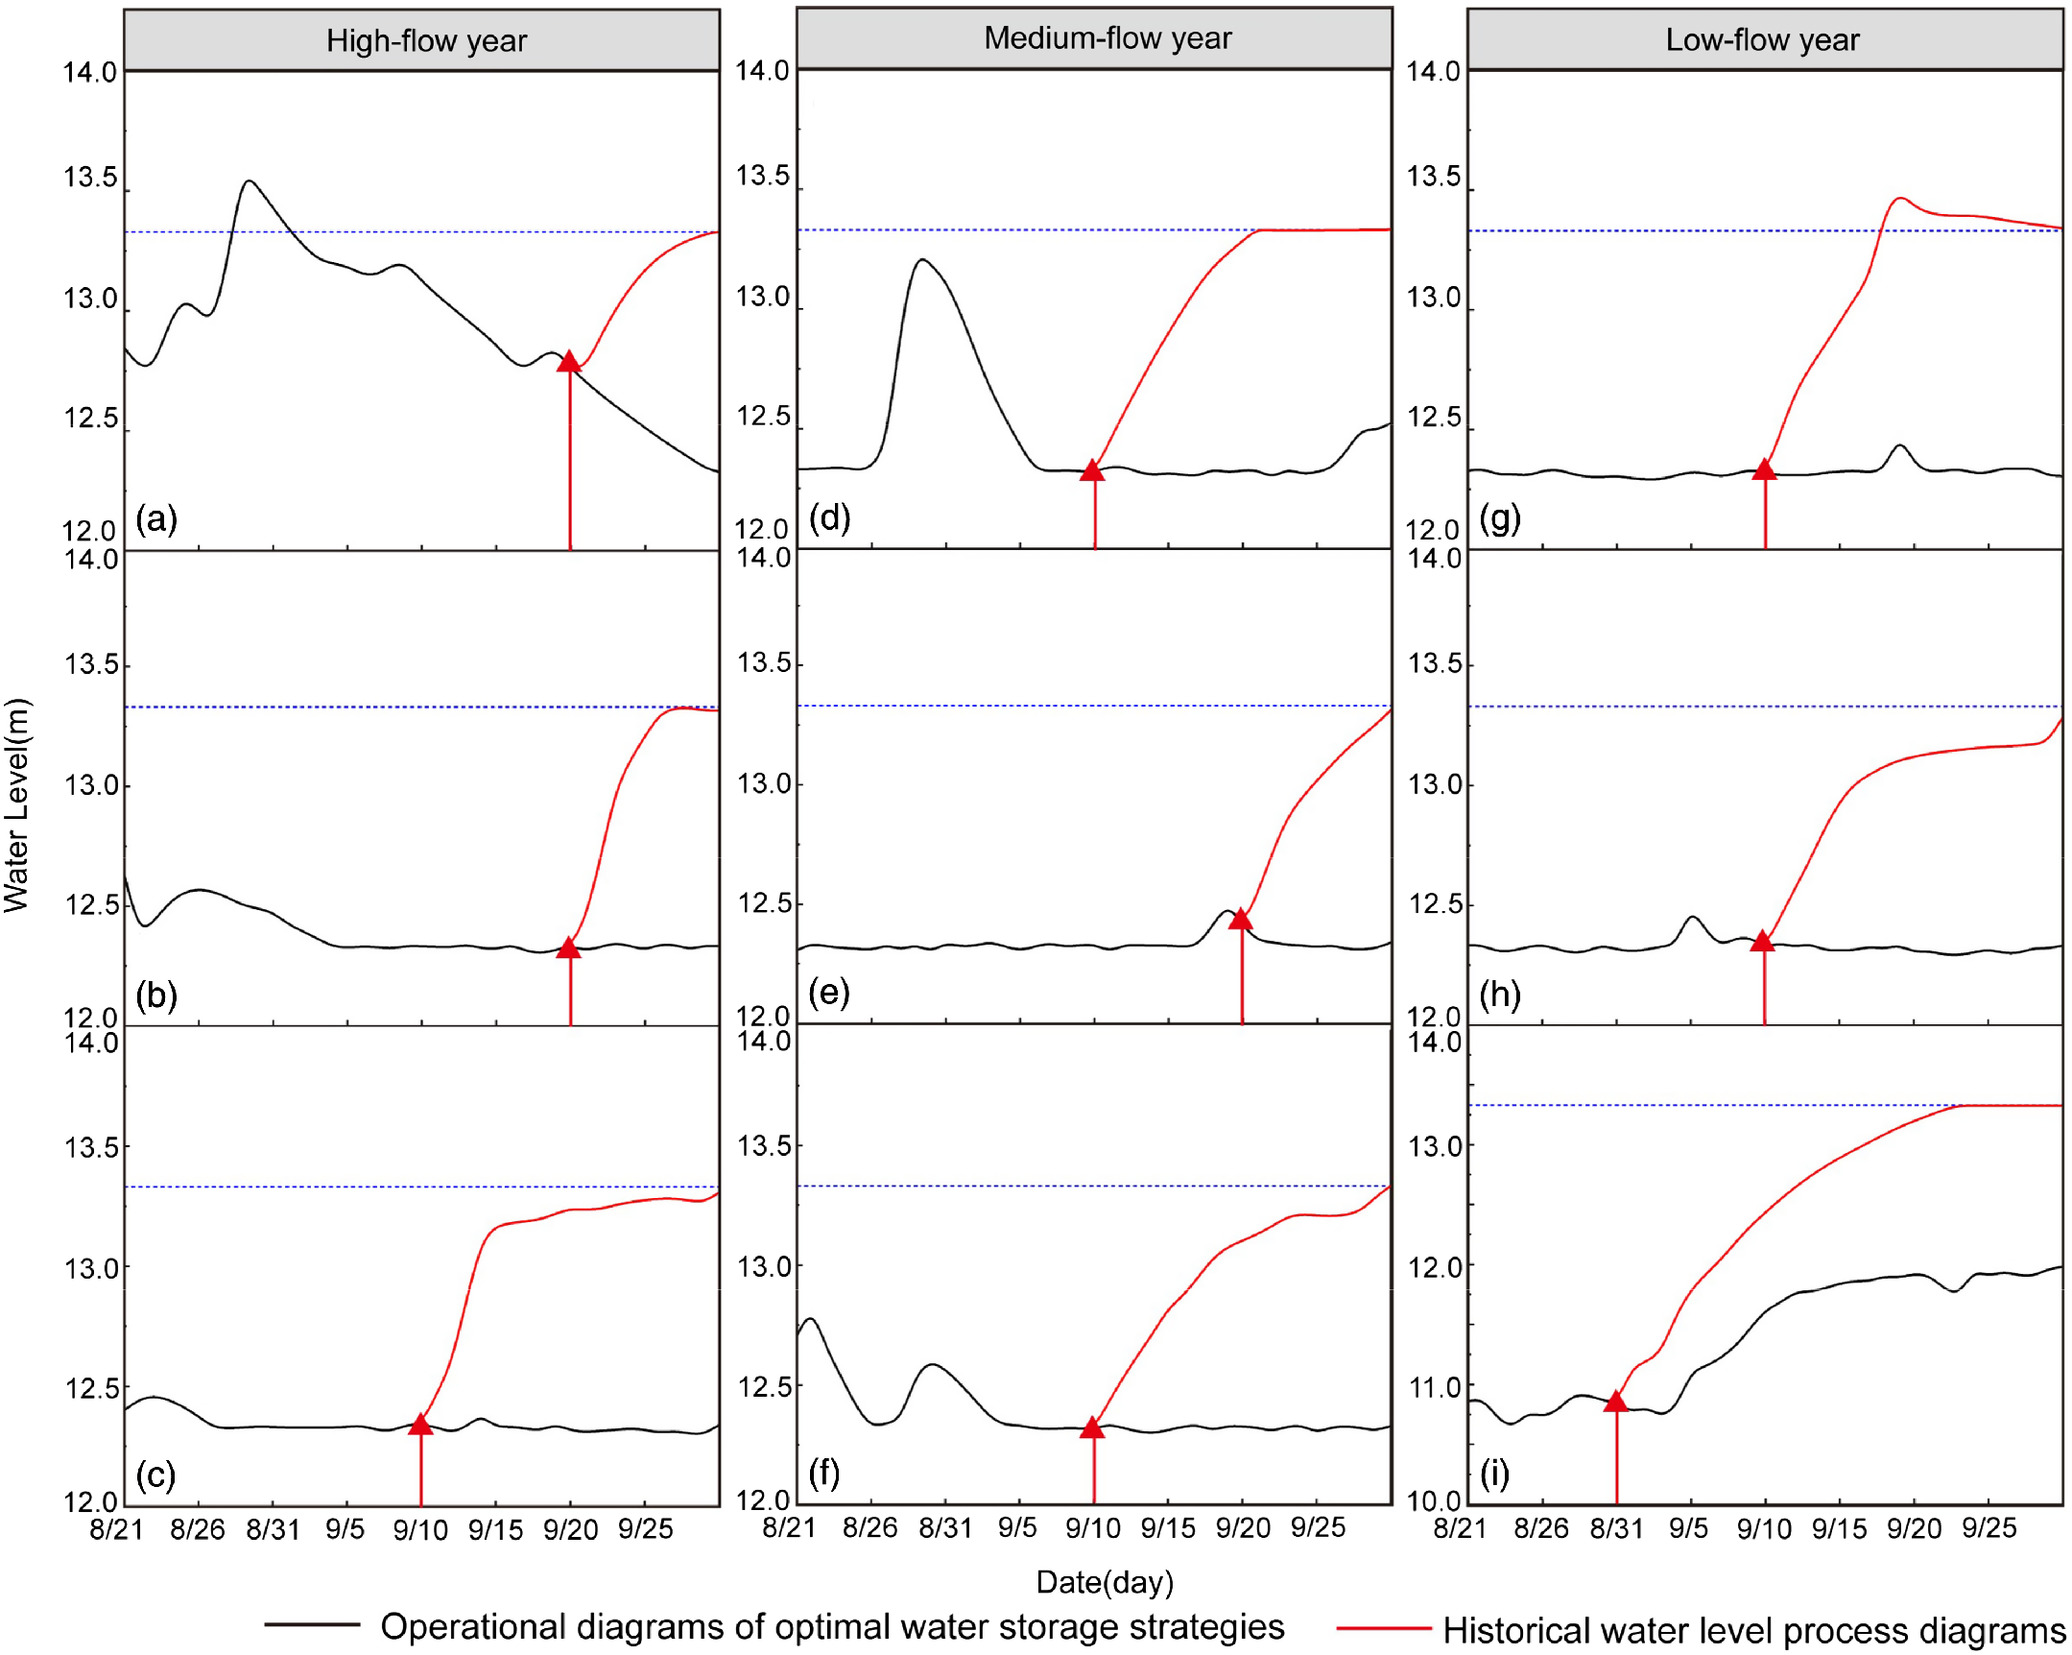
The TOPSIS method was used to derive multi-objective decisions for the preceding three indexes, and the results of ranking 32 water storage strategies for 9 typical years were obtained, as shown in Fig. 12. Fig. 13 is the scheduling process line graph of the optimal strategies under different typical years, compared with the historical data, the optimal strategy considerably improved the storage level and increased the storage capacity, as shown in Table 5.
| Inflow type | Typical year | Impounding time | Scheduling rule | Increased storage level (m) | Increased storage capacity () |
|---|---|---|---|---|---|
| High flow year | 2003 | September 20 | Scheme I | 0.40 | 6.592 |
| 2008 | September 20 | Scheme VII | 0.99 | 15.875 | |
| 2004 | September 10 | Scheme III | 1.00 | 16.054 | |
| Medium flow year | 2000 | September 10 | Scheme VIII | 0.90 | 21.565 |
| 1985 | September 20 | Scheme IV | 0.98 | 15.719 | |
| 2011 | September 10 | Scheme IV | 1.01 | 16.182 | |
| Low flow year | 1996 | September 10 | Scheme VI | 1.00 | 23.905 |
| 2006 | September 10 | Scheme IV | 0.95 | 15.216 | |
| 1994 | August 31 | Scheme V | 1.41 | 21.862 |
As shown in Fig. 13, the operational diagrams of the optimal water storage process also depend on the magnitude, pattern, and duration of the floods. For 2003, the higher overrun rate might be caused by heavy floods occurring at the front segment in the POF, concentrated exactly before the impounding time. For 1985 and 1996, the medium-magnitude and post-peak floods occur during flood recession, producing a small enhancement in final storage level and overrun rate, indicating that floods during a recession might increase the risk during the regulation process. For 1994, since the MAF and POF were dry, the storage strategies could not guarantee full storage for all the impounding times between September 10 and 20. Therefore, it is recommended to advance the impounding time and decrease the discharge in extremely dry years.
Summary of Water Storage Regular Pattern
Based on the flood risk and storage efficiency of the storage strategy sample library under nine typical years, combined with specific retaining processes, we summarized the post-flood water storage regular pattern of Hongze Lake as follows:
1.
When facing a high-flow period, the impounding time should be set later between September 10 and 20 (during which the flood risk and storage benefit brought by retaining present linear inverse conversion, the same as follows). When facing a medium-flow period, the impounding time should be set earlier, between September 10 and 20. When facing a low-flow period, the impounding time should be set between August 31 and September 10.
2.
When facing a high-flow period, DBS schemes with greater discharge efficiency are recommended to avoid a complete flood if possible. When facing a medium-flow period, DBS schemes with a smaller discharge efficiency are recommended, with a perfect start to storage in the recession stage. When facing a low-flow period, SDB schemes were recommended, the discharge scale should be combined with flood-forecast information, and the flood should be intercepted and stored in the rising or middle sections.
3.
Regardless of the runoff situation in the POF, special attention should be paid to prior information, including runoff conditions and flood forecasts during the MAF and POF. Therefore, the water storage strategy should be adjusted flexibly according to (1) and (2) conclusions.
Conclusions
Taking Hongze Lake as an example, a one- and two-dimensional coupled hydrodynamic model was developed in this study for integrated flood regulation of the “river-lake-flood detention basin” system. Combining water storage strategy enumeration, large-scale numerical simulation, and risk-benefit assessment, scheduling rules of post-flood impoundment in advance were determined for the combined use of gates under wet-dry encounters. This is a preliminary attempt to couple the traditional dispatching model with the high-precision hydrodynamic model, which is to provide a systematic and theoretical basis for flood control as well as improvement of water storage benefit of lakes during the post-flood period. The main conclusions are as follows:
1.
The hydrologic-hydrodynamic model has high accuracy in realizing the elaborate simulation of flood evolution and inundation dynamics of rivers-connected lakes and their detention basins, with the average simulation error controlled from 0.03 m to 0.14 m. Thus provides a guarantee for large-scale numerical simulation.
2.
Based on the water storage process analysis and risk-benefit evaluation system, we propose a set of post-flood impoundment in advance regulations based on flood magnitudes and occasions from 9 typical years with high-, medium-, and low-flows: (a) for a high-flow period, the impounding time should be set later between September 10 and 20, and discharge before storage scheme with larger discharge efficiency is recommended. (b) For a medium-flow period, the impounding time should be set earlier between September 10 and 20, and discharge before storage scheme with smaller discharge efficiency is recommended. (c) For a low-flow period, the impounding time should be set between August 31 and September 10, and storage before discharge scheme is recommended.
3.
Under the optimal post-flood storage regulations, the water storage efficiency is significantly improved with guaranteed flood risks, in which the water level overrun rate could be controlled at 19.24% while raising the terminal water level by 0.96 m and increasing the storage capacity by on average.
Notably, in a series of high-flow years (such as 2003), a relatively evident competitive relationship exists between “slow discharge” and “urgent storage,” it is easy to fall into local optimum by enumeration method. Therefore, an improved systematic optimization method must be established, which aims to combine the refined numerical simulation with an intelligent optimization algorithm to search for the optimal solution. In addition, since lakes receive a large amount of water from the basin, real-time studies on dynamic water storage of the lake-basin system should be conducted combined with high-precision flood forecasts.
Data Availability Statement
Data of the real case cannot be shared due to a nondisclosure agreement signed with the Huaihe River Commission, the Ministry of Water Resources, and the Water Resources Department, Jiangsu Province.
Acknowledgments
This study was supported by the Science and Technology Support Program of Jiangsu Province (CN) (No. 2019003) and the National Key Research and Development Program of China (No. 2018YFC1508200).
References
Belikov, V. V., N. M. Borisova, and A. V. Glotko. 2021. “Numerical hydrodynamic 2D-simulation of the inundation Tunlun town on the Lya R. during flood 2019.” Water Resour. 48 (Sep): 713–725. https://doi.org/10.1134/S0097807821040023.
Bouma, J. J., F. Delphine, and T. Peter. 2005. “Risk assessment and water management.” Environ. Modell. Software 20 (2): 141–151. https://doi.org/10.1016/j.envsoft.2003.09.002.
Caleffi, V., A. Valiani, and A. Zanni. 2003. “Finite volume method for simulating extreme flood events in natural channels.” J. Hydraul. Res. 41 (2): 167–177. https://doi.org/10.1080/00221680309499959.
Chang, J., A. Guo, H. Du, and Y. Wang. 2017. “Floodwater utilization for cascade reservoirs based on dynamic control of seasonal flood control limit levels.” Environ. Earth Sci. 76 (6): 260. https://doi.org/10.1007/s12665-017-6522-z.
Cunha, M., J. Marques, E. Creaco, and D. Savic. 2019. “A dynamic adaptive approach for water distribution network design.” J. Water Resour. Plann. Manage. 145 (7): 04019026. https://doi.org/10.1061/(ASCE)WR.1943-5452.0001085.
DHI (Danish Hydraulic Institute). 2013. Mike flood: 1D-2D modeling user manual. Copenhagen, Denmark: DHI.
Ding, W., C. Chi, Y. Peng, R. Zeng, H. Zhou, and X. Cai. 2015. “An analytical framework for flood water conservation considering forecast uncertainty and acceptable risk.” Water Resour. Res. 51 (6): 4702–4726. https://doi.org/10.1002/2015WR017127.
Ding, W., C. Zhang, X. Cai, Y. Li, and H. Zhou. 2017. “Multiobjective hedging rules for flood water conservation.” Water Resour. Res. 53 (3): 1963–1981. https://doi.org/10.1002/2016WR019452.
Han, C., Q. Mei, S. Liu, and G. Zhong. 2014. “Research and application on coupled hydrological and hydrodynamic model in plain tidal river network.” Chin. J. Hydrodyn. 29 (6): 706–712. https://doi.org/10.3969/j.issn1000-4874.2014.06.011.
Hao, J., X. Jiang, and J. Yang. 2009. “Three dimensional numerical model of wind-driven current in a lake based on POM model.” In Vol. 4 of Proc., 28th Int. Conf. on Ocean, Offshore and Arctic Engineering, 555–560. New York: American Society of Mechanical Engineers.
He, X., B. Yan, and L. Yan. 2018. “Study on flood resources utilization dispatching method of the Three Gorges reservoir based on the demand of power generation.” In Proc., 3rd Asia Conf. on Power and Electrical Engineering (ACPEE), 366. Hong Kong: Hong Kong Society of Mechanical Engineers.
Hu, S., X. Cheng, Z. Hu, Z. Wang, S. Guo, Y. Zou, Y. Wang, L. Xiang, J. Peng, and S. Zhang. 2004. “Research on the key technology in safe water utilization in the Hai River basin.” China Water Resour. (22): 49–51.
Hu, X., Q. Zou, and M. Zhou. 2018. “Scheduling and benefit analysis on flood resources utilization of Three Gorges Reservoir.” Yangtze River 49 (3): 15–22. https://doi.org/10.16232/j.cnki.1001-4179.2018.03.003.
Hua, L., X. Wan, X. Wang, F. Zhao, P. Zhong, M. Liu, and Q. Yang. 2020. “Floodwater utilization based on reservoir pre-release strategy considering the worst-case scenario.” Water 12 (3): 892. https://doi.org/10.3390/w12030892.
Ji, Y., J. Zhang, H. Zhang, X. Liu, N. Wu, and G. Cai. 2020. “Review on hotspots, challenges, and the future of river management strategies in China.” J. Environ. Biol. 41 (1): 13–22. https://doi.org/10.22438/jeb/41/1/MRN-1121.
Jia, S., and D. Li. 2021. “Evolution of water governance in China.” J. Water Resour. Plann. Manage. 147 (8): 04021050. https://doi.org/10.1061/(ASCE)WR.1943-5452.0001420.
Jiang, H., Z. Yu, and C. Mo. 2017. “Ensemble method for reservoir flood season segmentation.” J. Water Resour. Plann. Manage. 143 (3): 04016079. https://doi.org/10.1061/(ASCE)WR.1943-5452.0000734.
Jiang, Z., P. Sun, C. Ji, and J. Zhou. 2015. “Credibility theory based dynamic control bound optimization for reservoir flood limited water level.” J. Hydrol. 529 (Oct): 928–939. https://doi.org/10.1016/j.jhydrol.2015.09.012.
Lai, X., J. Jiang, Q. Liang, and Q. Huang. 2013. “Large-scale hydrodynamic modeling of the middle Yangtze River Basin with complex river-lake interactions.” J. Hydrol. 492 (Jun): 228–243. https://doi.org/10.1016/j.jhydrol.2013.03.049.
Leno, A. S., E. A. Kanashiro, R. Valverde, and V. Sridhar. 2014. “Dynamic framework for intelligent control of river flooding: Case study.” J. Water Resour. Plann. Manage. 140 (2): 258–268. https://doi.org/10.1061/(ASCE)WR.1943-5452.0000260.
Li, W., K. Lin, T. Zhao, T. Lan, X. Chen, H. Du, and H. Chen. 2019. “Risk assessment and sensitivity analysis of flash floods in ungauged basins using coupled hydrologic and hydrodynamic models.” J. Hydrol. 572 (May): 108–120. https://doi.org/10.1016/j.jhydrol.2019.03.002.
Li, Y., F. Gan, and J. Deng. 2006. “Preliminary study on impounding water of Three Gorges Project in September.” J. Hydroelectric Eng. 25 (1): 61–66. https://doi.org/10.3969/j.issn.1003-1243.2006.01.013.
Li, Y., Q. Zhang, J. Yao, and M. Li. 2015. “Advances in integrated hydrological and hydrodynamic simulation of lake-catchment system.” China Resour. Environ. Yangtze Basin 24 (2): 263–270. https://doi.org/10.11870/cjlyzyyhj201502012.
Lund, J. R. 2021. “Approaches to planning water resources.” J. Water Resour. Plann. Manage. 147 (9): 04021058. https://doi.org/10.1061/(ASCE)WR.1943-5452.0001417.
Luo, Y., Z. Dong, Y. Liu, X. Wang, Q. Shi, and Y. Han. 2021a. “Research on stage-divided water level prediction technology of rivers-connected lake based on machine learning: A case study of Hongze Lake, China.” Stochastic Environ. Res. Risk Assess. 35 (10): 2049–2065. https://doi.org/10.1007/s00477-021-01974-6.
Luo, Y., Z. Dong, Y. Liu, D. Zhong, Q. Jiang, and X. Wang. 2021b. “Safety design for water-carrying Lake flood control based on copula function: A case study of the Hongze Lake, China.” J. Hydrol. 597 (Jun): 126188. https://doi.org/10.1016/j.jhydrol.2021.126188.
Raso, L., M. Chiavico, and D. Dorchies. 2019. “Optimal and centralized reservoir management for drought and flood protection on the Upper Seine-Aube river system using stochastic dual dynamic programming.” J. Water Resour. Plann. Manage. 145 (3): 05019002. https://doi.org/10.1061/(ASCE)WR.1943-5452.0001040.
Robi, M. A., A. Abebe, and S. M. Pingale. 2019. “Flood hazard mapping under a climate change scenario in a Ribb catchment of Blue Nile River basin, Ethiopia.” Appl. Geomatics 11 (2): 147–160. https://doi.org/10.1007/s12518-018-0249-8.
Sosa, J., C. Sampson, A. Smith, J. Neal, and P. Bates. 2020. “A toolbox to quickly prepare flood inundation models for LISFLOOD-FP simulations.” Environ. Modell. Software 123 (Jan): 104561. https://doi.org/10.1016/j.envsoft.2019.104561.
Sun, H., Y. Dang, and W. Mao. 2018. “A decision-making method with grey multi-source heterogeneous data and its application in green supplier selection.” Int. J. Environ. Res. Public Health 15 (3): 446. https://doi.org/10.3390/ijerph15030446.
Tucciatelli, T., and D. Termini. 2000. “Finite-element modeling of floodplain flow.” J. Hydraulic Eng. 126 (6): 416–424. https://doi.org/10.1061/(ASCE)0733-9429(2000)126:6(416).
Walczak, D., and A. Rutkowska. 2017. “Project rankings for participatory budget based on the fuzzy TOPSIS method.” Eur. J. Oper. Res. 260 (2): 706–714. https://doi.org/10.1016/j.ejor.2016.12.044.
Wallington, K., and X. Cai. 2020. “Feedback between reservoir operation and floodplain development: Implications for reservoir benefits and beneficiaries.” Water Resour. Res. 56 (4): e2019WR026610. https://doi.org/10.1029/2019WR026610.
Wang, L., N. Li, H. Ma, X. Yan, and J. Wu. 2020. “Group decision study on Three Gorges reservoir’s water impounding schemes.” J. Hydroelectric Eng. 39 (7): 61–72. https://doi.org/10.11660/slfdxb.20200707.
Wang, W., C. Zhou, H. Shi, D. Zhu, and M. Gao. 2021. “Study on water level control of Hongze Lake in flood season based on water resources utilization.” Jiangsu Sci. Technol. 38 (14): 65–70. https://doi.org/10.3969/j.issn.1004-7530.2021.14.019.
Wang, Z., Y. Wang, S. Hu, K. Liu, and L. Cheng. 2017. “Theoretical framework of floodwater resources utilization in a basin: Quantitative interpretation.” J. Hydraul. Eng. 48 (8): 883–891. https://doi.org/10.13243/j.cnki.slxb.20161100.
Wu, F., P. Zhang, M. Ren, and T. Hu. 2015. “Integrated simulation of hydrological and hydrodynamic process of large lake.” China Rural Water Hydropower 7: 31–35. https://doi.org/10.3969/j.issn.1007-2284.2015.07.008.
Xie, A., S. Guo, Q. Zhang, H. Jiang, and G. Yang. 2018. “Optimal design of seasonal flood limited water levels by jointing operation of the reservoir and floodplains.” Water Resour. Manage. 32 (Jan): 179–193. https://doi.org/10.1007/s11269-017-1802-7.
Yutaka, T., and I. U. Juha. 2004. “Evolution of river management in Japan: From focus on economic benefits to a comprehensive view.” Global Environ. Change 14 (Jan): 63–70. https://doi.org/10.1016/j.gloenvcha.2003.11.005.
Zeng, Y., T. Jiang, and X. Quan. 2003. “Application of grey system theory to selection of reservoir’s normal water level.” Hydropower Autom. Dam Monit. 27 (1): 57–59. https://doi.org/10.3969/j.issn.1671-3893.2003.01.019.
Zhang, C., L. Wang, H. Zhu, and H. Tang. 2020a. “Integrated hydrodynamic model for simulation of river-lake-sluice interactions.” Appl. Math. Modell. 83 (Jul): 90–106. https://doi.org/10.1016/j.apm.2020.02.019.
Zhang, P., J. Mao, T. Hu, L. Dai, D. Xu, and H. Dai. 2020b. “Water exchange in a large river-lake system: Modeling, characteristics and causes.” River Res. Appl. 36 (5): 697–708. https://doi.org/10.1002/rra.3569.
Zhang, Q., et al. 2020c. “Lake hydrology in China: Advances and prospects.” J. Lake Sci. 32 (5): 1360–1379. https://doi.org/10.18307/2020.0511.
Zhang, Q., X. Ye, A. D. Werner, Y. Li, J. Yao, X. Li, and C. Xu. 2014. “An investigation of enhanced recessions in Poyang Lake: Comparison of Yangtze River and local catchment impacts.” J. Hydrol. 517 (Sep): 425–434. https://doi.org/10.1016/j.jhydrol.2014.05.051.
Information & Authors
Information
Published In

Journal of Water Resources Planning and Management
Volume 149 • Issue 8 • August 2023
Copyright
This work is made available under the terms of the Creative Commons Attribution 4.0 International license, https://creativecommons.org/licenses/by/4.0/.
History
Received: Apr 6, 2022
Accepted: Mar 14, 2023
Published online: May 23, 2023
Published in print: Aug 1, 2023
Discussion open until: Oct 23, 2023
ASCE Technical Topics:
- Bodies of water (by type)
- Engineering fundamentals
- Floods
- Fluid dynamics
- Fluid mechanics
- Gates (hydraulic)
- Hydraulic engineering
- Hydraulic structures
- Hydrodynamics
- Hydrologic engineering
- Hydrologic models
- Lakes
- Models (by type)
- Numerical models
- Two-dimensional models
- Water and water resources
- Water management
- Water storage
- Water supply
- Water supply systems
Authors
Metrics & Citations
Metrics
Citations
Download citation
If you have the appropriate software installed, you can download article citation data to the citation manager of your choice. Simply select your manager software from the list below and click Download.