The Role of Technical Safety Riskiness and Behavioral Interventions in the Public Acceptance of Autonomous Vehicles in China
Publication: Journal of Transportation Engineering, Part A: Systems
Volume 149, Issue 1
Abstract
After reports of self-driving car accidents, public acceptance of autonomous vehicles (AVs) has shown a downward trend. To explore factors influencing this decline of acceptance and to bring acceptance back to the normal range, this study proposed a new factor, human-manipulated risk perception (HMRP), in the context of human–machine collaborative driving. On this basis, we explored the relationship between HMRP and acceptance of AVs and the mechanism of influence. Furthermore, we proposed a behavioral intervention approach to mediate and moderate the relationship between the two. First, an improved acceptance model was developed based on HMRP. Subsequently, a survey was executed, and 300 valid questionnaires were returned. Test results for the improved model showed that HMRP had a significant negative effect on acceptance of AVs. A hybrid model of mediation and moderation was designed, and user experience was introduced as a moderating variable. The results showed that the proposed behavioral intervention strategy was effective in attenuating the negative effect of HMRP on acceptance of AVs. This study provides theoretical support and methodological guidance for developing behavioral interventions to improve user acceptance.
Introduction
Automated driving technology is the core technology for the development of intelligent vehicles. In 2021, the United Nations Economic Commission for Europe (UNECE) R157 became the world’s first AV certification regulation, marking the entry of intelligent vehicles into the first year of autonomous driving with level 3. The Mercedes-Benz EQS received the world’s first L3 autonomous driving certification issued by the German Federal Motor Transport Administration; this means that the Mercedes-Benz EQS has officially opened the intelligent era of autonomous driving. In the future market, AVs will start to have various product features that are certified for Level 3 autonomous driving regulations. It means that an increasing number of AVs on the road can continuously perform a full range of dynamic driving tasks, such as environmental sensing, decision planning, and driving operations under the operating conditions for which the system is designed; human drivers are still required to maintain attention at all times but do not need to operate the vehicle. However, in case of an emergency, the human driver is required to take over the vehicle (SAE 2021). However, higher level autonomous driving technology is still in the early stages of commercialization.
In the process of advanced assisted driving toward advanced autonomous driving, user acceptance of automated driving technology and safety perceptions have become the main factors limiting the commercialization of AVs. In recent years, AVs have been involved in several traffic accidents, and the acceptance of autonomous driving technology has declined. For example, in 2019, a survey by the American Automobile Association (AAA) found that 71 percent of US drivers said they were afraid of riding in a fully autonomous vehicle; this was essentially unchanged from 78% in an early 2017 survey and 73% in a 2018 survey (AAA 2019). However, this was a significant increase from 63% in a survey conducted at the end of 2017 and was consistent with the findings of Lienert (AAA 2018; Lienert 2018).
In addition, China’s State Administration of Market Regulation reported 29 recalls related to intelligent vehicle systems and functions involving 485,000 vehicles in the last five years; this reflects a rapid upward trend (Gmw 2020). It is evident that with the rapid development of autonomous driving technology and the complex and variable nature of the traffic environment, the number of safety incidents and vehicle recalls for AVs continues to climb. This directly affects users’ trust in the safety of self-driving technology and weakens people’s willingness to purchase and use self-driving cars (Kang et al. 2020).
Therefore, it is necessary to understand the reasons for the decline in user acceptance of AVs following a spate of AV accidents. In this context, it is important to explore potential risk factors affecting AV acceptance in terms of autonomous driving safety and how to improve technical acceptance for the automation upgrade and wider adoption of AVs.
Literature Review
Safety Risk Perception Associated with AVs
The interpretation and prediction of the acceptance of higher-level AVs has received significant research attention from both academics and the automotive industry. Scholars have found that perceptual factors of autonomous driving technologies, such as perceived ease of use, perceived usefulness, perceived safety, and perceived risk, have significant effects on user acceptance (Gkartzonikas and Gkritza 2019; Zoellick et al. 2019; Moody et al. 2020). In recent years, AV safety has become a key indicator of concern influencing user intention to adopt AVs following reports of traffic accidents involving AVs. Previous studies have shown that the safety risks of AVs and their scope are increasingly valued by users (Karnouskos 2021; Perello-March et al. 2022).
The majority of respondents in previous studies have ranked self-driving vehicle safety risks as their most important concern (Gold et al. 2015; Bansal et al. 2016; Shin and Managi 2017; Kaur and Rampersad 2018; Liu et al. 2019; Ha et al. 2020). In analyzing previous studies, it was found that the perceived risks hindering the adoption of autonomous driving technologies can be grouped into five categories: economic risks, cyber security, information privacy disclosures, autonomous driving system risks, and weather and terrain risks. These five categories of risks and their corresponding main issue items are summarized in Table 1. Existing research has focused on the role of safety risks related to connected vehicles, such as cyber security and information privacy leakages, as well as on the reliability of single-vehicle intelligence and other safety risks affecting technology adoption.
| Risk perception type | Main factors | Literature |
|---|---|---|
| Economic risks | Increase in initial cost | Bansal et al. (2016), Talebian and Mishra (2018), Acheampong and Cugurullo (2019), and Deng et al. (2020) |
| Higher than expected maintenance costs | ||
| Legal liability of the driver or owner of the AV | ||
| Cyber-security risks | Hacking of the vehicle’s computer system | Gold et al. (2015), Bansal et al. (2016), Liu et al. (2019), Talebian and Mishra (2018), Acheampong and Cugurullo (2019), and Chikaraishi et al. (2020) |
| Risk of failure due to operating system crashes | ||
| Risk of failure due to virus attacks | ||
| Risk of failure due to internet disconnection | ||
| Information privacy disclosure | Track records | Gold et al. (2015), Bansal et al. (2016), and Liu et al. (2019) |
| Share my personal information with other entities | ||
| Surveillance | ||
| Automated driving system risks | Possible traffic accidents caused by technical failures | Shin and Managi (2017), Kaur and Rampersad (2018), Zhang et al. (2019), Chikaraishi et al. (2020), Ha et al. (2020), and Pascale et al. (2021) |
| The probability of a software failure or software error event | ||
| Probability of a hardware or electronic failure | ||
| Vehicle motion control risk | ||
| Weather and terrain risks | AVs can get into unexpected situations in bad weather conditions | Liu et al. (2019) and Deng et al. (2020) |
| AVs can have accidents in special terrain | ||
| Cannot cope with various weather conditions and terrain |
But few studies have explained the decline in technology acceptance as autonomous vehicle accidents have occurred. Increased autonomous vehicle accidents may lead to changes in public opinions and attitudes toward autonomous driving technology. AV accidents can create public misconceptions and antipathy toward self-driving technology (Sinha et al. 2021). Analyzing accidents involving AVs, this study found that driver misconduct accounted for a certain percentage of accidents in autonomous driving mode. However, there has been a lack of research on the safety of human manipulation associated with autonomous driving in the operation of conditional (Level 3) and highly automated (Level 4) AVs.
Based on the six levels of vehicle automation defined by the Society of Automotive Engineers (SAE), AVs with conditional (Level 3) and highly (Level 4) autonomous driving are defined as vehicles in which key features regarding safety and driving tasks are automated; drivers are able to transfer control and operation of driving tasks to the system in limited scenarios. The implication is that the safety of AVs may change significantly as they progress through the different levels. Even at the same level of automation, the functional architecture of AVs may vary. In summary, human–machine collaborative driving is fundamental to the safety assurance of higher-level AVs. The need for drivers to be able to accurately judge and correctly operate level 3 autonomous driving functions in relation to the road and traffic environment and to complete the transfer and take over of control of a vehicle is a significant challenge for AV safety. Therefore, it is necessary to understand the impact of risks related to human driver manipulation of automated driving systems on user acceptance in order to find the real reasons for the decline in technology acceptance and to provide effective behavioral intervention methods for improving technology acceptance.
Constructs from Technology Acceptance Model and Theory of Planned Behavior
In the automotive field, technology acceptance model (TAM) and theory of planned behavior (TPB) are the two main theories that are generally accepted and widely used in explaining and predicting the acceptance of technology systems. TAM, proposed by Davis et al. in 1989, was one of the first theories on technology acceptance, developed early on in the information technology field (Davis et al. 1989). The original TAM model consisted of four constructs: perceived usefulness (PU), perceived ease of use (PEOU), behavioral attitude (BA), and behavioral intention (BI). The two metrics PU and PEOU were proposed for evaluating the technology itself from the user’s perspective; these two have a direct and/or indirect positive impact on BI. Moreover, TAM has shown good performance when applied to AV acceptance studies (Rahman et al. 2017; Panagiotopoulos and Dimitrakopoulos 2018; Liu et al. 2019; Zhang et al. 2021).
TPB is the most influential extension model of theory of reasoned action (Ajzen 1991). It is an important theory that contributes to the understanding of the influence of psychological factors on behavior and explaining behavioral change and reveals the process of making rational decisions about the evaluation of actual actions. TPB consists of four constructs: perceived behavioral control (PBC, the perceived ease of performing a particular behavior), subjective norm (SN, the perceived social pressure to adopt a particular behavior or not), BA (i.e., overall assessment), and BI (i.e., a direct predictor of behavior). Among these constructs, BI is significantly and positively predicted by PBC, SN, and BA. TPB has been found to be able to explain, predict, and intervene in the occurrence of a phenomenon through the relationship between behavioral intention and actual behavior (Shalender and Sharma 2021). In addition, the validity of applying TPB to explain the process of external factors influencing the acceptance of AVs is supported by many previous studies (Rahman et al. 2017; Buckley et al. 2018; Acheampong and Cugurullo 2019; Gunawan et al. 2022).
Based on the foregoing analysis, this study aimed to explain the reasons for the decline in user acceptance of AVs following a spate of AV accidents and to improve acceptance of AVs. In the context of human–machine collaborative driving, this study proposed a new factor, human-manipulated risk perception (HMRP), related to the safety of AVs. The relationship between HMRP and AV acceptance and the mechanism of HMRP’s influence were explored. Then, a hybrid model of mediation and moderation was designed to test the effectiveness of the proposed behavioral intervention approach on improving the acceptance of AVs.
Methods
Construction of the Improved Model
To explain the role of human-manipulated risk perception on the acceptance of AVs and the process of the corresponding impact, an improved acceptance model for AVs was constructed by fusing TAM, TPB, and human-manipulated risk perception (Fig. 1). The PU and PEOU constructs of TAM were used to characterize the perceived benefits and ease of operation of AVs, respectively. Together with the human-manipulated risk perception variable proposed in this study, these three perceptual constructs formed a benefit-risk perception module to characterize AVs. Next, the BA, SN, and PBC constructs of TPB were added to explain the process by which the foregoing perceptual factors influence technology acceptance. Because higher-level autonomous driving technology is not yet widespread, making the actual use of the system untestable, BI was used in this study (Sun et al. 2021; Detjen et al. 2021). Behavioral intention is the willingness to take a certain action or behavior and is the main influencing factor in determining the occurrence of behavior (Jung and Kim 2021).
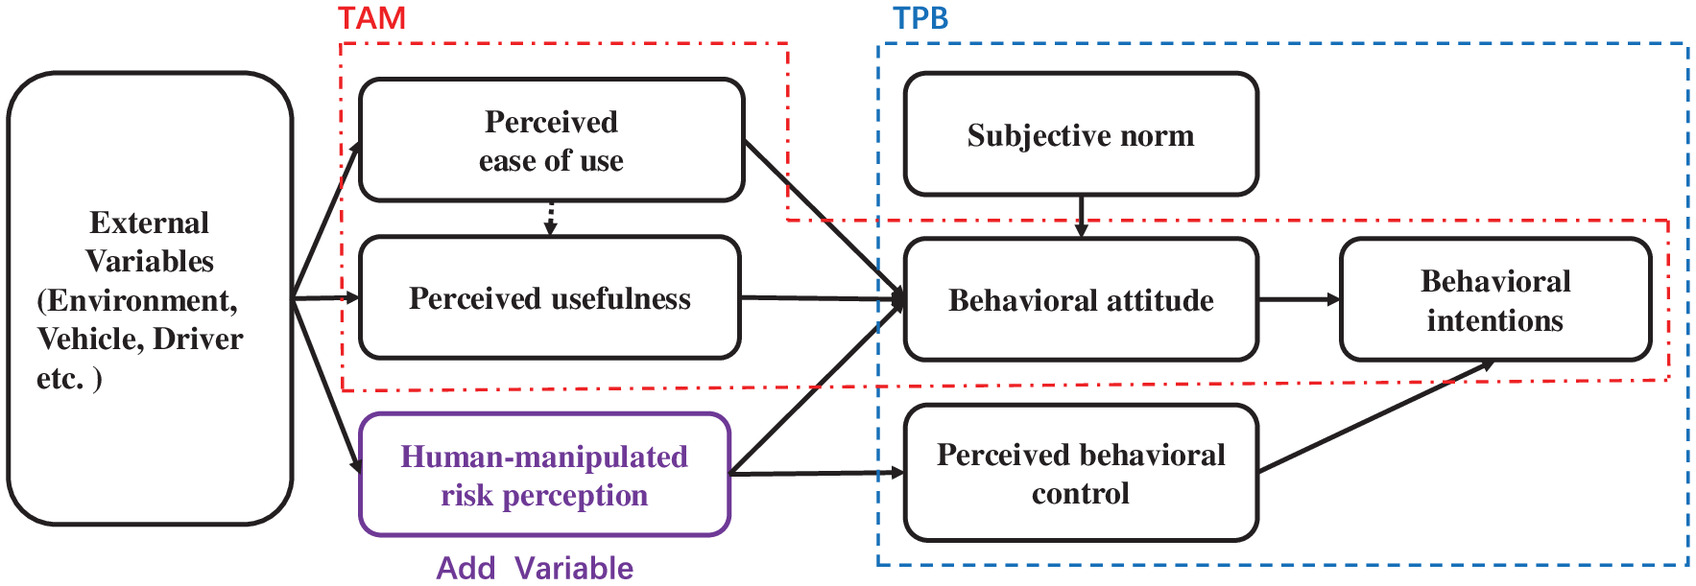
Because the original TAM and TPB models are generic theoretical models oriented to general technologies, the constructs of these two theoretical models cannot be directly used to explain phenomena related to the unique properties of AVs. Therefore, this study extended the concept of all constructs in the new model while following the assumed relationships between the constructs in the classical TAM and TPB theoretical models.
In the new model, there are three latent variables of technology perception: perceived ease of use, perceived usefulness, and perceived safety riskiness. Perceived ease of use refers to existing AVs with a set of functions that are easy to operate and an operating interface that matches people’s driving habits (Hegner et al. 2019). Perceived usefulness is the ability of AVs to solve problems in travel and is a key factor in determining the public’s use of self-driving technology. This variable is influenced by perceived ease of use. Perceived safety riskiness refers to a user’s perception that autonomous vehicle accidents may cause physical injuries through self-perception of external information, and it has a negative effect on both behavioral attitude and perceived behavioral control.
Perceived ease of use has a positive effect on behavioral attitude.
Perceived ease of use has a positive effect on perceived usefulness.
Perceived usefulness has a positive effect on behavioral attitude.
Travel interference and improper driver operation are the main causes of self-driving car accidents. Chinese traffic accident statistics report a phenomenon of self-driving car accidents: on the highway, after the ACC (adaptive cruise control) adaptive cruise function is turned on, Level 2 assisted driving AVs drive autonomously; that is, the system controls the speed of the vehicle. During this period, a significant percentage of drivers involved in accidents did not take back control of the vehicle in response to changes in the traffic environment outside the vehicle, such as trucks changing into their lanes (TAMPS 2021). As higher levels of autonomous driving features are developed, more and more vehicles will be equipped with different levels of autonomous driving systems; people have been found to be overly dependent on them (Chikaraishi et al. 2020). It has also been found that the misalignment of technologies and products of different levels may be the main cause of traffic accidents due to the inability of currently marketed autonomous driving technologies to replace drivers in complex road environments (Li et al. 2020).
Based on the foregoing analysis, HMRP was proposed as a novel concept in this study; it characterizes the risk of potential human injury associated with the uncertainty of human manipulation in the context of human–machine collaborative driving. In addition, HMRP in the improved model refers to the extent to which users perceive this risk through external information related to AVs.
It has been shown that perceived risk is negatively related to behavioral attitudes. It has been shown that functional perceived risk is more likely to influence user attitudes toward new products than affective perceived risk (Pascale et al. 2021). However, this study inferred that user perceptions of maneuvering risks in human–machine collaborative driving of AVs may negatively affect their perceived behavioral control toward adopting AVs. Therefore, Hypotheses 4 and 5 were proposed.
HMRP has a negative effect on behavioral attitude.
HMRP has a negative effect on perceived behavioral control.
Subjective norms are factors that make users show consistency in their attitudes compared to others (Man et al. 2020). Because the public has a herd mentality and following habits, the influence of advertising, family, friends, and colleagues, and negative news can cause user attitudes to shift. Because users’ ability to both receive and analyze information is increasing, the influence of subjective norms on the acceptance of AVs is mainly manifested in three effects: acceptance, neutrality, and rejection, subjective norms is one of the main influencing factors for studying users’ psychological changes. Perceived behavioral control is a direct reflection of user mastery of the control ability and functions of an AV according to their own comprehensive qualities (Buckley et al. 2018). Therefore, perceived behavioral control, as a criterion for judging one’s own mastery and control of autonomous driving technology, is another major influencing factor on user acceptance.
Subjective norms have a positive influence on behavioral attitude.
Behavioral attitude, as a psychological disposition on an affective state, is also a key variable in the theory of planned behavior; it is defined as the overall perception of using an AV by evaluating AV with a certain degree of approval/disapproval. Its effect on the acceptance of AVs is manifested in three main effects: acceptance, neutrality, and rejection.
Behavioral attitude has a positive influence on behavioral intention.
Perceived behavioral control is a direct reflection of user mastery of the control capabilities and functions of an AV and the ability to control human–machine collaborative driving based on his or her overall qualities, experience, capabilities, and resources. Therefore, perceived behavioral control, as a criterion for evaluating and judging the user’s own ability to master and control autonomous driving technology, is another major factor influencing the acceptance of AVs.
Perceived behavioral control has a positive influence on behavioral intention.
Questionnaire Design
A questionnaire was designed based on the definition of the constructs in the improvement model and the purposes of this study. The final questionnaire had three sections: Part I, Part II and Part III (see Appendix). Part I, sociodemographic factors, consisted of five variables: gender, age, education, driving experience, and knowledge related to AVs.
Part II, the preexperience scale, corresponded to the seven constructs of the improved acceptance model for AVs and consisted of 27 questions. These questions are presented in the Appendix and were modified from previous studies (see sources in the Appendix). The items for PEOU and PU were expanded to incorporate the functional benefits of AVs and individual perceptions of the driving experience. Moreover, the items for BA, PBC, SN, and BI were adapted to include information on human–machine collaborative driving capabilities and policies and advertisements related to AVs. The problematic items for the new construct HMRP proposed in this study were self-developed and tested in a pilot study. All items in this part of the survey were measured on a five-point Likert-type scale.
Part III, the postexperience feedback scale, was composed of 11 questions from the hybrid model of mediation and moderation (the questions on the HMRP construct were the same as those on HMRP in the preexperience scale).
Survey Approach
The survey was implemented in two phases: a pilot study and a questionnaire survey. In the pilot study, the questionnaire was modified based on suggestions from six scholars in the field; then, an online pilot test was administered to a convenience sample of 30 adult individuals. Based on feedback from the pilot study, the questionnaire was further adjusted and refined to gain clarity on the indicator questions, resulting in the revised final questionnaire, which can be found in the Appendix.
For the survey, each participant completed Parts I and II of the questionnaire prior to a self-driving ride experience; Part III was completed after the experience. The survey was open to those who participated in a free ride in the L3 autonomous driving car at the Guangzhou Auto Show in China. The L3 autonomous driving car was manned by a safety officer in the driver’s seat, who only observed road conditions and did not intervene in driving unless the autonomous driving system requested that they take over. In the preexperience survey, respondents were informed that the vehicle under investigation was a Level 3 self-driving car, and the concept was explained in a promotional video. During the survey, the purpose of the survey was explained to the respondents. It was emphasized that the survey would be conducted anonymously and that personal information would be kept confidential. A total of 315 questionnaires were distributed online and on paper, and 15 (4.76%) were invalid.
Analysis of Sociostatistical Variables
Of the valid respondents (), 197 (65.7%) were male; the mean age of the participants was 34.0 years old (; 18–59 years). A total of 171 (57.0%) had a valid driver’s license, and mean actual driving experience was 5 years. In addition, 124 (41.3%) participants were able to correctly determine the most advanced level of autonomous driving available in the current market.
In addition, the acceptance level of users was 57%, lower than the average acceptance level of 63% in a previous survey. The acceptance of male users was 0.3% higher than that of female users, and the differences in acceptance between different ages ranged from 0.8% to 0.12%; these statistics indicated that the influence of gender and age on acceptance could be ignored. However, level of education received had a greater impact on acceptance; the higher the level of education received, the higher the acceptance, with a maximum difference of 1.75%.
Data Analysis and Model Validation
Before hypothesis testing for the improved model, the data were analyzed; that is reliability and validity testing of the observed variables was conducted. First, the collected data were tested for reliability in order to check the consistency of the measured data. Next, exploratory factor analysis and validation factor analysis were performed to assess the validity of the components, that is, the degree of validity that could truly reflect the variables being measured to ensure the degree of accurate measurement of the questionnaire used in the study. After the relevant fitness indicators of the improved model met the requirements, the second stage of the validation of the improved model was carried out, in which path coefficient analysis was performed to test the research hypotheses in the improved model.
Reliability Test
Reliability refers to the extent to which the results obtained are consistent when the same method is adopted to measure the same subject repeatedly. To ensure the internal consistency of the scale, SPSS version 22 software was used to test the reliability of the sample of 300 before conducting exploratory factor analysis. The value of Cronbach’s coefficient was 0.769; its value was in the range of 0.7 to 0.8, indicating that the scale had considerable reliability.
Exploratory Factor Analysis
Kaiser-Meyer-Olkin and Bartlett’s Spherical Test
Exploratory factor analysis was implemented on the sample data using SPSS software, and the validation results are shown in Table 2. The Kaiser-Meyer-Olkin (KMO) test coefficient was 0.940, which was greater than 0.8, indicating that the designed scale data were well suited for factor analysis. The chi-square value of Bartlett’s spherical test was 10930.755 with a significance level of 0.000, which passed the significance test with a significance level of 1%, implying that the statistical test of public behavioral intention was significant (Zhou et al. 2020). The test results indicated that the sample data were suitable for validity analysis.
| Test items | Value |
|---|---|
| Kaiser-Meyer-Olkin metric | 0.940 |
| Bartlett’s sphericity test | |
| Chi-square | 10,930.755 |
| Degree of freedom (df) | 0.741 |
| Significance | 0.000 |
Principal Component Analysis
Through principal component factor analysis of the sample data, the study obtained factor analysis of 27 measurable variables for the seven potential variables (PU, PEOU, HMRP, PBC, SN, BA, BI) involved in the improved acceptance model, and the results are shown in Table 3. The factors were extracted by orthogonal rotation to select eigenvalues greater than 1.0 and factor loadings greater than 0.4. The cumulative contribution of the six common factors was 68.159%, indicating that they could adequately reflect the original data (Sharma and Mishra 2020).
| Common factors | Number of items | Factor loadings | Eigen value | Variance contribution rate | Cumulative variance contribution rate | CR | AVE | Cronbach’s alpha |
|---|---|---|---|---|---|---|---|---|
| PU | 4 | 0.645 | 2.898 | 25.431 | 25.431 | 0.860 | 0.635 | 0.877 |
| PEOU | 4 | 0.598 | 2.664 | 3.831 | 29.262 | 0.856 | 0.660 | 0.852 |
| HMRP | 6 | 0.671 | 2.557 | 10.607 | 39.869 | 0.845 | 0.583 | 0.829 |
| SN | 4 | 0.850 | 3.733 | 5.674 | 45.543 | 0.893 | 0.677 | 0.890 |
| PBC | 3 | 0.746 | 3.702 | 9.493 | 55.036 | 0.841 | 0.607 | 0.857 |
| BA | 3 | 0.687 | 3.948 | 13.123 | 68.159 | 0.847 | 0.571 | 0.837 |
| BI | 3 | 0.647 | 4.725 | — | — | 0.861 | 0.559 | 0.870 |
Note: PU = perceived usefulness; PEOU = perceived ease of use; HMRP = human-manipulated risk perception; SN = subjective norm; PBC = perceived behavioral control; BA = behavioral attitude; and BI = behavioral intention.
Cronbach’s alpha was calculated to determine the internal consistency internal consistency of the seven factors (PU, PEOU, HMRP, PBC, SN, BA, BI). Values above 0.70 for Cronbach’s alpha are generally acceptable in exploratory studies. In addition, for the reliability test of the factors, composite reliability (CR) was calculated. A cutoff value of 0.70 for CR generally indicates acceptable reliability (Hair et al. 1998). Last, average variance extracted (AVE) was calculated. AVE value should exceed 0.50, implying that a construct captures a variance greater than that caused by measurement error (Fornell and Larcker 1981). The Cronbach’s alpha, CR, and AVE of all factors in Table 3 satisfied the standard reference values, indicating good internal consistency and reliability of all constructs.
Validation Factor Analysis
In this study, validation factor analysis of the model was performed by AMOS (analysis of moment structure) version 24 software based on the questionnaire data. Options whose modification indices (MI) values did not match were removed. The obtained model fitness metrics are shown in Table 4. The results of factor analysis of the initial model were that the coefficient was between 0.829 and 0.890, the average variance was between 0.599 and 0.677, and the comprehensive reliability was between 0.841 and 0.893. The initial model was modified according to parameters such as CMIN/DF, comparative fit index (CFI), and root-mean square error of approximation (RMSEA).
| Fitting model | CMIN/DF | GFI | CFI | RMSEA | AIC | BCC | NFI | IFI |
|---|---|---|---|---|---|---|---|---|
| Initial model | 2.329 | 0.863 | 0.930 | 0.058 | 1,058.361 | 1,070.929 | 0.885 | 0.931 |
| Optimal model | 1.394 | 0.925 | 0.981 | 0.031 | 716.039 | 734.806 | 0.938 | 0.982 |
Note: AIC = Akaike information criterion; BCC = benefits calculated; and IFI = incremental fit index.
The optimal model was obtained by constraining the substandard index. The modified model fit parameters are shown in Table 4. The CMIN/DF of the model was 1.394, the goodness of fit index (GFI) was 0.925 (), the CFI was 0.981 (), the RMSEA was 0.031 (), and the normed fit index (NFI) was 0.938 (). The latent variables of the modified model had good discriminant validity, intrinsic validity, and good fit (Serang et al. 2017).
The results of the aforementioned factor analysis showed that the measurement results of the questionnaire had a high degree of fit with the content to be examined, indicating that the measurement had good structural validity (Wood et al. 2015). Therefore, the proposed model had a good degree of adaptation.
Path Analysis and Verification of Structural Equation Model
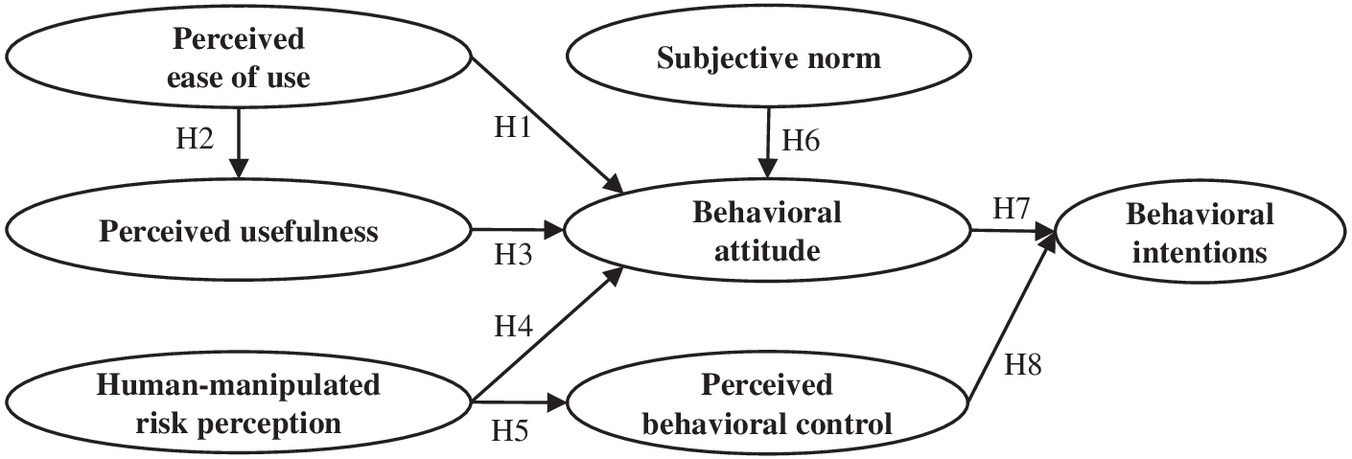
After the reliability test and validity test of the scale data were passed, a path analysis of the structural equation model proposed in this study was conducted using AMOS version 25 software; the research hypothesis map is presented in Fig. 2.
Because the assumed regression coefficient was zero (Peterson 2019) and the treatment of the approximately normally distributed random variable was positioned at 0.05, the absolute value of the CR critical ratio was 1.96. Therefore, the absolute value of the regression coefficient for each assumed path was greater than 1.96, and the values were less than 0.05. After correction and constraint, the fitting results of the optimal model path coefficients were obtained as shown in Table 5.
| Paths | Standardization estimate | Testing result | Critical ratio |
|---|---|---|---|
| From PEOU to BA | 0.411* | H1 accepted | 5.458 |
| From PEOU to PU | 0.180* | H2 accepted | 2.463 |
| From PU to BA | 0.721* | H3 accepted | 11.449 |
| From HMRP to BA | * | H4 accepted | 6.258 |
| From HMRP to PBC | * | H5 accepted | 10.754 |
| From SN to BA | 0.417* | H6 accepted | 6.463 |
| From BA to BI | 0.596* | H7 accepted | 9.725 |
| From PBC to BI | 0.420* | H8 accepted | 6.291 |
Note: *.
As shown in Table 5, PU and PEOU had a significant positive effect on BA, but the degree of PEOU’s effect on PU was not significant. In addition, HMRP had a significant negative effect on both BA and PBC. SN had a significant positive effect on BA, and PBC and BA were significantly positively correlated with BI.
The effect of PU and PEOU on BI was consistent with the findings of previous studies (Panagiotopoulos and Dimitrakopoulos 2018; Liu et al. 2019; Zhang et al. 2021). The influence relationships of PBC, BA, and SN with BI were also consistent with previous studies (Buckley et al. 2018; Acheampong and Cugurullo 2019; Gunawan et al. 2022). Moreover, it was concluded that HMRP indirectly influences the acceptance of AVs through PBC and BA, and HMRP on acceptance of AVs has a significant negative influence relationship. However, few studies have focused on the effect of perceived safety risks in terms of human manipulation on the acceptance of AVs. Therefore, a cross-sectional comparison was not possible.
Mediating and Moderating Intervention Analysis
The foregoing results show that HMRP negatively affected AV acceptance by influencing users’ BA and PBC related to AV adoption, implying that HMRP may cause a decrease in acceptance of AVs. To weaken the negative effect of HMRP on AV acceptance, a hybrid model of mediation and moderation was developed, as shown in Fig. 3. This model was constructed on the basis of the research hypotheses in the improved acceptance model that have been validated in our study above.
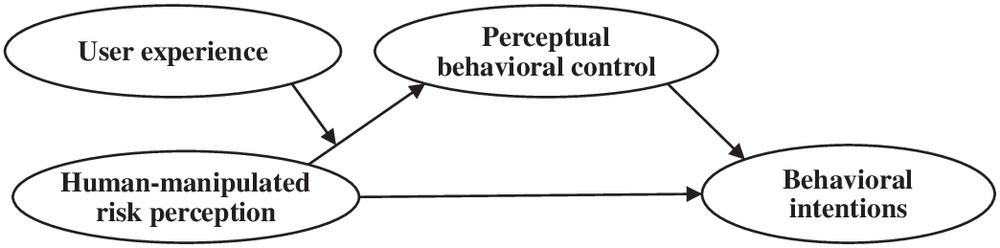
The main purpose of this model was to control the negative effect of HMRP on the acceptance of AVs through shunting. In the hybrid model of mediation and moderation, BI still refers to the intention to adopt AVs, representing acceptance of AVs. PBC was introduced into the path from HMRP to BI, mediating the relationship between HMRP and BI. In addition, user experience was introduced in the uplink of the mediated path from HMRP to BI via PBC, as an intervening variable to moderate the impact of HMRP on PBC.
The corresponding questionnaire parts and survey methods for this model are described in the sections “Questionnaire Design” and “Survey Approach,” respectively. The study was based on 300 synchronous questionnaires. After the validity and reliability of the data were verified, the mediating effect of PBC on the relationship between HMRP and AV acceptance, and the moderating effect of user experience was analyzed as follows.
Common Method Bias Test
The common method bias test was performed on the hybrid model of mediation and moderation using the Harman one-way test (Grafke and Vanden-Eijnden 2019). It was found that there were 10 factors with eigenvalues greater than 1, and the variance explained by the first factor was 17.62%, which was much less than the critical value of 40%. The results indicated that there was no significant common method bias in this study.
Descriptive Statistics and Correlation Matrix of the Main Variables
The results of the correlation analysis of the main variables in this hybrid model are shown in Table 6. The correlation coefficient between HMRP and BI for adopting AVs was , which indicates a significant negative correlation between HMRP and BI. In addition, there were significant positive correlations between user experience and BI for adopting AVs and between PBC and BI for adopting AVs. HMRP was significantly and negatively correlated with PBC.
| Potential variable | HMRP | PBC | UE | BI | |
|---|---|---|---|---|---|
| HMRP | 1 | ||||
| PBC | * | 1 | — | — | |
| UE | * | 0.38* | 1 | — | |
| BI | * | 0.37* | 0.34* | 1 |
Note: HMRP = human-manipulated risk perception; PBC = perceived behavioral control; UE = user experience; and BI = behavioral intention. *.
Moderated Mediation Model Test
First, a mediating effect test was conducted using Model 4 in the SPSS macro program Process version 3.3 (Kuang et al. 2021). The results showed that after controlling for the effects of educational degree and driving age, the total effect was 0.31, 95% confidence interval (CI) (0.24, 0.38), and the direct effect was 0.19, 95% CI (0.12, 0.26) (see Table 7). In addition, the mediating effect of PBC was 0.12, 95% CI (0.08, 0.15), which accounted for 38.71% of the total effect. This implies that PBC partially mediated the relationship between HMRP and BI for adopting AVs.
| Regression equations | Fitting coefficients | Significance of regression coefficients | ||||
|---|---|---|---|---|---|---|
| Outcome variable | Predictive variable | 95% CI | ||||
| PBC | Educational level | 0.12 | 50.18* | 0.06 | (, 0.12) | 1.58 |
| Driving age | 0.01 | (, 0.06) | 0.16 | |||
| HMRP | (, ) | |||||
| User experience | 0.32 | (0.25, 0.39) | 9.06 | |||
| HMRP *user experience | 0.14 | (0.07, 0.20) | 4.41 | |||
| BI | Educational level | 0.31 | 66.25* | 0.34 | (0.27, 0.41) | 10.10 |
| Driving age | 0.07 | (, 0.20) | 2.04 | |||
| PBC | 0.19 | (0.12, 0.27) | 5.12 | |||
| HMRP | (, ) | |||||
Note: *.
Furthermore, a moderating effect test was conducted by adopting Model 7 in the SPSS macro program Process. The results indicated that the effects of HMRP and user experience on PBC were significant. In addition, the mediated effect value of PBC was 0.14, 95% CI (0.10, 0.19), at high user experience levels. In contrast, the mediated effect of PBC decreased to 0.06, 95% CI (0.03, 0.09), when user experience was low. This suggests that user experience moderated the mediating role of PBC in the relationship between HMRP and acceptance of AVs. Moreover, the results imply that the negative effect of HMRP on acceptance of AVs was greater when user experience was perceived to be low.
To further explain the moderating effect of user experience, user experience levels were divided into two groups, high and low, according to the mean plus or minus one standard deviation, and then a simple slope test was performed (Hinz et al. 2020). Fig. 4 presents the moderating effect of user experience levels on the negative effect produced by HMRP. The x-axis represents HMRP and the y-axis represents PBC. The results show that when the level of user experience was low, there was a significant negative effect of HMRP on PBC [, , 95% CI (, )]. In contrast, when the level of user experience was high, the negative effect of HMRP on PBC showed a slowing trend [, , 95% CI (, )].

Discussion and Conclusion
This study aimed to explain the reasons for the decline in user acceptance of AVs following a spate of AV accidents and to improve acceptance of AVs. In the context of human–machine collaborative driving, this study proposed a new factor, HMRP, related to the safety of AVs. On this basis, this study focused on exploring the effect of human manipulation risks associated with higher-level automated driving on the acceptance of AVs and the process mechanisms by which human manipulation risk affects the acceptance of AVs. The HMRP variable was introduced to construct an improved acceptance model for AVs. The test results of the improved model showed that HMRP negatively and significantly influenced PBC and BA. In addition, PBC and BA were significantly and positively related to AV acceptance. Therefore, it can be concluded that HMRP is the main reason for the decrease in acceptance of AVs. Moreover, it was also found that user confusion about the conceptual scope of autonomous driving technology and misuse of functions were the main reasons that caused users to doubt their control capabilities.
In addition, it was found that HMRP indirectly affected the acceptance of AVs through PBC and BA, and there was a significant negative correlation between HMRP and acceptance of AVs. This means that in the context of human–machine collaborative driving, when a user’s perceived manipulation risk of the autonomous driving function is higher, the user’s perceived ability to manipulate and control AVs may decrease, leading to a weakening of the user’s confidence and sense of safety in the human–machine collaborative control of AVs, which in turn indirectly makes the user’s acceptance of AVs lower. However, HMRP may also make user attitudes toward AVs less positive, further reducing AV acceptance.
To improve the acceptance of AVs, a hybrid model of mediation and moderation with added user experience was proposed, based on the foregoing conclusions. Mediation and moderation analysis of the hybrid model was conducted by obtaining simultaneous survey data from respondents after their test ride experience. The results showed that PBC partially mediated the negative influence relationship between HMRP and AV acceptance, and that user experience had a significant intervention effect on the relationship between HMRP and PBC. It was also found that users if users became familiar with the application scenarios and conditions of use autonomous driving function, it will promote users’ ability to manoeuvre and control AVs. In addition, the improvement of users’ perceived ability to maneuver and control AVs may have weakened the negative effect of HMRP on the acceptance of AVs. Therefore, it can be concluded that the hybrid model of mediation and moderation improved the acceptance of AVs. The findings of this study can contribute to user perceptions of AV safety, which in turn can promote driving safety and technology development.
With the continuous increase in the number of civilian vehicles, the marketing of high-level AVs, and the frequency of extreme weather, the complexity of mixed traffic is likely to increase in the future. This poses a great challenge to the safety of human–machine collaborative driving of AVs. Future research needs to expand the scope of the questionnaire, collect more information about typical application scenarios for autonomous driving, and further explore theories and methods to improve the acceptance of AVs.
Appendix. Questionnaire on Human-Manipulated Risk Perception and AV Acceptance
| Structure | Construct | Item | Options | Source |
|---|---|---|---|---|
| Part I | Gender | 1. What is your gender? | A Male; B Female | — |
| Age | 2. What is your age? | A ; B 19–25; C 26–30; D 31–40 E 41–50; F 51–60; G 61 and over | ||
| Educational level | 3. What is your level of education? | A Junior middle school or below; B Senior high school; C Vocational college; D Undergraduate; E Postgraduate | ||
| Qualified to drive or not | 4. Do you hold a valid driver’s license? | A Yes; B No | ||
| Driving years | 5. How many years of actual driving experience do you have? | A None; B 1 year or less; C 1–3 years; D 3–5 years; E 5 years or more | ||
| Knowledge related to AVs | 6. What do you think is the highest level of technology for AVs currently in use in the market? | A Level 1, supported driving; B Level 2, partially automated; C Level 3, conditionally automated; D Level 4, highly automated; E Level 5, fully automated | ||
| 7. In order to match the technology of autonomous driving with the right features, which of the following options would be the most appropriate to choose? | A Emergency braking; B Constant speed cruise control; C Lane departure warning; D Automatic lane change; E Congestion following; F Adaptive cruise control; G Automatic lane keeping; H Highway automatic driving; I Highway automatic navigation | |||
| The functions included in the Level 1: Driver assistance. | ||||
| The functions included in the Level 2: Partial driving automation. | ||||
| The functions included in the Level 3: Conditional driving automation. | ||||
| The functions included in the Level 4: High driving automation. | ||||
| The functions included in the Level 5: Full driving automation. | ||||
| Part II | Perceived usefulness | 8. In order to accurately evaluate the usefulness characteristics of AVs, which of the following options would be the most appropriate to choose? | A Very satisfied; B Satisfied; C General; D Unsatisfied; E Very unsatisfied | Adapted from Davis et al. (1989), Bansal et al. (2016), Shin and Managi (2017), and Kaur and Rampersad (2018) |
| AVs reduce traffic congestion and improve travel efficiency. | ||||
| AVs reduce the burden of driving stress, such as lane change reminders and fixed speed cruise functions. Self-driving features free up hands and allow temporary checking of cell phone information. AVs reduce driving difficulties with self-parking and auto-following. | ||||
| Perceived ease of use | 9. In order to accurately evaluate the ease of use characteristics of AVs, which of the following options would be the most appropriate to choose? | |||
| Automatic driving function classification is reasonable. | ||||
| The operation process of AVs is simplified. | ||||
| The voice reminders of AVs are timely. | ||||
| The operation manuals of AVs are clearly explained. | ||||
| Behavioral attitudes | 10. In response to the convenience that AVs bring to you, what is your attitude toward high-level AVs? | A Strongly agree; B Agree; C Neutral attitude; D Disagree; E Strongly disagree | Adapted from Ajzen (1991), Gold et al. (2015), and Acheampong and Cugurullo (2019) | |
| 11. In response to recent news reports about accidents involving AVs, what is your attitude toward AVs? | ||||
| 12. Experts verified that human operation is the main cause of recent accidents involving AVs. According to your operating level, what is your attitude toward AVs? | ||||
| Subjective norms | 13. Please rate the following subjective normative factors that influence your use and purchase of AVs. Which of the following options would be the most appropriate to choose? | A Very large; B Large; C Average; D Small; E No effect | ||
| Financial subsidies and related policies. | ||||
| Media advertising and celebrity endorsement. | ||||
| The purchase and refusal behaviors of colleagues and others. | ||||
| Friend and family member attitudes and support. | ||||
| Perceived behavioral control | 14. Suppose you have been using an AV for more than a year, and today you are driving to an unfamiliar city, using highways and city roads, and the weather is cloudy and rainy. Which score evaluates your ability to operate an automated driving system? | A 1 points; B 2 points; C 3 points; D 4 points; E 5 points | ||
| 15. If you have a year’s driving experience with AVs, rate your ability to handle this situation when faced with a potential driving risk after you have transferred driving control to the automated driving system. | ||||
| 16. For autonomous driving levels or autonomous driving functions that you are not familiar with, please rate your possible ability to operate the system after reviewing the manual for the autonomous driving system, based on your existing driving experience. | A Bold use; B Exploratory use; C Unable to judge; D Afraid to use; E Refuse to use | |||
| HMRP | 17. If an AV is involved in an accident, which safety hazards do you think may have caused the accident? | A Human operation safety hazards; B Road environment safety hazards; C Vehicle system safety hazards; D Pedestrian interference; E Other safety hazards | Self-developed | |
| 18. Currently, the technology level of AVs is increasing, and self-driving assistance functions are evolving. In this complex travel environment, which option expresses your idea of using an autonomous car in order to ensure safe travel? | A Choose AVs with high technology levels for travel; B Choose AVs with high technology levels and diverse functions for travel; C Choose to travel with AVs with diverse functions; D Choose an autonomous vehicle with diversified functions belonging to the same technical level; E After handing over control of the vehicle, decisions are made by the autonomous driving system without considering the technology and functions | |||
| 19. For familiar driving vehicles, after the driver hands over control to the auxiliary driving system, which of the following options would be the most appropriate to choose? | A 1 points; B 2 points; C 3 points; D 4 points; E 5 points | |||
| Drivers handing over driving control early or late. | ||||
| The driver and the auxiliary system control vehicle operations at the same time. | ||||
| In autonomous driving mode, the system continues to control the operation of the vehicle in the event of a decision conflict between the driver and the automated driving system. | ||||
| Drivers no longer pay attention to the state of the road after handing over control because there is system judgment. | ||||
| Behavioral Intentions | 20. According to your needs, what is your intention to use and purchase a high-level AV? | A Willing to use; B Use; C Indecisive; D Don’t use it; E Never use | Adapted from Gold et al. (2015) | |
| 21. After hearing news of traffic accidents, do you plan to use or buy an autonomous vehicle with L3 level or higher. | A Willing to buy; B Buy; C Hesitant; D Don’t buy but use; E Don’t buy, don’t use | |||
| 22. If you take formal training for an AV and improve your control ability through regular test rides, what is your intention to use and purchase a high-level AV? | A Willing to buy; B Buy; C Hesitant; D Don’t buy but use; E Don’t buy, don’t use | |||
| Part III | User experience | 23. Based on the user experience, suppose you are using the latest Level 3 AV. Which of the following options would be the most appropriate to choose? Rainy day highway travel scenario. | A Autofollow; B Automatic lane change; C Fixed speed cruise control; D Automatic parking; E Deceleration and braking | Self-developed |
| On the way home after the weekend outing. | ||||
| Parking on the road. | ||||
| Traffic jams occur on urban roads when commuting on the working days. | ||||
| 24. Based on the user experience, which of the following options would be the most appropriate to choose? | A Picture 1; B Picture 2; C Picture 3; D Picture 4; E Picture 5 | |||
| City roads to work | ||||
| Expressway | ||||
| Suburban roads | ||||
| Parking lot parking | ||||
| Bad weather | ||||
| Perceived behavioral control | 25. After a test drive and professional training, please rate how much you have improved your current handling of autopilot. Which score evaluates your ability to operate on autopilot? | A 1 points; B 2 points; C 3 points; D 4 points; E 5 points | ||
| Behavioral attitude | 26. After the user experience and professional training, your perception of AVs has changed. Which of the following options would be the most appropriate to choose? | A Strongly agree; B Agree; C Neutral attitude; D Disagree; E Strongly disagree | ||
| Behavioral intention | 27. After the user experience, your cognitive and maneuvering ability has improved. Which option appropriately expresses your thoughts about your intention to use and purchase an AV? | A Willing to buy; B Buy; C Hesitant; D Don’t buy but use; E Don’t buy, don’t use |
Data Availability Statement
Some or all data, models, or code that support the findings of this study are available from the corresponding author upon reasonable request.
Acknowledgments
The authors are grateful to Dr. Chen and teachers who gave help and advice. In addition, we also thank editors and anonymous reviewers for their helpful suggestions on early versions of this manuscript.
References
AAA (American Automobile Association). 2018. “Fact sheet vehicle technology survey—Phase IIIB.” Accessed February 12, 2019. https://publicaffairsresources.aaa.biz/download/10980/.
AAA (American Automobile Association). 2019. “Three in four Americans remain afraid of fully self-driving vehicles.” Accessed December 18, 2020. https://newsroom.aaa.com/2019/03/americans-fear-self-driving-cars-survey/.
Acheampong, R. A., and F. Cugurullo. 2019. “Capturing the behavioural determinants behind the adoption of autonomous vehicles: Conceptual frameworks and measurement models to predict public transport, sharing and ownership trends of self-driving cars.” Transp. Res. Part F Traffic Psychol. Behav. 62 (Apr): 349–375. https://doi.org/10.1016/j.trf.2019.01.009.
Ajzen, I. 1991. “The theory of planned behavior.” Organ. Behav. Hum. Decis. Process. 50 (2): 179–211. https://doi.org/10.1016/0749-5978(91)90020-T.
Bansal, P., K. M. Kockelman, and A. Singh. 2016. “Assessing public opinions of and interest in new vehicle technologies: An Austin perspective.” Transp. Res. Part C Emerging Technol. 67 (Jun): 1–14. https://doi.org/10.1016/j.trc.2016.01.019.
Buckley, L., S. A. Kaye, and A. K. Pradhan. 2018. “Psychosocial factors associated with intended use of automated vehicles: A simulated driving study.” Accid. Anal. Prev. 115 (Jun): 202. https://doi.org/10.1016/j.aap.2018.03.021.
Chikaraishi, M., D. Khan, B. Yasuda, and A. Fujiwara. 2020. “Risk perception and social acceptability of autonomous vehicles: A case study in Hiroshima, Japan.” Transp. Policy 98 (Nov): 105–115. https://doi.org/10.1016/j.tranpol.2020.05.014.
Davis, F. D., R. P. Bagozzi, and P. R. Warshaw. 1989. “User acceptance of computer technology: A comparison of two theoretical models.” Manage. Sci. 35 (8): 982–1003. https://doi.org/10.1287/mnsc.35.8.982.
Deng, M., Y. Guo, R. Fu, and C. Wang. 2020. “Factors influencing the user acceptance of automated vehicles based on vehicle-road collaboration.” IEEE Access 8 (Jul): 134151–134160. https://doi.org/134151-134160.10.1109/ACCESS.2020.3011033.
Detjen, H., S. Faltaous, B. Pfleging, S. Geisler, and S. Schneegass. 2021. “How to increase automated vehicles’ acceptance through in-vehicle interaction design: A review.” Int. J. Hum.-Comput. Interact. 37 (4): 308–330. https://doi.org/10.1080/10447318.2020.1860517.
Fornell, C., and D. F. Larcker. 1981. “Evaluating structural equation models with unobservable variables and measurement error.” J. Marketing Res. 18 (1): 39–50. https://doi.org/10.1177/002224378101800104.
Gkartzonikas, C., and K. Gkritza. 2019. “What have we learned? A review of stated preference and choice studies on autonomous vehicles.” Transp. Res. Part C Emerging Technol. 98 (Jan): 323–337. https://doi.org/10.1016/j.trc.2018.12.003.
Gmw (Guangming Web). 2020. “A total of 80.1 million defective vehicles have been recalled in China, and a number of new recall regulations are coming soon.” Accessed December 10, 2020. https://m.gmw.cn/baijia/2020-10/26/1301722094.html.
Gold, C., M. Körber, C. Hohenberger, D. Lechner, and K. Bengler. 2015. “Trust in automation–before and after the experience of take-over scenarios in a highly automated vehicle.” Procedia Manuf. 3 (7): 3025–3032. https://doi.org/10.1016/j.promfg.2015.07.847.
Grafke, T., and E. Vanden-Eijnden. 2019. “Numerical computation of rare events via large deviation theory.” Chaos: Interdiscipl. J. Nonlinear Sci. 29 (6): 063118. https://doi.org/10.1063/1.5084025.
Gunawan, I., A. A. N. P. Redi, A. A. Santosa, M. F. N. Maghfiroh, A. H. Pandyaswargo, and A. C. Kurniawan. 2022. “Determinants of customer intentions to use electric vehicle in Indonesia: An integrated model analysis.” Sustainability 14 (4): 1972. https://doi.org/10.3390/su14041972.
Ha, T., S. Kim, D. Seo, and S. Lee. 2020. “Effects of explanation types and perceived risk on trust in autonomous vehicles.” Transp. Res. Part F Traffic Psychol. Behav. 73 (Aug): 271–280. https://doi.org/10.1016/j.trf.2020.06.021.
Hair, J. F., R. E. Anderson, R. L. Tatham, and W. C. Black. 1998. Multivariate data analysis. 5th ed. Hoboken, NJ: Prentice-Hall.
Hegner, S. M., A. D. Beldad, and G. J. Brunswick. 2019. “In automatic we trust: Investigating the Impact of trust, control, personality characteristics, and extrinsic and intrinsic motivations on the acceptance of autonomous vehicles.” Int. J. Hum.-Comput. Interact. 35 (4): 1–12. https://doi.org/10.1080/10447318.2019.1572353.
Hinz, O., T. Otter, and B. Skiera. 2020. “Estimating network effects in two-sided markets.” J. Manage. Inf. Syst. 37 (1): 12–38. https://doi.org/10.1080/07421222.2019.1705509.
Jung, S. J., and H. S. Kim. 2021. “A study on the intention of mobile delivery apps: Applying the technology acceptance model (tam).” Culinary Sci. Hospitality Res. 26 (12): 24–32. https://doi.org/10.20878/cshr.2020.26.12.003.
Kang, M., J. Song, and K. Hwang. 2020. “For preventative automated driving system (PADS): Traffic accident context analysis based on deep neural networks.” Electronics 9 (11): 1829. https://doi.org/10.3390/electronics9111829.
Karnouskos, S. 2021. “The role of utilitarianism, self-safety, and technology in the acceptance of self-driving cars.” Cognit. Technol. Work 23 (4): 659–667. https://doi.org/10.1007/s10111-020-00649-6.
Kaur, K., and G. Rampersad. 2018. “Trust in driverless cars: Investigating key factors influencing the adoption of driverless cars.” J. Eng. Tech. Manage. 48 (Apr–Jun): 87–96. https://doi.org/10.1016/j.jengtecman.2018.04.006.
Kuang, Y. P., J. L. Yang, and M. C. Abate. 2021. “Farmland transfer and agricultural economic growth nexus in China: Agricultural TFP intermediary effect perspective.” China Agric. Econ. Rev. 14 (1): 184–201. https://doi.org/10.1108/CAER-05-2020-0076.
Li, L., J. Gan, Z. Yi, X. Qu, and B. Ran. 2020. “Risk perception and the warning strategy based on safety potential field theory.” Accid. Anal. Prev. 148 (Dec): 105805. https://doi.org/10.1016/j.aap.2020.105805.
Lienert, P. 2018. “Most Americans wary of self-driving cars: Reuters/Ipsos poll.” Accessed February 16, 2019. https://www.reuters.com/article/us-autos-selfdriving-usapoll/most-americans-wary-of-self-driving-cars-reutersipsos-poll-idUSKBN1FI034.
Liu, P., R. Yang, and Z. Xu. 2019. “Public acceptance of fully automated driving: Effects of social trust and risk/benefit perceptions.” Risk Anal. 39 (2): 326–341. https://doi.org/10.1111/risa.13143.
Man, S. S., W. Xiong, F. Chang, and A. H. S. Chan. 2020. “Critical factors influencing acceptance of automated vehicles by Hong Kong drivers.” IEEE Access 8 (Jun): 109845–109856. https://doi.org/10.1109/ACCESS.2020.3001929.
Moody, J., N. Bailey, and J. Zhao. 2020. “Public perceptions of autonomous vehicle safety: An international comparison.” Saf. Sci. 121 (Jan): 634–650. https://doi.org/10.1016/j.ssci.2019.07.022.
Panagiotopoulos, I., and G. Dimitrakopoulos. 2018. “An empirical investigation on consumers’ intentions towards autonomous driving.” Transp. Res. Part C Emerging Technol. 95 (Oct): 773–784. https://doi.org/10.1016/j.trc.2018.08.013.
Pascale, M. T., D. Rodwell, P. Coughlan, S. A. Kaye, S. Demmel, S. G. Dehkordi, and S. Glaser. 2021. “Passengers’ acceptance and perceptions of risk while riding in an automated vehicle on open, public roads.” Transp. Res. Part F Traffic Psychol. Behav. 83 (Nov): 274–290. https://doi.org/10.1016/j.trf.2021.10.012.
Perello-March, J. R., C. G. Burns, S. A. Birrell, R. Woodman, and M. T. Elliott. 2022. “Physiological measures of risk perception in highly automated driving.” IEEE Trans. Intell. Transp. Syst. 23 (5): 4811–4822. https://doi.org/10.1109/TITS.2022.3146793.
Peterson, C. 2019. “Accommodation, prediction and replication: Model selection in scale construction.” Synthese 196 (10): 4329–4350. https://doi.org/10.1007/s11229-017-1660-0.
Rahman, M. M., M. F. Lesch, W. J. Horrey, and L. Strawderman. 2017. “Assessing the utility of TAM, TPB, and UTAUT for advanced driver assistance systems.” Accid. Anal. Prev. 108 (Nov): 361–373. https://doi.org/10.1016/j.aap.2017.09.011.
SAE (Society of Automotive Engineers). 2021. “SAE J3016: Taxonomy and definitions for terms related to driving automation systems for on-road motor vehicles.” Accessed August 12, 2021. https://saemobilus.sae.org/content/J3016_202104/.
Serang, S., R. Jacobucci, K. C. Brimhall, and K. J. Grimm. 2017. “Exploratory mediation analysis via regularization.” Struct. Eq. Model. Multidiscip. J. 24 (5): 733–744. https://doi.org/10.1080/10705511.2017.1311775.
Shalender, K., and N. Sharma. 2021. “Using extended theory of planned behaviour (TPB) to predict adoption intention of electric vehicles in India.” Environ. Dev. Sustainability 23 (4): 665–681. https://doi.org/10.1007/s10668-020-00602-7.
Sharma, I., and S. Mishra. 2020. “Modeling consumers’ likelihood to adopt autonomous vehicles based on their peer network.” Transp. Res. Part D Transp. Environ. 87 (Oct): 102509. https://doi.org/10.1016/j.trd.2020.102509.
Shin, K. J., and S. Managi. 2017. Consumer demand for fully automated driving technology: Evidence from Japan. Tokyo, Japan: RIETI.
Sinha, A., S. Chand, V. Vu, H. Chen, and V. Dixit. 2021. “Crash and disengagement data of autonomous vehicles on public roads in California.” Sci. Data 8 (1): 1–10. https://doi.org/10.1038/s41597-021-01083-7.
Sun, C., S. Zheng, Y. Ma, D. Chu, J. Yang, Y. Zhou, and T. Xu. 2021. “An active safety control method of collision avoidance for intelligent connected vehicle based on driving risk perception.” J. Intell. Manuf. 32 (5): 1249–1269. https://doi.org/10.1007/s10845-020-01605-x.
Talebian, A., and S. Mishra. 2018. “Predicting the adoption of connected autonomous vehicles: A new approach based on the theory of diffusion of innovations.” Transp. Res. Part C Emerging Technol. 95 (Oct): 363–380. https://doi.org/10.1016/j.trc.2018.06.005.
TAMPS (Traffic Administration of the Ministry of Public Security). 2021. Annual report on road traffic accident statistics. Wuxi City, China: Institute of Traffic Management Science, Ministry of Public Security.
Wood, N. D., D. C. Akloubou Gnonhosou, and J. W. Bowling. 2015. “Combining parallel and exploratory factor analysis in identifying relationship scales in secondary data.” Marriage Family Rev. 51 (5): 385–395. https://doi.org/10.1080/01494929.2015.1059785.
Zhang, T., D. Tao, X. Qu, X. Zhang, R. Lin, and W. Zhang. 2019. “The roles of initial trust and perceived risk in public’s acceptance of automated vehicles.” Transp. Res. Part C Emerging Technol. 98 (Jan): 207–220. https://doi.org/10.1016/j.trc.2018.11.018.
Zhang, T., W. Zeng, Y. Zhang, D. Tao, G. Li, and X. Qu. 2021. “What drives people to use automated vehicles? A meta-analytic review.” Accid. Anal. Prev. 159 (Sep): 106270. https://doi.org/10.1016/j.aap.2021.106270.
Zhou, F., Z. Zheng, J. Whitehead, S. Washington, R. K. Perrons, and L. Page. 2020. “Preference heterogeneity in mode choice for car-sharing and shared automated vehicles.” Transp. Res. Part A Policy Pract. 132 (Feb): 633–650. https://doi.org/10.1016/j.tra.2019.12.004.
Zoellick, J. C., A. Kuhlmey, L. Schenk, D. Schindel, and S. Blüher. 2019. “Amused, accepted, and used? Attitudes and emotions towards automated vehicles, their relationships, and predictive value for usage intention.” Transp. Res. Part F Traffic Psychol. Behav. 65 (Aug): 68–78. https://doi.org/10.1016/j.trf.2019.07.009.
Information & Authors
Information
Published In
Journal of Transportation Engineering, Part A: Systems
Volume 149 • Issue 1 • January 2023
Copyright
This work is made available under the terms of the Creative Commons Attribution 4.0 International license, https://creativecommons.org/licenses/by/4.0/.
History
Received: Dec 31, 2021
Accepted: Sep 2, 2022
Published online: Oct 31, 2022
Published in print: Jan 1, 2023
Discussion open until: Mar 31, 2023
Authors
Metrics & Citations
Metrics
Citations
Download citation
If you have the appropriate software installed, you can download article citation data to the citation manager of your choice. Simply select your manager software from the list below and click Download.