Robustness Quantification of Transit Infrastructure under Systemic Risks: A Hybrid Network–Analytics Approach for Resilience Planning
Publication: Journal of Transportation Engineering, Part A: Systems
Volume 148, Issue 10
Abstract
Disruptions due to either natural or anthropogenic hazards can significantly impact the operation of critical infrastructure networks (e.g., transportation systems) as they may instigate network-level (cascade) systemic risks, thus impacting the overall city resilience. Recent relevant studies demonstrated the need to quantify the resilience of city infrastructure networks following failures of one/some of their main components, considering both topological and operational network measures. Subsequently, focusing on robustness (a key resilience attribute) and on transit (a major critical infrastructure network), the current study develops a related quantification tool employing a hybrid approach that integrates complex network theoretic measures with data analytics, and specifically clustering and genetic algorithms. To demonstrate the practical utility of the developed tool, the robustness of the City of Minneapolis bus transit network is quantified under possible cascade failures represented by node (i.e., bus stop), link (i.e., route segment), and route failure scenarios. The robustness quantification of this transit network is facilitated by analyzing 43 topological and operational measures using a coupled map lattice model integrated with a direction-based passenger flow redistribution model. Absorptive capacity thresholds are subsequently identified under different passenger flow-to-route capacity ratios. Finally, the routes are categorized based on their influences on the network robustness using genetic algorithms coupled with clustering. The developed approach aims at providing a better understanding of transit systems pre- and postdisruptions by identifying key components that control the network robustness and subsequently devising reliable systemic risk management strategies and recovery plans. Such strategies and plans are expected to facilitate city resilience planning through management of cascade failure risks attributed to natural and anthropogenic hazard events.
Introduction
The city economy, security, public health, and safety are enabled by critical infrastructure networks (e.g., power, transportation, and water) that typically comprise multiple complex, interdependent, and dynamic (i.e., evolve with time) subsystems (Salama et al. 2020). Therefore, a disruption of a single subsystem (e.g., due to cyberattacks, natural hazards, operational incidents) may instigate network-level cascade risks, known as systemic risks (Ezzeldin and El-Dakhakhni 2019) that may hinder different human activities and cause significant economic losses. Among the different infrastructure networks, transit is the backbone of the city transportation system as it provides the basic mobility and accessibility services (Litman 2014), supports economy and urban expansion, induces transit-oriented developments, and plays a vital role in emergency responses and evacuation schemes during major incidents (Humphrey 2008).
Among the different public transportation modes (e.g., light rail, subway, commuter rail, rapid transit), transit networks are key in serving dense regions of the city (e.g., the downtown core) and for extending land use (Martin et al. 1998; Metropolitan Council 2009). For instance, in the United States, within 2019, the Minneapolis Metro transit agency served an average of 249,300 trips during the weekdays, with the urban local bus network contributing approximately 70% of this total number of served trips (APTA 2019). As such, disruptions to bus networks can cause a significant reduction in the overall transit system performance, thus impacting the reliability and quality of the service provided. Examples of recent disruptions that significantly influenced different urban transit networks in North America include (1) the 2020 demonstrations across the United States (e.g., in Minneapolis, Chicago, Miami, and Los Angeles) due to the death of George Floyd, which resulted in rerouting several bus lines, canceling hundreds of trips, reducing the bus frequency, interrupting and suspending the transit service for several days, and stranding thousands of commuters (Fox9 2020); and (2) the shutdown of the Toronto subway in 2020 due to a train derailment, which triggered massive disruptions at several bus stops causing a chaotic situation for the transit network in Toronto for nearly 4 h during the morning peak time. Such disruptions, as well as others not listed herein, have significantly impacted key components of urban transit networks (e.g., stations and routes) either directly or indirectly, and thus transit service. This situation highlights the critical need to quantify and enhance the resilience of urban local bus transit networks to natural and anthropogenic hazard-induced disruptions.
There is a lack of consensus on the definition of resilience within the transportation engineering field (Hosseini et al. 2016; Sun and Guan 2016; Haggag et al. 2020). However, according to the US Department of Transportation, resilience of transportation networks is defined as “the ability to anticipate, prepare for, adapt and absorb perturbation and withstand, respond to, and recover rapidly from disruptions” (FHWA 2012). Therefore, in transportation networks, resilience can be related to different operational measures, including hours of congestion, travel time index, traffic flow, and the optimal spare capacity (Hollnagel et al. 2008; Weilant et al. 2019). The spare capacity in turn can be further categorized into three different subcapacities (Hosseini and Barker 2016; Weilant et al. 2019): (1) absorptive capacity defined as the ability of a system to absorb and withstand the impacts and consequences of disruptive events; (2) adaptive capacity defined as the ability of a system to adapt in response to disruptions in order to maintain normal functions; and (3) restorative capacity defined as the ability of a system to quickly recover from and restore normal operations following disruptions (Norris et al. 2008; Turnquist and Vugrin 2013). Resilience can also be represented by its 4R attributes: robustness, rapidity, redundancy, and resourcefulness (Bruneau et al. 2003). Robustness measures the system’s ability to withstand the stress induced by sudden disruptions with minimal performance loss; redundancy is the ability of a system to meet the required functions during disruptions through alternatives to the out-of-service components; resourcefulness represents the capacity to mobilize resources to address priorities during disruptions; and, finally, rapidity reflects the timely rebound from the disrupted state to the (near) fully operational one. Note that the current study focuses only on the robustness measure of resilience in the context of transportation networks.
For a transportation network, when a single component (e.g., bus stop, route segment) becomes nonoperational, network passengers typically resort to other operational components, which can instigate a cascade failure scenario if such components reach their capacities. Robustness quantification can thus facilitate identifying the most critical components that can cause network-level collapse (i.e., posing systemic risks). Exploring such critical components, prior to a disruption, can facilitate developing effective risk mitigation strategies (e.g., rescheduling transit services and/or providing alternative travel routes for passengers) that can improve the network robustness, and thus its resilience to cascade failures. Therefore, several studies have attempted to relate the robustness to different operational measures in transportation networks. For example, Zhang and Miller-Hooks (2015) used the average travel time to identify vulnerable links and evaluate the reserve capacity in rapid transit networks. Cats and Jenelius (2015), Hosseini and Barker (2016), and Weilant et al. (2019) employed different capacity metrics and investigated their impacts on the robustness of transit networks. Numerous indices have been also suggested in other related studies, including the giant component size (Lordan et al. 2014; Jia et al. 2021), the average shortest path length (Yang et al. 2015; Hossain and Alam 2017), the number of transfer stations (Wang et al. 2017), the delays and travel time (De Los Santos et al. 2012), and the percentage of cancelled trips (Lusby et al. 2018). However, other studies (e.g., Derrible and Kennedy 2010; Abdelaty et al. 2020; Yassien et al. 2020; Alzoor et al. 2021) highlighted the importance of using indices that consider both operational and topological characteristics of the network in order to achieve more realistic and practical robustness representation. This is because the interplay between such network characteristics has been proven to control cascade failures and accelerate recovery following natural and anthropogenic hazards (Strogatz 2001; Boccaletti et al. 2006; Ezzeldin and El-Dakhakhni 2019). In this respect, the current study employs the fraction of active nodes (i.e., operating bus stops) as a robustness measure because it considers both the topological (i.e., node degree and strength) and operational (i.e., redistribution of the passenger flow on links) characteristics of transit networks during disruptions (i.e., over time), which is key for resilience planning.
Unlike simple graph theory (Guze 2019; Żochowska and Soczówka 2020) and GIS-based network analysis techniques (Inanloo et al. 2016; Yang et al. 2018), complex network theory (CNT) represents a computationally efficient alternative that provides a unique set of measures to simulate the aggregated temporal behavior of complex systems during disruptions (Derrible and Kennedy 2011; Barabási 2013). CNT is thus ideal for integration with network-specific simulation techniques for systemic risk and robustness quantification. Within CNT, networks are simulated as a set of nodes (i.e., representing the network components) connected by links (i.e., representing the interdependence between these components). CNT has been applied in earlier studies to investigate the robustness of a wide spectrum of transportation networks (including transit networks). Such studies evaluated the robustness of transportation networks either statically (e.g., Wang et al. 2011; Zou et al. 2013) or dynamically (Sullivan et al. 2010; Cats and Jenelius 2015; Huang et al. 2015; Nian et al. 2019).
Static robust assessment of transportation networks relies on investigating the topological characteristics of such networks with the assumption that the disruption of a single component (e.g., a stop or a route) does not trigger a redistribution of node demand throughout the network. In general, most previous studies (e.g., Zou et al. 2013; Ma et al. 2020) highlighted the limitation of such an assumption and recommended applying other sophisticated models in order to achieve realistic and practical results. Dynamic robustness assessment of transportation networks, in contrast, considers not only the network topology but also the redistribution of the passengers following the failure of some network components. Therefore, dynamic robustness assessment is preferred as it can be employed to evaluate the impact of triggering cascade failures to other components beyond those that failed initially. Various models have been developed to quantify the dynamic robustness of transportation networks. The coupled map lattice (CML) models, first introduced by Kaneko (1992) to model the spatiotemporal chaos and pattern formation in fluids, were adapted to simulate transportation networks considering cascade failures (Chazottes and Fernandez 2005; Huang et al. 2015; Sun et al. 2018). The basic assumption of the CML model is that the spatiotemporal chaotic failure is attributed to both the topology of the network and the redistribution of the link weights. Specifically, in the CML models, cascade failure simulation considers (1) the state, degree, and strength of nonoperational stops and their neighboring stops; and (2) the weights and capacities of links connected to such stops.
Research Gaps and Study Goal and Objectives
Despite adopting CML models within the transportation engineering field, most related studies simulated their underlying transit networks using undirected networks. Such a simulation approach can result in misleading conclusions as the ridership (e.g., passenger flow) may vary over directions, and centrality measures are significantly different between directed and undirected networks (White and Borgatti 1994; Barabási 2013). Only a few studies have applied the CML model to quantify the robustness of directed transit networks. In addition, only a limited number of studies investigated the robustness of transit networks under route failure scenarios. For example, Shen et al. (2019) developed a modified directed version of the CML model to assess the robustness of the Nanjing metro transit network. However, the cascade failure conducted in this study has been limited to node failure scenarios only. Zhang et al. (2019a) also investigated the impact of route failures in weighted bus transit networks considering the dynamic load redistribution and link prediction method. Although these previous studies facilitated analyzing dynamic cascade failures, link weights and capacities as well as directed centrality measures were not considered for critical routes, necessitating the need for further investigations to assess the robustness of directed transit networks based on different failure scenarios (i.e., nodes, links, and routes) and relating the robustness thresholds to operational transit measures through a practical mapping approach.
To address this research gap, the main objectives of the current study are to develop operationalizable tools to quantify the robustness of transit networks under systemic risks and subsequently identify the corresponding critical network routes through a novel hybrid approach that utilizes CNT, genetic algorithm (GA), and cluster analysis. The current study also investigates the influence of the absorptive capacity on the transit network robustness considering both its topological and operational characteristics under different disruption scenarios. The overarching goal of the study is to empower transit managers with the tools necessary for network resilience planning, considering the complexity of simulating interdependence-induced (cascade) disruptions.
To demonstrate the utility of the developed tools, the Minneapolis local bus transit network is investigated, where CNT is employed to extract the topological measures of the network, and a CML model is developed considering these measures. To facilitate analyzing the network robustness considering the route directions, a direction-based passenger flow redistribution model is integrated with the developed CML model. The robustness of the network is then quantified for different passenger flow-to-route capacity ratios under node, link, and route failure scenarios, and absorptive capacity thresholds are accordingly obtained. The robustness of the network under route failures is evaluated considering 43 different topological (e.g., closeness centrality of bus stops) and operational (e.g., number of bus stops) measures, and GA is then coupled with cluster analysis to identify and categorize critical routes based on key network measures. Specifically, the application of GA and clustering facilitates identifying the specific few metrics to use in order to accurately characterize critical routes under disruptions. Empowered by the results of the aforementioned analyses, transportation service providers and city officials can devise proactive systemic risk mitigation strategies for transit networks (e.g., developing adaptive transit schedules and managing the transit fleet by increasing the spare capacity on specific routes) when subjected to disruptive events; this is key to enhancing the overall resilience of city infrastructure systems.
Methods and Measures
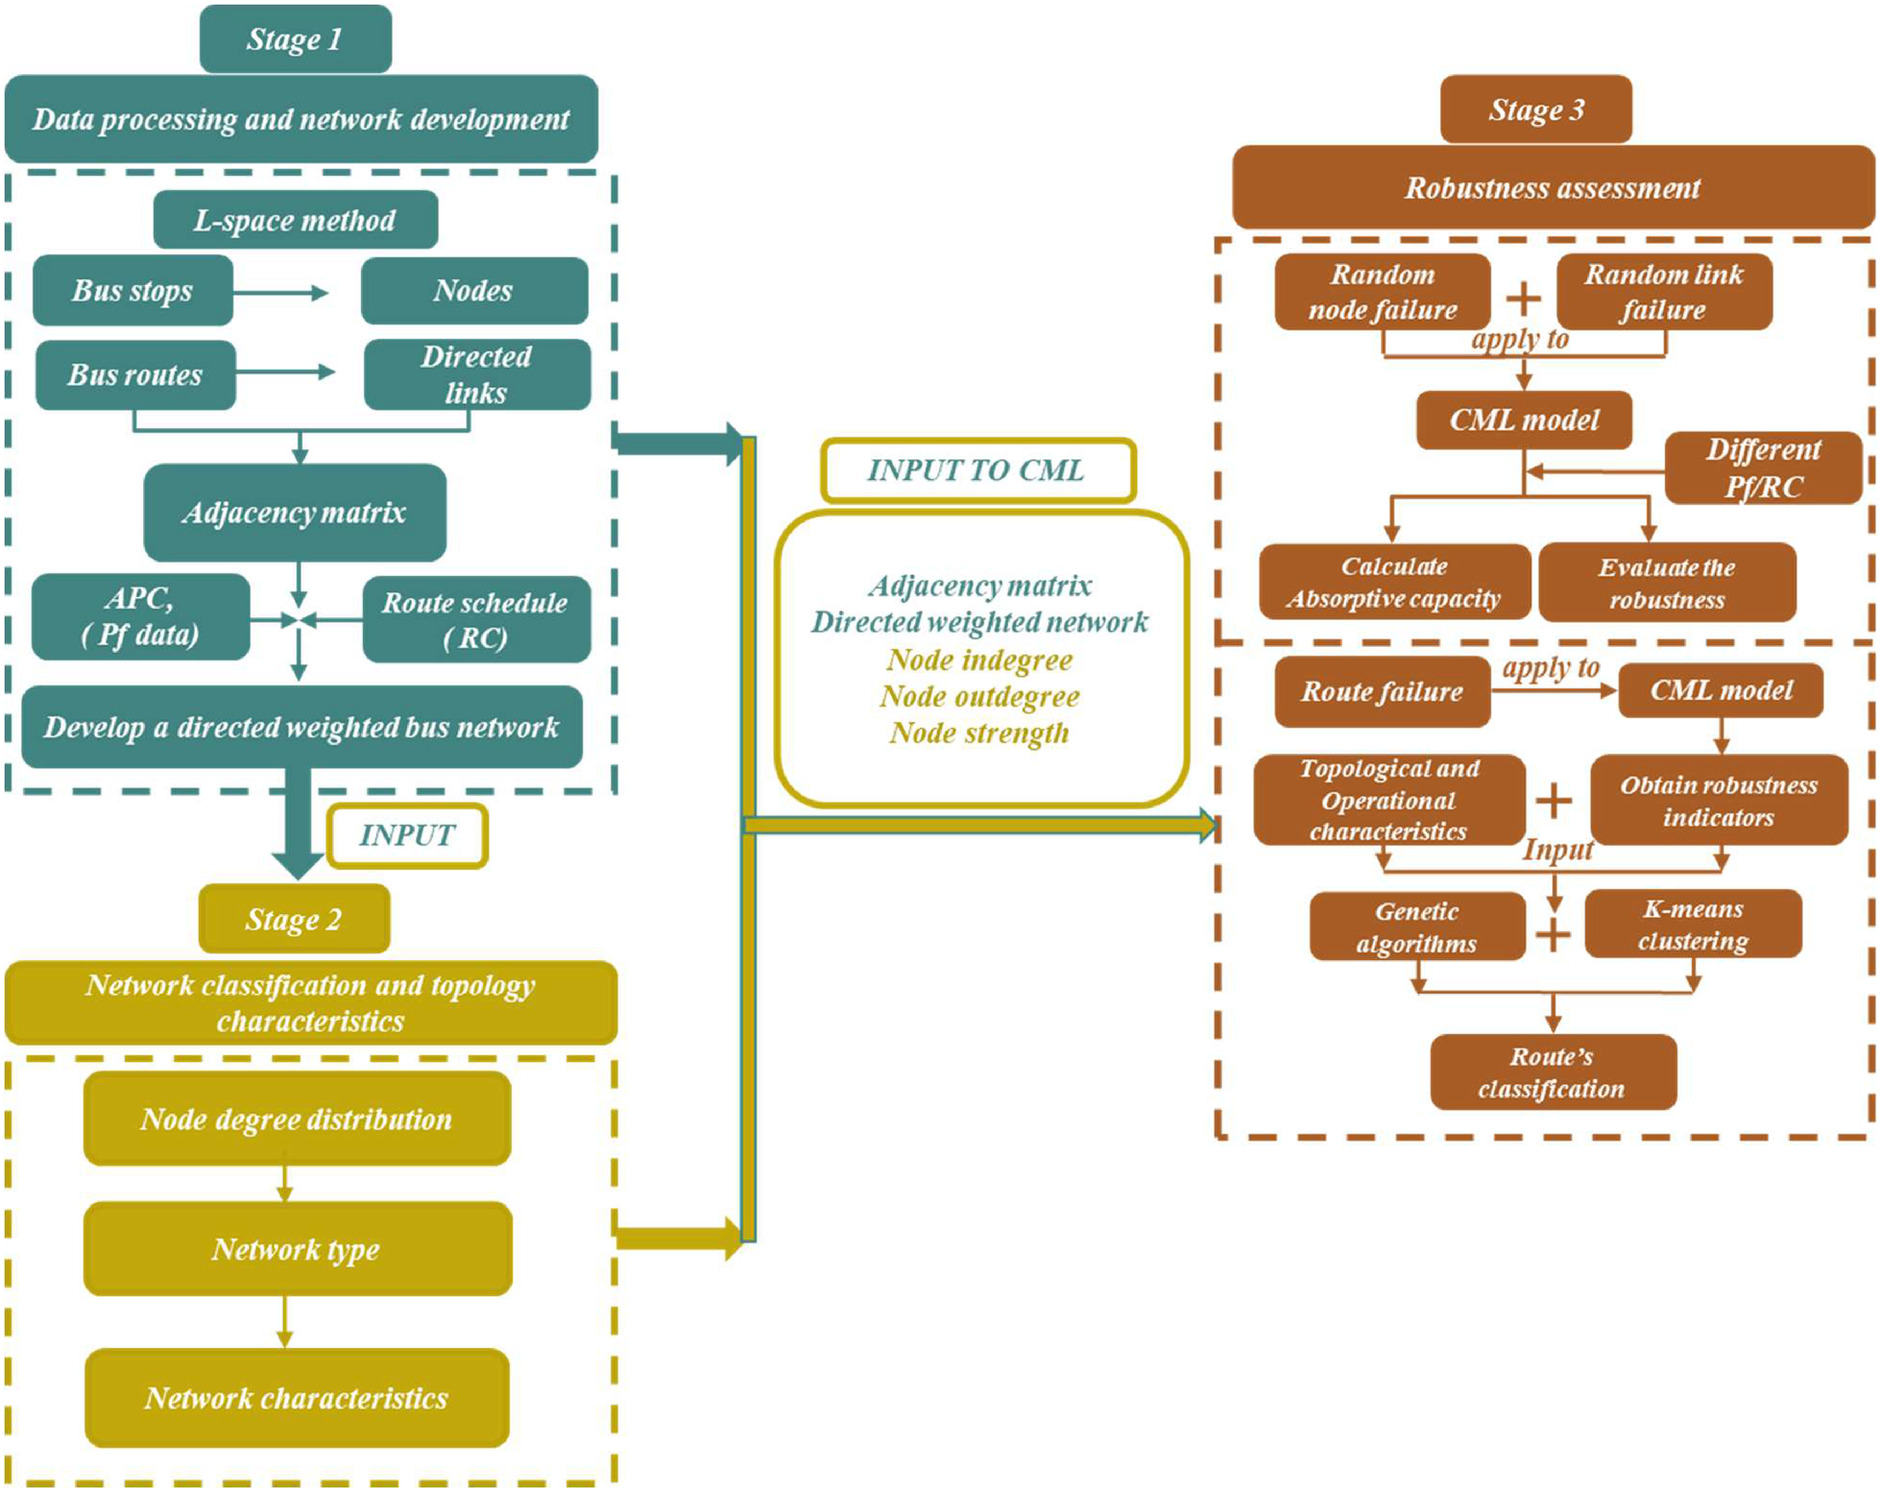
This section describes the hybrid approach used in the developed tool to assess the robustness of bus transit networks. The analysis within this tool is divided into three stages, as shown in Fig. 1. In Stage 1, the underlying network is simulated using the CNT, where bus stops and route segments are represented by nodes and links, respectively, and the passenger flow and route capacities are then assigned to each link based on automated passenger count (APC) data. In Stage 2, the network classification and topological characteristics are evaluated using several CNT-based measures (i.e., node in-degree, out-degree, and strength). In Stage 3, the network robustness is assessed under systemic risks using a directed CML model that considers the redistribution of passenger flow due to the failure of the different network components (i.e., nodes and links). The inputs of the directed CML model in Stage 3 are (1) the transit network topology (from Stage 1); and (2) the node in-degree, out-degree, and strength, in addition to the passenger flow (from Stage 2). The network robustness is also investigated under different passenger flow to route capacity ratios and the corresponding absorptive capacity thresholds are identified. Finally, binary GA and clustering are applied to categorize the network routes based on both their failure impacts on the network and their operational and topological characteristics.
Complex Network Theoretic Measures
Disruptions to bus stops/routes can cause significant changes in the network topological characteristics such as the degree centrality (), degree distribution (), and node strength (). The degree centrality, , is defined as the total number of links connected directly to node . In transit networks, the degree centrality represents the number of route segments originated from or directed towards a specific stop along a route, and can thus reflect the stop size (e.g., terminals or stations) within the network. In directed networks, this measure is calculated as the summation of the outward, , and inward, , links connected directly to node , where and are calculated as follows (Opsahl et al. 2010; Barabási 2016):where and = elements of the adjacency matrix representing the network given that and ; is the start stop (source node); is the end stop (all other nodes connected to the source node); and = total number of nodes in the network. Note that is equal to 1 when nodes and are directly connected and is equal to zero elsewhere.
(1)
(2)
The degree distribution, , represents the percentage of nodes with a degree , and is calculated in directed networks as the fraction of nodes with () and the fraction of nodes with () (Albert and Barabási 2002). In transit networks, the degree distribution represents the fraction of stops connected to a specific number of route segments and can then indicate the frequency of stop types (e.g., terminals or stations) within the network. and are evaluated based on the number of nodes with () and the number of nodes with (), respectively (Albert and Barabási 2002) as
(3)
(4)
The node strength, , represents the total passenger flow over the route segments that are connected to stop (Sun et al. 2018), and can thus be used to reflect the passenger circulation (i.e., number of passengers transferred to/from a stop) at each stop along a route. is evaluated as (Sun et al. 2018)where = number of nodes connected to node ; and and = sectional passenger flows (i.e., the number of passengers transferred by bus between stops and ) on the links connected to node . Such links are assigned directions based on the sequence of the stops along the routes. It should be highlighted when a transit network is represented by a directed network, can be partitioned into out-strength () and in-strength () to reflect the passenger circulation from and to stop , respectively.
(5)
Coupled Map Lattice Model
The modified CML model developed by Huang et al. (2015) is applied in the current study to investigate the cascading failure within a weighted, directed urban local bus transit network. In this model, the passenger flow redistribution is modified to match the characteristics of a directed network, where the state of node () is updated over time () according towhere = local dynamic chaotic behavior of the node at time ; = topological coupling coefficient; = flow coupling coefficient; = hourly sectional passenger flow () between nodes and ; and = external perturbation severity that reflects the effect and magnitude of the failure that may occur. Larger values correspond to failures with higher impacts, which seldom occur (Xu and Wang 2005; Huang et al. 2015; Sun et al. 2018). The and also typically ranges between 0 and 1 and their summation should be less than 1 (Huang et al. 2015; Sun et al. 2018).
(6)
In the current study, the application of the modified CML model is started by assigning each node a random value between 0 and 1, where higher values reflect worse transportation conditions (Shen et al. 2019). A logistic chaotic map of [] is then used to evaluate the corresponding dynamic behavior pattern of nodes (Sun et al. 2018; Shen et al. 2019). An value of 1 is subsequently assigned to failed nodes to enable investigating the network robustness under failures with minimal impacts (Sun et al. 2018), and and values are assumed to be constant and equal to 0.25 (Huang et al. 2015). Note that if both and are within the open interval] 0,1 [and , the network keeps a permanent normal state. In contrast, if a node/link fails at , additional passenger flow is produced and redistributed over downstream connections. A cascade failure scenario may consequently occur if the redistributed passenger flow results in violating the route capacity ().
Failure Scenarios
In the current study, the network robustness is quantified when its main components become nonoperational due to different failure scenarios. Specifically, the study initially investigates the network robustness under the random failure of a single component (i.e., a node or link), which occurs frequently due to minor road accidents or severe weather conditions. The network robustness is also evaluated under random route failure scenarios, which may occur due to major incidents such as floods or snowstorms.
Node and Link Failures
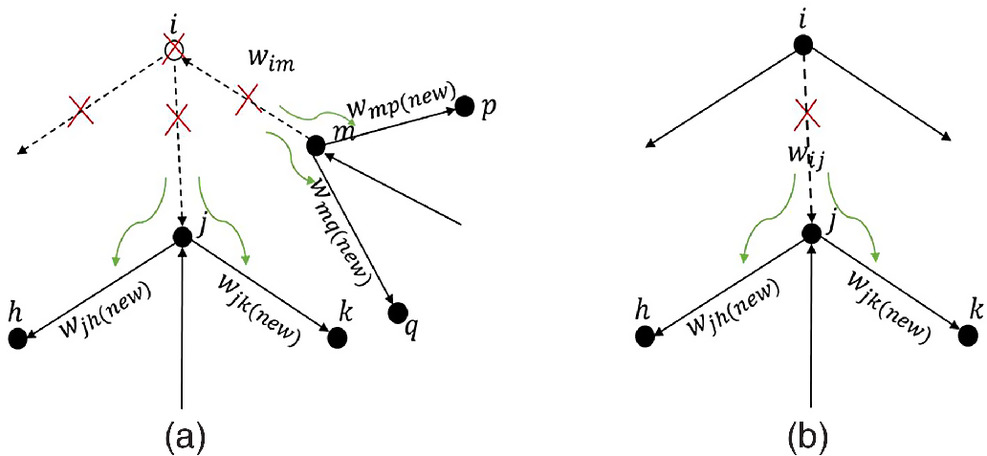
In the current study, a node (i.e., stop) fails when the passengers cannot be transferred by bus from (or to) this stop due to any disruption. In such cases, buses served by failed nodes (i.e., nonoperational stops) would deviate to adjacent streets to continue serving passengers along the intended routes. However, the details of these rerouting procedures are not considered in this study due to data restrictions. Instead, when node fails at time , this node and its associated links are removed from the network during the subsequent time steps. As shown in Fig. 2(a), the weight of the removed links is then redistributed over the downstream links (i.e., located within a walkable distance) using Eq. (7)
(7)
The in-degree, out-degree, and strength of the network nodes are subsequently updated according to Eqs. (3)–(5), respectively. Using such node parameters together with the updated values, the state of all the nodes is re-evaluated using the CML model presented in Eq. (6). Additional links may thus fail due to the weight redistribution process when their updated ratios are larger than 1.0, and they are in turn removed from the network. Subsequent rounds of redistribution are applied that can trigger cascade failures. Note that both the network topology and link weights are updated during the same time step and prior to the following ones. The pseudocode for the node failure scenario is presented in Algorithm 1.
A link failure occurs when passengers cannot be transferred by bus between stops (nodes) and . Similar to the node failure scenario, buses served by failed links are assumed to move through adjacent streets to continue serving passengers along the intended routes. However, as mentioned earlier, the details of the rerouting procedures are not considered in the current study due to data restrictions. When a link fails at time , its weight () is transferred to the destination node and subsequently distributed over the connected active (operating) links using Eq. (7), as shown in Fig. 2(b). Similar to the node failure scenario, the degree and strength of the network nodes are updated according to Eqs. (3)–(5), and are subsequently used together with the new values (i.e., updated link weights) to calculate the temporal node state (i.e., ) based on Eq. (6). The weight redistribution process continues (cascade failure occurs) when the value of of any node exceeds 1.0 or when the ratio of any link is larger than 1.0. The pseudocode for the link failure scenario is presented in Algorithm 2.
Under random node and link failure scenarios, a node/link is selected randomly to initiate the failure, and the fraction of active nodes () (i.e., the fraction of nodes with ) is used to represent the network robustness. A single value of is then estimated for each failure scenario (i.e., considering the cascade effect). As the network robustness typically decreases with the increasing number of inactive nodes/links, critical thresholds, and , are defined to indicate the fraction of inactive nodes and links, respectively, that minimize . Note that the values of and depend on the average across the network. A sensitivity analysis is therefore essential to investigate the impact of variability (which represents the disruptions to bus frequency or demand over the network) on the values of and as well as the network robustness. A network absorptive capacity can be subsequently quantified as the average ratio (as suggested by Weilant et al. 2019) at which the network can withstand minor changes in and values under node and link failure scenarios, respectively.
Route Failure
Route failures are simulated in the current study based on two distinct scenarios: (1) all stops along the route are assumed to be completely nonfunctional, or (2) all segments along the route become nonoperational. In the first scenario, stops on the failed routes are completely removed from the network. Accordingly, links (i.e., bus route segments) directed inward to or outward from such stops are also removed from the network. Subsequently, the network robustness is evaluated based on both the percentage of failed nodes () and the route failure impact ratio (RFIR), where the latter represents the ratio between the number of failed nodes () along the route and the total number of nodes () along the same route. In the second scenario, links along the failed routes are completely removed from the network, albeit without removing stops connecting such links. The network robustness is subsequently quantified using the percentage of failed links (). Note that during both scenarios a bus route cannot serve a specific bus line and is thus fully disconnected from other routes.
Genetic Algorithm and Cluster Analyses
Cluster analysis is typically used to group observations, in an unsupervised manner, based on their shared similarities. The clustering is widely used for such a purpose (Likas et al. 2003; Zhang et al. 2019b); however, it requires a prior definition of the number of clusters (). A range of values is therefore assumed when clustering is applied, and the performances of the resulting models are assessed. The percentage of variance explained is the typical measure of the model performance and can be implicitly expressed through several alternatives (e.g., within cluster sum of squares, silhouette score) (Pandit and Gupta 2011).
In the current study, clustering was applied to categorize transit routes based on their criticality (i.e., their impacts on the network robustness under disruptions) and their main characterizing attributes are identified accordingly. Due to the large number of measures specific to the network topology, operation, and robustness, a feature selection approach should be applied. The current study thus integrates clustering with GA to identify the most significant important measures for categorizing network routes. The GA is used to identify the optimum set of measures for each predefined cluster model and the process is repeated iteratively (i.e., by employing different values) to identify the optimal variable set that maximizes the percentage of variance explained (). The values were thus varied between 2 and 30, with the upper limit selected to ensure the homogeneity of the resulting clusters (i.e., the clusters include a similar number of observations). The GA-based clustering can be formulated aswhere ; = within cluster sum of squared distance; and = sum of squared distance between observation pairs (Jones and Harris 1999). As the optimum variable set may differ based on the value, the frequency of including a specific variable in the optimum set is used to reflect its importance for clustering the network routes. Subsequently, the optimum value of and the optimum variable set were chosen based on assessing the performance of the optimal solution over the different values. It should be highlighted that, when GA is used to select the optimal features for clustering, decision variables of the optimization problem are represented by a binary vector where a value of 1 is used to indicate that a specific feature is included for clustering, while a value of 0 is used to indicate that the feature is not included. For example, a vector of the decision variables in the form of [1 0 1 0 0 0 0 … 0 1] indicates that the first, third, and last features will be included for clustering, while all other features will not be included.
(8)
Demonstration Application
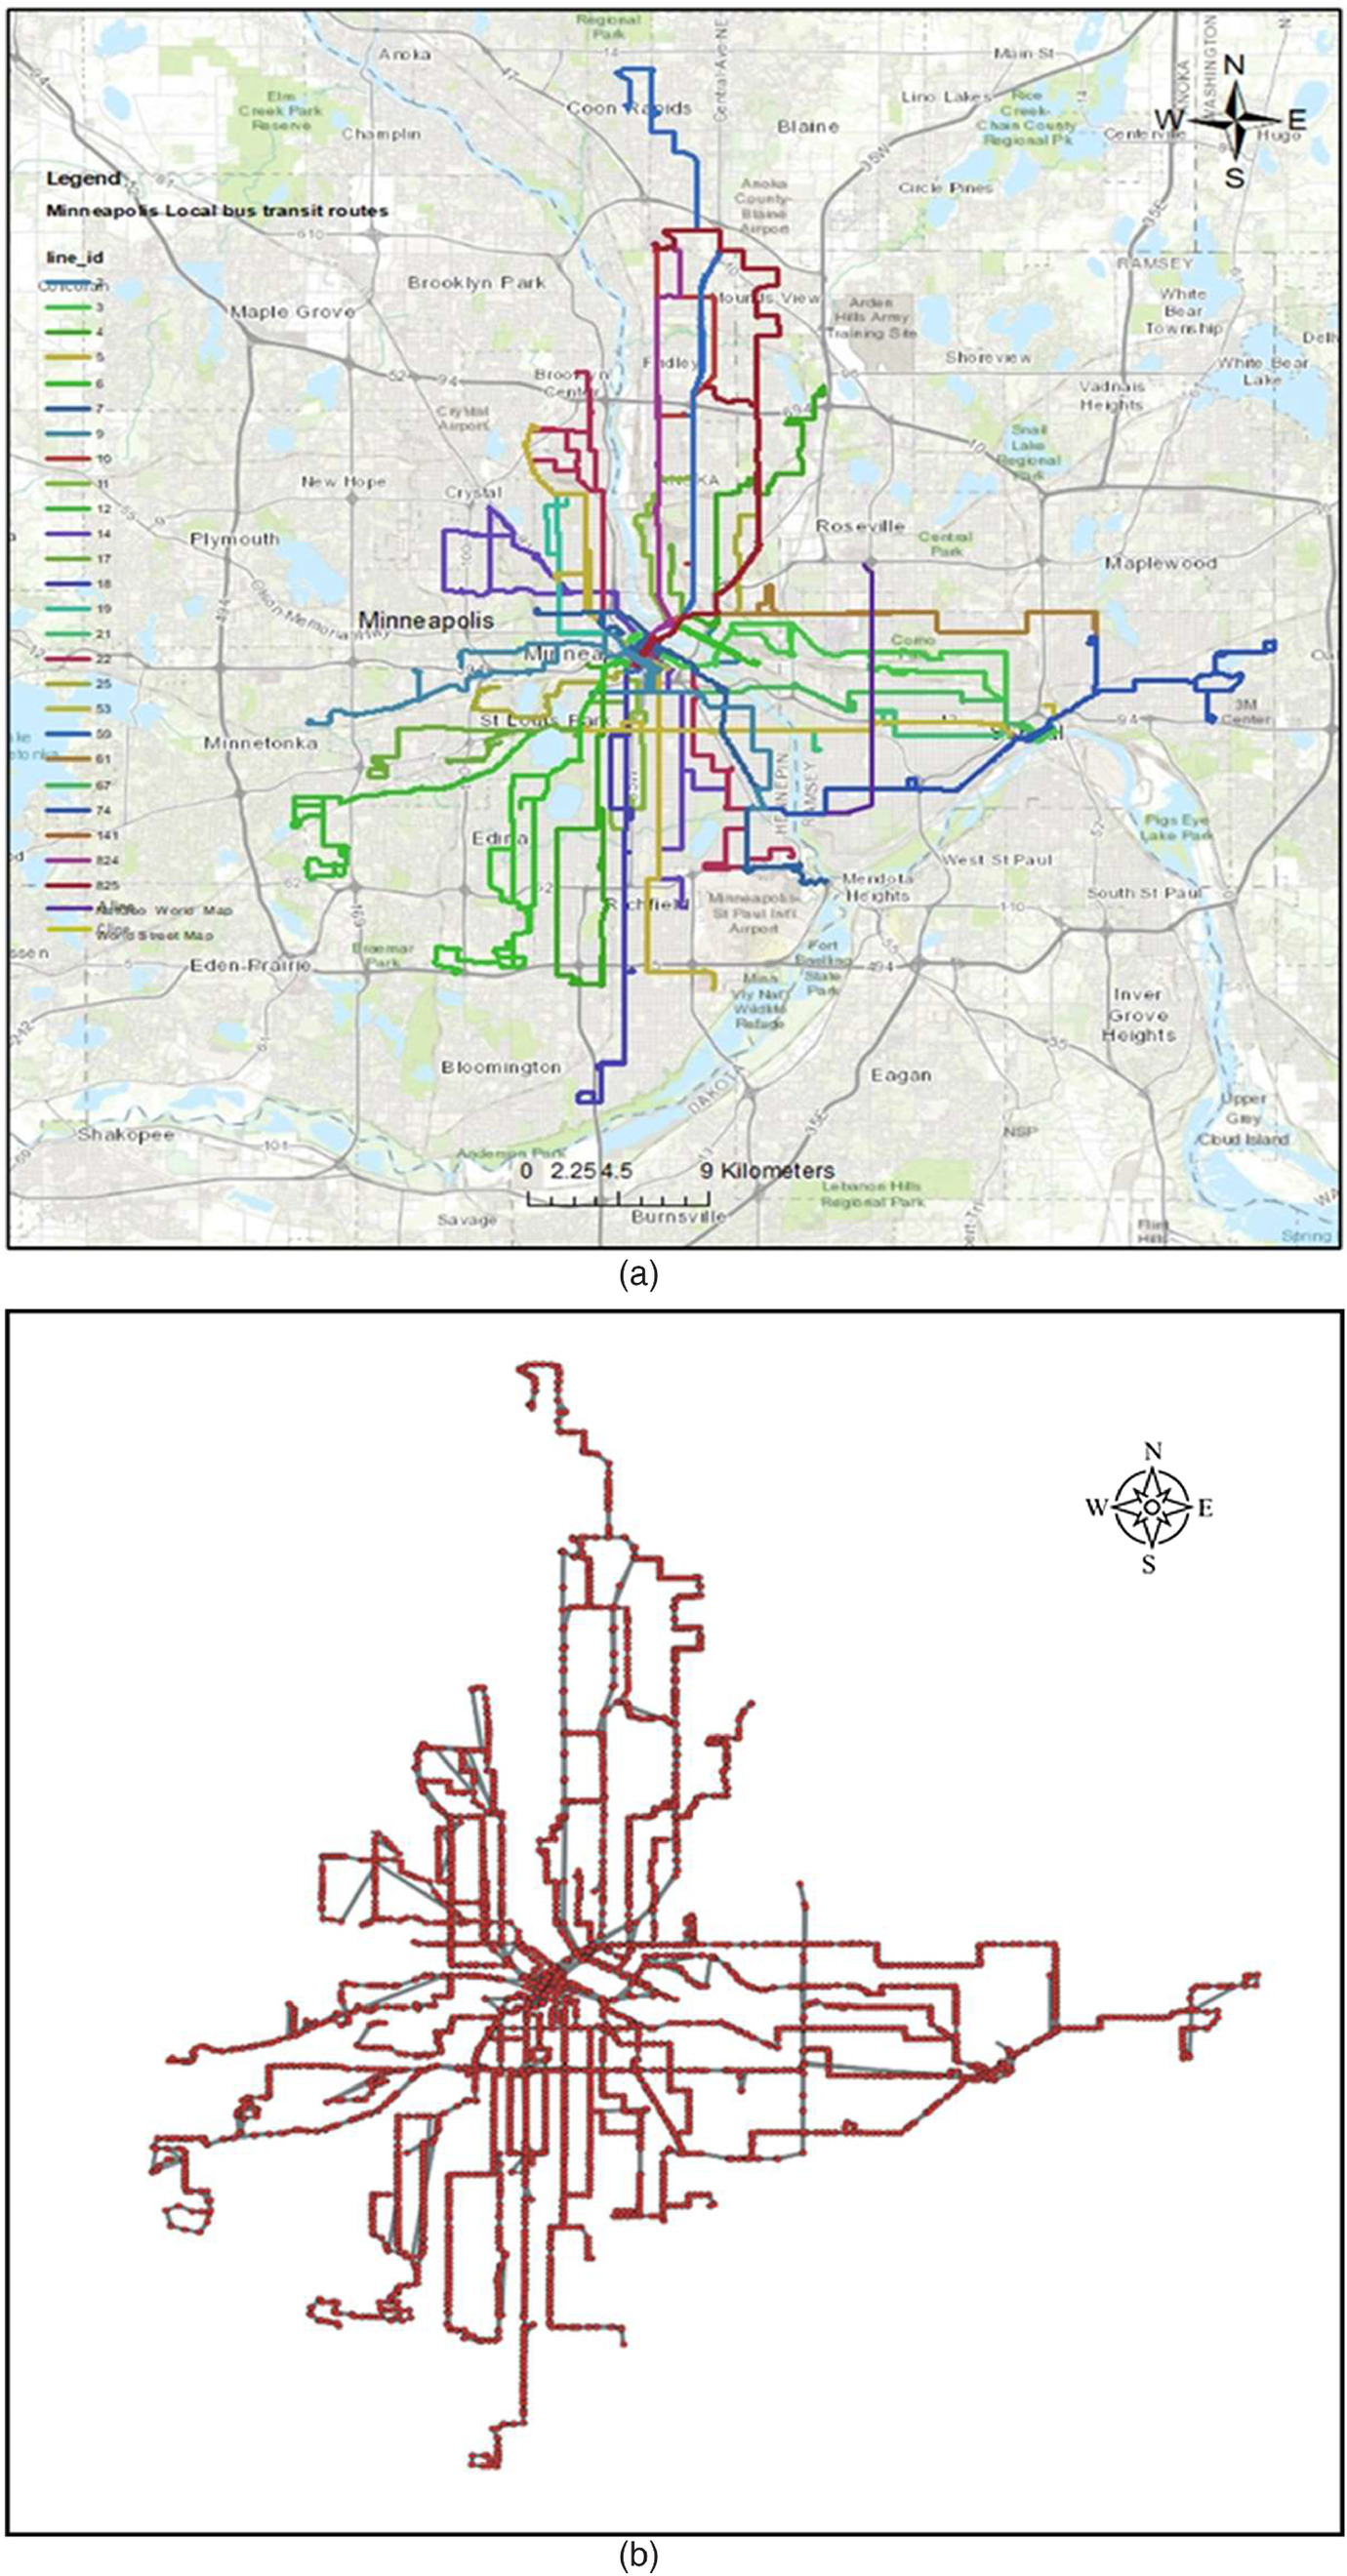
In the current study, the Minneapolis local bus transit network was utilized as a demonstration for the application of the developed robustness assessment tool. Minneapolis is the largest and most populous city in the state of Minnesota (US Census Bureau 2019). The transportation system in the city is characterized by a highly connected urban multimodal transit network that serves numerous attractions, destinations, and other critical facilities such as universities, hospitals, public schools, and recreational and shopping centers (Minneapolis City Council 2019). The transit network serves an average of 249,300 passengers per day, with the local bus transit networks contain 27 routes [Fig. 3(a)] and serve around 68% of the daily demands (Metropolitan Council 2019).
Data Description and Processing
The automated passenger count (APC) dataset of the network is provided by the Metro Transit Agency under the Metropolitan Council Agreement (Minnesota Geospatial Information Office 2019). The APC dataset is filtered by excluding the days of extreme weather, unusual events, and abnormal travel patterns. Note that, within the APC dataset, the total boarding and alighting are unequal for different bus stops, routes, and provider levels. Therefore, the boarding and alighting volumes were balanced in the current study following the method described by Lu (2008) and Boyle (2009) through two stages: (1) the variation between the total boarding (ons) and the total alighting (offs) along the routes has been calculated (i.e., between 0.8 and 1.1) and compared to the allowable thresholds (i.e., between 0.7 and 1.3) according to the TCRP synthesis 77 guidelines (Boyle 2009); and (2) ons and offs are balanced based on factoring the average method such that negative loading errors of the cumulative passenger flow are avoided (i.e., correcting negative loads). Note that other methods can be used to balance boarding-alighting errors such as factor into the higher count (Lan 2015) and pseudostop (Furth et al. 2006). However, factoring the average method was utilized in the current study as Lu (2008) highlighted that the three methods typically yield similar balanced trips. The transit time-of-day analysis is then performed to convert the total average daily passenger flow into a peak hourly flow, which was subsequently used as link weights. Because the peak hour flow determines the required size of the transit fleet, the transit time-of-day analysis was performed based on a conversion factor of 0.14 [according to the TRB-National Highway research program (Martin et al. 1998)] in order to convert the total average daily passenger flow (i.e., available within the dataset) to peak hour flow for all purpose transit trips.
Network Development
The topological configuration of transit networks can be defined through a space of changes (Kurant and Thiran 2006), a space of routes (Xu et al. 2007; Zhang et al. 2019b), or a space of stops (Kurant and Thiran 2006; Xu et al. 2007). The current study adopts the latter configuration as it captures the passenger flow variability over route segments as well as the operating frequency and capacity of bus transit routes (Zhang et al. 2018). In this configuration, bus stops are represented by nodes, while links simulate either the physical or operational connections between these stops. Accordingly, the Minneapolis local bus transit network is conceptualized as a weighted, directed network of 4,339 nodes and 4,664 links, as shown in Fig. 3(b).
Result Analyses
This section demonstrates the topological characteristics and cascade failure analysis results of the network, with the topological characteristics of the network are initially examined based on various centrality measures. The CML model is subsequently used to obtain the dynamic robustness of the network based on random node, link, and route failure scenarios that represent different disruptions to bus transit components, as discussed earlier. Such disruptions may induce additional demands, thus impacting transit stops, roadway sections, or transit corridors (Bureau of Transportation Statistics 2018). The network robustness towards route failures is quantified considering various centrality and operational measures. A sensitivity analysis is also conducted to evaluate the impact of ratio variations on the failure thresholds, and the corresponding absorptive capacities are obtained.
Topological Characteristics
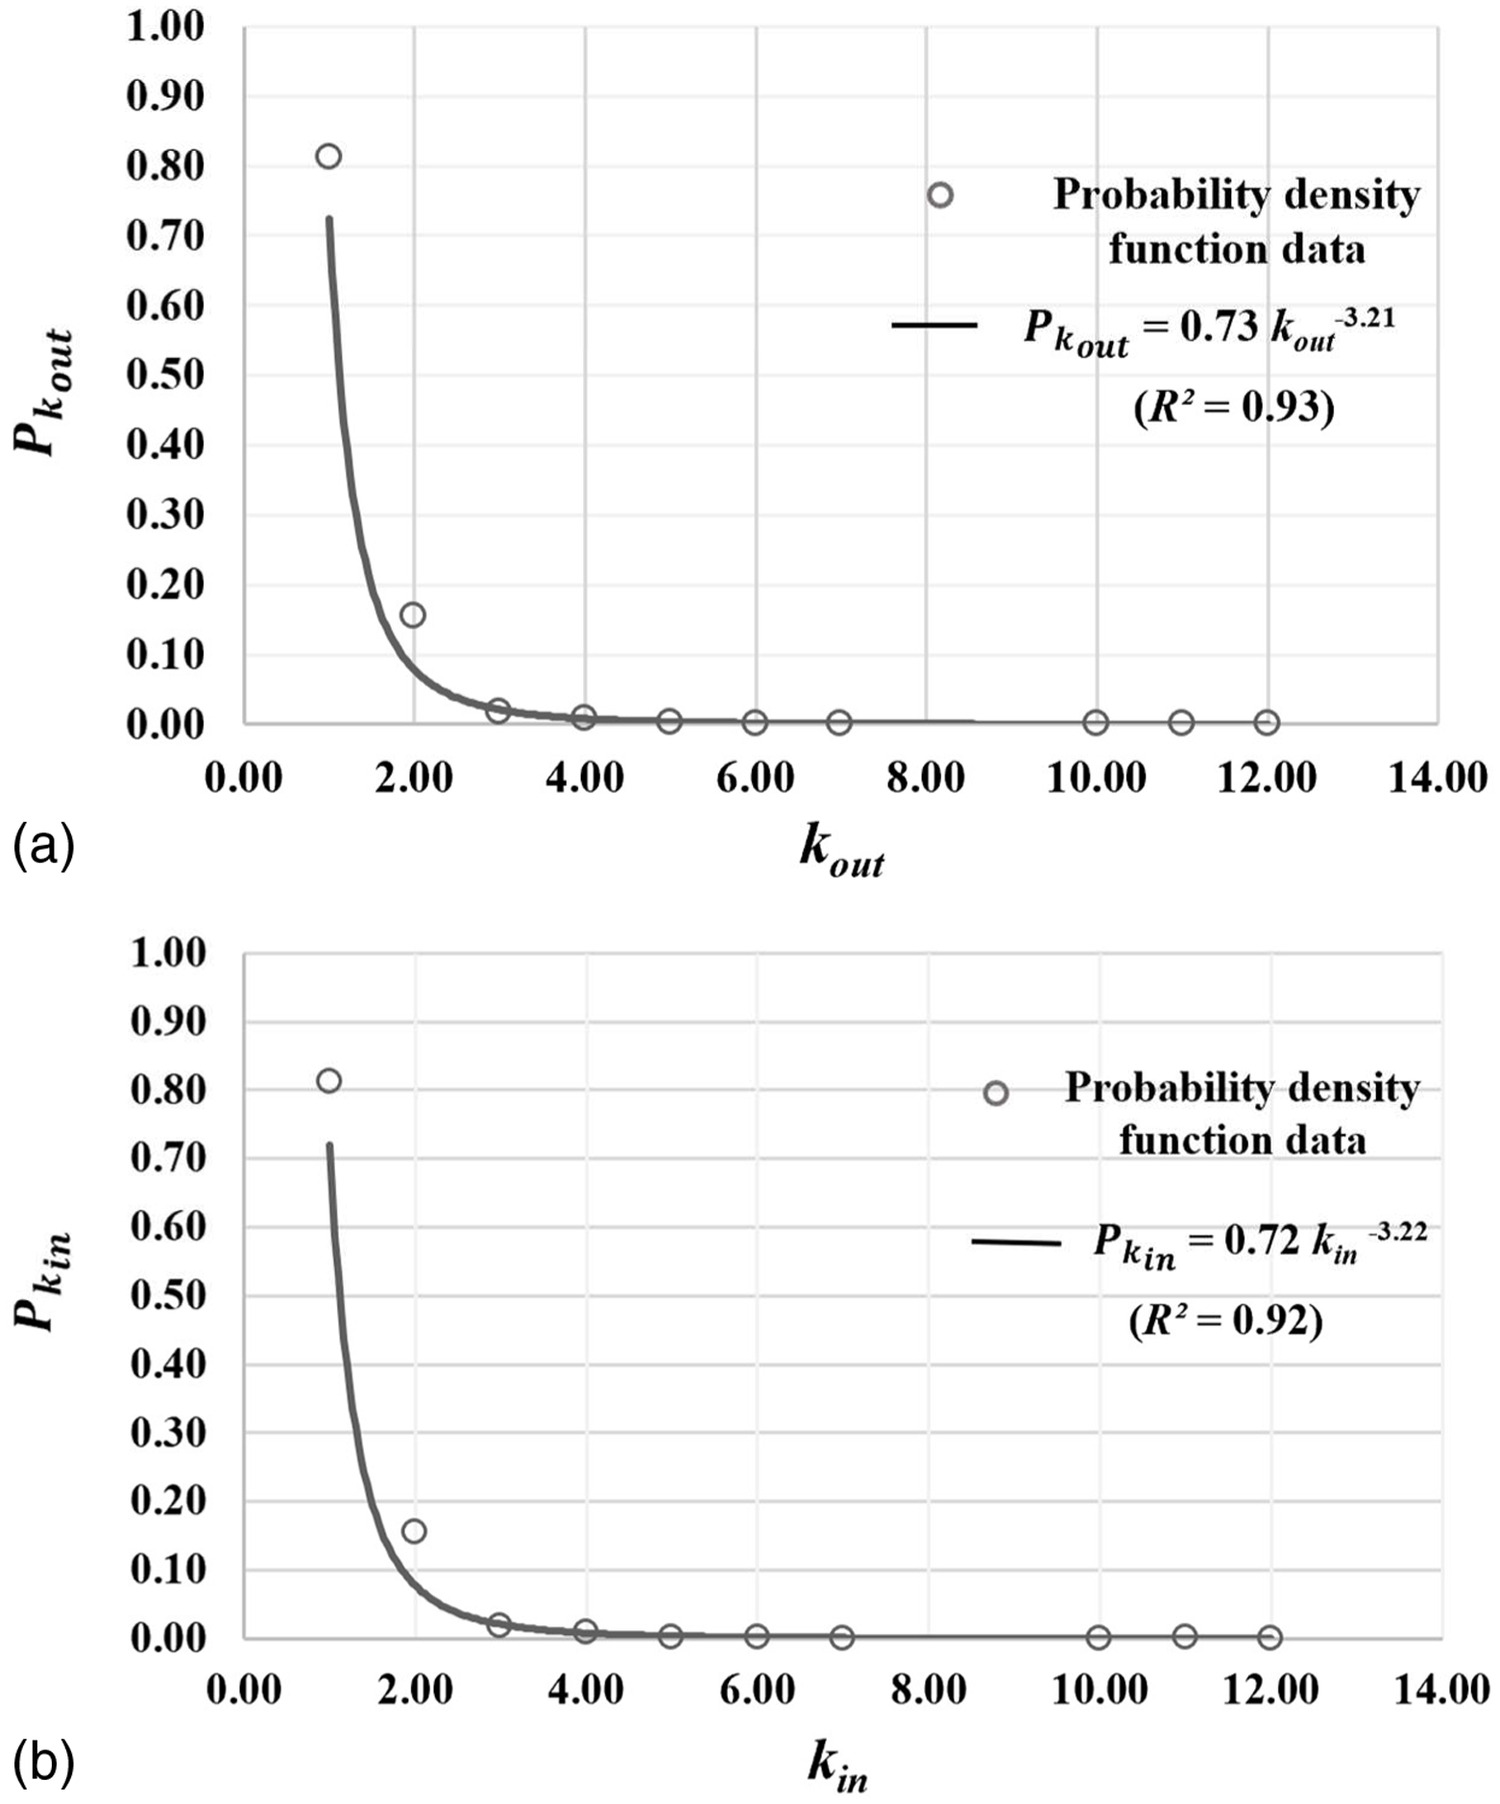
The static analysis of the network topology demonstrates that approximately 81% of the nodes have and , as shown in Fig. 4. As can be seen also in the figure, the node degree distribution of the network was found to follow a power-law distribution ( and ), which supports classifying it as a scale-free network (Barabási 2013). However, the power-law exponent values (i.e., 3.219 and 3.22) highlight that the network is of significant heterogeneity, may act as a random network under random failures (Barabási 2013), and may therefore fragment at a finite critical threshold (i.e., or ) independent of the network size, as will be discussed next.
Node and Link Failures
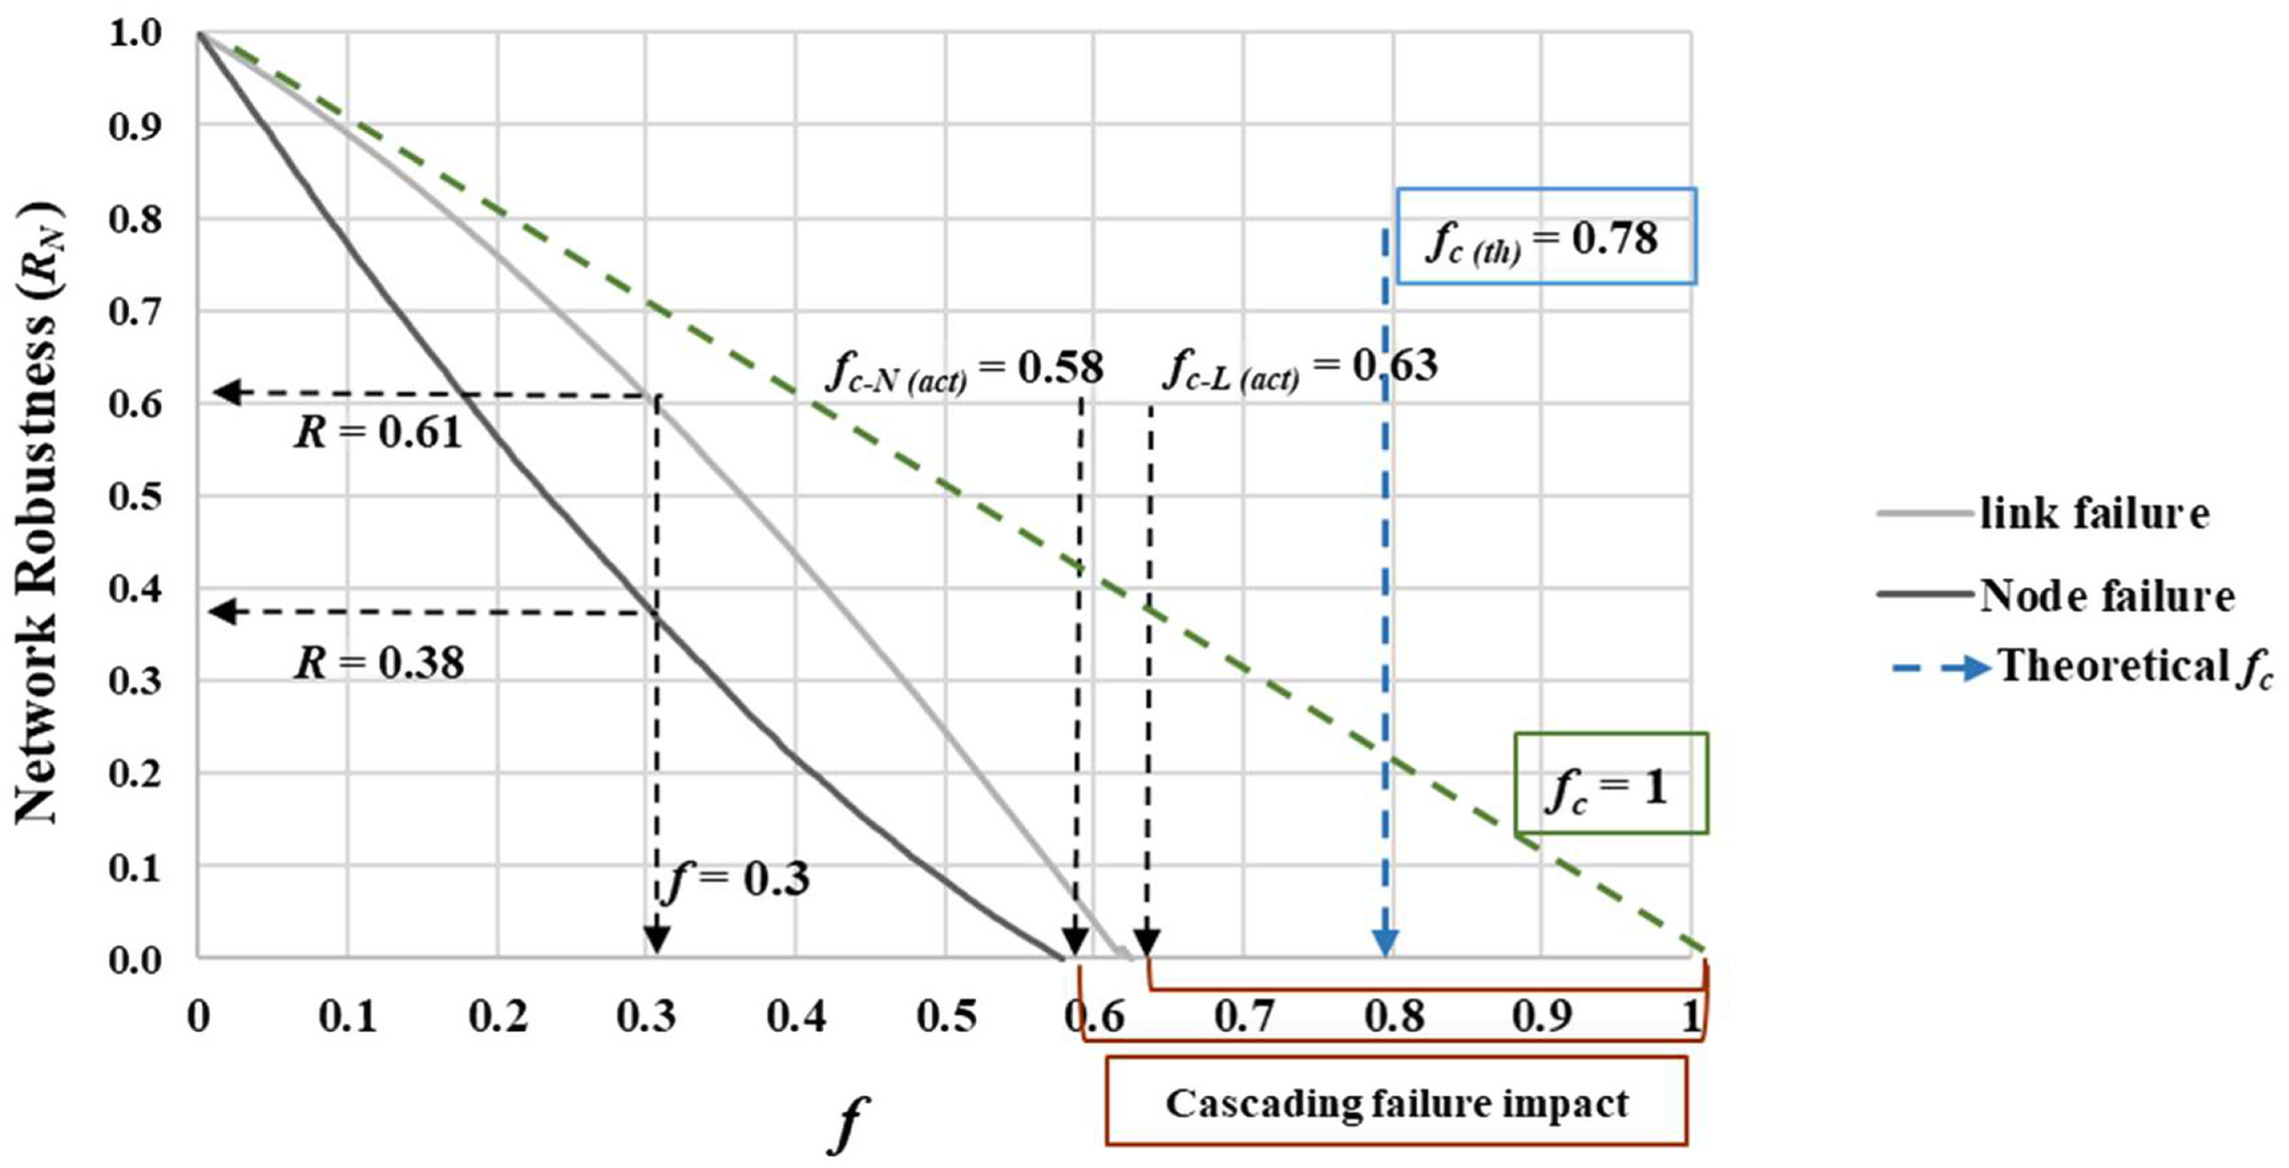
Fig. 5 shows the robustness analysis results for the network under both node (i.e., nodes and their connected links are completely removed from the network) and link (i.e., links are completely removed from the network) failure scenarios. The results showed that the network experienced different fragmentation schemes under both failure scenarios. For example, at a fraction of removed nodes or links, , of 0.3, the corresponding network robustness values are 0.38 and 0.61, for node and link failures, respectively, as shown in Fig. 5. This observation indicates that the influence of node failures on the network robustness is approximately double that of link failures. This significant difference in the network behavior is attributed to the fact that when a node fails (i.e., a bus stop becomes nonoperational), this node is removed from the network along with all of its connected links, where the number of such links can be represented by the network average (typically larger than 1.0). Therefore, when an fraction of nodes is removed, an fraction of links is removed from the network, which results in more damage to the network than the removal of an fraction of links. However, Fig. 5 shows that both scenarios yield completely disconnected networks at similar critical threshold values of and when nodes and links are triggered, respectively. By comparing such values to the theoretical critical threshold value, , developed by Molloy et al. (1995) for scale-free networks and presented in Eq. (9), there are variations of 20% and 15% for node and link failures, respectively. These variations are mainly because is based only on the network topology [i.e., the minimum degree of nodes () and the degree exponent of the network power-law distribution ()] (Molloy and Reed 1995; Barabási 2013), whereas and values presented in the current study depend on the developed CML model that considers both the topology and the passenger flow when systemic risks within bus transit networks are evaluated
(9)
Capacity Disruptions
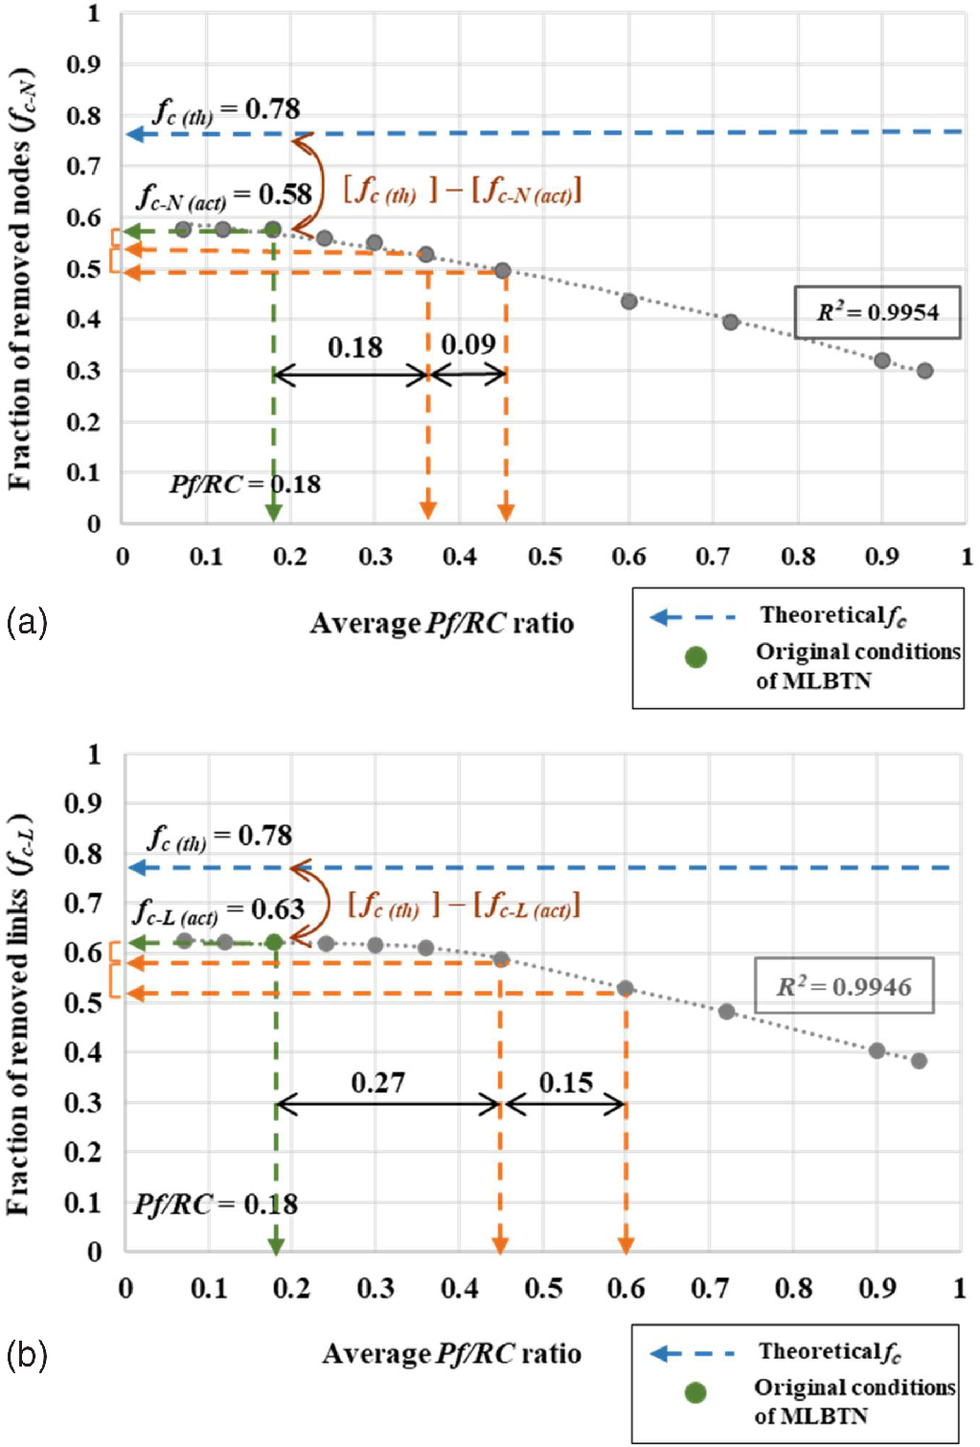
The passenger flow to route capacity () ratios are utilized in the current study to represent any disruptions that may occur due to either variation in the frequency of buses or excess demands with respect to the route capacities. In this respect, disruptions to the network capacity have been investigated and the corresponding network robustness is quantified under various ratios. The absorptive capacity thresholds of the network are also obtained for both node and link failure scenarios. Figs. 6(a and b) show the sensitivity of fc-N and fc-L to different ratios under node and link failure scenarios, respectively. As can be seen in both figures, the critical threshold values remain almost the same at initial ratios of (i.e., less than 0.35 and 0.45 for nodes and links, respectively); however, the threshold values are reduced significantly when the exceeds these initial ratios. Specifically, the network exhibits an initial ratio of 0.18 and corresponding critical threshold value of and for node and link failures, respectively. The absorptive capacity is defined in the current study as the ratio that the network can withstand with minor changes in the corresponding critical thresholds. Therefore, the absorptive capacity of the network is identified as 0.35 (i.e., 200% increase) and 0.45 (i.e., 250% increase) under node and link failures, with corresponding minor variations in and , respectively. These results highlight the significant impact of node failures on transit network capacities compared to that of link failures. As can be also seen in Figs. 6(a and b), for all ratios, the and are lower than . For instance, at (i.e., 50% less than the original value), the values are 0.59 and 0.64 for node and link failures, respectively, which are smaller than . This finding emphasizes the importance of considering the ratio as well as the topological characteristics of the network in obtaining the critical absorptive capacity thresholds for transit networks.
Route Failure
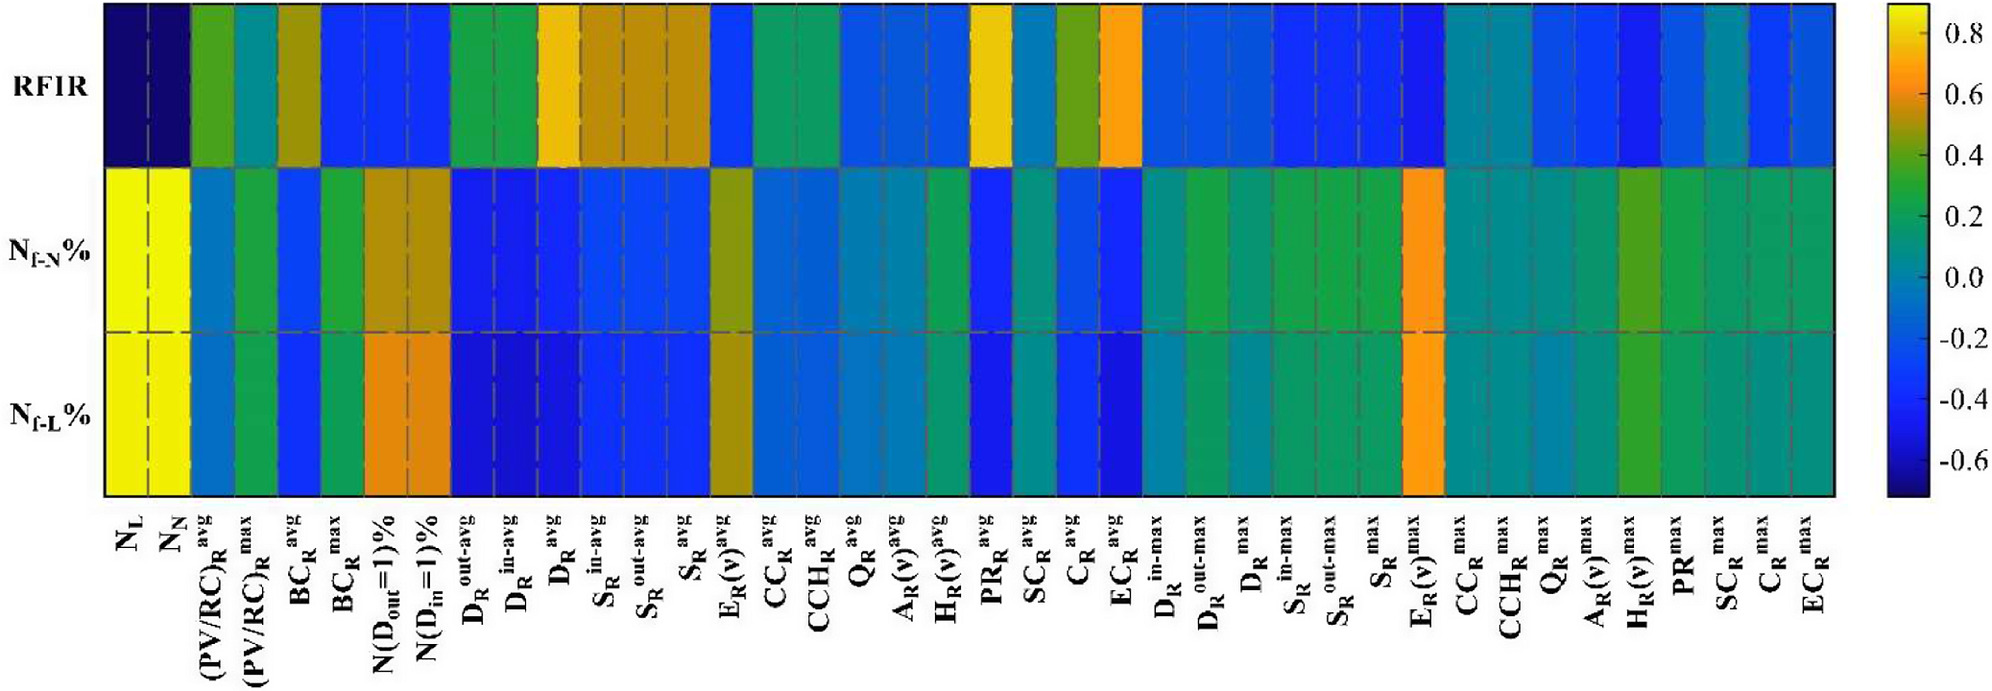
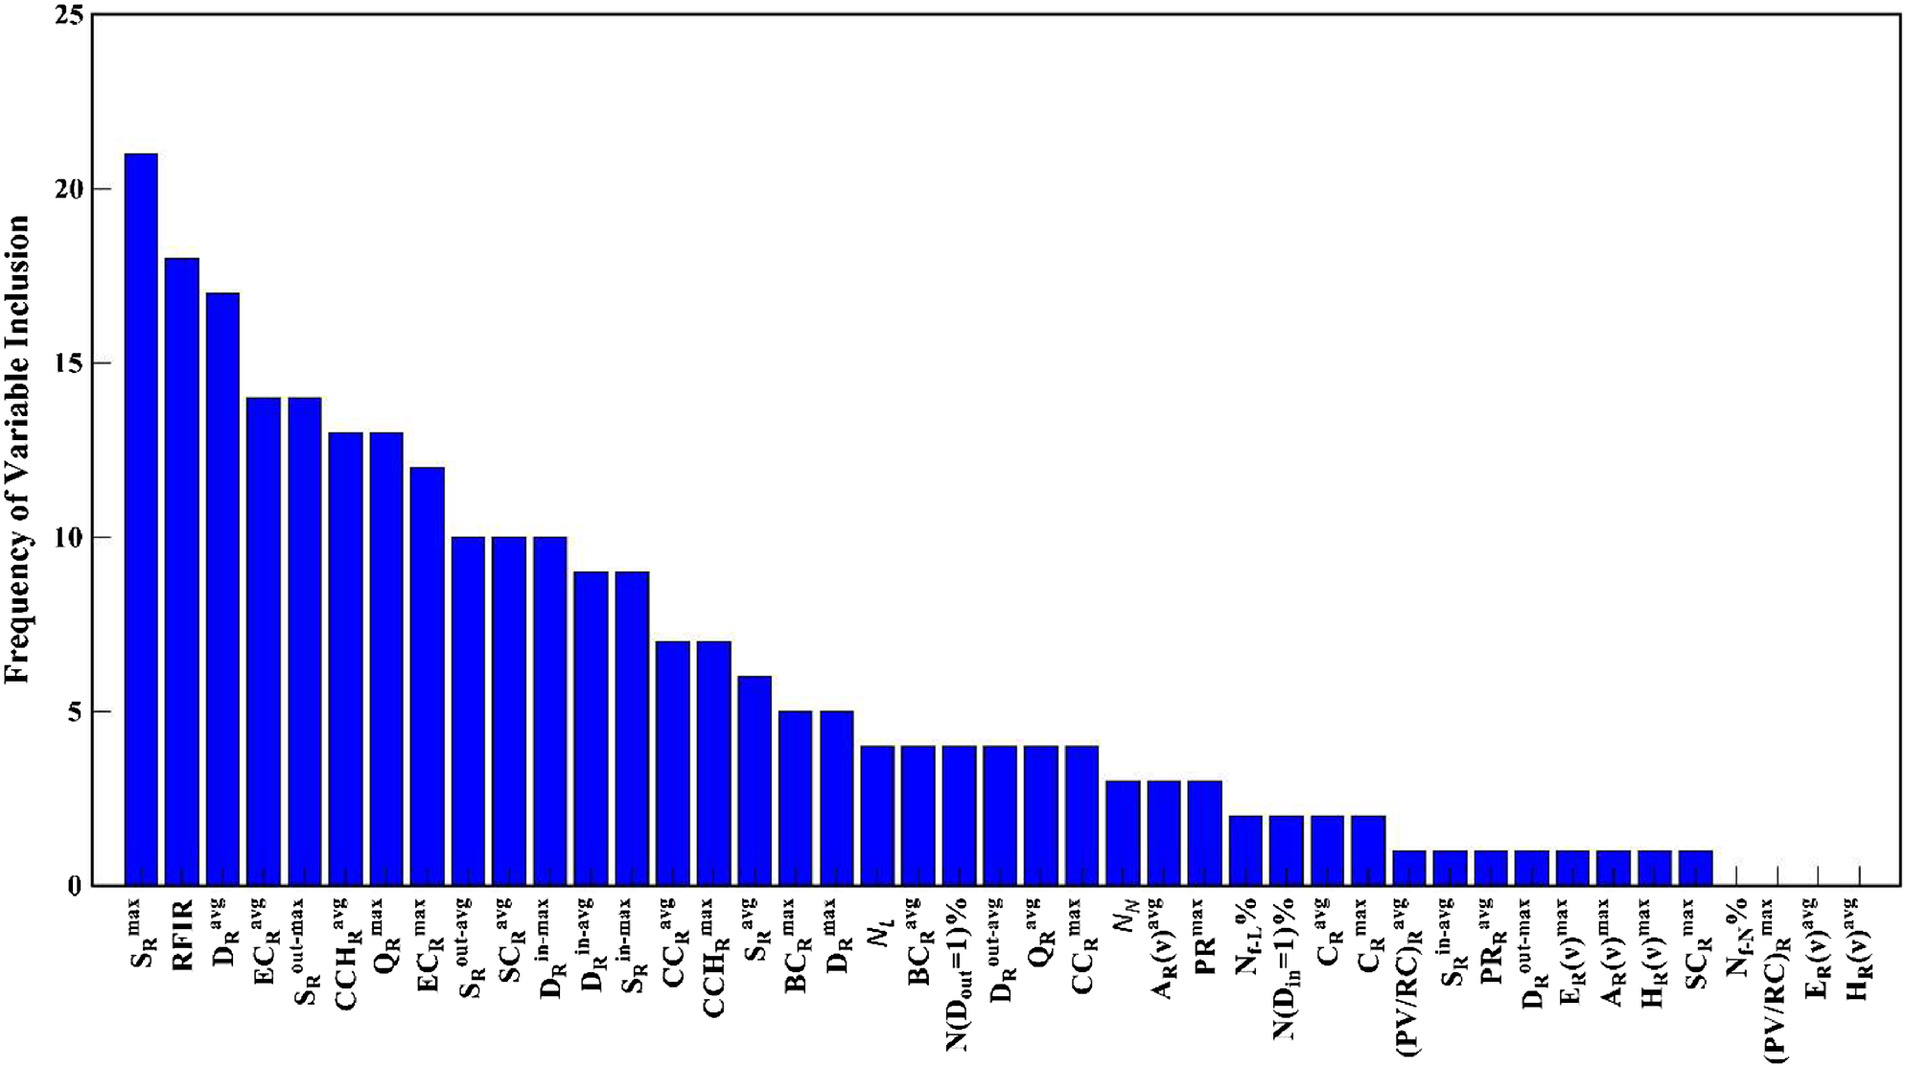
As every route encompasses a set of nodes and links, the robustness of transit networks under route failures highly depends on the characteristics of such components. Therefore, under each route failure scenario, 43 different variables are calculated to represent a wide range of operational and topological measures, and these are listed in “Notation” section. A preliminary analysis is conducted to investigate the correlation between such measures and the route failure indices (, , and RFIR). This correlation analysis was investigated based on the value of the Pearson’s correlation coefficient as seen in Fig. 7. As can be seen in Fig. 7, no significant correlation is apparent between the different robustness indices and most of the topological and operational measures. For example, the RFIR has a strong direct correlation with only two topological measures ( and , with correlation coefficient ), and a strong inverse correlation with only two operational measures ( and , with correlation coefficient ). Conversely, the , and have a strong direct correlation with two operational measures only ( and , with correlation coefficient ). These results highlight the notion of indices/measure interdependence, rather than their simple correlation, which supports that the robustness of the network is a function of the interplay between all topological and operational measures. The integrated GA-clustering analysis was subsequently applied to categorize the network routes considering the interplay between their topology and operational measures and the robustness indices. The GA was applied using a population size of 200, a crossover ratio of 0.2, maximum generations of 100, and a tournament selection with a size equals to 2. The integrated GA-clustering analysis was applied 29 times, each of which includes: (1) predefining a value (between 2 and 30); and (2) applying the GA to identify the optimum variable set that can represent the whole dataset through that number of clusters (i.e., ). An optimum variable set is thus identified for each value and is referred to as the GA solution. Fig. 8 shows the frequency of including each of the 43 measures in the GA solution. A high frequency indicates that the corresponding measure was frequently used for clustering, which reflects its importance for representing the whole dataset. For example, the top five measures of the highest importance are the maximum weighted degree, , RFIR, average degree, , average Eigen-centrality, , and maximum weighted outdegree, . These measures appeared 21, 18, 17, 14, and 14 times in the GA solutions, respectively. Measures of the highest importance include topology and centrality measures, which support the limitation of characterizing bus transit routes based on operational measures only and highlight the need for including topology measures to assess the overall bus transit network robustness under route failures.
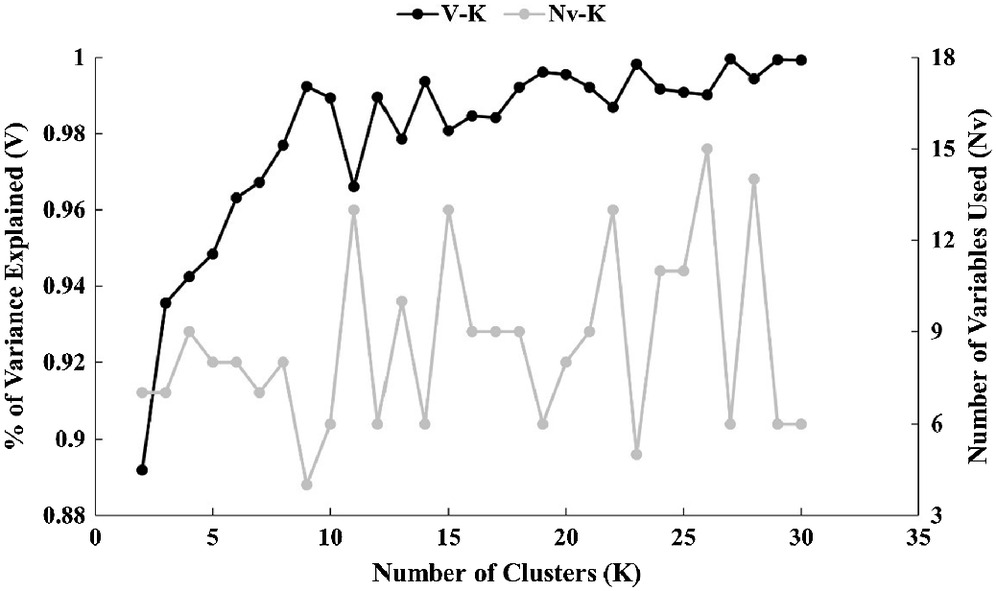
The percentage of the variance explained by each GA solution increases with the number of clusters (i.e., ), as shown in Fig. 9, where the best cluster model is that with six variables and 27 clusters (describing approximately 100% of the variance). However, this is considered an infeasible model due to the large number of clusters required. As such, a model with a smaller number of clusters can be more practical. The use of six clusters with eight variables can represent approximately 96% of the variance, which can be increased by only 4% using a model with more clusters. Accordingly, a model with six clusters and eight variables is considered herein as the near-optimal cluster model. The definitions, physical representations, and mathematical formulations of the selected eight variables are presented in Table 1, while Fig. 10 shows the statistical behavior of each of these variables over the six clusters.
| Name and variable | Definition and representation | Formula |
|---|---|---|
| Route failure impact ratio (RFIR) | The ratio between the total number of failed nodes () when a specific route failed and the number of nodes along that route () and is used to identify the critical routes that can facilitate the cascading failure in the network. | |
| Average betweenness centrality () | The average fraction of shortest paths passing through each node along the route and is used to identify the routes containing the relatively important stops in terms of location. | |
| where | ||
| Average closeness centrality () | The distance between each node on the route and all other nodes in the network (Opsahl et al. 2010; Barabási 2013) the degree of accessibility to the stops belonging to the route compared to other stops in the network. | |
| where = length of the shortest path between nodes and . | ||
| Average Eigen centrality () | The average influence of each node along the route based on the importance of the neighboring nodes. | |
| where = right leading eigenvector; = adjacency matrix; and = eigenvalue of for which exists. | ||
| Maximum in-degree | The maximum number of links directed toward any node over the route and corresponds to the stops with the largest size (major stop like terminals, or stations) that exist along the route based on the number of routes directed toward the stop. | |
| where = adjacency matrix entry corresponding to the connection between nodes and . | ||
| Maximum modularity class () | The maximum modularity class () amongst the nodes located along the route , where is used to measure the likelihood of dividing the network into modules, where higher modularity denotes that a group of edges are most likely located within the same community. | |
| where = adjacency matrix; = number of links in the network; = indegree of the node ; = outdegree of the node j; () = community to which the node i (j) belongs; and = Kronecker delta function. | ||
| Maximum weighted out-degree () | The maximum outward node strength along the route and represents the maximum passenger flow () originated from that route. | |
| where = entry of the weighted adjacency matrix corresponding to the connection between nodes and | ||
| Maximum weighted degree () | The maximum node strength along the route and corresponds to the stop with the highest passenger circulation along the route. |
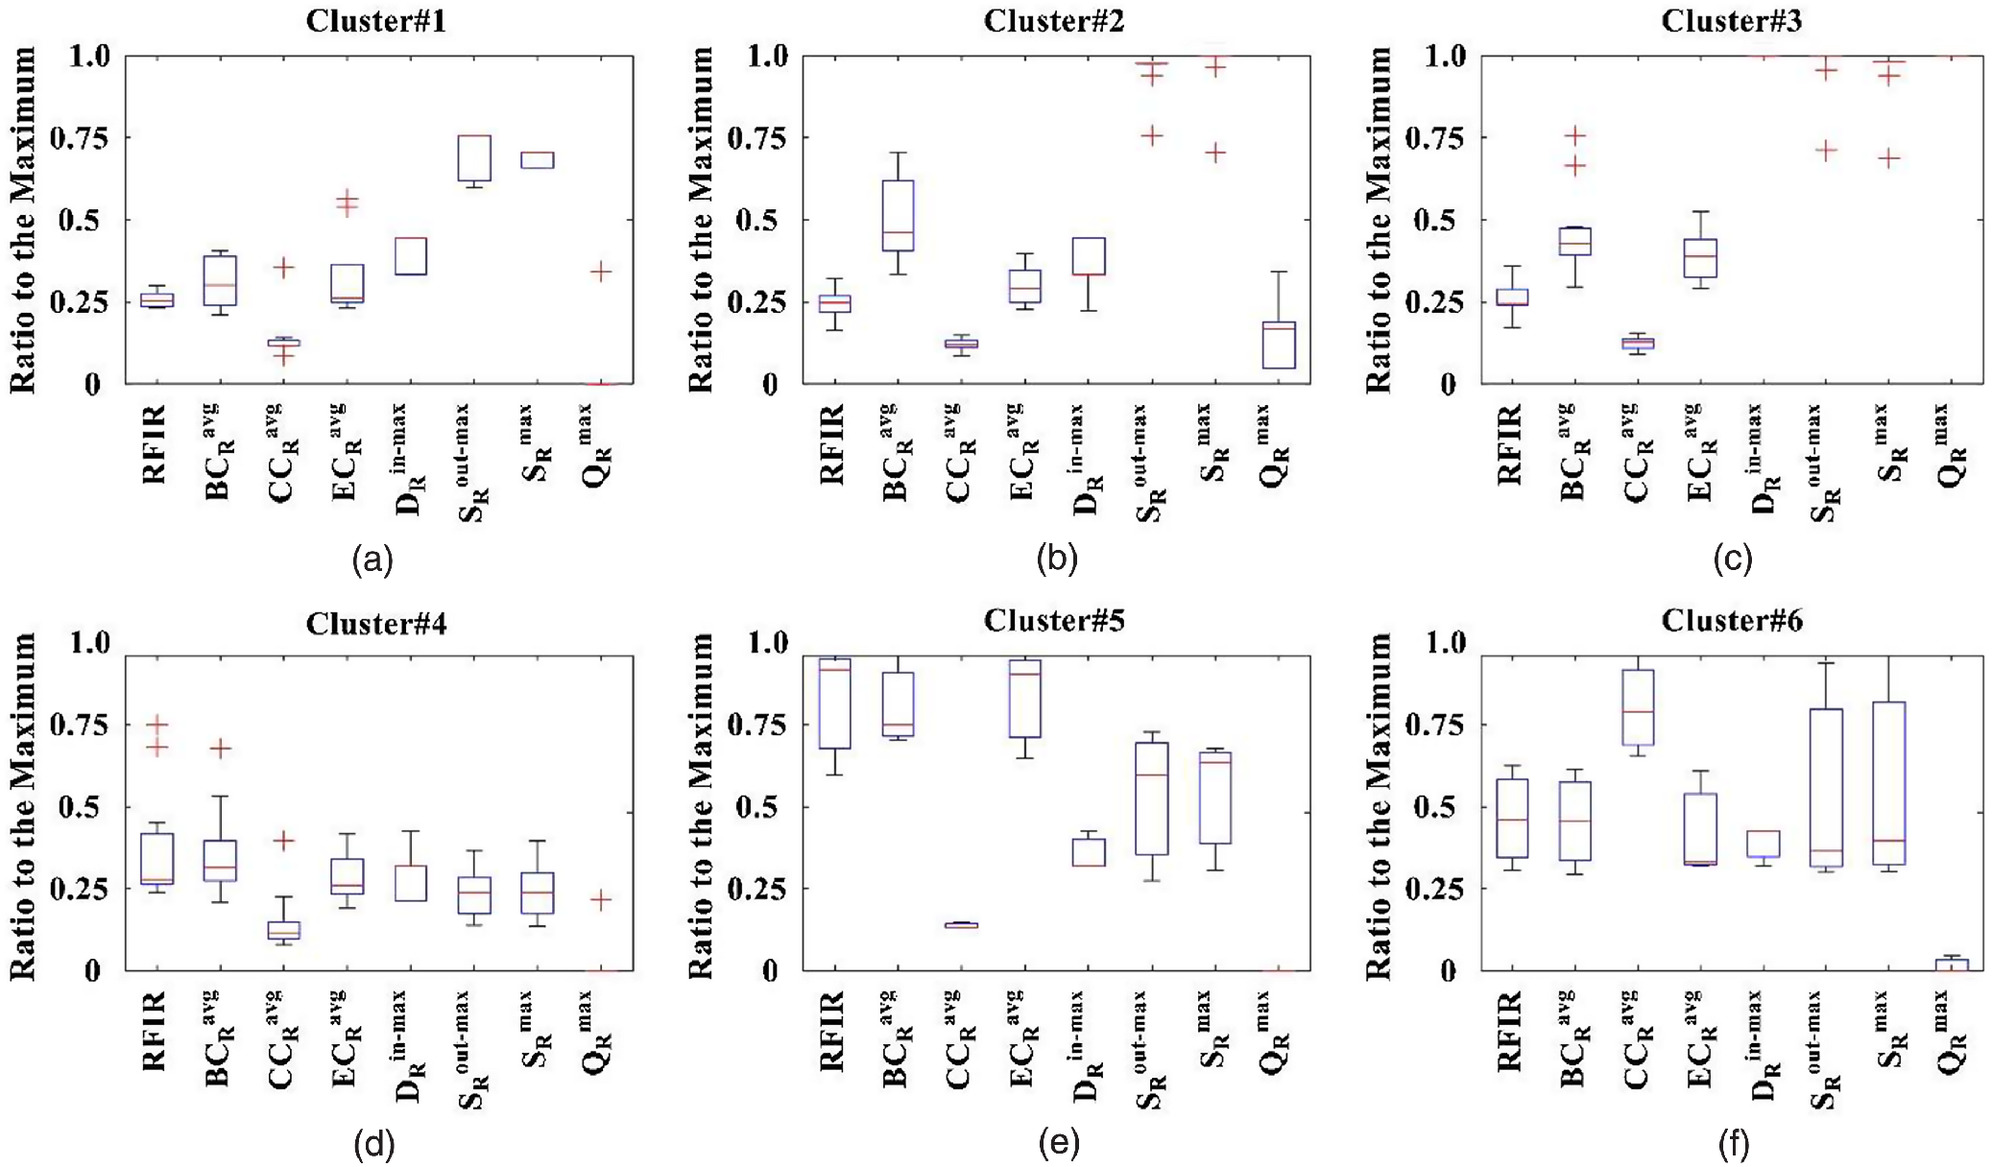
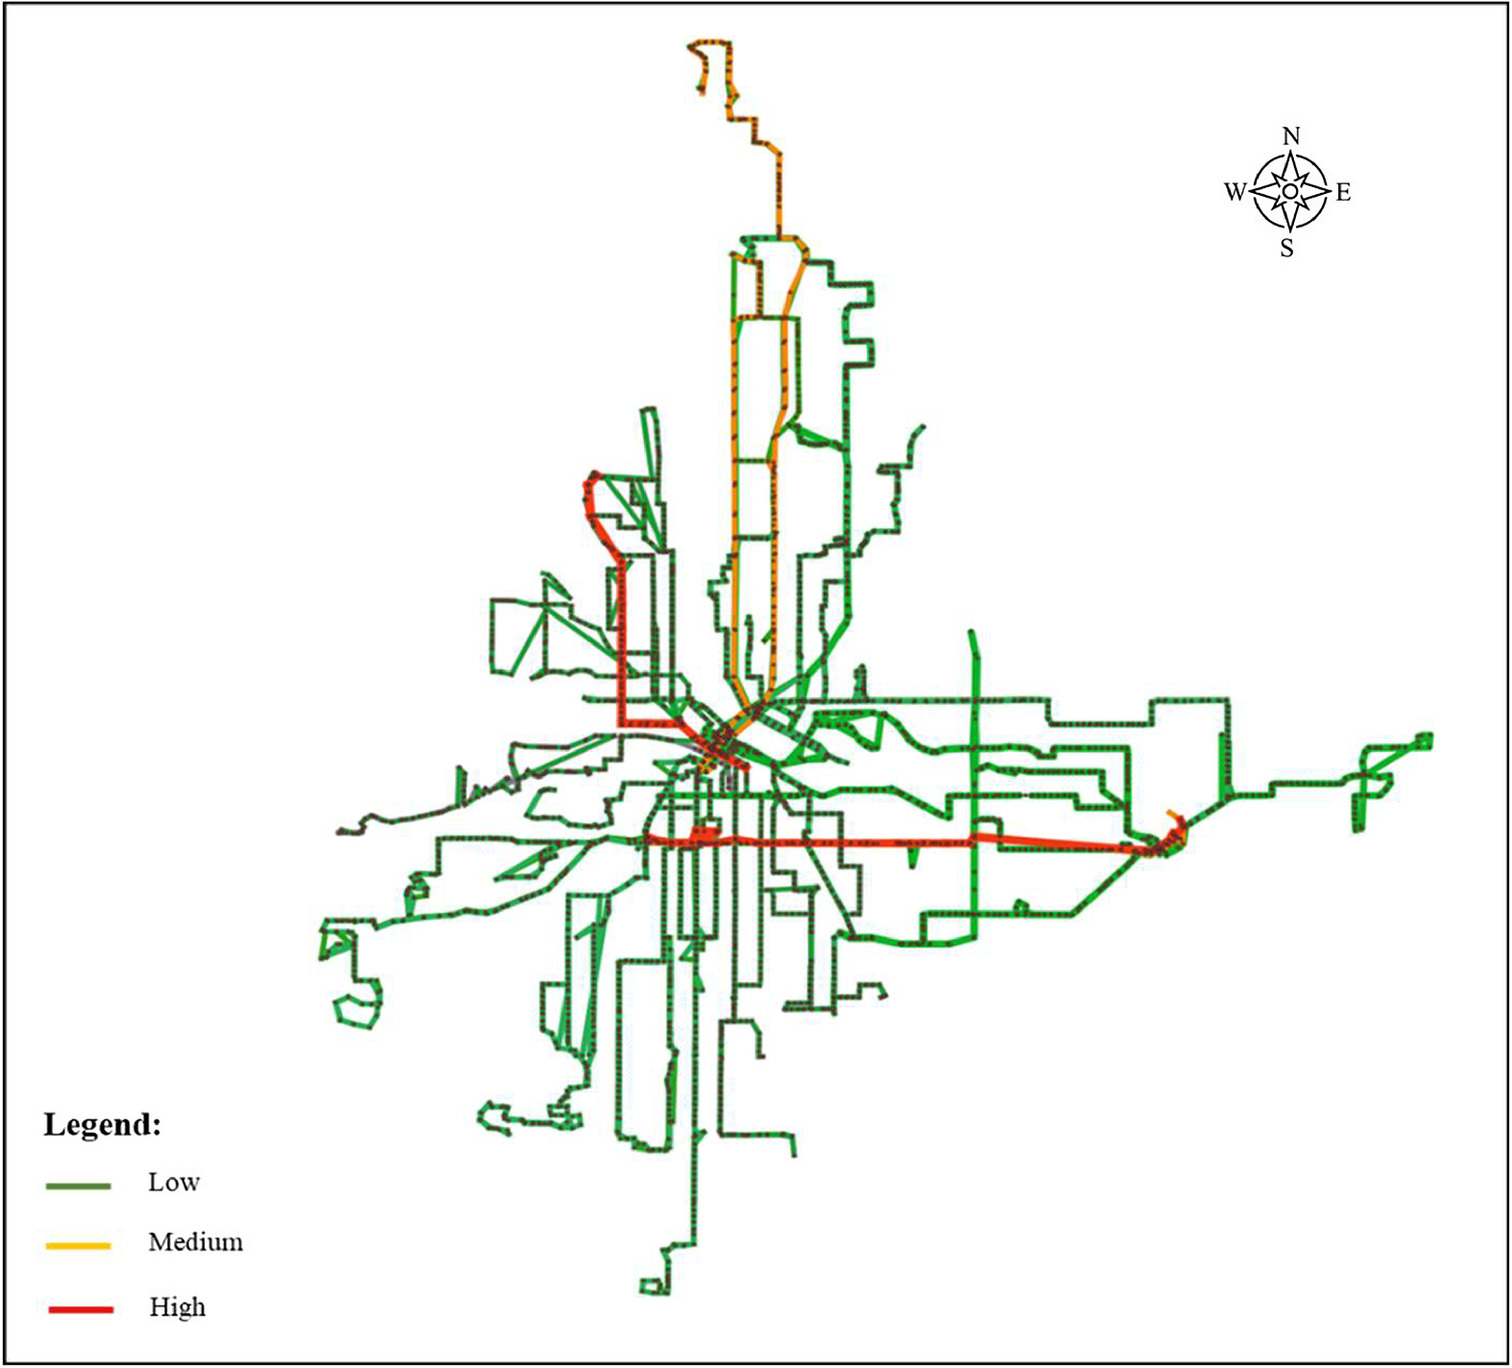
Although the routes can be classified based on their levels of operability, this classification may be misleading as the failure of a route can cause the failure of several nodes/links based on the connectedness of this route to other network components. As such, the network routes have been classified based on their RFIR (as an operability/robustness indicator) together with the , , , , and (as connectedness indicators) into low (i.e., low robustness/low connectedness), moderate (i.e., moderate robustness/intermediate connectedness), and high (i.e., high robustness/high connectedness). It should be emphasized that such classification procedures can cause the intervals of a single measure to overlap with those of other classes. Specifically, Clusters 1 to 4 include routes with low RFIR values that span between 0.18 and 0.48. Cluster 5 represents routes with high RFIR values that are between 0.62 and 0.99, while Cluster 6 contains moderate impact routes with RFIR values that vary between 0.34 and 0.63. The results show that and have a significant impact on the severity of the failure compared to other connectedness indicators, thus highlighting the importance of the location, accessibility levels, and characteristics of the neighboring nodes in controlling the severity of failure propagation through the network. Moreover, routes with relatively high connectedness indicators and moderate to high passenger flow indicators can significantly impact the overall network vulnerability. In contrast, routes with relatively low connectedness indicators and high passenger flow indicators are characterized by low or moderate route failure impact ratio (i.e., their failures have low to moderate effects on the overall network vulnerability). Fig. 11 shows the spatial distribution of the six clusters over the network. Most of the routs have a low impact on the overall network robustness; however, routes of relatively higher failure impacts (i.e., those with moderate to high RFIR values) are highly connected and located in the core of the network. Most of the bus stops along such routes exhibit high connectedness (expressed through higher , and ) compared to other routes. Conversely, routes of lower failure impacts (i.e., those with low RFIR values) are located near the network boundaries. However, a small fraction of the bus stops along these routes is highly connected to other routes in the network.
Conclusions
Transportation infrastructure networks (e.g., urban transit) provide fundamental accessibility and mobility services for users, and thus any disruptions to such complex and dynamic networks are associated with severe socioeconomic impacts. Subsequently, research efforts focusing on quantifying and enhancing their robustness under cascade failure scenarios are critically needed in order to ensure reliable transit service and transportation network resilience under systemic risks posed by cascade disruptions. In the current study, a novel analysis approach is developed to quantify the robustness of urban bus transit networks under systemic risks, where complex network theory (CNT), genetic algorithm (GA), and clustering are integrated in a hybrid simulation approach. The approach aims at utilizing several topological and operational measures to evaluate the robustness of transit networks following the failure of their main components (i.e., stops, links, and routes). In this respect, a coupled map lattice (CML) model is developed considering several CNT-based topological measures and employing a direction-based passenger flow redistribution approach to facilitate evaluating the robustness of the transit networks under different passenger flow-to-route capacity () scenarios. GA is subsequently coupled with clustering to identify the primary measures influencing the network robustness as well as to categorize the network routes based on their topological and operational measures. The City of Minneapolis bus transit network is considered to demonstrate the utility of the developed approach.
The results of the network robustness analysis showed that node (i.e., stop) failures can trigger larger fragmentation of the transit network compared to those due to link (i.e., bus route segments) failures. The results also demonstrated that currently developed theoretical robustness thresholds are not representative of bus transit networks as they are determined based on static topological characteristics only. The capacity disruption analysis highlighted that absorptive capacity thresholds of 0.35 and 0.45 can be used for node and link failures, respectively, suggesting that the considered bus transit network’s spare capacity enables absorbing an increase in passenger flow of up to 200% and 250% under the two failure scenarios, respectively. In addition, the results demonstrated the strong inverse correlation between the absorptive capacity and the network robustness, where the network can exhibit a remarkable robustness reduction when exceeding its absorptive capacity thresholds.
The application of GA and cluster analyses identified the set of measures that can be used to characterize routes in transit networks. These measures include a robustness indicator (i.e., route failure impact ratio), four connectedness indicators (i.e., the average betweenness centrality, closeness centrality, Eigen centrality, and maximum modularity class), and three passenger flow indicators (i.e., the maximum weighted in-degree, out-degree, and total degree). This finding supports the importance of integrating both topological and operational measures when the robustness of transit networks is evaluated under systemic risks. The results also showed that both the average betweenness centrality and the Eigen centrality have a significant impact on the severity of cascade failures in transit networks compared to other connectedness indicators. This highlights the importance of location, accessibility levels, and characteristics of the neighboring nodes in controlling the failure propagation throughout the network. In other words, the characteristics of the nonoperational stops along with their neighboring stops are key factors that can either amplify or hinder cascade failures within transit networks.
The analysis results highlighted the importance of modeling bus transit networks as directed ones. This is because the different directions of the same route can have different failure impacts on the network and subsequently, they may not fall within the same cluster as demonstrated in the current study. In addition, the current study showed that routes with relatively high connectedness indicators and moderate-to-high passenger flow indicators can significantly impact the overall network vulnerability. In contrast, routes with relatively low connectedness indicators and high passenger flow indicators are characterized by low or moderate route failure impact ratios, which supports the importance of including both topological and operational measures to identify critical routes in transit networks.
In general, the hybrid simulation approach developed in the current study facilitates understanding the behavior of transit networks under different component (i.e., stops, links, and bus routes) failure scenarios. Transit service providers and city officials can employ the developed approach to (1) evaluate the robustness of different transit network structures under what-if scenarios and subsequently select the optimal configuration; (2) enhance the transit network capacity through calculating the absorptive capacity under various operational conditions; (3) devise capacity-based recovery plans (i.e., rescheduling the transit service, increasing bus frequency, reducing headways) to manage the risk of cascade failures due to passenger flow redistribution; and (4) classify the network routes according to their contribution to the network robustness and subsequently prepare effective risk mitigation strategies (e.g., providing alternative routes for travelers and/or managing the transit fleet). The presented model empowers transit service providers and city officials with the necessary simulation tools for effective city systems resilience planning and management under different forms of interdependence-induced network-level disruptions.
Notation
The following symbols are used in this paper:
Topological Characteristics
- average authority score;
- maximum authority score;
- average betweenness centrality;
- maximum betweenness centrality;
- average clustering;
- maximum clustering;
- average closeness centrality;
- maximum closeness centrality;
- average harmonic closeness centrality;
- maximum harmonic closeness centrality;
- average degree;
- maximum degree;
- average indegree centrality;
- maximum indegree;
- average outdegree centrality;
- maximum outdegree;
- average Eigen centrality;
- maximum Eigen centrality;
- average eccentricity;
- maximum eccentricity;
- average hub;
- maximum hub;
- percentage of nodes with in-degree = 1;
- percentage of nodes with out-degree =1;
- average page ranks;
- maximum page ranks;
- average modularity class;
- maximum modularity class;
- average strong component number; and
- maximum strong component number.
- number of links along the route;
- number of stops along the route;
- average ;
- maximum ;
- average weighted degree;
- maximum weighted degree;
- average weighted out-degree;
- maximum weighted out-degree;
- average weighted in-degree; and
- maximum weighted in-degree.
- percentage of failed nodes based on link failure;
- percentage of failed nodes based on node failure; and
- RFIR
- route failure impact ratio.
Operational Characteristics
Robustness Indicators
Appendix
| Input: initial random for all , , , , , , , |
| Output: |
| 1: Procedure Random node failure in the Minneapolis local bus transit network |
| 2: for all do |
| 3: if or |
| 4: , |
| 5: else |
| 6: and |
| 7: end if |
| 8: Randomly select Node |
| 9: |
| 10: ; |
| 11: for all where |
| 12: do Eq. (6) |
| 13: end for |
| 14: if |
| 15: |
| 16: do Eq. (5) |
| 17: do Eq. (7) |
| 18: |
| 19: else |
| 20: |
| 21: for all where |
| 22: do Eq. (6) |
| 23: end for |
| 24: end if |
| 25: ; |
| 26: end for |
| 27: end procedure |
Appendix
| Input: initial random for all , , , , , , , |
| Output: |
| 1: Procedure Random link failure in Minneapolis local bus transit network |
| 2: for all do |
| 3: if or |
| 4: , |
| 5: else |
| 6: and |
| 7: end if |
| 8: for all |
| 9: all |
| 10: Randomly select Link |
| 11: do Eq. (6) |
| 12: end for |
| 13: if |
| 14: |
| 15: do Eq. (5) |
| 16: do Eq. (7) |
| 17: |
| 18: else |
| 19: |
| 20: for all where |
| 21: do Eq. (6) |
| 22: end for |
| 23: end if |
| 24: ; |
| 25: end for |
| 26: end procedure |
Data Availability Statement
All data, models, and code generated or used during the study appear in the published article.
Acknowledgments
This work was supported by the Natural Science and Engineering Research Council of Canada (NSERC) through the Canadian Energy Infrastructure Resilience under Systemic Risk (CaNRisk)—Collaborative Research and Training Experience (CREATE) under Grant No. CREATE/482707-2016. The additional support through the INTERFACE Institute and the INViSiONLab is also acknowledged.
References
Abdelaty, H., M. Mohamed, M. Ezzeldin, and W. El-Dakhakhni. 2020. “Quantifying and classifying the robustness of bus transit networks.” Transportmetrica A: Transp. Sci. 16 (3): 1176–1216. https://doi.org/10.1080/23249935.2020.1720042.
Albert, R., and A. L. Barabási. 2002. “Statistical mechanics of complex networks.” Rev. Mod. Phys. 74 (1): 47–97. https://doi.org/10.1103/RevModPhys.74.47.
Alzoor, F. S., M. Ezzeldin, M. Mohamed, and W. El-Dakhakhni. 2021. “Prioritizing bridge rehabilitation plans through systemic risk-guided classifications.” J. Bridge Eng. 26 (7): 1–13. https://doi.org/10.1061/(ASCE)BE.1943-5592.0001733.
APTA (American Public Transportation Association). 2019. Public transportation ridership report: Fourth quarter 2019. Washington, DC: APTA.
Barabási, A. L. 2013. “Network science.” Phil. Trans. R. Soc. A. 371: 20120375. https://doi.org/10.1098/rsta.2012.0375.
Barabási, A. L. 2016. Network science. Cambridge, UK: Cambridge University Press.
Boccaletti, S., V. Latora, Y. Moreno, M. Chavez, and D. U. Hwang. 2006. “Complex networks: Structure and dynamics.” Phys. Rep. 424 (4–5): 175–308. https://doi.org/10.1016/j.physrep.2005.10.009.
Boyle, D. K. 2009. Passenger counting systems. Washington, DC: Transportation Research Board.
Bruneau, M., S. E. Chang, R. T. Eguchi, G. C. Lee, T. D. O’Rourke, A. M. Reinhorn, M. Shinozuka, K. Tierney, W. A. Wallace, and D. Von Winterfeldt. 2003. “A framework to quantitatively assess and enhance the seismic resilience of communities.” Earthquake Spectra 19 (4): 733–752. https://doi.org/10.1193/1.1623497.
Bureau of Transportation Statistics. 2018. Transportation statistics annual. Washington, DC: Bureau of Transportation Statistics.
Cats, O., and E. Jenelius. 2015. “Planning for the unexpected: The value of reserve capacity for public transport network robustness.” Transp. Res. Part A: Policy Pract. 81 (Feb): 47–61. https://doi.org/10.1016/j.tra.2015.02.013.
Chazottes, J. R., and B. Fernandez. 2005. Dynamics of coupled map lattices and of related spatially extended systems. Berlin: Springer.
De Los Santos, A., G. Laporte, J. A. Mesa, and F. Perea. 2012. “Evaluating passenger robustness in a rail transit network.” Transp. Res. Part C: Emerging Technol. 20 (1): 34–46. https://doi.org/10.1016/j.trc.2010.09.002.
Derrible, S., and C. Kennedy. 2010. “The complexity and robustness of metro networks.” Physica A 389 (17): 3678–3691. https://doi.org/10.1016/j.physa.2010.04.008.
Derrible, S., and C. Kennedy. 2011. “Applications of graph theory and network science to transit network design.” Transp. Rev. 31 (4): 495–519. https://doi.org/10.1080/01441647.2010.543709.
Ezzeldin, M., and W. E. El-Dakhakhni. 2019. “Robustness of Ontario power network under systemic risks.” Sustainable Resilient Infrastruct. 100 (10): 1–20. https://doi.org/10.1080/23789689.2019.1666340.
FHWA (Federal Highway Administration). 2012. “Climate change and extreme weather vulnerability assessment framework.” Accessed February 2, 2021. https://www.fhwa.dot.gov/environment/sustainability/resilience/publications/vulnerability_assessment_framework/fhwahep13005.pdf.
Fox9. 2020. “Metro transit suspending all bus, light rail service through the weekend due to protests.” Accessed October 15, 2021. https://www.fox9.com/news/metro-transit-suspending-all-bus-light-rail-service-through-the-weekend-due-to-protests.
Furth, P. G., B. Hemily, T. H. Muller, and J. G. Strathman. 2006. Using archived AVL-APC data to improve transit performance and management. Washington, DC: Transportation Research Board. https://doi.org/10.17226/13907.
Guze, S. 2019. “Graph theory approach to the vulnerability of transportation networks.” Algorithms 12 (2): 270. https://doi.org/10.3390/A12120270.
Haggag, M., M. Ezzeldin, W. El-Dakhakhni, and E. Hassini. 2020. “Resilient cities critical infrastructure interdependence: A meta-research.” Sustainable Resilient Infrastruct. 12 (Nov): 1–22. https://doi.org/10.1080/23789689.2020.1795571.
Hossain, M. M., and S. Alam. 2017. “A complex network approach towards modeling and analysis of the Australian airport network.” J. Air Transp. Manage. 60 (Jan): 1–9. https://doi.org/10.1016/j.jairtraman.2016.12.008.
Hosseini, S., and K. Barker. 2016. “Modeling infrastructure resilience using Bayesian networks: A case study of inland waterway ports.” Comput. Indus. Eng. 93 (Jan): 252–266. https://doi.org/10.1016/j.cie.2016.01.007.
Hosseini, S., K. Barker, and J. E. Ramirez-Marquez. 2016. “A review of definitions and measures of system resilience.” Reliab. Eng. Syst. Saf. 145 (Jan): 47–61. https://doi.org/10.1016/j.ress.2015.08.006.
Huang, A., H. M. Zhang, W. Guan, Y. Yang, and G. Zong. 2015. “Cascading failures in weighted complex networks of transit systems based on coupled map lattices.” Math. Problems Eng. 2015 (Jul): 1–15. https://doi.org/10.1155/2015/940795.
Humphrey, N. 2008. The role of transit in emergency evacuation. Washington, DC: Transportation Research Board. https://doi.org/10.17226/12445.
Inanloo, B., B. Tansel, K. Shams, X. Jin, and A. Gan. 2016. “A decision aid GIS-based risk assessment and vulnerability analysis approach for transportation and pipeline networks.” Saf. Sci. 84 (Apr): 57–66. https://doi.org/10.1016/j.ssci.2015.11.018.
Jia, T., W. Liu, and X. Liu. 2021. “A cross-city exploratory analysis of the robustness of bus transit networks using open-source data.” Physica A 580 (12): 126133. https://doi.org/10.1016/j.physa.2021.126133.
Jones, P. R., and P. W. Harris. 1999. “Developing an empirically based typology of delinquent youths.” J. Quantitative Criminol. 15 (3): 251–276. https://doi.org/10.1023/A:1007524414432.
Kaneko, K. 1992. “Overview of coupled map lattices.” Chaos 2 (3): 279–282. https://doi.org/10.1063/1.165869.
Kurant, M., and P. Thiran. 2006. “Extraction and analysis of traffic and topologies of transportation networks.” Phys. Rev. E: Stat. Nonlinear Soft Matter Phys. 74 (3): 036114. https://doi.org/10.1103/PhysRevE.74.036114.
Lan, C. 2015. “Route-level transit passenger origin-destination trip estimation from automatic passenger counting data: A case study in Edmonton.” Accessed July 20, 2021. https://era.library.ualberta.ca/files/xd07gw76v/Lan_Cheng_201501_MSc.pdf.
Likas, A., N. Vlassis, and J. Verbeek. 2003. “The global -means clustering algorithm.” Pattern Recognit. 36 (2): 451–461. https://doi.org/10.1016/S0031-3203(02)00060-2.
Litman, T. 2014. Evaluating public transit benefits and costs—Best practices guidebook. Victoria, BC: Victoria Transport Policy Institute.
Lordan, O., J. M. Sallan, P. Simo, and D. Gonzalez-Prieto. 2014. “Robustness of the air transport network.” Transp. Res. Part E: Logist Transp. Rev. 68 (5): 155–163. https://doi.org/10.1016/j.tre.2014.05.011.
Lu, D. 2008. Route level bus transit passenger origin-destination flow estimation using APC data: Numerical and empirical investigations. Columbus, OH: Ohio State Univ.
Lusby, R. M., J. Larsen, and S. Bull. 2018. “A survey on robustness in railway planning.” Eur. J. Oper. Res. 266 (1): 1–15. https://doi.org/10.1016/j.ejor.2017.07.044.
Ma, F., W. Shi, K. F. Yuen, Q. Sun, X. Xu, Y. Wang, and Z. Wang. 2020. “Exploring the robustness of public transportation for sustainable cities: A double-layered network perspective.” J. Cleaner Prod. 265 (20): 121747. https://doi.org/10.1016/j.jclepro.2020.121747.
Martin, W. A., and N. A. McGuckin. 1998. Travel estimation techniques for urban planning. Washington, DC: Transportation Research Board. https://doi.org/10.17226/12445.
Metropolitan Council. 2009. Twin cities transit system performance evaluation. New York: Metropolitan Council.
Metropolitan Council. 2019. Transit system performance evaluation-twin cities metropolitan region. New York: Metropolitan Council.
Minneapolis City Council. 2019. Minneapolis 2040—The city’s comprehensive plan. Minneapolis: Minneapolis City Council.
Minnesota Geospatial Information Office. 2019. “Minnesota Geospatial commons website.” Accessed October 1, 2021. https://gisdata.mn.gov/.
Molloy, M., and B. Reed. 1995. “A critical point for random graphs with a given degree sequence.” Random Struct. Algorithms 6 (2–3): 161–180. https://doi.org/10.1002/rsa.3240060204.
Nian, G., F. Chen, Z. Li, Y. Zhu, and D. Sun. 2019. “Evaluating the alignment of new metro line considering network vulnerability with passenger ridership.” Transp. A: Transp. Sci. 15 (2): 1402–1418. https://doi.org/10.1080/23249935.2019.1599080.
Norris, F. H., S. P. Stevens, B. Pfefferbaum, K. F. Wyche, and R. L. Pfefferbaum. 2008. “Community resilience as a metaphor, theory, set of capacities, and strategy for disaster readiness.” Am. J. Commun. Psychol. 41 (1–2): 127–150. https://doi.org/10.1007/s10464-007-9156-6.
Opsahl, T., F. Agneessens, and J. Skvoretz. 2010. “Node centrality in weighted networks: Generalizing degree and shortest paths.” Soc. Networks 32 (3): 245–251. https://doi.org/10.1016/j.socnet.2010.03.006.
Pandit, S., and S. Gupta. 2011. “A comparative study on distance measuring approaches for clustering.” Int. J. Res. Comput. Sci. 2 (1): 29–31. https://doi.org/10.7815/ijorcs.21.2011.011.
Salama, M., M. Ezzeldin, W. El-Dakhakhni, and M. Tait. 2020. “Temporal networks: A review and opportunities for infrastructure simulation.” Sustainable Resilient Infrastruct. 10 (Sep): 1–16. https://doi.org/10.1080/23789689.2019.1708175.
Shen, Y., G. Ren, and B. Ran. 2019. “Cascading failure analysis and robustness optimization of metro networks based on coupled map lattices: A case study of Nanjing, China.” Transportation 48 (2): 537–553. https://doi.org/10.1007/s11116-019-10066-y.
Strogatz, S. H. 2001. “Exploring complex networks.” Nature 410 (6825): 268–276. https://doi.org/10.1038/35065725.
Sullivan, J. L., D. C. Novak, L. Aultman-Hall, and D. M. Scott. 2010. “Identifying critical road segments and measuring system-wide robustness in transportation networks with isolating links: A link-based capacity-reduction approach.” Transp. Res. Part A: Policy Pract. 44 (5): 323–336. https://doi.org/10.1016/j.tra.2010.02.003.
Sun, D. J., and S. Guan. 2016. “Measuring vulnerability of urban metro network from line operation perspective.” Transp. Res. Part A: Policy Pract. 94 (3): 348–359. https://doi.org/10.1016/j.tra.2016.09.024.
Sun, L., Y. Huang, Y. Chen, and L. Yao. 2018. “Vulnerability assessment of urban rail transit based on multi-static weighted method in Beijing, China.” Transp. Res. Part A: Policy Pract. 108 (5): 12–24. https://doi.org/10.1016/j.tra.2017.12.008.
Turnquist, M., and E. Vugrin. 2013. “Design for resilience in infrastructure distribution networks.” Environmentalist 33 (1): 104–120. https://doi.org/10.1007/s10669-012-9428-z.
US Census Bureau. 2019. “United States Census Bureau.” Accessed September 20, 2020. https://www.census.gov/quickfacts/fact/table/MN,minneapoliscityminnesota/PST045219.
Wang, J., H. Mo, F. Wang, and F. Jin. 2011. “Exploring the network structure and nodal centrality of China’s air transport network: A complex network approach.” J. Transp. Geogr. 19 (4): 712–721. https://doi.org/10.1016/j.jtrangeo.2010.08.012.
Wang, X., Y. Koç, S. Derrible, S. N. Ahmad, W. J. A. Pino, and R. E. Kooij. 2017. “Multi-criteria robustness analysis of metro networks.” Physica A 474 (Jan): 19–31. https://doi.org/10.1016/j.physa.2017.01.072.
Weilant, S., A. Strong, and B. Miller. 2019. Incorporating resilience into transportation planning and assessment. Santa Monica, CA: RAND Corporation.
White, D. R., and S. P. Borgatti. 1994. “Betweenness centrality measures for directed graphs.” Soc. Networks 16 (4): 335–346. https://doi.org/10.1016/0378-8733(94)90015-9.
Xu, J., and X. F. Wang. 2005. “Cascading failures in scale-free coupled map lattices.” Physica A 349 (3–4): 685–692. https://doi.org/10.1016/j.physa.2004.10.030.
Xu, X., J. Hu, F. Liu, and L. Liu. 2007. “Scaling and correlations in three bus-transport networks of China.” Physica A 374 (1): 441–448. https://doi.org/10.1016/j.physa.2006.06.021.
Yang, Y., Y. Liu, M. Zhou, F. Li, and C. Sun. 2015. “Robustness assessment of urban rail transit based on complex network theory: A case study of the Beijing Subway.” Saf. Sci. 79 (Nov): 149–162. https://doi.org/10.1016/j.ssci.2015.06.006.
Yang, Y., S. T. Ng, F. J. Xu, and M. Skitmore. 2018. “Towards sustainable and resilient high density cities through better integration of infrastructure networks.” Sustainable Cities Soc. 42 (Jan): 407–422. https://doi.org/10.1016/j.scs.2018.07.013.
Yassien, Y., M. Ezzeldin, M. Mohamed, and W. El-Dakhakhni. 2020. “Air transportation infrastructure robustness assessment for proactive systemic risk management.” J. Manage. Eng. 36 (4): 04020037. https://doi.org/10.1061/(ASCE)ME.1943-5479.0000789.
Zhang, J., F. Chen, and Q. Shen. 2019a. “Cluster-based LSTM network for short-term passenger flow forecasting in urban rail transit.” IEEE Access 7 (Dec): 147653–147671. https://doi.org/10.1109/ACCESS.2019.2941987.
Zhang, L., J. Lu, B. Fu, and S. Li. 2019b. “A cascading failures model of weighted bus transit route network under route failure perspective considering link prediction effect.” Physica A 523 (4): 1315–1330. https://doi.org/10.1016/j.physa.2019.04.122.
Zhang, L., J. Lu, B. B. Fu, and S. Li. 2018. “A review and prospect for the complexity and resilience of urban public transit network based on complex network theory.” Complexity. https://doi.org/10.1155/2018/2156309.
Zhang, X., and E. Miller-Hooks. 2015. “Scheduling short-term recovery activities to maximize transportation network resilience.” J. Comput. Civ. Eng. 29 (6): 04014087. https://doi.org/10.1061/(ASCE)CP.1943-5487.0000417.
Żochowska, R., and P. Soczówka. 2018. “Analysis of selected transportation network structures based on graph measures.” Zeszyty Naukowe. Gliwice, Poland: Politechnika Śląska.
Zou, Z., Y. Xiao, and J. Gao. 2013. “Robustness analysis of urban transit network based on complex networks theory.” Kybernetes 42 (3): 383–399. https://doi.org/10.1108/03684921311323644.
Information & Authors
Information
Published In

Journal of Transportation Engineering, Part A: Systems
Volume 148 • Issue 10 • October 2022
Copyright
This work is made available under the terms of the Creative Commons Attribution 4.0 International license, https://creativecommons.org/licenses/by/4.0/.
History
Received: Jul 28, 2021
Accepted: Mar 18, 2022
Published online: Aug 13, 2022
Published in print: Oct 1, 2022
Discussion open until: Jan 13, 2023
Authors
Metrics & Citations
Metrics
Citations
Download citation
If you have the appropriate software installed, you can download article citation data to the citation manager of your choice. Simply select your manager software from the list below and click Download.
Cited by
- Mohamad Abdul Nabi, Islam H. El-adaway, Rayan H. Assaad, Modeling Inflation Transmission among Different Construction Materials, Journal of Construction Engineering and Management, 10.1061/JCEMD4.COENG-13893, 150, 5, (2024).
- Mohamad Abdul Nabi, Bahaa Chammout, Islam H. El-adaway, Rayan H. Assaad, Ghiwa Assaf, Investigating Price Fluctuation Transmission among Construction Materials, Construction Research Congress 2024, 10.1061/9780784485286.035, (339-349), (2024).
- Muhammad Ali Moriyani, Lemlem Asaye, Chau Le, Tuyen Le, Network Theory–Based Approach to Data-Driven Assessment of Bidding Competition in Highway Construction, Journal of Management in Engineering, 10.1061/JMENEA.MEENG-5506, 40, 1, (2023).
- Mohamad Abdul Nabi, Amr Elsayegh, Islam H. El-adaway, Understanding Collaboration Requirements for Modular Construction and Their Cascading Failure Impact on Project Performance, Journal of Management in Engineering, 10.1061/JMENEA.MEENG-5440, 39, 6, (2023).
- Wei Bi, Kristen MacAskill, Jennifer Schooling, Old wine in new bottles? Understanding infrastructure resilience: Foundations, assessment, and limitations, Transportation Research Part D: Transport and Environment, 10.1016/j.trd.2023.103793, 120, (103793), (2023).
- He Li, Weiwen Peng, Sidum Adumene, Mohammad Yazdi, He Li, Weiwen Peng, Sidum Adumene, Mohammad Yazdi, A Sustainable Circular Economy in Energy Infrastructure: Application of Supercritical Water Gasification System, Intelligent Reliability and Maintainability of Energy Infrastructure Assets, 10.1007/978-3-031-29962-9_8, (119-135), (2023).
- Peng Wu, Yunfei Li, Chengbing Li, Invulnerability of the Urban Agglomeration Integrated Passenger Transport Network under Emergency Events, International Journal of Environmental Research and Public Health, 10.3390/ijerph20010450, 20, 1, (450), (2022).