Runoff Quantity and Quality from Amended Urban Residential Lawns
Publication: Journal of Sustainable Water in the Built Environment
Volume 8, Issue 4
Abstract
New residential landscapes in Florida are often installed on sandy fill soil that has been compacted (bulk densities ) during the home construction process. The goal of this study was to determine whether incorporating compost into new residential lawns could reduce stormwater runoff volumes and nutrient loadings. Before landscape installation, one of three treatments (null, tilled, and tilled with compost) were applied to the lawn area (60% of landscape) and after landscape installation was completed, approximately half of the lots were topdressed. Overall, drainage areas with compost-amended soils produced 2.5% less runoff than tilled soils, but did not produce less runoff than null soils. However, considering variability across storm events, amending soils resulted in lower event runoff depths compared with tilled and null treatments, with effective curve numbers of 77, 88, and 82, respectively. Neither total nitrogen (TN) nor total phosphorus (TP) concentrations or loadings were significantly different based on treatment or topdressing. Annualized TN loading rates were highest for tilled soils () and lowest for composted soils (). Tilled soils produced the greatest annualized phosphorus loading rates (), with null soils producing the lowest loading rates (). Results of this study indicate that amending compacted fill soils with compost prior to landscape installation decreased runoff volumes without increasing nutrient concentrations.
Introduction
Urbanization leads to increased runoff from watersheds due to the increase in total impervious area (TIA), particularly when TIA is directly connected impervious area (DCIA), where impervious surfaces are linked in series (e.g., roofs, driveways, gutters, stormwater collection systems) to prevent runoff from infiltrating into pervious areas, and efficiently convey stormwater from source areas to receiving waters. Runoff bypasses soil when conveyed more efficiently over impervious surfaces, eliminating opportunities for nutrient removal via filtering, uptake, and biological processes. Urban stormwater runoff is the second leading cause of impairment to streams, and as runoff increases due to lack of infiltration, it increases the potential of transporting nutrients into nearby surface waters (Paul and Meyer 2001; Nagy et al. 2012; Gregory et al. 2006). The increase in nitrogen loadings has the potential to accelerate eutrophication and algal blooms, leading to degraded surface waters (Beman et al. 2005; Lusk et al. 2020; Collins et al. 2010; Leopold 1986; Paul and Meyer 2001). The National Rivers and Streams Assessment found that 46% of the rivers and streams evaluated in the study were considered to be in “poor biological condition” (EPA 2016a) and that 21% of lakes are hypereutrophic (EPA 2016b), with nitrogen and phosphorus being the most prominent stressors for both.
Disconnecting impervious areas allows pervious areas to capture and infiltrate runoff, reducing runoff volumes and potential for nutrient exports. In medium- to high-density residential developments, on-lot pervious areas comprise lawns and landscape beds. After the residential development process, soils are often left more compacted than predevelopment and commonly function hydrologically less like pervious areas than credited (Gregory et al. 2006; Pitt et al. 1999; Bean and Dukes 2015; Chen et al. 2014). During the initial grading of a site before construction begins, or master grading of the site, the existing topsoil is either removed or buried under imported fill material that is generally low in organic matter (Chen et al. 2014; Hamilton and Waddington 1999; Shober and Toor 2008). During the construction process, soil compaction is necessary to provide a stable foundation by increasing load-bearing capacity, and reduces soil settling after construction (Multiquip 2011). However, vehicle traffic and vibrations also compact soils that will underlie landscape material (Kozlowski 1999). This, along with wetting and drying cycles, cause pores to consolidate and collapse, which increases bulk density and decreases porosity, infiltration rates, water-holding capacity, and plant available water (Kozlowski 1999; Cogger 2005; Gregory et al. 2006).
Mitigating compacted sandy soils by mechanically incorporating compost has been shown to increase water-holding capacity and infiltration rates, thus decreasing the runoff (Loper 2009; Landschoot and Mcnitt 1994; Pitt et al. 1999; Bean and Dukes 2015; Olson et al. 2013; Pandey 2005). However, the Bean and Dukes (2015) study only spanned 4 months and did not include vegetation on the mesocosm lysimeters, which may have affected infiltration and runoff rates. The study by Olson et al. (2013) assessed potential runoff only by simulation analysis, rather than direct runoff.
In Florida, where at least half of residential water use goes to landscape irrigation, improved soil quality could lead to significant water conservation if amended soils retained more water for landscape vegetation. However, studies evaluating the runoff reduction potential from compost amendments have been limited to the plot (Olson et al. 2013) or mesocosm scale (Pitt et al. 1999; Bean and Dukes 2015) rather than the catchment or subwatershed scale. These larger-scale implementations within real-world context can include factors omitted from smaller-scale controlled studies, such as effects from impervious areas or gutters, as well as homeowner behaviors and practices.
Amending soils with compost introduces a mostly stable source of nutrients. While the addition of compost to sandy soils increases organic matter and long-term water and nutrient retention (Cogger 2005), a labile fraction of nutrients is initially present within mature compost and may be flushed or leached from the material (Mullane et al. 2015). Nitrogen and phosphorus are common nutrients of concerns in receiving waters, and increasing nutrient exports could offset the benefits of runoff and irrigation reductions. Tilling without addition of any amendment is effective at mitigating soil compaction and may have similar benefits to incorporation of compost into soils without introducing a potential nutrient source. This would be a cheaper alternative as well because it avoids material and transport costs associated with compost. Topdressing, or spreading of finely screened material (3–6 mm) that can fall through the vegetative canopy (i.e., turfgrass blades), is another method for applying compost to turfgrass areas, typically at lower rates than when coarser amendments (6–12 mm) are incorporated into soil. Topdressing has received less attention from researchers. As opposed to destroying the surficial soil structure and existing vegetation with tillage when compost is incorporated into soil, topdressing of compost does not disturb the existing soil and vegetation structure, and may offer an alternative for established residential landscapes to reduce runoff by increasing soil organic matter, improving infiltration rates. Florida’s landscape industry has begun including compost topdressing in its landscape maintenance services as an alternative to conventional fertilizers to improve plant and soil health.
The goal of this study was to better understand the effects of compost introduction, via soil incorporation or topdressing, into residential landscapes in well-drained, sandy soils on runoff characteristics at the neighborhood scale or storm-drain inlet scale. The objectives of the research reported in this paper were to
•
evaluate effects of tilling alone, tilling with compost, and topdressing with compost on the hydrologic responses of residential soils; and
•
evaluate effects of tilling alone, tilling with compost, and topdressing with compost on runoff water quality.
Methods
Study Site
This research study was conducted in North Central Florida at On Top of the World (OTOW) Communities in southwest Ocala, Florida (29°05′41″ N, 82°16′13″ W), within the Sanctuary neighborhood. The dominant soil in this area is a Candler sand (hyperthermic, uncoated lamellic quartzipsamments; 95% sand, 4% silt, 1% clay) characterized as very deep, excessively drained, and very permeable (NRCS 2013). Although bulk density and infiltration rates were not measured in the exact study area, the bulk density was measured in the neighborhood’s model homes just north of the study area (Fig. 1). The average bulk densities for control, tilled, and composted soils were 1.76, 1.78, and , respectively. The soil’s light color indicates low organic content. The climate is characterized as subtropical, receiving on average 132 cm of rainfall per year.
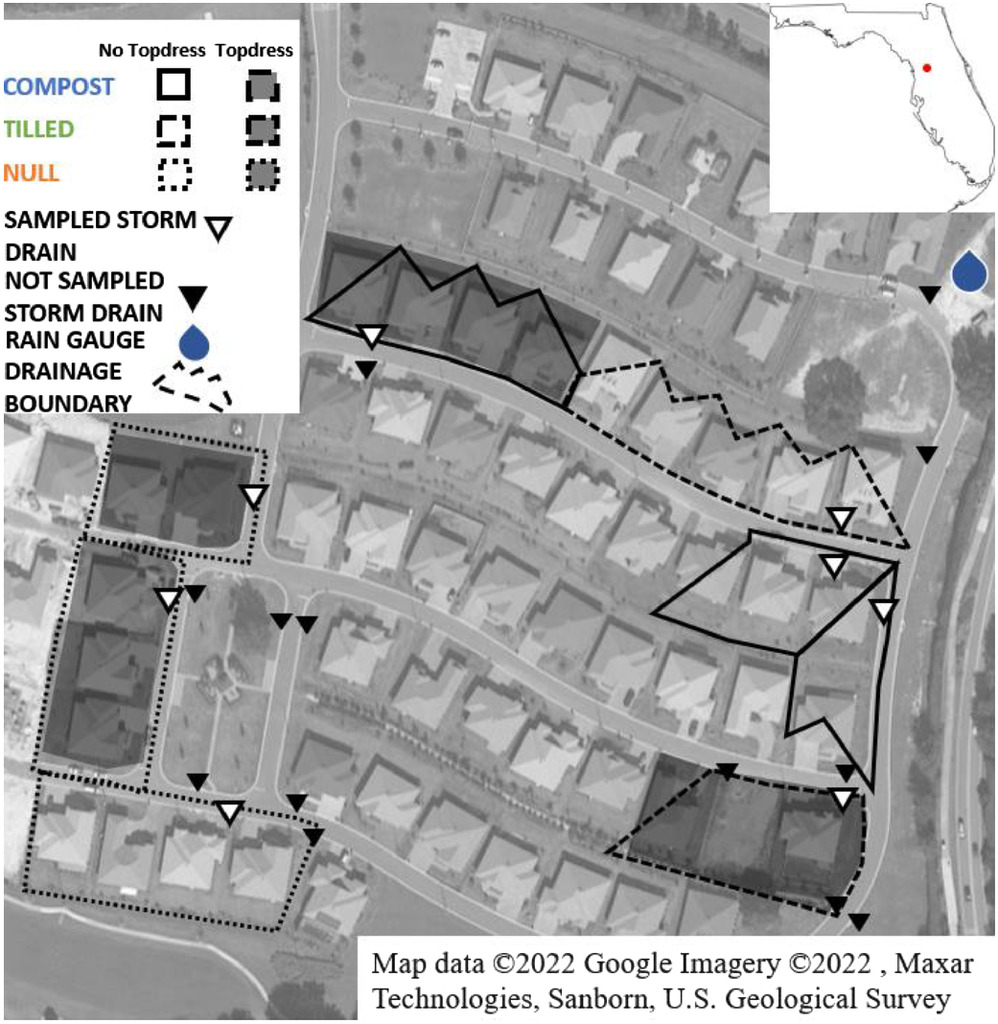
Eight subwatersheds were in this study, which included 24 residential lots where homes were constructed between 2018 and 2019. Each home’s landscape complied with Florida Water Star requirements and was approximately 60% lawn (Empire zoysiagrass) (Florida Water Star 2021). The 24 lots were divided into three soil treatments: tilled, tilled with compost (from now on referred to as “compost”), and null (Fig. 1). Additionally, lawns for 11 of the 24 lots were topdressed with compost on four occasions during the study. The compost product was COMAND Natural Soil Builder provided by LifeSoils (Sumterville, Florida), made from feedstocks of used horse stall bedding, yard waste, and landscape debris, and certified under the US Composting Council’s Seal of Testing Assurance. For incorporation, 1.3 cm screened compost was spread at and then tilled to a 15-cm depth prior to installation of the irrigation system and sod laying (Empire zoysiagrass). Topdressing material was screened to 0.64 cm and applied to the lawn areas at a rate of in May and September 2019 and June and September 2020.
A limitation of this study was the lack of treatment replicates. Due to budget and feasibility constraints, we were unable to capture runoff at the lot level and left to measure and collect runoff within storm drains. Thus, treatments were applied to uniformly to all lawns within a drainage area, rather than randomized across the study areas. This was done to ensure that there was only one treatment per storm drain.
Rainfall Data
Rainfall data were collected from an Onset RG3 tipping bucket rain gauge () located 380 m to the northeast at the OTOW Landscape Operations facility from July 2018 until May 2019, when a separate Onset RG3 tipping bucket rain gauge was installed on the northeast end of the neighborhood (Fig. 1), and provided data through October 2020. Incremental rainfall records were summed to determine storm event depths. A 6-h interevent dry period was used to distinguish rainfall records into separate, independent events. Over the course of 24 months, samples were taken from 24 storm events. The time between each storm event that was sampled from varied from 24 h to 2 months, ensuring that the storm events were independent of each other.
Runoff Flow Monitoring
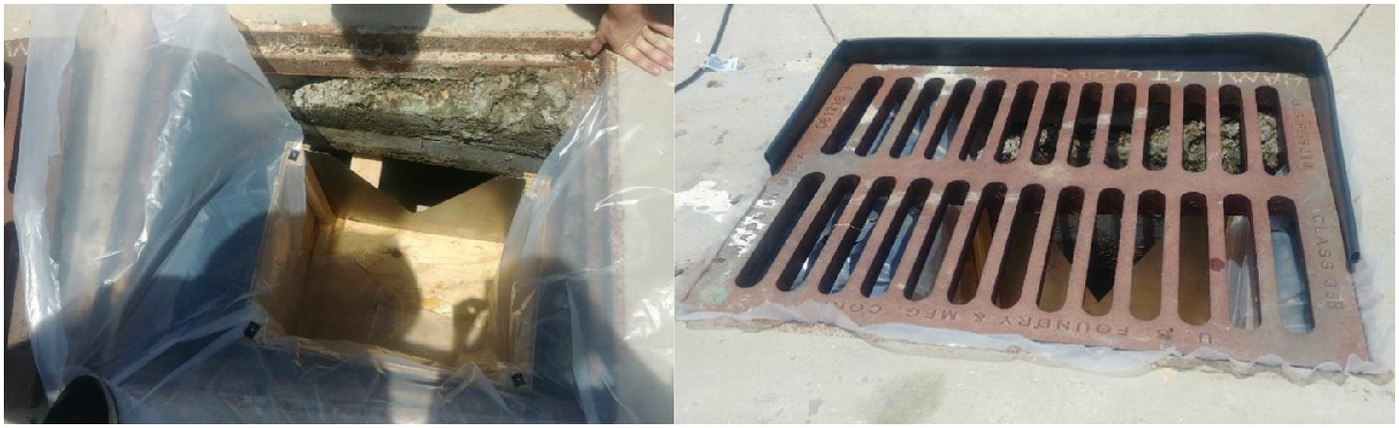
The 24 lots included in the study were split up into separate drainage areas so that each drain received runoff only from one treatment area (tilled, tilled with topdressing, compost, compost with topdressing, null, or null with topdressing) and the correct runoff volumes per treatment could be calculated. Four of the six treatment areas drained into individual catch basin inlets. The remaining two treatment areas (null with topdressing and non-topdressed composted) each drained to two catch basin inlets, resulting in eight total runoff collection points. The catch basin inlets were each equipped with a 60° weir box containing an Onset HOBO water level logger (U20-001-04) (Onset, Bourne, Massachusetts). A Visqueen plastic sheet (Uline, Prairie, Wisconsin) apron and a rigid plastic barrier were installed to direct all runoff into the weir box (Fig. 2). The apron was inspected and replaced as needed during the study. A separate HOBO logger was located on the side of a private residence for continuously recording atmospheric pressure for calculating water depths in each weir box.
Flow Analysis
Data from each water level logger were downloaded monthly, corrected for atmospheric fluctuations. Water-level time-series for each watershed were exported from HOBOware to Microsoft Excel. Water-level measurements were converted to flow rates using the Kindsvater-Shen equation (USBR 1997), which is written aswhere = discharge over weir in f ; = effective discharge coefficient; = effective head on the weir in ft; and = angle of V-notch. The flow rate was then converted from to .
(1)
Water-level and flow data were then reviewed for quality assurance and quality control. Most commonly, minor shifts in the depth to the weir invert were adjusted due to changes in the HOBO logger position between downloads. On a few occasions, sedimentation buried a logger and data were removed. Other validity checks included comparing flow patterns across watersheds and with rainfall patterns to reduce noise from water level fluctuations from sources other than precipitation (e.g., irrigation events). For precipitation events, water-level responses began and concluded at similar times for all storm drains. Flow records were compared across storm drains to identify flows that occurred independently of other storm drains; this step specifically screened nonprecipitation events where there were errors with the water-level loggers or during periods of ongoing construction within the drainage area. Runoff flow rates were used to calculate runoff volumes for individual storm events, which were then used to determine runoff depths based on drainage areas.
Drainage areas for each inlet were initially delineated using a GIS tool from the Marion County Property Appraiser website (MCPA 2022) and topographic surveys provided by OTOW, and subsequently verified in the field. Lot size information was gathered from the Marion County Property Appraiser site. The impervious area for each lot was also delineated from aerial imagery using the GIS tool from the Marion County site and aggregated for each drainage area. TIA ranged from 46% to 57% for all drainage areas.
Rainfall event totals were summed using a 6-h interevent dry period to separate storms. Event runoff volumes for each watershed were summed for each event and converted to depths. Storm events smaller than 1.27 cm were omitted from this analysis to screen out very small runoff depths and events that did not produce runoff. The SCS Curve Number Method is widely used to estimate runoff from rainfall depths, which was initially develop for agricultural applications but was later adapted and broadly applied to urban hydrologic modeling and designs (NRCS 1986). Curve number values range from 0 to 100, with greater values producing greater runoff depths, and depend on an area’s soil characteristics and land use, which includes amount and connectivity of impervious cover. Measured rainfall depths and runoff depths were used to estimate NRCS (1986) curve numbers for each storm event using Eqs. (2) and (3) (Hawkins 1993)where = watershed storage depth; = event rainfall depth; = runoff depth; and CN = curve number. An effective CN was determined for each treatment by running a regression against the inverse of rainfall depth based on Eqs. (2) and (3) (Hawkins 1993). For multiple drainage areas of the same soil and topdressing treatment, the CN for the two drainage areas was averaged to yield one treatment CN. For soil treatments, the two topdressed and non-topdressed CNs were averaged into one CN and, for topdressed or non-topdressed, the three respective CNs were averaged across soil treatments.
(2)
(3)
Runoff Quality
Approximately monthly stormwater runoff samples were collected via seven ISCO 6,712 and one ISCO 3,700 autosamplers (Teledyne ISCO, Lincoln, Nebraska) during rainfall events for each of the eight storm drains. The sample tube that collected the runoff was secured to the inner side of the weir box at the same elevation as the weir invert (notch). Autosamplers were programmed to collect 200 mL of runoff (if available) every 5 min, which were composited into a 10-L carboy. Composite samples were subsampled into two 20-mL vials within 3 h of a storm ending or the following morning for overnight storms. One duplicate sample was collected randomly from one of the eight ISCO autosamplers that collected runoff from storm drains for each storm event to ensure sample-to-sample consistency in analytical results. Subsamples were put on ice while transported to the UF/IFAS Environmental Water Quality Lab (EWQL) where they were stored a refrigerator at 4°C until they were analyzed.
Samples were analyzed by EWQL for nitrate () (EPA method 353.2), ammonium () (EPA method 350.1), total Kjeldahl nitrogen (TKN) (EPA method 351.2), and total phosphorus (TP) (EPA method 365.1). Organic nitrogen (Org N) was calculated as the difference between TKN and concentrations, and total nitrogen (TN) was calculated as the sum of TKN and concentrations.
While samples were collected on a time-weighted basis, due to the relatively small watershed size and short time of concentration, the resulting event concentrations were assumed to be reasonable estimates for flow-weighted samples and event mean concentrations. Event mean concentrations (EMC) were calculated using the following equation:where EMC = long-term event mean concentration in ; = event concentration in mg/L; and = cumulative event runoff volume (L).
(4)
Gaps in runoff data for part of the study period limited the direct calculation of loadings and loading rates. To fill the gaps, loading rates were estimated by multiplying the cumulative loadings from sampled events by the ratio of cumulative rainfall over the study period () to cumulative rainfall for events with runoff data (). Loadings were then divided by the study period in years () and the drainage area () to determine the annualized loading rates per area, as inwhere = loading rate in kg/ha/year; = cumulative loading from sampled events in kg; = cumulative rainfall over the study period in cm; = cumulative rainfall for sampled events in cm; = drainage area in ha; and = study period duration in years. This scaled up the sum of directly calculated loadings by the ratio of total rainfall to rainfall for sampled events.
(5)
Of the 24 storms sampled, 23 had TN concentrations under . One runoff sample in the tilled, non-topdressed treatment was identified as an outlier (, , October 20, 2019 event), as the concentration was three times greater than the next greatest concentration from that drainage are. This storm event, for all treatments, has been omitted from the data analyses of concentrations and loadings.
Statistical Analysis
In the field study, the ranges and means of CN, total runoff depths, and total runoff volumes were examined without looking at statistical differences, because they did not have enough replicates to be analyzed statistically. The following parameters were analyzed by running a mixed-effects model in RStudio version 1.3.959 (RStudio Team 2020) using lmer (Kuznetsova et al. 2017) and Tukey’s post hoc analysis to determine if they were significantly different () based on treatment type (compost, tilled, null), if topdressing were applied (yes, no), and if date was significant: , , TKN, Org. N, TN, and TP event concentrations and loadings, and annualized TN and TP loading rates. In this study, separate storm events were replicates and identified by their date, which was treated as a categorical variable. Treatment and topdressing were fixed effects, and drain numbers were random effects.
Nutrient concentrations and loadings were normalized by either square root (SR) transformation or log-transformation, and the lmer test and Tukey’s post hoc analyses were run. With the ANOVA model for concentrations and nutrient loadings, nonsignificant interaction terms were dropped, and the model was rerun to determine if any of the parameters (treatment, topdressing, date) were significant.
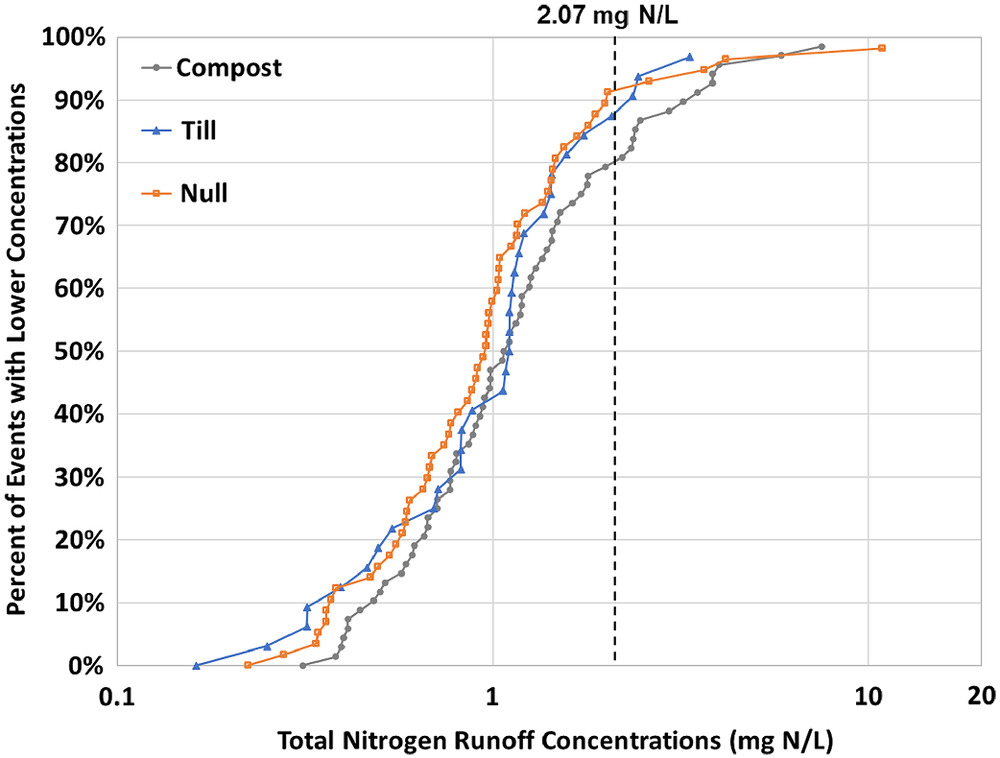
Differences in treatment area runoff concentrations were also compared by developing probability exceedance plots of TN and TP to assess whether the distributions of TN and TP differed.
Results and Discussion
Runoff Quantity
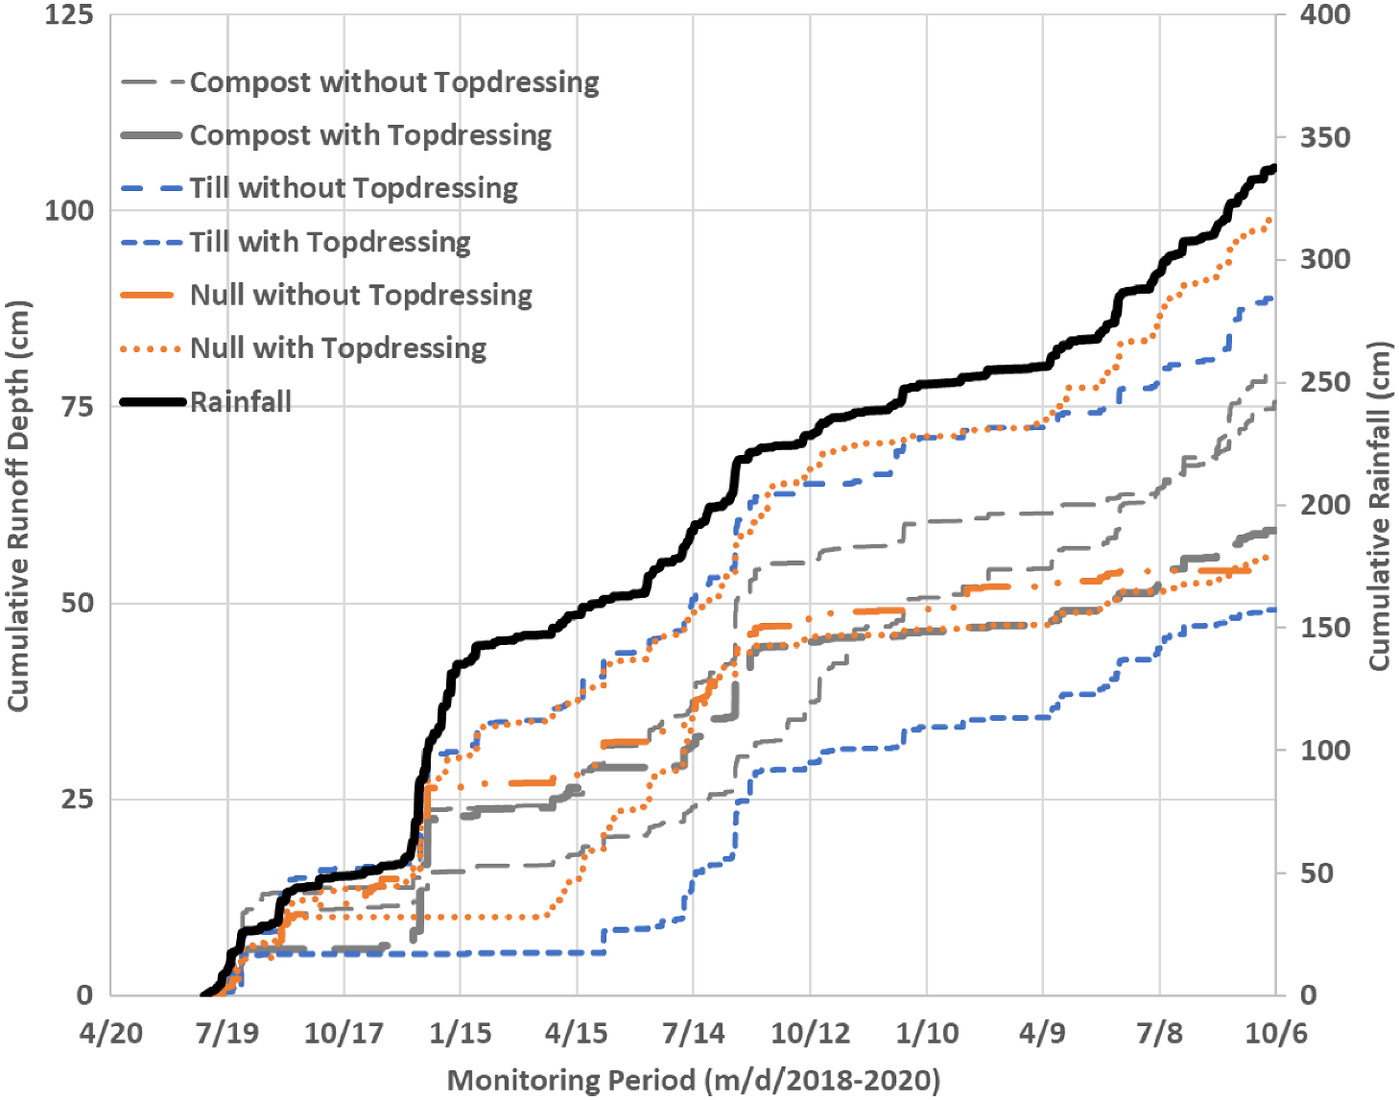
In our study, we found that lots that were amended with compost had a lower percent runoff produced and CN compared with tilled and null lots (Tables 1 and 2; Fig. 3). Similar patterns of compost reducing CN was found in other studies, e.g., Bean and Dukes (2015) and Olson et al. (2013), where CN and percent runoff produced were lowest in the compost-amended treatments compared with the other treatments, which were fly ash amendment and null, and tilled and null, respectively.
| Treatment | Drainage area (hectares) | Rainfall depth (cm) | Runoff depth (cm) | Runoff (%) |
|---|---|---|---|---|
| C-Y | 0.275 | 338 | 59 | 17 |
| C-N1 | 0.227 | 338 | 89 | 26 |
| C-N2 | 0.210 | 338 | 83 | 25 |
| T-Y | 0.328 | 217 | 69 | 32 |
| T-N | 0.393 | 338 | 89 | 26 |
| N-Y1 | 0.255 | 338 | 99 | 29 |
| N-Y2 | 0.397 | 235 | 69 | 29 |
| N-N | 0.457 | 291 | 62 | 21 |
Note: C = compost; T = tilled; N = null; Y = topdressed; and N = not topdressed.
| Extrema | Compost | Till | Null | Topdressing | No topdressing |
|---|---|---|---|---|---|
| Maximum | 85 | 91 | 87 | 91 | 84 |
| Median | 77 | 88 | 82 | 87 | 77 |
| Minimum | 68 | 84 | 77 | 85 | 68 |
| Mean | 77 | 88 | 82 | 88 | 76 |
| Standard deviation | 12 | 6 | 7 | 3 | 8 |
Overall, lots that were topdressed produced greater runoff percentages (Table 1) and CNs compared with lots that were not topdressed. Looking at the effects of topdressing on the individual treatments showed varied results. Due to limited replicates, the effects could not be statistically analyzed. However, null and tilled lots that were topdressed had increased runoff percentages and CNs compared to non-topdressed lots, while composted lots had increased CNs but lower runoff percentages. The mechanisms that caused greater runoff and increased CNs from topdressed null and tilled lots are not clear, although topdressing may somehow reduce storage within the vegetated layer above the soil or reduce the rate that rainfall is absorbed into the soil. These processes deserve further investigation because they are counter to expected runoff reductions due to increased soil organic matter and overall soil quality. As for the compost lots, increased CNs for topdressed lots correspond to null and tilled lots; however, overall runoff percentage was lower. While runoff percentages and CNs should typically increase or decrease together, CNs reflect the regressed runoff response to individual rainfall events, accounting for differences in rainfall amounts, while the runoff percentage reflects the cumulative runoff response regardless of rainfall characteristics. Future studies should focus on identifying and quantifying how topdressing applications affect mechanistic runoff processes from turfgrass landscapes.
Our study differed from that of Bean and Dukes (2015) by having a higher CN for compost amended lots (74) than Bean and Dukes did (40, 44, and 62) for their two soil types in question, Arredondo with compost amendment and Orangeburg with compost amendment. We also saw a smaller increase in percent of runoff produced between null and composted soils, an increase of 4%, compared with 53% increase in the Olson et al. (2013) study. Additionally, the Bean and Dukes (2015) and Olson et al. (2013) studies were carried out on sites that had different soils, which may be the reason for slight variation.
The main difference between the current study and previous studies analyzing amended soil and storm water runoff is that this study was carried out in the field, that is, in a full-scale residential development. Our study validates the extension of previous studies done on smaller scales to the catchment scale. This includes both pervious and impervious areas, whereas previous studies have only evaluated pervious areas. It demonstrates runoff reduction potential from amending urban soils with compost at the storm drain catchment scale.
Runoff Concentrations and Loadings
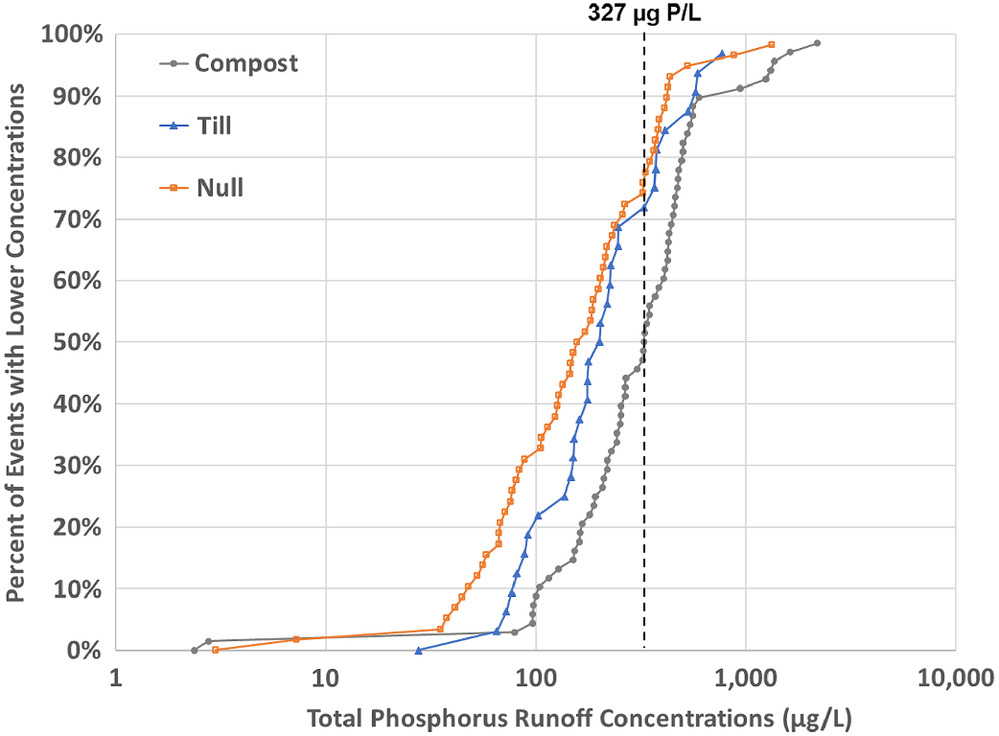
Overall, neither treatment nor topdressing had a significant effect on TN or TP concentrations in runoff. TN concentrations were log-transformed for analysis, and TP concentrations were square-root transformed for analysis. All but one value fell below (Table 3; Fig. 4), and the majority of concentrations were below (Table 4; Fig. 5). In comparison, the Florida Department of Environmental Protection (FDEP) uses and for estimating runoff loadings from medium density residential watersheds (Harper and Baker 2007). Date was the only significant factor for both TN and TP concentrations (TN: df: 22, F: 7.87, ; TP: df: 22, F: 4.52, ), which reflects the event-to-event variability in runoff concentrations. Additionally, nitrogen species concentrations were not significantly different across treatment or topdressing (Table 3).
| Nitrogen species | Compost | Till | Null | Topdressing | No topdressing |
|---|---|---|---|---|---|
| () | 0.25 | 0.19 | 0.20 | 0.21 | 0.22 |
| () | 0.10 | 0.07 | 0.09 | 0.09 | 0.08 |
| Org N () | 0.72 | 0.68 | 0.61 | 0.70 | 0.64 |
| TN () | 1.09 | 0.92 | 0.91 | 0.96 | 0.97 |
Note: Significant differences were evaluated separately for soil treatment and topdressing, but no significant differences were found based on a Tukey’s post hoc analysis.
| Extrema | Compost | Till | Null | Topdressing | No Topdressing |
|---|---|---|---|---|---|
| Maximum | 2,188 | 894 | 1,326 | 13,26 | 2,188 |
| Median | 326 | 202 | 164 | 232 | 219 |
| Minimum | 2 | 28 | 3 | 7 | 2 |
| Mean | 311 | 186 | 161 | 226 | 204 |
| Standard deviation range | 244,378 | 166,206 | 114,208 | 177,275 | 144,264 |
The TN EMC for null lots was , which was 14% lower than composted lots and 40% greater than tilled lots (Table 5). This was lower than that found in Lusk et al. (2020) for null lots (). Yang and Toor (2016), however, had a monthly mean concentration of , which is equivalent to results from this study. Similar to our results, Lusk et al. (2020) also showed that Org-N was the dominant form of nitrogen in stormwater runoff, making up about half of TN concentrations.
| Parameters | C-Y | C-N1 | C-N2 | T-Y | T-N | N-Y1 | N-Y2 | N-N |
|---|---|---|---|---|---|---|---|---|
| Total rainfall | 338 | 338 | 338 | 217 | 338 | 338 | 235 | 291 |
| TN event mean concentrations | 0.84 | 1.33 | 1.47 | 0.79 | 0.70 | 1.53 | 0.82 | 0.77 |
| TP event mean concentrations | 0.33 | 0.47 | 0.44 | 0.34 | 0.19 | 0.66 | 0.29 | 0.29 |
Neither treatment nor topdressing had a significant effect on event TN or TP loadings (kg/ha), which was expected given that concentrations were not significantly different (Tables 6 and 7). TN loadings were log-transformed and TP loadings were square-root transformed. Date was significant for both TN and TP event loading, which was likely because no two storm events or their antecedent conditions are the same. For TP loadings, the significant interaction of treatment and topdressing with date meant that date had an impact on how treatment and topdressing reacted in terms of TP loadings.
| Parameters | Degrees of freedom | Sum of squares | Mean of squares | value | -value |
|---|---|---|---|---|---|
| Treatment | 2 | 0.004 | 0.002 | 0.435 | 0.929 |
| Topdressing | 1 | 0.020 | 0.020 | 4.073 | 0.549 |
| Date | 22 | 1.546 | 0.070 | 13.99 | <0.001a |
| Treatment*Topdressing | 2 | 0.031 | 0.015 | 3.070 | 0.380 |
| Treatment*Date | 44 | 0.412 | 0.009 | 1.865 | 0.658 |
| Topdressing*Date | 21 | 0.262 | 0.124 | 2.486 | 0.446 |
aSignificant factors or interactions.
| Parameters | Degrees of freedom | Sum of squares | Mean of squares | value | -value |
|---|---|---|---|---|---|
| Treatment | 2 | 0.004 | 0.002 | 0.435 | 0.670 |
| Topdressing | 1 | 0.020 | 0.020 | 4.073 | 0.078 |
| Date | 22 | 1.546 | 0.070 | 13.99 | a |
| Treatment*Topdressing | 2 | 0.031 | 0.015 | 3.070 | 0.118 |
| Treatment*Date | 44 | 0.412 | 0.009 | 1.865 | 0.014a |
| Topdressing*Date | 21 | 0.262 | 0.124 | 2.486 | 0.004a |
aSignificant factors or interactions.
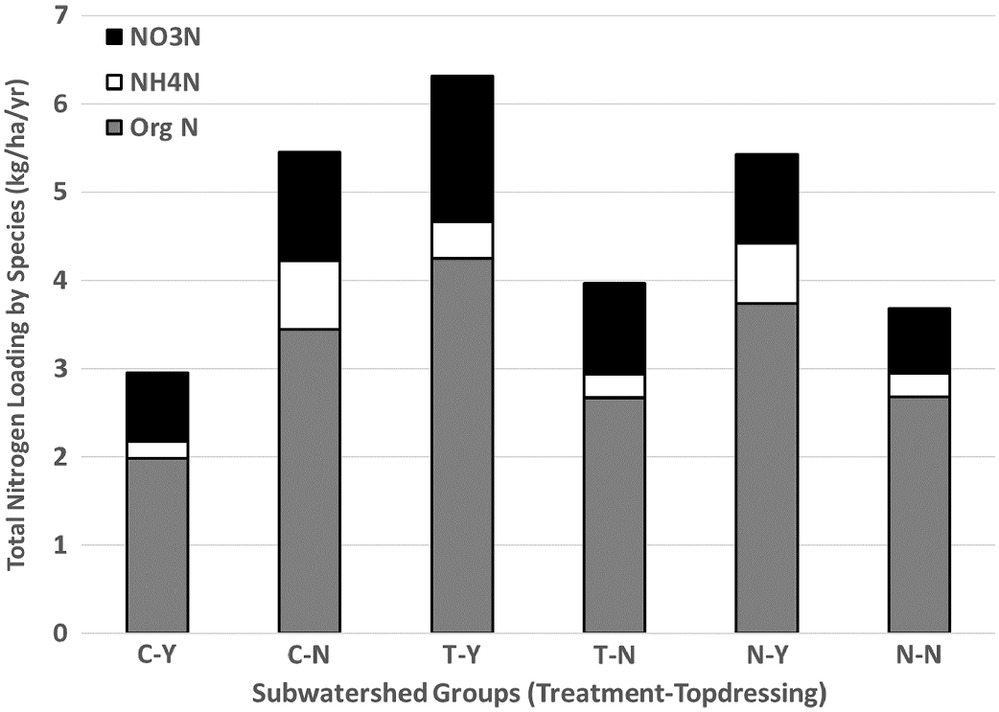
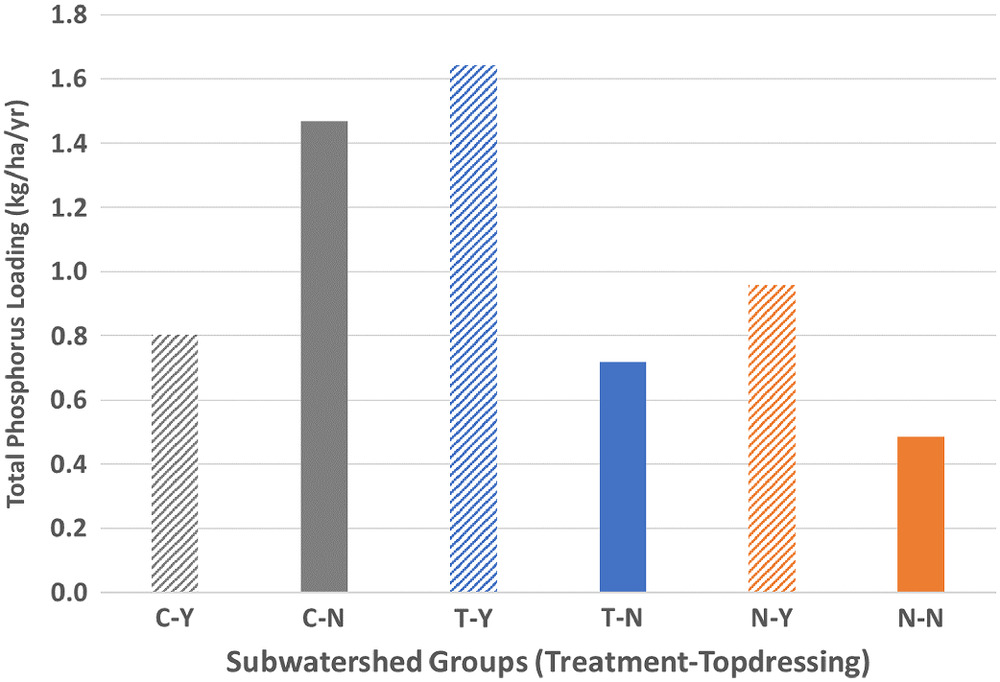
The highest annual loading rate for TN was produced by tilled lots () and least by compost amended lots () (Table 8; Fig. 6). In comparison, Obreza (2004) states that for a single-family residential area, the typical loading in north Florida for annual TN loading is , which is greater than the amount of TN loading from any treatments in the current study. For TP annual loading rates, tilled lots produced the highest, while null lots produced the least (Table 8; Fig. 7).
| Nutrients | C-Y | C-N | T-Y | T-N | N-Y | N-N |
|---|---|---|---|---|---|---|
| TN | 2.95 | 5.46 | 6.32 | 3.96 | 5.43 | 3.68 |
| TP | 0.80 | 1.47 | 1.64 | 0.72 | 0.96 | 0.49 |
Overall, lots that were topdressed had higher TN and TP annual loading rates than lots that were not topdressed. However, topdressed tilled and null lots had lower annual loading rates than their non-topdressed counterparts. This was not the case for composted lots, which had higher rates from the topdressed lots compared with the non-topdressed lots. Thus, further research is needed to better understand the effects that topdressing has on TN and TP annual loading rates, and to potentially further examine the effect topdressing has on lots that were already composted.
A drawback of this study was the limited sample size (eight storm drains) and low replicates in each treatment area (one or two storm drains per treatment), which would increase confidence of significant differences. To improve the study, there could have been a greater replication of treatments to better understand the impacts of treatment type and topdressing. A longer time frame, in addition, may have yielded more consistent results, given that there was a sample collected for every storm drain for only four of the 16 sampled storm events. There were also challenges with coordinating during construction and with landscaping crews within the development process.
Conclusions
This study demonstrated that incorporating compost into compacted sandy soils in residential landscapes reduced runoff depths. Tillage alone increased runoff depths compared with compacted soils in this study, and thus, including an amendment with tillage was necessary to mitigate the hydrologic effects of soil compaction that occurs during residential construction. The amendment likely helps establish a resilient soil structure for noncohesive soil particles that inhibits settling and reconsolidation under irrigation and landscape traffic.
Although compost can be a source of N and P, the combined reduction in runoff volumes resulted in similar runoff loadings for N and P across treatments. Future research should investigate the relationship between amendment rates, other than , on runoff volumes and nutrient loadings to optimize applications for intended outcomes. As results for topdressing were generally inconclusive, future research should also investigate the effect of topdressing lawns with compost and the impact of runoff volumes and loadings. Additionally, future studies should examine the implications that compost incorporation and topdressing have on nonsandy soils, as the responses may differ from our study.
Results from this study support the following conclusions and recommendations:
1.
Incorporating compost into compacted sandy soils with compost decreases runoff production from residential lots, with CNs of 77 compared with 82 for compacted soils.
2.
Compost incorporation of soils should be credited for reducing stormwater runoff volumes from impervious areas draining to them, as long as the amended areas are maintained in good condition. If gutters are used to direct runoff to amended areas, caution should be exercised as to avoid erosion or soil washout.
3.
Overall, runoff nutrient concentrations were similar across treatments, indicating that the driving factor determining loadings was volume. Therefore, any loading reduction should be dependent primarily on factors affecting runoff volumes, such as pervious area, contributing impervious area, amended soil depth, and soil porosity.
4.
Compost materials are widely available and vary greatly in quality. Compost should meet certain minimum criteria, such as the US Composting Council’s Seal of Testing Assurance, to be credited. Future research should identify properties of compost products that yield runoff reductions when used in soil amendment applications.
5.
Nutrient runoff loadings were not significantly lower for soils amended with compost at a rate of . Decreased rates may yield reduced runoff loadings compared with conventional lots and should be investigated.
6.
While runoff nutrient loadings were similar to null lots, this study did not consider the potential for leaching of nutrients from the amended soils and the impact on groundwater quality. Both surficial and subsurface nutrient pathways should be assessed, particularly for areas where groundwater is vulnerable to nitrogen loadings from the land surface.
Data Availability Statement
All data that support the findings of this study are available for download from https://bit.ly/3lcBknu.
Acknowledgments
Financial support was provided by Southwest Florida Water Management District (SWFWMD). The authors thank On Top of the World Communities in Ocala, Florida, for allowing the research to take place there. The homeowners who took part in this research were vital to this study, as were the staff from the Agricultural and Biological Engineering Department at the University of Florida. We also thank the two anonymous reviewers whose comments and suggestions greatly improved this work.
References
Bean, E. Z., and M. D. Dukes. 2015. “Effect of amendment type and incorporation depth on runoff from compacted sandy soils.” J. Irrig. Drain. Eng. 141 (6): 04014074. https://doi.org/10.1061/(ASCE)IR.1943-4774.0000840.
Beman, J. M., K. R. Arrigo, and P. A. Matson. 2005. “Agricultural runoff fuels large phytoplankton blooms in vulnerable areas of the ocean.” Nature 434 (7030): 211–214. https://doi.org/10.1038/nature03370.
Chen, Y., S. D. Day, A. F. Wick, and K. J. McGuire. 2014. “Influence of urban land development and subsequent soil rehabilitation on soil aggregates, carbon, and hydraulic conductivity.” Sci. Total Environ. 494 (Oct): 329–336. https://doi.org/10.1016/j.scitotenv.2014.06.099.
Cogger, C. G. 2005. “Potential compost benefits for restoration of soils disturbed by urban development.” Compost Sci. Util. 13 (4): 243–251. https://doi.org/10.1080/1065657X.2005.10702248.
Collins, K. A., T. J. Lawrence, E. K. Stander, R. J. Jontos, S. S. Kaushal, T. A. Newcomer, N. B. Grimm, and M. L. Cole Ekberg. 2010. “Opportunities and challenges for managing nitrogen in urban stormwater: A review and synthesis.” Ecol. Eng. 36 (11): 1507–1519. https://doi.org/10.1016/j.ecoleng.2010.03.015.
EPA. 2016a. National lakes assessment 2012: A collaborative survey of lakes in the United States. EPA 841-R-16-113. Washington, DC: Office of Water and Office of Research and Development.
EPA. 2016b. National rivers and streams assessment 2008–2009: A collaborative survey. EPA 841-R-16/007. Washington, DC: Office of Water and Office of Research and Development.
Florida Water Star. 2021. “Florida water star technical manual.” Accessed July 25, 2019. https://floridawaterstar.com/technicalmanual/.
Gregory, J. H., M. D. Dukes, P. H. Jones, and G. L. Miller. 2006. “Effect of urban soil compaction on infiltration rate.” J. Soil Water Conserv. 61 (3): 117–124.
Hamilton, G. W., and D. V. Waddington. 1999. “Infiltration rates on residential lawns in central Pennsylvania.” J. Soil Water Conserv. 54 (3): 564–568.
Harper, H. H., and D. Baker. 2007. “Evaluation of current stormwater design criteria within the state of Florida.” Accessed December 5, 2019. http://www.erd.org/ERD%20Publications/EVAL%20OF%20CURRENT%20SW%20DESIGN%20CRITERIA%20WITHIN%20THE%20STATE%20OF%20FLA-2007.pdf.
Hawkins, R. 1993. “Asymptotic determination of runoff curve number from data.” J. Irrig. Drain. Eng. 119 (2): 334–345. https://doi.org/10.1061/(ASCE)0733-9437(1993)119:2(334).
Kozlowski, T. T. 1999. “Soil compaction and growth of woody plants.” Scand. J. For. Res. 14 (6): 596–619. https://doi.org/10.1080/02827589908540825.
Kuznetsova, A., P. B. Brockhoff, and R. H. B. Christensen. 2017. “lmerTest package: Tests in linear mixed effects models.” J. Stat. Software 82 (13): 1–26. https://doi.org/10.18637/jss.v082.i13.
Landschoot, P., and M. A. Mcnitt. 1994. “Selecting composts to improve your turf.” Michigan Turfgrass Conf. Proc. 3 (12): 1–5.
Leopold, L. B. 1986. Hydrology for urban land planning: A guidebook on the hydrologic effects of urban land use. Washington, DC: USGS.
Loper, S. 2009. “Effects of compost and tillage on soils and nutrient losses in a simulated residential landscape.” M.S. thesis, Dept. of Soil and Water Science, Univ. of Florida.
Lusk, M. G., G. S. Toor, and P. W. Inglett. 2020. “Organic nitrogen in residential stormwater runoff: Implications for stormwater management in urban watersheds.” Sci. Total Environ. 707 (Mar): 135962. https://doi.org/10.1016/j.scitotenv.2019.135962.
MCPA (Marion County Property Appraiser). 2022. “Beta Map It+.” Accessed October 5, 2018. https://www.pa.marion.fl.us/patviewer/.
Mullane, J. M., M. Flury, H. Iqbal, P. M. Freeze, C. Hinman, C. G. Cogger, and Z. Shi. 2015. “Intermittent rainstorms cause pulses of nitrogen, phosphorus, and copper in leachate from compost in bioretention systems.” Sci. Total Environ. 537 (Dec): 294–303. https://doi.org/10.1016/j.scitotenv.2015.07.157.
Multiquip. 2011. “Soil compaction handbook.” Accessed September 15, 2018. http://www.multiquip.com/multiquip/pdfs/Soil_Compaction_Handbook_low_res_0212_DataId_59525_Version_1.pdf.
Nagy, C. R., G. B. Lockaby, L. Kalin, and C. Anderson. 2012. “Effects of urbanization on stream hydrology and water quality: The Florida Gulf Coast.” Hydrol. Processes 26 (13): 2019–2030. https://doi.org/10.1002/hyp.8336.
NRCS (National Resource Conservation Service). 1986. “Technicalrelease-55: Urban hydrology for small watersheds.” Accessed September 1, 2020. https://www.nrcs.usda.gov/Internet/FSE_DOCUMENTS/stelprdb1044171.pdf.
NRCS (Natural Resources Conservation Service). 2013. “United States Department of Agriculture. Web soil survey.” Accessed September 1, 2020. http://websoilsurvey.sc.egov.usda.gov/.
Obreza, T. 2004. “Florida springs land use information tool.” Accessed January 20, 2020. https://ufdc.ufl.edu/IR00004236/00001.
Olson, N. C., J. S. Gulliver, J. L. Nieber, and M. Kayhanian. 2013. “Remediation to improve infiltration into compact soils.” J. Environ. Manage. 117 (Mar): 85–95. https://doi.org/10.1016/j.jenvman.2012.10.057.
Pandey, C. 2005. “Effects of water table management and organic amendment on water quantity and quality in south Florida.” M.S. thesis, Dept. of Agricultural and Biological Engineering, Univ. of Florida.
Paul, M. J., and J. L. Meyer. 2001. “Streams in the urban landscape.” Annu. Rev. Ecol. Evol. Syst. 32 (1): 333–365. https://doi.org/10.1146/annurev.ecolsys.32.081501.114040.
Pitt, R., R. Harrison, C. Henry, D. Xue, and T. O’Conner. 1999. Infiltration through disturbed urban soils and compost-amended soil effects on runoff quality and quantity. Washington, DC: US EPA.
RStudio Team. 2020. “RStudio: Integrated development for R.” Accessed May 1, 2019. http://www.rstudio.com/.
Shober, A. L., and G. S. Toor. 2008. Soils and fertilizers for master gardeners: Urban soils and their management issues. Gainesville, FL: Univ. of Florida Institute of Food and Agricultural Sciences.
USBR (United States Bureau of Reclamation). 1997. “Water measurement manual: A water resources technical publication.” Accessed May 1, 2019. https://www.usbr.gov/tsc/techreferences/mands/wmm/WMM_3rd_2001.pdf.
Yang, Y.-Y., and G. S. Toor. 2016. “ and reveal the sources of nitrate-nitrogen in urban residential stormwater runoff.” Environ. Sci. Technol. 50 (6): 2881–2889. https://doi.org/10.1021/acs.est.5b05353.
Information & Authors
Information
Published In

Journal of Sustainable Water in the Built Environment
Volume 8 • Issue 4 • November 2022
Copyright
This work is made available under the terms of the Creative Commons Attribution 4.0 International license, https://creativecommons.org/licenses/by/4.0/.
History
Received: Sep 10, 2021
Accepted: Apr 14, 2022
Published online: Jul 1, 2022
Published in print: Nov 1, 2022
Discussion open until: Dec 1, 2022
ASCE Technical Topics:
- Biological processes
- Compacted soils
- Composting
- Design (by type)
- Earth materials
- Engineering fundamentals
- Environmental engineering
- Fills
- Geomaterials
- Geomechanics
- Geotechnical engineering
- Hydrologic engineering
- Hydrology
- Infrastructure
- Landscaping
- Load factors
- Loading rates
- Nutrient pollution
- Pollution
- Runoff
- Soil mechanics
- Soils (by type)
- Structural design
- Urban and regional development
- Urban areas
- Waste management
- Water and water resources
- Water pollution
Authors
Metrics & Citations
Metrics
Citations
Download citation
If you have the appropriate software installed, you can download article citation data to the citation manager of your choice. Simply select your manager software from the list below and click Download.