Stormwater Management Adaptation Pathways under Climate Change and Urbanization
Publication: Journal of Sustainable Water in the Built Environment
Volume 8, Issue 4
Abstract
Urban runoff volumes and flow peaks are likely to increase in the future owing to climate change–driven effects on rainfall and continued urbanization. Actionable planning estimates that anticipate these impacts are needed to assess stormwater management infrastructure requirements and to minimize impacts on ecosystem services. This study presents a planning-level simple flow simulation tool and quantifies benefits of green stormwater management practices in small watersheds. Flow simulation was performed using a curve number–based watershed model (CWM). A portfolio approach was used to assess cost-optimal stormwater adaptation pathways considering a suite of alternative practices including both gray and green infrastructure. The CWM provides actionable information for medium to highly urbanized watersheds with percent bias less than 30% for highly urbanized watersheds. Considering projected future stormwater needs, analysis of multiple stormwater management approaches showed that green stormwater management alternatives are less cost-optimal than gray infrastructure at small watershed scales. These results suggest the possible use of CWM for quick planning-level flow estimates and analysis of more green practices for cost-optimal alternatives.
Practical Applications
This research focuses on the use of best management practices (BMPs) to mitigate water-driven impacts, especially flooding, caused by climate change and urbanization. Present and future conditions in several urban counties in the US state of Maryland are used to illustrate the application of planning-level models for managing stormwater. This paper examines both the costs and benefits of BMPs that fall into two broad categories: gray and green. A gray BMP is a traditional human-made construction generally built to limit flooding, but not intending to provide ecological functions. In contrast, green BMPs are tools that seek to restore or promote ecological processes while managing stormwater.
In this research we developed a portfolio of BMPs to mitigate increased stormwater runoff resulting from climate change alone or in combination with different degrees of urbanization within several watersheds. The results generally showed that if the sole objective of the BMPs is flood control, gray infrastructure is more cost-effective than green infrastructure. Green infrastructure becomes more cost-effective when including important cobenefits in the evaluation.
Introduction
Numerous studies have assessed the resilience of existing urban stormwater infrastructure in a built environment under projected climate change and urbanization (Miller and Hutchins 2017; Saraswat et al. 2016; Gersonius et al. 2012; Rosenberg et al. 2010; Hamin and Gurran 2009). However, a major limitation is the understanding of how the use of green stormwater management practices affects ecosystem services (Prudencio and Null 2018). In addition, use of climate projections presents some serious challenges such as direction and magnitude of climate change (Willems et al. 2012; Kwadijk et al. 2010; Dessai and Sluijs 2007; Cox and Stephenson 2007) and their subsequent use for hydrological assessment (Teutschbein and Seibert 2012; Fowler et al. 2007; Wood et al. 2004).
Green stormwater management practices are effective to control runoff volume and to provide ecosystem services (Dhakal and Chevalier 2016; Vogel et al. 2015). The literature reflects a variety of stormwater management studies providing or addressing a subcategory of ecosystem services: provisioning (Gittleman et al. 2017; Ackerman 2012), regulating (Ishimatsu et al. 2017; Klimas et al. 2016; Chen et al. 2014; Doherty et al. 2014; Berland and Hopton 2014), cultural (Attwater and Derry 2017; Kati and Jari 2016), and social (Kopecka et al. 2017; Hassall 2014). According to a detailed review by Prudencio and Null (2018), stormwater management research related to ecosystem services has focused on the parcel size but lacks studies in small watersheds. In addition, they also found a lack of robust metrics for ecosystem services quantification in the developing world; they noted weak integration of physical science and engineering with social science; and they detected barriers in implementation (such as lack of financial and political support).
The use of the triple-bottom-line approach (USEPA 2015), i.e., environmental (improved air quality and habitat restoration), economic (job creation, development, and increased property values), and social benefits (recreational opportunities and reduction in crime), is a needed direction to obtain a holistic view of green stormwater management practice benefits as a guide for local governments (Environmental Finance Center, University of Maryland 2017). Some of the major limitations of such a proposed holistic view are the lack of valuation data, which often requires the transfer of estimated economic values for ecosystem services based on other studies to a different location and context (Johnston et al. 2015; Freeman 2014), modeling limitations (Jayasooriya and Ng 2014), knowledge gaps regarding the benefits and effectiveness of single or a combination of different practices in small watersheds (Connop et al. 2016; Vogel et al. 2015), and rarely quantified social benefits (Prudencio and Null 2018). In this study, we explore modeling limitations and benefits of green stormwater management practices to understand how specific practices affect ecosystem services in small watersheds.
Climate adaptation strategies are constructed using either predictive top-down or bottom-up approaches (Dessai and Slujis 2007; Carter et al. 2007). Top-down approaches, even though widely applied for climate scenarios impact assessment (Carter et al. 2007; Adger et al. 2007), are limited due to strong reliance on climate projections, which require downscaling for regional or local hydrologic impact assessment (Willems et al. 2012; Chen et al. 2011; Schmidli et al. 2006). Bottom-up approaches can focus more on local adaptive capacity and adaptation measures and are more independent from climate projections (Kwadijk et al. 2010), but still have constraints such as lengthy assessment time, complexity to compare all drivers, and potentially greater reliance on judgment than quantitative results. These bottom-up approaches are often considered to be more promising than what they deliver (Patt et al. 2005; Füssel 2007). In addition, adaptation under uncertainty in climate, technology, socioeconomic, and political factors troubles decision makers (Kwakkel et al. 2016; Haasnoot et al. 2013). Therefore, capacity and effectiveness of stormwater management systems under changing climate through adaptive measures is an active and growing research domain (Moore et al. 2016).
In this study, stormwater management pathways (SMPs) are constructed as adaptation strategies under changing climate and urbanization using climate stress and optimal cost considerations. The SMP approach is used to enhance the system by providing enough stormwater infrastructure to be effective under future climate to control set targets (such as control of 80%, 90%, or 100% of increased surface runoff). The target control level can be made through stakeholder involvement or thresholds set by the USEPA. However, a threshold of 99% or greater control in runoff increases was used in this study.
The enhancement of stormwater infrastructure resilience under climate change and urbanization requires adaptation strategies such as gray, green, and combined gray and green infrastructure (Moore et al. 2016). The conventional gray infrastructure approach focuses only on quickly removing stormwater from urban areas, whereas a sustainable management perspective sees stormwater as a resource (groundwater replenishment and rainwater collection and storage for use at home, marketplace, and landscape irrigation) with benefits for society and environment (Goulden et al. 2018; Fletcher et al. 2015; Barbosa et al. 2012; Roy et al. 2008; Mitchell 2006). Sustainable stormwater management is possible with implementation of green practices (or green infrastructure) in urban areas (Fletcher et al. 2015; Benedict and McMohan 2006). Green infrastructure (GI) refers to low-impact development (LID), sustainable urban drainage systems (SUDS), water-sensitive urban design (WSUD), and low-impact urban design and development (LIUDD) (Fletcher et al. 2015; Elliott and Trowsdale 2007).
Apart from the primary objective of flood protection (Demuzene et al. 2014), GI also improves air quality (Jayasooriya et al. 2017) and human health (Tzoulas et al. 2007), preserves ecosystems (Benedict and McMohan 2006), and reduces the urban heat-island effect (Gill et al. 2007). The potential of GI to mitigate flooding, even partially, led to consideration of GI as an integral component of climate change adaptation (Gaffin et al. 2012). However, the categorization of GI practices with ecosystem services has been less studied (Prudencio and Null 2018). With realized benefits of GI, more research is needed to assess incorporation of GI practices with conventional practices, and cost of GI compared with conventional engineering approaches for climate change adaptation (Moore et al. 2016). Therefore, this research explored SMPs as part of adaptation under climate change through scenarios combining climate change and urbanization. These pathways include gray, green, and gray combined with green infrastructure.
The anticipated increase in urban population (United Nations 2018), extreme weather events (Georgakakos et al. 2014; Kirtman et al. 2013), and urbanization (Jiang and O’Neill 2017; Brown et al. 2014) all require sustainable management of stormwater as a resource for potential use, such as household use and landscape irrigation, in cities (Barbosa et al. 2012; Sundberg et al. 2004). Mitigating stormwater hazards while harnessing stormwater resources requires an integrated urban water management modeling approach (Kirshen et al. 2018; Zhou 2014; Bahri 2012). However, urban catchment modeling is challenged by the complexity of physical systems and limited data of existing stormwater infrastructure (Elga et al. 2015). The ideal path forward in identifying adaptation strategies is through detailed space-time analysis of existing stormwater infrastructure with use of an urban hydrologic model of reasonable accuracy under anticipated change in climate and urbanization.
The pragmatic way forward is to recognize data limitations that constrain potential model complexity. According to Gan et al. (1997), a simple model structure is appropriate if the output is rational. Owing to the complexity of urban catchment models and the difficulty of acquiring existing stormwater infrastructure information, this study uses (1) a curve number–based watershed model (CWM) to obtain good flow simulation accuracy for stormwater assessment in small urban watersheds, and (2) SMPs to quantify added benefits of GI to retain increased runoff under climate change and urbanization in small urban watersheds.
Materials and Methods
Study Region
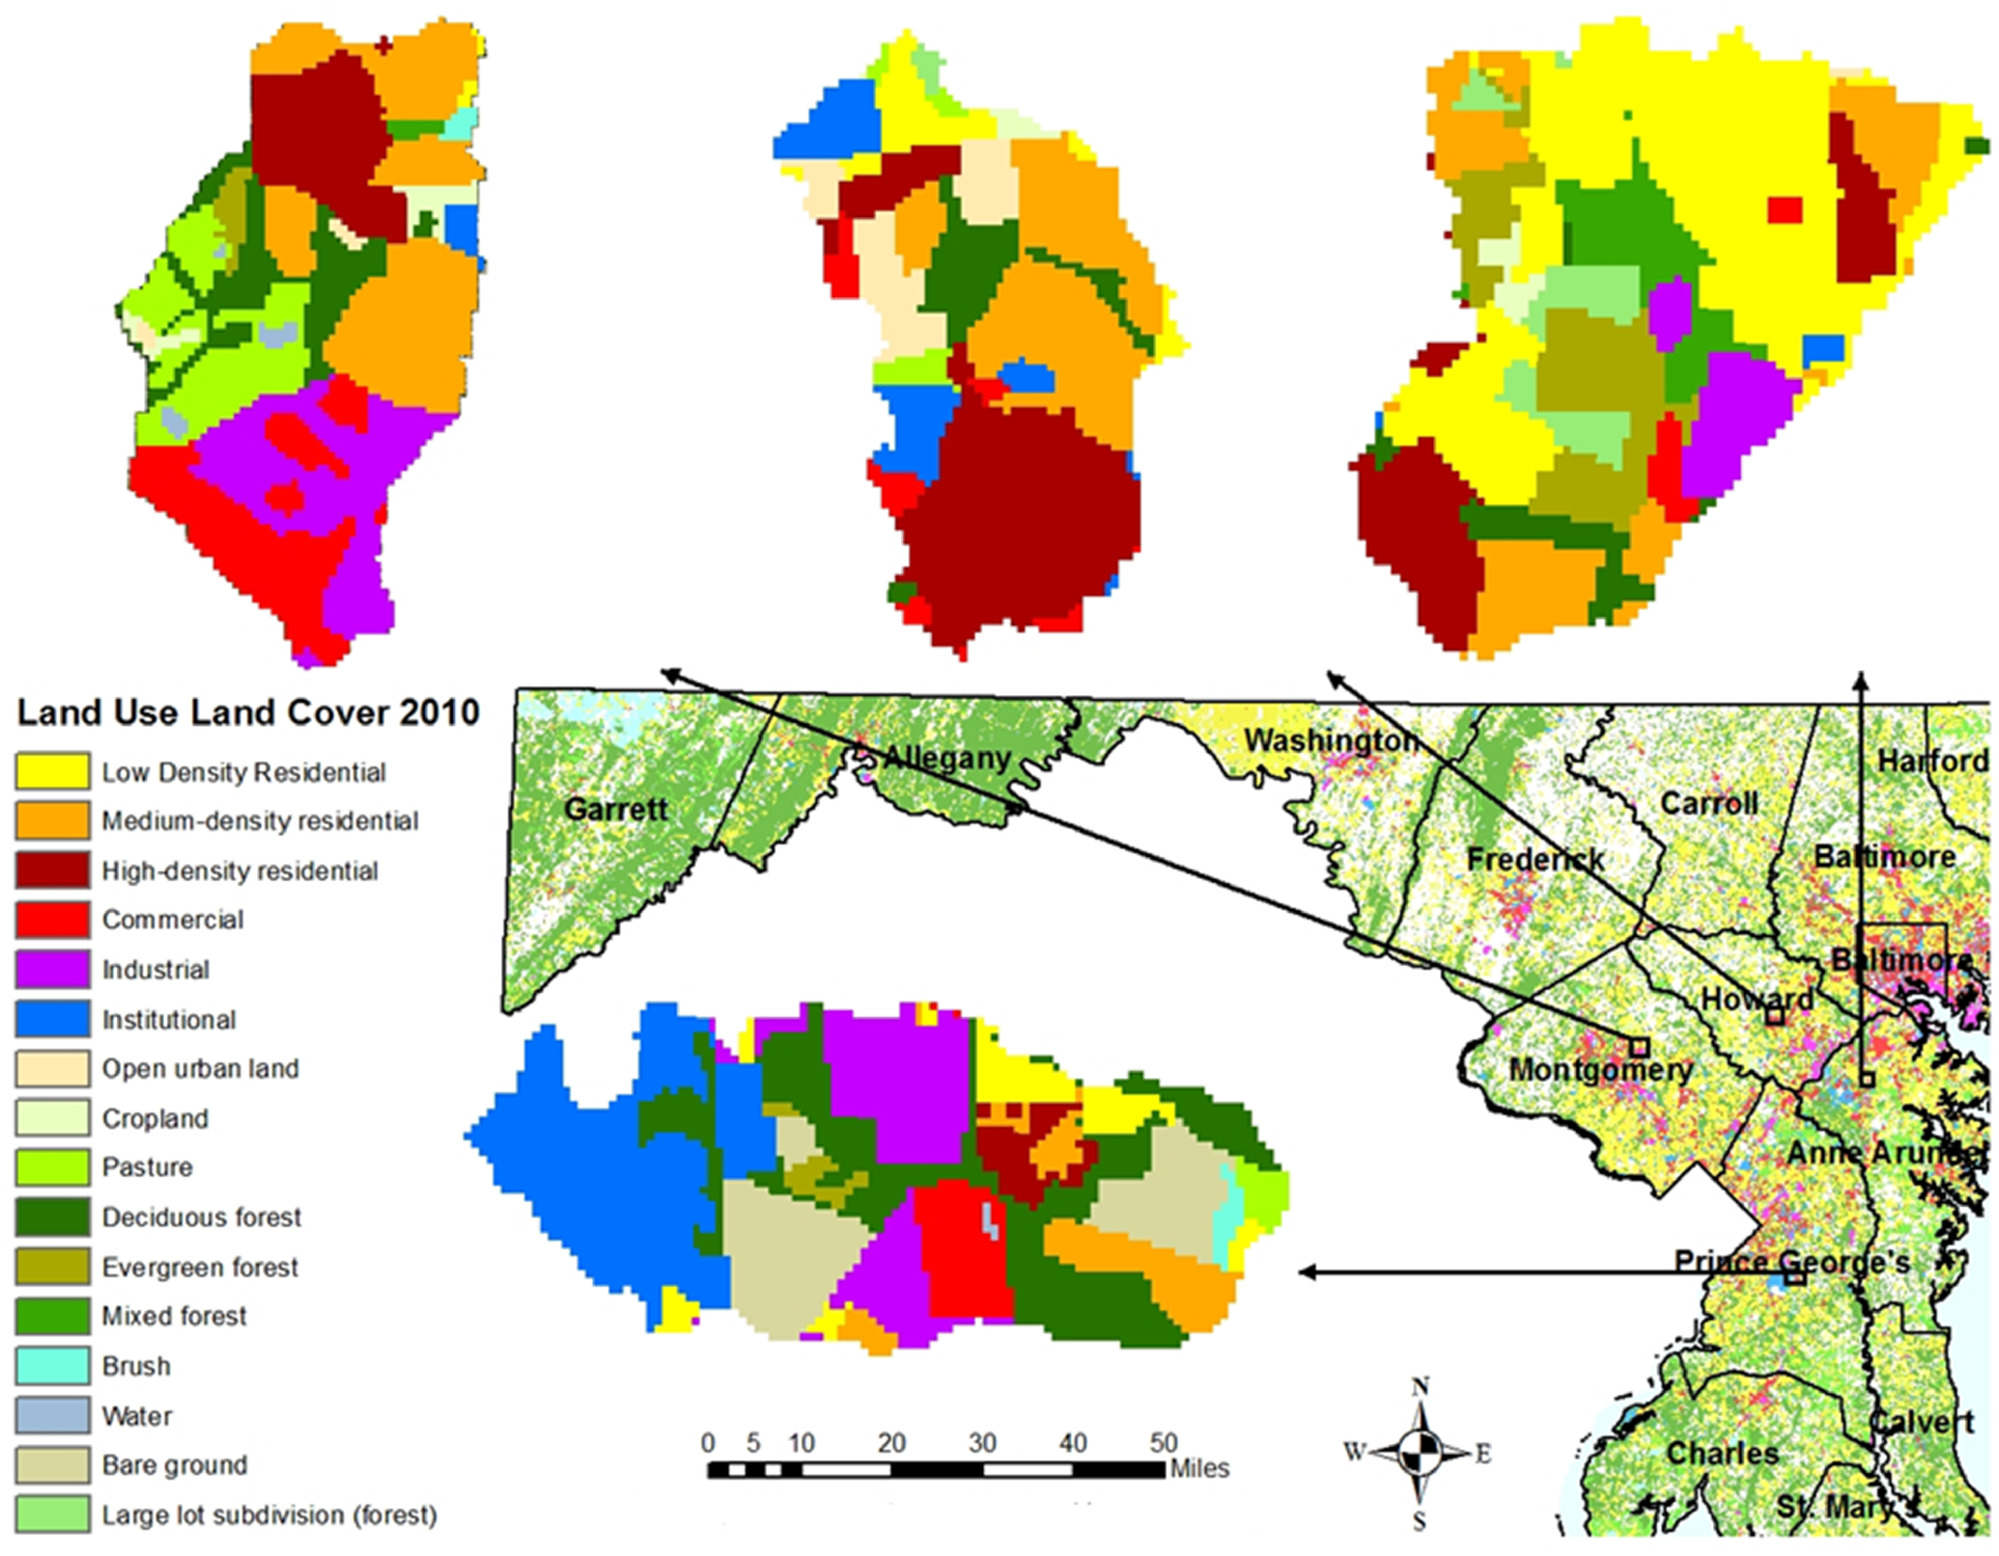
We used four small watersheds in each of several urban counties (Howard, Montgomery, Anne Arundel, and Prince George’s) in the US state of Maryland. Only one small watershed in Montgomery County was selected for SMPs construction. These watersheds are located in the most urbanized part of Maryland and are representative of average precipitation (2-year 24-h) (Table 1) and urbanization conditions in each county [watershed average curve number (CN) values in Table 2 served as proxy for imperviousness]. It is important to clarify that all analyses in this research were performed in small watersheds using precipitation data for these watersheds and average county-level CN values. County-level CN values were used to remove the arbitrariness of precise location of our small watersheds.
| County | Rainfall depth (county level) | Rainfall depth (watershed level) |
|---|---|---|
| Howard | 81.5 | 81.8 |
| Montgomery | 78.8 | 79.7 |
| Anne Arundel | 81.8 | 80.5 |
| Prince George’s | 80.7 | 80.7 |
| County | CN |
|---|---|
| Howard | 73.3 |
| Montgomery | 75.7 |
| Anne Arundel | 70.1 |
| Prince George’s | 73.5 |
Maryland may be broadly divided into three distinct physiographic regions: the Appalachian/Ridge and Valley region, the Piedmont plateau, and the Coastal Plain. Urbanization and fragmentation have occurred mainly in the Piedmont region, followed by the Coastal Plain. The selected study watersheds lie in the Piedmont (Howard and Montgomery watersheds) and Coastal Plain (Anne Arundel and Prince George’s watersheds) regions. Location and land-use information for the study watersheds is provided in Fig. 1.
Experimental Overview
This study assumed that current stormwater infrastructure is effective in controlling surface runoff under the current climate (defined as 1981–2015). A best management practices (BMPs) space-time analysis was set up in this regard for each of the adaptation pathways: (1) gray, (2) green, and (3) combined gray and green infrastructure (gray&green). The system for urban stormwater treatment and analysis integration (SUSTAIN) model (USEPA 2022) was calibrated and optimized to provide cost-effective solutions. Each model simulation was generated with 1,000 iterations using the non-dominated sorting genetic algorithm II (NSGAII) optimization technique (Deb et al. 2002) to compute cost-effective solutions. The choice of BMP types for SUSTAIN model simulations was based on inspection of a geodatabase of stormwater infrastructure in Montgomery County.
The 100% control of current surface runoff by BMPs during the time period 1981–2015 is termed the current portfolio. Two scenarios were used to test effectiveness of the current portfolio under (1) climate change (CC), and (2) climate change and urbanization (CC+Urb). To account for future precipitation change, a percent change factor (CF)–based approach was used to scale historical (1981–2015) Parameter–Elevation Regressions on Independent Slopes Model (PRISM) (Di Luzio et al. 2008) time series (details are provided in Appendix II).
Use of daily total precipitation for flow generation can suppress the timing and duration of peak flow events. Therefore, a design storm approach was used to disaggregate precipitation from daily to hourly time scale. Rainfall distribution for the design storm was based on National Oceanic and Atmospheric Administration (NOAA’s) ATLAS 14 precipitation depth data set (Bonnin et al. 2006) assuming a symmetric storm shape with the most intense rainfall of 24-h duration occurring at the midpoint of the storm. The disaggregated precipitation time series was used as input to the CWM to generate direct watershed runoff as the sum of contributions from aggregate hydrologic response units (HRUs). CWM-based flow values were validated using percent bias (Parajuli et al. 2009; Moriasi et al. 2007) as a performance measure. SMPs were constructed after incorporation of percent bias into the runoff time series. Under the CC+Urb scenario, CF-based percent change in precipitation was used along with future land-use land cover (LULC) projections for 2025 (USGS 2021).
Total stormwater storage costs for each selected solution under each adaptation pathway (gray, green, and gray&green) and under both the CC and the CC+Urb scenarios are provided in terms of percent change in cost from current to future portfolios. Under gray and green pathways, only wet ponds and enhanced bioretention were implemented, respectively. However, the combined gray&green pathways contained infiltration trenches, enhanced bioretention, dry pond, and wet pond BMP types. The selection of these BMPs was based on inspection of existing infrastructure in the study site. Assessment points for all cases were watershed outlets. Results are presented in the form of SMPs, where each path has one to many relationships with each adaptation option (gray, green, and gray&green) to provide all possible solutions. Each pathway is a combination of different stormwater management practices and may change over time, during optimization in the SUSTAIN model, to adapt to increases in surface runoff under future changes. A cobenefit analysis of GI was also carried out for a gray&green solution under climate change and adaptation.
Watershed Modeling
Stormwater management requires watershed modeling, BMP modeling, and cost-effective solutions (Sun et al. 2016). A major challenge as part of decision making is the selection of the best combination of BMPs that are cost-effective (Lee et al. 2012). The USEPA integrated a range of relevant watershed-scale BMP analysis tools into the SUSTAIN model to provide a decision support system (Shoemaker et al. 2012, 2009). SUSTAIN integrates hydrologic, hydraulic, water quality simulations, and a BMP cost-effectiveness package (Chen et al. 2014; Shoemaker et al. 2009). It provides the best combination of stormwater management practices among many options available. The GIS version of SUSTAIN consists of a framework manager, a postprocessor, and four simulation modules (land module, BMP module, conveyance module, and an optimization module) (Shoemaker et al. 2009). SUSTAIN uses the set of management practices detailed in Table 3.
| BMP class | BMP type |
|---|---|
| Class A | Bioretention |
| Wet pond | |
| Cistern | |
| Dry pond | |
| Infiltration trench | |
| Green roof | |
| Porous pavement | |
| Rain barrel | |
| Regulator | |
| Class B | Swale |
| Class C | Conduit |
| Buffer strip | |
| Area strip |
The hydrologic simulation in SUSTAIN is either implemented internally, using the USEPA’s integrated stormwater management model (SWMM), or externally using a model of preference. Calibration and validation of the SWMM model requires tuning many input parameters. It is ideal but time-consuming to set up a hydrologic model with medium/high input complexity, such as SWMM, especially for more than one study site. According to Moriasi et al. (2007), medium- to high-complexity models do not necessarily guarantee good results at daily to subdaily time scales. As part of external hydrologic modeling, a user can define a custom continuous time series. This time series is then provided as input to the SUSTAIN model.
The SUSTAIN model requires HRUs for each land use type. A HRU is the smallest spatial unit of a hydrologic model where response of similar land use, soils, and slope are lumped together (Kalcic et al. 2015). The watersheds in this study were small () with moderate to high imperviousness; their subdivision into HRUs is described subsequently.
CWM Overview
An array of models is available for assessment of stormwater management and economic aspects of adaptation scenarios (Jayasooriya and Ng 2014). These models differ in their attributes such as potential use, temporal resolution and scale, catchment and drainage representation, runoff generation, flow routing, and management practices (Elliott and Trowsdale 2007). A common feature among these models is hydrologic modeling either based on conceptual or physical relations (Refsgaard 1997) with further division into lumped, distributed, HRUs, grid-based spatially distributed, and urban hydrologic element depending on spatial description of the catchment (Elga et al. 2015; Arnold et al. 1998; Refsgaard 1996). Apart from process and scale concerns, a major challenge is the representation of spatially distributed hydrological processes in urban areas (Elga et al. 2015) such as precipitation, evapotranspiration, depression storage, overland flow, combined sewer systems, retention basins, infiltration and subsurface processes, and direct/indirect groundwater recharge (Fletcher et al. 2013). The intrinsically complex nature of urban hydrologic modeling is addressed through parameter reduction (Krebs et al. 2014; Dotto et al. 2011) and selection of physically meaningful parameters (Vieux and Bedient 2004).
In addition, the complex urban catchment system results in model calibration difficulties (WEF 2012); it can be simplified with use of theoretical process interactions (Elga et al. 2015). In view of urban modeling complexity and data limitations, in this study, a parsimonious CWM was conceptualized and discretized into HRUs with similar land-use and soil characteristics. The conceptualization of CWM follows three basic functions of a catchment according to Wagener et al. (2007): (1) partitioning of precipitation into different flow paths (interception, infiltration, percolation, runoff, and so on), (2) storage of water in different parts of the catchment, and (3) release of water from the catchment in the form of channel flow.
The CWM produces HRUs using land-use and soil maps. Discharge is calculated using hourly precipitation and the Natural Resources Conservation Service (NRCS) CN method [Eqs. (1) and (2)]where = direct runoff (mm); = rainfall (mm); = storage (mm); = curve number; and 25.4 = conversion factor from inches to millimeters. A schematic depiction of the CWM is provided in Fig. 2.
(1)
(2)
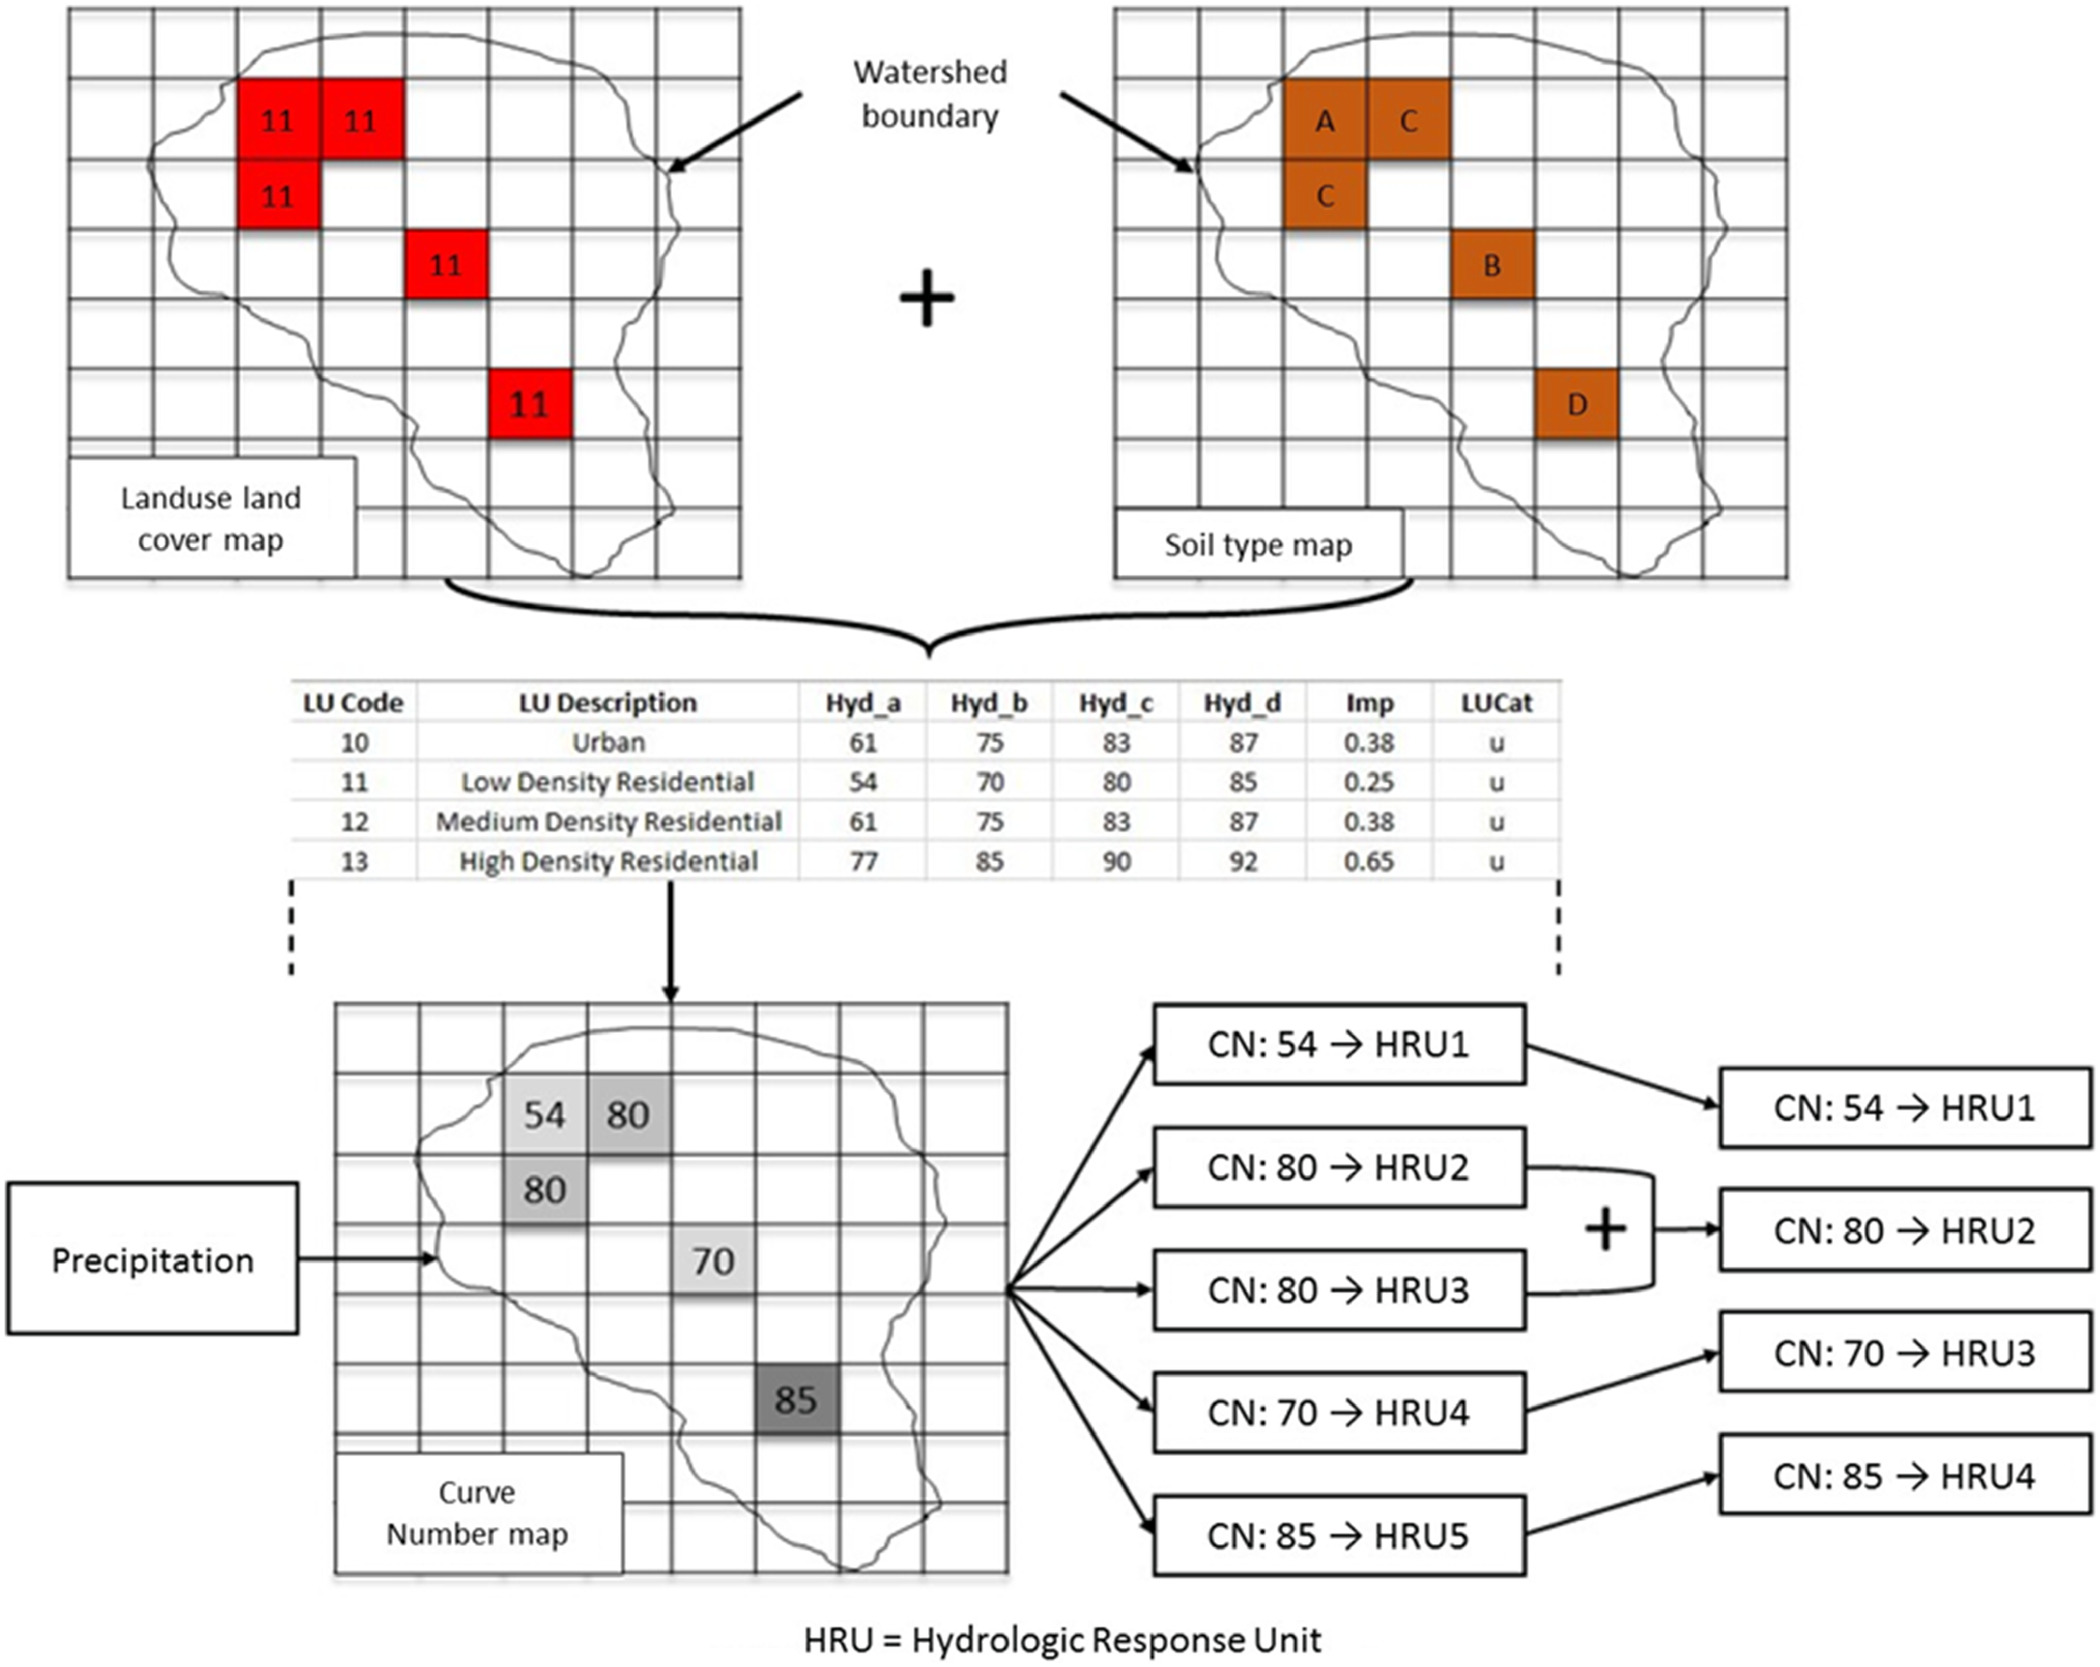
CWM offers low input data complexity and is assumed to be specifically applicable for small urban watersheds. At each location in the discretized (rasterized) watershed, land-use and coincident hydrologic soil type are converted into a CN map (more detail on this conversion process is provided in Appendix I). Where multiple pixels have the same CN value, the surface runoff generated from these pixels is summed to produce an aggregated response of similar CN pixels forming a single HRU. The output of the CWM is expressed as a flow rate () for each HRU.
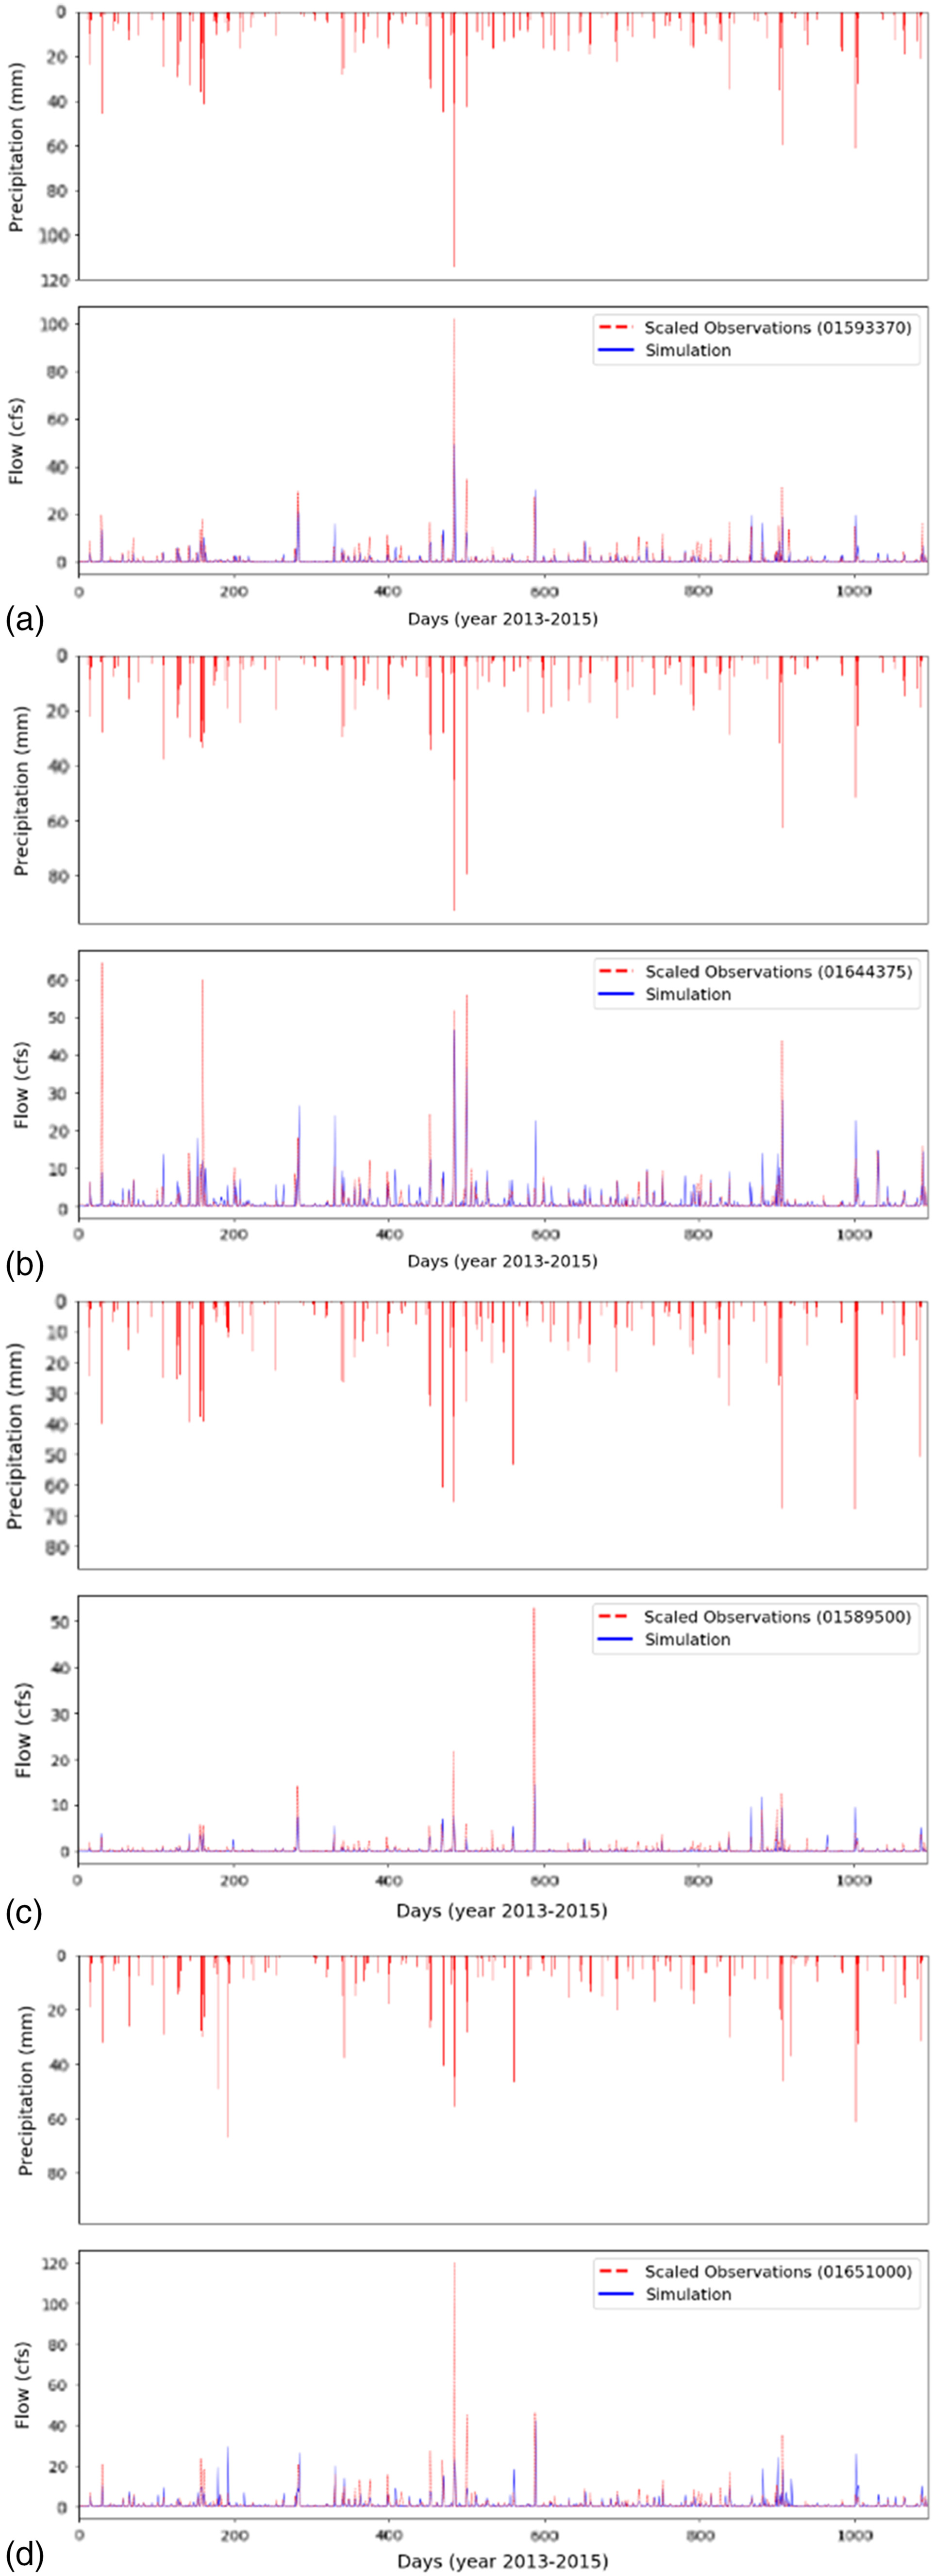
The validity of the model, which can be affected by noninclusion of factors such as disconnected impervious areas, was assessed in this study using USGS stream gauge data located in close vicinity to the study watersheds. Daily USGS streamflow time series were filtered to remove base flow before comparison with CWM-generated flow time series employing the filtering method described by Arnold and Allen (1999) as summarized in Eqs. (3) and (4):where = filtered daily surface runoff at time ; = original streamflow at time ; = filter parameter (0.925); and = daily base flow at time . Observed streamflow data from USGS stream gauges (with drainage area of approximately ), located in proximity to the study watersheds are scaled using a drainage area-ratio method (Gianfagna et al. 2015). Scaling of observed streamflow data from large watersheds was only performed if no small watershed was located near the study site.
(3)
(4)
A list of all USGS stream gauges used in this study during validation for the four small watersheds is provided in Table 4. It is important to highlight that CWM model skill was tested over four study sites, whereas SMPs and portfolios were only constructed for the Montgomery County watershed. CWM model testing over multiple sites was performed to test the underlying assumption of its applicability for impervious areas.
| County | USGS gauge number | Drainage area () |
|---|---|---|
| Howard | 01593450 | 6.4 |
| 01593370 | 3.1 | |
| Montgomery | 01644375 | 3.5 |
| 01643395 | 3.0 | |
| 01644390 | 11.6 | |
| 01647850 | 7.1 | |
| 01649150 | 2.7 | |
| Anne Arundel | 01589500 | 12.9 |
| Prince George’s | 01653600 | 102.3 |
| 01651000 | 127.9 |
Quantification of Ecosystem Services
The metrics used in this research to quantify ecosystem services from GI practices (infiltration trench and bioretention) were runoff control (regulating service), groundwater recharge (provisioning service), and reduced water treatment (regulating service). The estimates were obtained using an online GI screening tool developed by the Center for Neighborhood Technology (CNT 2022). Following Walton (1965) and Locke et al. (2005), the groundwater recharge quantification method computes (1) the difference of discharge using green and conventional stormwater management infrastructure; (2) potential infiltration amount based on rainfall depth; and (3) groundwater recharge, which was assumed to be 62.5% of potential infiltration. The dollar value used for groundwater recharge was $70 per (after Schicht et al. 1976, updated to present value). This tool computes reduced water treatment benefits using financial reports by Metropolitan Water Reclamation District of Greater Chicago (MWRD) (2004), and simply uses $24 per of runoff reduced using vegetation filtration strips.
Total runoff volume was computed using the NRCS CN method which is consistent with SUSTAIN model settings used in this study. In addition, the CNT online tool requires predevelopment land cover, runoff-control goal, conventional development, and green improvements. Equations for life cycle cost/benefit estimation and net present value of costs arewhere = life cycle cost including benefits; = construction cost; = number of times the component will be replaced; = annual maintenance cost; = total number of years considered in the analysis; AB = annual benefits; NPV is the net present value; and = discount rate. Details of the CNT (2022) green value calculator are available online.
(5)
(6)
Results
According to guidelines published by ASCE (1993), the evaluation criteria of watershed models are grouped into continuous hydrographs and single events. Continuous hydrographs contain an evaluation measure, , called the deviation volume, which is similar to the percent bias (PBIAS) measure from Moriasi et al. (2007). The PBIAS metric iswhere and =observed and simulated flow at time step respectively; and = total number of time steps. For model evaluation, McCuen et al. (2006) and Moriasi et al. (2007) suggested the use of graphical analysis as a supplementary test along with other measures such as PBIAS. PBIAS test values and percent of impervious area for each study site are presented in Table 5.
(7)
| County | Impervious area (%) | PBIAS |
|---|---|---|
| Howard | 42.4 | 28.7 |
| Montgomery | 43.4 | 6.1 |
| Anne Arundel | 28.5 | 49.8 |
| Prince George’s | 40.5 | 19.5 |
Note: Performance metrics for PBIAS (Parajuli et al. 2009; Moriasi et al. 2007): (excellent), (very good), (good), (fair), (poor), and (unsatisfactory).
The CWM works well, even with limited input data, to generate daily mean flows for small urban watersheds. CWM performance is directly associated with percent impervious area, such as seen for the Montgomery County watershed. Diffuse runoff losses due to disconnected impervious areas are the main contributors to higher errors in CWM-based flow estimates. Apart from CWM model output, PBIAS error can also be attributed to several factors associated with comparing the study sites with USGS streamflow gauge sites: (1) size of gauged watershed used for comparison (gauges with larger drainage area likely contain flows from diverse land-use types, and their hydrographs reflect attenuation due to travel through the watershed); (2) the proximity of the streamflow gauge to the study watershed; and (3) other model simplifications.
USGS stream gauges within proximity to the study site in Prince George’s County have large drainage area, and therefore the drainage area scaling approach produces large discrepancies. In addition, study sites with impervious areas below 30%, such as the watershed in Anne Arundel County, result in flow estimation errors from CWM because this model is best applied to watersheds that are moderate-to-highly impervious. CWM runoff output at a daily time step was validated using filtered observed daily streamflow time series and is provided in Fig. 3. To address model limitations, model output was adjusted using percent bias in the output. This involved scaling of CWM-generated flow values by multiplying them with the PBIAS.
The CWM model output for the Montgomery County watershed shows a 6% underestimation compared with observations. Therefore, a multiplicative modification (Yang et al. 2007) was applied to precipitation values to account for 1.06 PBIAS before construction of SMPs. HRUs for the CC scenario were constructed using percent change in precipitation from the Coupled Model Intercomparison Project 5 (CMIP5) model used in this study (Appendix II). For the CC+Urb scenario, HRUs for future conditions were constructed using CF-based precipitation time series in the CWM model along with the zoning scenario for year 2025 for land use.
Discussion
Portfolio Assessment
Shown in Fig. 4 is the SUSTAIN model–derived relationships between runoff control effectiveness and cost for all solutions, best solutions, and one selected solution. This figure applies to the gray&green treatment scenario for the Montgomery County watershed. This curve represents the current portfolio for the combined gray&green adaptation pathway. Each point in this figure represents the minimum cost for the control of a target runoff with an optimal combination of BMPs. The decision variables in the SUSTAIN model optimization were storage depth and BMP cost.
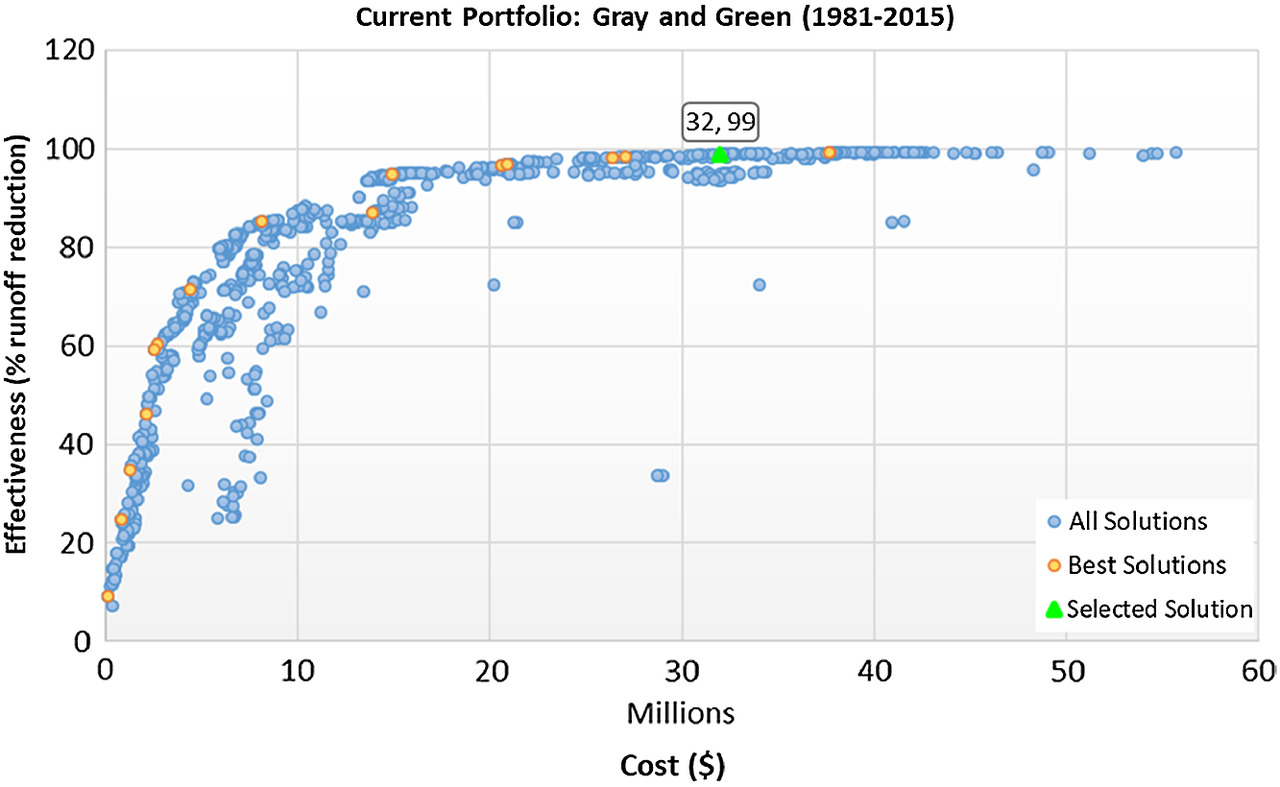
All solutions determined in the SUSTAIN Model contain 1,000 possible combinations of stormwater management practices, with the best solutions showing the inherent tradeoff between runoff control and cost. The selected solution shown in Fig. 4 (for use as baseline to construct SMPs) will vary depending on state or county regulations and availability of funds for stormwater management infrastructure construction. In this study, a target of 99% or greater control of stormwater runoff increases was used. With 99% effectiveness, the selected solution under the gray&green adaptation pathway would cost $32 million for the small watershed in Montgomery County. For comparison, the costs for exclusively gray and green pathways with 99% effectiveness under the current portfolio would be around $32.5 and $37 million, respectively.
The percent cost changes in the current portfolio under the CC and the CC+Urb scenarios are presented in Fig. 5. The current portfolio was based on current climate and land use. Percent change in cost under the CC and the CC+Urb scenarios was based on their percentage difference from the conditions assumed in the current portfolio. Therefore, the portfolios in Fig. 5 only show percent change in flood control costs.
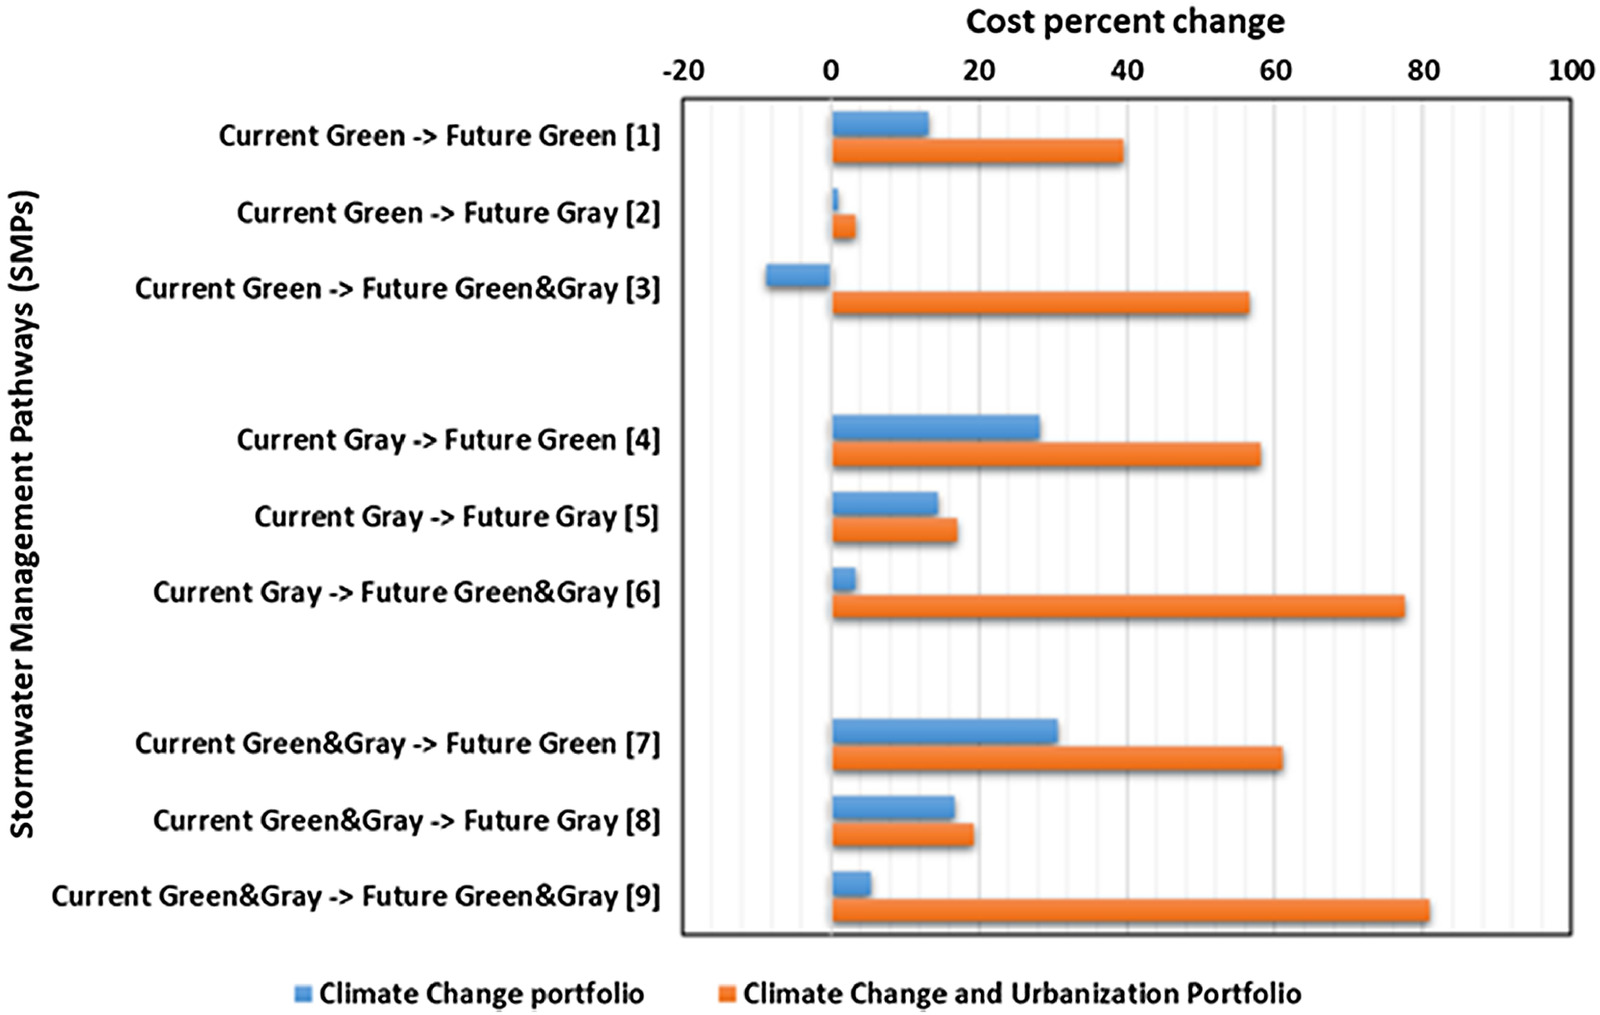
The purpose of considering multiple pathways is to examine stormwater management from an economic perspective. The pathways were numbered for convenience to reference them in discussion. Each pathway was determined by computing the difference in cost compared with the current portfolio. For example, Pathway 1 for the climate change scenario was determined by computing percent change in green infrastructure costs under current climate ($37 million) and future climate ($42 million), an increase of about 13%. Pathway 3 had optimal cost under the CC scenario portfolio. Pathways 2, 5, and 8 showed that the use of gray infrastructure under the CC+Urb scenario was cost-optimal for runoff control purposes. The use of gray infrastructure was inexpensive compared with GI for runoff control.
Pathway 3 showed a decrease in costs under the CC scenario because the cost of combined gray&green infrastructure was lower than the cost of using only GI (i.e., the inclusion of gray infrastructure employed under future climate results in smaller costs than the green infrastructure only under current conditions). Pathways 3, 6, and 9 have very high costs under the CC+Urb scenario due to use of GI for runoff control. The existing stormwater management infrastructure in the Montgomery County watershed is a combination of gray and green practices. Pathway 9 shows that continued use of these same practices may lead to 80% more cost compared with the current portfolio under the CC+Urb scenario.
The benefits of GI for runoff control and its secondary benefits (improved air quality, human health, preservation of ecosystems, reduction of urban heat-island effects, soil conservation, and groundwater replenishment) are realized (Moore et al. 2016). However, the cost of green infrastructure is very high from a runoff control and flood protection perspective and noninclusion of ecosystem services benefits such as groundwater recharge and water quality treatment benefits.
Benefit Assessment of Green Infrastructure
Several studies (Keesstra et al. 2018; Demuzere et al. 2014; Farrugia et al. 2013; Benedict and McMahon 2006; Foster et al. 2011; Schilling and Logan 2008) have shown that the added benefits of green infrastructure can potentially offset their higher construction and maintenance costs, not only through providing flood protection, but also benefitting additional ecosystem services. According to Nordman et al. (2018), not all GI practices are necessarily effective in this regard. The SUSTAIN model is well-suited to provide least-cost options through optimization but does not account for added benefits of GI. A wide variety of stormwater management tools are available that incorporate GI (Jayasooriya and Ng 2014). The CNT’s green values calculator is the most comprehensive resource to obtain cost-benefit estimates of stormwater GI. As part of GI benefits assessment, infiltration trench and bioretention practices are used in the CNT calculator.
The net present value (NPV) of both GI practices to provide added benefits of ground replenishment and reduced treatment benefits was negligible compared with the total life cycle construction and maintenance costs. This could likely be due to (1) an oversimplified method for groundwater recharge estimation, (2) lack of inclusion of native vegetation types with and around bioretention and filtration strips, and (3) the small area covered by these green practices compared with watershed size.
Conclusions
Stormwater management requires hydrologic modeling for flow estimation. However, most advanced hydrologic models are difficult to calibrate and validate due their complexity. In this research study, a low-complexity CWM was conceptualized and implemented. A GIS environment was used to generate HRUs to calculate runoff generation. The implementation of the CWM requires low input-data complexity and can be easily set up for any small urban watershed. The major limitations of the CWM model are use of disaggregated daily precipitation totals (using the design storm approach) and NRCS CN method for runoff estimation, which assumes an initial abstraction from precipitation. The CWM-based flow estimation error tended to be positive (indicating model underestimation) due to these limitations and leads to underestimates of flow values for watersheds with less than 40% imperviousness, as observed in the case of the Anne Arundel County watershed.
In addition to structure and process, the validation of the CWM requires scaling of streamflow data from nearby gauged watersheds, which adds uncertainty to model performance. To account for overall model uncertainty, estimated flow time series from the CWM were scaled using the PBIAS estimate. Use of the CWM for any other study site should be limited to medium- to high-impervious small () urban watersheds. The good performance of the CWM offers a quick planning-level flow simulation tool for decision makers for small watersheds.
Under climate change and urbanization, the ideal path forward is to conduct existing BMP space-time analyses to test the effectiveness of existing stormwater management infrastructure under future conditions. However, the acquisition of existing BMP specifications and performance data can be difficult due to state or county regulations or the absence of research funding to collect such data. This study presents an alternative approach to construct SMPs in the absence of existing BMP technical specifications. The underlying assumption is that the existing infrastructure is effective to control surface runoff under current climate and urbanization conditions. For this purpose, the SUSTAIN model may be used with a set of BMPs to obtain 99% or greater effectiveness to reduce runoff under existing climate and urbanization.
Results from SMPs under the climate change plus urbanization scenarios showed that future use of current BMP types results in high future costs. Specifically, the benefits of infiltration trenches and bioretention practices are found to be too low to offset the higher costs of construction and maintenance during their life cycle. The negligible benefits of green infrastructure practices can be attributed to the mathematical treatment of both physical processes and economics in the model structures, including oversimplification of the groundwater recharge quantification method, the small spatial extent of green infrastructure practices compared with total watershed area, the limited amount of ecosystem services included in the model’s benefits accounting, and the ineffectiveness of existing tools for small watershed studies. As exemplified by Pathways 2, 5, and 8 in our analysis, the cost-optimal solutions used only gray infrastructure to address future flow control. This finding indicates that it is necessary to explore (1) better tools and robust metrics for quantification of green infrastructure benefits, and (2) the use of additional green infrastructure practices such as amended soil and landscaping using native vegetation.
The optimization of a set of BMPs to obtain runoff control target solutions and construction of SMPs offers a framework for cost-effective flood protection. However, the benefits assessment, as conducted in this research, required the use of an online tool, which operates using a single storm rainfall. With regards to ecosystem services, a review of the stormwater literature by Prudencio and Null (2018) indicated that regulating services was most often emphasized, with less attention given to the other three services (provisioning, cultural, and supporting). Currently, some of the major limitations in this regard are (1) the integration of green infrastructure benefits within stormwater management modeling environment to obtain optimized solutions inclusive of these cobenefits, (2) inclusion of more green infrastructure practices, such as amended soils and landscaping with native vegetation in modeling tools, and (3) apart from economic and environmental benefits, modeling tools should also include social benefits (such as the human health index) of green infrastructure. Green infrastructure–based stormwater management solutions were more likely to be implemented if the full context of their employment is understood and quantified.
Appendix I. Watershed Representative Values of Precipitation and Curve Number
Average precipitation (2-year 24-h) (Table 1) values were based on the NOAA ATLAS 14 data set (Bonnin et al. 2006). To obtain average CN (Table 2) LULC data and hydrologic soil groups (A, B, C, and D), data were overlapped to determine a CN value. Both LULC (Maryland Department of Planning 2010) and soil survey geographic database (SSURGO) (NRCS 2017) soil data were at approximately 30-m spatial resolution.
Appendix II. Change Factor
The CF scaling method scales an observed time series by a calculated ratio. It is inherently limited in its ability to predict changes in variability of extreme precipitation events for future time periods. A scaling factor was determined by taking the ratio of the mean of daily bias-corrected CMIP5 model projections for future and historical periods. This process was repeated for all models separatelywhere = daily future precipitation (2016–2035); ; ; = daily historical precipitation (1996–2015); and = ratio of averaged model future (2016–2035) to averaged model historical (1996–2015) time series. An implicit assumption in applying the CF method to general circulation model (GCM) output for estimation is that model bias is consistent between historical and future periods. A CF value of 5% obtained from the Norwegian Climate Centre’s Norwegian Earth System Model 1-Medium resolution (NorESM1-M) model (Taylor et al. 2012) was used in this study.
(8)
(9)
Data Availability Statement
Some or all data, models, or code that support the findings of this study are available from the corresponding author upon reasonable request. These items include land use, imperviousness, and curve number data.
Acknowledgments
The primary author of this work, Dr. I. M. P. Khan, passed away unexpectedly soon after the original drafting of this work. The remaining authors of this work wish to acknowledge his passing, express their condolences to Dr. Khan’s family, and simply state that it was an honor to know and work with Dr. Khan. He was a kind man who was passionate about his work and family. We would like to thank Kate Majchrzak from Maryland Department of the Environment, John Riverson, and Ryan Murphy from Paradigm Environmental, and Dr. Matthew Hansen for valuable suggestions to improve the quality of the work. Also, “We acknowledge the World Climate Research Programme’s Working Group on Coupled Modelling, which is responsible for CMIP. For CMIP the US Department of Energy’s Program for Climate Model Diagnosis and Intercomparison provides coordinating support and led development of software infrastructure in partnership with the Global Organization for Earth System Science Portals.” This work benefitted greatly from the input and thoughtful suggestions from two anonymous reviewers.
Disclaimer
The findings and conclusions in this publication are those of the author(s) and should not be construed to represent any official USDA determination or policy. Any use of trade, firm, or product names is for descriptive purposes only and does not imply endorsement by the US Government.
References
Ackerman, K. 2012. Urban agriculture: Opportunities and constraints. Metropolitan sustainability, 118–146. Sawston, UK: Woodhead Publishing.
Adger, W. N., S. Agrawala, M. M. Q. Mirza, C. Conde, K. O’Brien, J. Pulhin, R. Pulwarty, B. Smit, and K. Takahashi. 2007. “Assessment of adaptation practices, options, constraints and capacity.” In Climate change 2007: Impacts, adaptation and vulnerability. Contribution of working Group II to the fourth assessment report of the intergovernmental panel on climate change, 717–743. Cambridge, UK: Cambridge University Press.
Arnold, J. G., and P. M. Allen. 1999. “Automated methods for estimating baseflow and groundwater recharge from streamflow records.” J. Am. Water Resour. Assoc. 35 (2): 411–424. https://doi.org/10.1111/j.1752-1688.1999.tb03599.x.
Arnold, J. G., R. Srinivasan, R. S. Muttiah, and J. R. Williams. 1998. “Large area hydrologic modeling and assessment part I: Model development 1.” J. Am. Water Resour. Assoc. 34 (1): 73–89. https://doi.org/10.1111/j.1752-1688.1998.tb05961.x.
ASCE. 1993. “Criteria for evaluation of watershed models.” J. Irrig. Drain. Eng. 119 (3): 429–442. https://doi.org/10.1061/(ASCE)0733-9437(1993)119:3(429).
Attwater, R., and C. Derry. 2017. “Achieving resilience through water recycling in peri-urban agriculture.” Water 9 (3): 223. https://doi.org/10.3390/w9030223.
Bahri, A. 2012. “Integrated urban water management.” In The background papers. Stockholm, Sweden: Technical Committee.
Barbosa, A. E., J. N. Fernandes, and L. M. David. 2012. “Key issues for sustainable urban stormwater management.” Water Res. 46 (20): 6787–6798. https://doi.org/10.1016/j.watres.2012.05.029.
Benedict, M. A., and E. T. Mcmahon. 2006. Green infrastructure: Linking landscapes and communities. Washington, DC: Island Press.
Berland, A., and M. E. Hopton. 2014. “Urban Forestry & Urban greening comparing street tree assemblages and associated stormwater benefits among communities in metropolitan Cincinnati, Ohio, USA.” Urban For. Urban Greening 13 (4): 734–741. https://doi.org/10.1016/j.ufug.2014.06.004.
Bonnin, G. M., D. Martin, B. Lin, T. Parzybok, M. Yekta, and D. Riley. 2006. Precipitation-frequency atlas of the United States. Silver Spring, MD: National Weather Service.
Brown, D. G., C. Polsky, P. Bolstad, S. D. Brody, D. Hulse, R. Kroh, T. R. Loveland, and A. Thomson. 2014: “Land use and land cover change.” In Climate change impacts in the United States: The Third national climate assessment, 318–332. Washington, DC: US Global Change Research Program.
Carter, T. R., R. N. Jones, X. Lu, S. Bhadwal, C. Conde, L. O. Mearns, B. C. O’Neill, M. D. A. Rounsevell, and M. B. Zurek. 2007. “New assessment methods and the characterisation of future conditions.” In Climate change 2007: Impacts, adaptation and vulnerability. Contribution of working Group II to the fourth assessment report of the intergovernmental panel on climate change, 133–171. Cambridge, UK: Cambridge University Press.
Chen, J., F. P. Brissette, A. Poulin, and R. Leconte. 2011. “Overall uncertainty study of the hydrologic impacts of climate change for a Canadian watershed.” Water Resour. Res. 47 (12): 11. https://doi.org/10.1029/2011WR010602.
Chen, Y., S. D. Day, A. F. Wick, and K. J. Mcguire. 2014. “Influence of urban land development and subsequent soil rehabilitation on soil aggregates, carbon, and hydraulic conductivity.” Sci. Total Environ. 494 (6): 329–336. https://doi.org/10.1016/j.scitotenv.2014.06.099.
CNT (Center for Neighborhood Technology). 2022. “Green values stormwater management calculator.” Accessed May 21, 2022. https://greenvalues.cnt.org/#calculate.
Connop, S., P. Vandergert, B. Eisenberg, M. J. Collier, C. Nash, J. Clough, and D. Newport. 2016. “Renaturing cities using a regionally-focused biodiversity-led multifunctional benefits approach to urban green infrastructure.” Environ. Sci. Policy 62 (5): 99–111. https://doi.org/10.1016/j.envsci.2016.01.013.
Cox, P., and D. Stephenson. 2007. “A changing climate for prediction.” Science 317 (5835): 207–208. https://doi.org/10.1126/science.1145956.
Deb, K., A. Member, A. Pratap, S. Agarwal, and T. Meyarivan. 2002. “A fast and elitist multiobjective genetic algorithm: NSGA-II.” IEEE Trans. Evol. Comput. 6 (2): 182–197. https://doi.org/10.1109/4235.996017.
Demuzere, M., K. Orru, O. Heidrich, E. Olazabal, D. Geneletti, and H. Orru. 2014. “Mitigating and adapting to climate change: Multi-functional and multi-scale assessment of green urban infrastructure.” J. Environ. Manage. 146 (7): 107–115. https://doi.org/10.1016/j.jenvman.2014.07.025.
Dessai, S., and J. P. van der Sluijs. 2007. Uncertainty and climate change adaptation: A scoping study. Washington, DC: Dept. of Science Technology and Society.
Dhakal, K. P., and L. R. Chevalier. 2016. “Urban stormwater governance: The need for a paradigm shift.” Environ. Manage. 57 (4): 1112–1124. https://doi.org/10.1007/s00267-016-0667-5.
Di Luzio, M., G. L. Johnson, C. Daly, J. K. Eischeid, and J. G. Arnold. 2008. “Constructing retrospective gridded daily precipitation and temperature datasets for the conterminous United States.” J. Appl. Meteorol. Climatol. 47 (3): 475–497. https://doi.org/10.1175/2007JAMC1356.1.
Doherty, J. M., J. F. Miller, S. G. Prellwitz, A. M. Thompson, S. P. L. Ii, and J. B. Zedler. 2014. “Hydrologic regimes revealed bundles and tradeoffs among six wetland services.” Ecosystems 17 (6): 1026–1039. https://doi.org/10.1007/s10021-014-9775-3.
Dotto, C. B. S., M. Kleidorfer, A. Deletic, W. Rauch, D. T. Mccarthy, and T. D. Fletcher. 2011. “Performance and sensitivity analysis of stormwater models using a Bayesian approach and long-term high resolution data.” Environ. Modell. Software 26 (56): 1225–1239. https://doi.org/10.1016/j.envsoft.2011.03.013.
Elga, S., B. Jan, and B. Okke. 2015. “Hydrological modelling of urbanized catchments: A review and future directions.” J. Hydrol. 529 (Sep): 62–81. https://doi.org/10.1016/j.jhydrol.2015.06.028.
Elliott, A. H., and S. A. Trowsdale. 2007. “A review of models for low impact urban stormwater drainage.” Environ. Modell. Software 22 (3): 394–405. https://doi.org/10.1016/j.envsoft.2005.12.005.
Environmental Finance Center, University of Maryland. 2017. “Holistically analyzing the benefits of green infrastructure.” In Guidance for local governments. Washington, DC: Chesapeake Bay Program.
Farrugia, S., M. D. Hudson, and L. McCulloch. 2013. “An evaluation of flood control and urban cooling ecosystem services delivered by urban green infrastructure.” Int. J. Biodiversity Sci. Ecosyst. Services Manage. 9 (23): 136–145. https://doi.org/10.1080/21513732.2013.782342.
Fletcher, T. D., et al. 2015. “SUDS, LID, BMPs, WSUD and more—The evolution and application of terminology surrounding urban drainage.” Urban Water J. 12 (Feb): 525–542. https://doi.org/10.1080/1573062X.2014.916314.
Fletcher, T. D., H. Andrieu, and P. Hamel. 2013. “Understanding, management and modelling of urban hydrology and its consequences for receiving waters: A state of the art.” Adv. Water Resour. 51 (Jan): 261–279. https://doi.org/10.1016/j.advwatres.2012.09.001.
Foster, J., A. Lowe, and S. Winkelman. 2011. The value of green infrastructure for urban climate adaptation. Washington, DC: Center for Clean Air Policy.
Fowler, H. J., S. Blenkinsop, and C. Tebaldi. 2007. “Linking climate change modelling to impacts studies: Recent advances in downscaling techniques for hydrological modelling.” Int. J. Climatol. 27 (12): 1547–1578. https://doi.org/10.1002/joc.1556.
Freeman, A. M., J. A. Herriges, and C. L. Kling. 2014. The measurement of environmental and resource values: Theory and methods. New York: Routledge.
Füssel, H. M. 2007. “Adaptation planning for climate change: Concepts, assessment approaches, and key lessons.” Sustainability Sci. 2 (2): 265–275. https://doi.org/10.1007/s11625-007-0032-y.
Gaffin, S. R., C. Rosenzweig, and A. Y. Y. Kong. 2012. “Adapting to climate change through urban green infrastructure.” Nat. Clim. Change 2 (10): 704. https://doi.org/10.1038/nclimate1685.
Gan, T. Y., E. M. Dlamini, and G. F. Biftu. 1997. “Effects of model complexity and structure, data quality, and objective functions on hydrologic modeling.” J. Hydrol. 192 (1–4): 81–103. https://doi.org/10.1016/S0022-1694(96)03114-9.
Georgakakos, A., P. Fleming, M. Dettinger, C. Peters-Lidard, T. C. Richmond, K. Reckhow, K. White, and D. Yates. 2014. “Water Resources.” In Climate change impacts in the United States: The third national climate assessment, 69–112. Washington, DC: US Global Change Research Program.
Gersonius, B., F. Nasruddin, R. Ashley, A. Jeuken, A. Pathirana, and C. Zevenbergen. 2012. “Developing the evidence base for mainstreaming adaptation of stormwater systems to climate change.” Water Res. 46 (3): 6824–6835. https://doi.org/10.1016/j.watres.2012.03.060.
Gianfagna, C. C., C. E. Johnson, D. G. Chandler, and C. Hofmann. 2015. “Watershed area ratio accurately predicts daily streamflow in nested catchments in the Catskills, New York.” J. Hydrol. Reg. Stud. 4 (10): 583–594. https://doi.org/10.1016/j.ejrh.2015.09.002.
Gill, S. E., J. F. Handley, A. R. Ennos, and S. Pauleit. 2007. “Adapting cities for climate change: The role of the green infrastructure.” Built Environ. 33 (1): 115–133. https://doi.org/10.2148/benv.33.1.115.
Gittleman, M., C. J. Farmer, P. Kremer, and T. McPhearson. 2017. “Estimating stormwater runoff for community gardens in New York City.” Urban Ecosyst. 20 (1): 129–139. https://doi.org/10.1007/s11252-016-0575-8.
Goulden, S., M. E. Portman, N. Carmon, and T. Alon-Mozes. 2018. “From conventional drainage to sustainable stormwater management: Beyond the technical challenges.” J. Environ. Manage. 219 (Sep): 37–45. https://doi.org/10.1016/j.jenvman.2018.04.066.
Haasnoot, M., J. H. Kwakkel, and W. E. Walker. 2013. “Dynamic adaptive policy pathways: A method for crafting robust decisions for a deeply uncertain world.” Global Environ. Change 23 (Jan): 485–498. https://doi.org/10.1016/j.gloenvcha.2012.12.006.
Hamin, E. M., and N. Gurran. 2009. “Urban form and climate change: Balancing adaptation and mitigation in the US and Australia.” Habitat Int. 33 (3): 238–245. https://doi.org/10.1016/j.habitatint.2008.10.005.
Hassall, C. 2014. “The ecology and biodiversity of urban ponds.” Wiley Interdiscip. Rev.: Water 1 (2): 187–206. https://doi.org/10.1002/wat2.1014.
Ishimatsu, K., K. Ito, Y. Mitani, Y. Tanaka, T. Sugahara, and Y. Naka. 2017. “Use of rain gardens for stormwater management in urban design and planning.” Landscape Ecol. Eng. 13 (1): 205–212. https://doi.org/10.1007/s11355-016-0309-3.
Jayasooriya, V. M., and A. W. M. Ng. 2014. “Tools for modeling of stormwater management and economics of green infrastructure practices: A review.” Water Air Soil Pollut. 225 (8): 2055. https://doi.org/10.1007/s11270-014-2055-1.
Jayasooriya, V. M., A. W. M. Ng, S. Muthukumaran, and B. J. C. Perera. 2017. “Green infrastructure practices for improvement of urban air quality.” Urban For. Urban Greening 21 (85): 34–47. https://doi.org/10.1016/j.ufug.2016.11.007.
Jiang, L., and B. C. O’Neill. 2017. “Global urbanization projections for the shared socioeconomic pathways.” Global Environ. Change 42 (Mar): 193–199. https://doi.org/10.1016/j.gloenvcha.2015.03.008.
Johnston, R. J., J. Rolfe, R. S. Rosenberger, and R. Brouwer. 2015. “Introduction to benefit transfer methods.” In Benefit transfer of environmental and resource values, 19–59. Berlin: Springer.
Kalcic, M. M., I. Chaubey, and J. Frankenberger. 2015. “Defining soil and water assessment tool (SWAT) hydrologic response units (HRUs) by field boundaries.” Int. J. Agric. Biol. Eng. 8 (3): 69–80. https://doi.org/10.3965/j.ijabe.20150803.951.
Kati, V., and N. Jari. 2016. “Bottom-up thinking—Identifying socio-cultural values of ecosystem services in local blue–green infrastructure planning in Helsinki, Finland.” Land Use Policy 50 (Jan): 537–547. https://doi.org/10.1016/j.landusepol.2015.09.031.
Keesstra, S., J. Nunes, A. Novara, D. Finger, D. Avelar, Z. Kalantari, and A. Cerdà. 2018. “The superior effect of nature based solutions in land management for enhancing ecosystem services.” Sci. Total Environ. 610–611 (Aug): 997–1009. https://doi.org/10.1016/j.scitotenv.2017.08.077.
Khan, I. M. P., G. E. Moglen, K. Hubacek, and K. L. Brubaker. 2019. “Future storm frequency and runoff in small US mid-Atlantic watersheds evaluated using capture depth.” J. Sustainable Water Built Environ. 5 (3): 05019001. https://doi.org/10.1061/JSWBAY.0000879.
Kirshen, P., S. Aytur, J. Hecht, A. Walker, D. Burdick, S. Jones, N. Fennessey, R. Bourdeau, and L. Mather. 2018. “Urban climate integrated urban water management applied to adaptation to climate change.” Urban Clim. 24 (10): 247–263. https://doi.org/10.1016/j.uclim.2018.03.005.
Kirtman, B., S. B. Power, A. J. Adedoyin, G. J. Boer, R. Bojariu, I. Camilloni, and H. J. Wang. 2013. “Near-term climate change: Projections and predictability.” In Climate Change 2013: The physical science basis. Contribution of working Group I to the fifth assessment report of the intergovernmental panel on climate change, 953–1028. Cambridge, UK: Cambridge University Press.
Klimas, C., A. Williams, M. Hoff, B. Lawrence, J. Thompson, and J. Montgomery. 2016. “Valuing ecosystem services and disservices across heterogeneous green spaces.” Sustainability 8 (9): 853. https://doi.org/10.3390/su8090853.
Kopecká, M., D. Szatmári, and K. Rosina. 2017. “Analysis of urban green spaces based on Sentinel-2A: Case studies from Slovakia.” Land 6 (2): 25. https://doi.org/10.3390/land6020025.
Krebs, G., T. Kokkonen, M. Valtanen, H. Setälä, and H. Koivusalo. 2014. “Spatial resolution considerations for urban hydrological modelling.” J. Hydrol. 512 (Mar): 482–497. https://doi.org/10.1016/j.jhydrol.2014.03.013.
Kwadijk, J. C. J., et al. 2010. “Using adaptation tipping points to prepare for climate change and sea level rise: A case study in the Netherlands.” WIREs Clim. Change 1 (Aug): 729–740. https://doi.org/10.1002/wcc.64.
Kwakkel, J. H., M. Haasnoot, and W. E. Walker. 2016. “Comparing robust decision-making and dynamic adaptive policy pathways for model-based decision support under deep uncertainty.” Environ. Modell. Software 86 (Sep): 168–183. https://doi.org/10.1016/j.envsoft.2016.09.017.
Lee, J. G., A. Selvakumar, K. Alvi, J. Riverson, J. X. Zhen, L. Shoemaker, and F. Lai. 2012. “A watershed-scale design optimization model for stormwater best management practices.” Environ. Modell. Software 37 (Apr): 6–18. https://doi.org/10.1016/j.envsoft.2012.04.011.
Locke, R. A., and S. C. Meyer. 2005. Kane County water resources investigations: Interim report on shallow aquifer potentiometric surface mapping. Contract Rep. 2005-4. Champaign, IL: Illinois State Water Survey, Center for Groundwater Science.
Maryland Department of Planning. 2010. “Maryland Department of Planning land cover land use data.” Accessed March 24, 2019. https://data.imap.maryland.gov/datasets/maryland-land-use-land-cover-county-land-use-land-cover-2010.
McCuen, R. H., Z. Knight, and A. G. Cutter. 2006. “Evaluation of the Nash–Sutcliffe efficiency index.” J. Hydrol. Eng. 11 (6): 597–602. https://doi.org/10.1061/(ASCE)1084-0699(2006)11:6(597).
Miller, J. D., and M. Hutchins. 2017. “The impacts of urbanisation and climate change on urban flooding and urban water quality: A review of the evidence concerning the United Kingdom.” J. Hydrol.: Reg. Stud. 12 (3): 345–362. https://doi.org/10.1016/j.ejrh.2017.06.006.
Mitchell, V. G. 2006. “Applying integrated urban water management concepts: A review of Australian experience.” Environ. Manage. 37 (5): 589–605. https://doi.org/10.1007/s00267-004-0252-1.
Moore, T. L., J. S. Gulliver, L. Stack, and M. H. Simpson. 2016. “Stormwater management and climate change: Vulnerability and capacity for adaptation in urban and suburban contexts.” Clim. Change 138 (3): 491–504. https://doi.org/10.1007/s10584-016-1766-2.
Moriasi, D. N., J. G. Arnold, M. W. Van Liew, R. L. Bingner, R. D. Harmel, and T. L. Veith. 2007. “Model evaluation guidelines for systematic quantification of accuracy in watershed simulations.” Trans. ASABE 50 (3): 885–900. https://doi.org/10.13031/2013.23153.
MWRD (Metropolitan Water Reclamation District of Greater Chicago). 2004. “Comprehensive annual financial report.” Accessed May 21, 2022. https://mwrd.org/sites/default/files/documents/CAFR2004.pdf.
Nordman, E. E., E. Isely, P. Isely, and R. Denning. 2018. “Benefit-cost analysis of stormwater green infrastructure practices for grand rapids, Michigan, USA.” J. Cleaner Prod. 200 (Jun): 501–510. https://doi.org/10.1016/j.jclepro.2018.07.152.
NRCS (Natural Resources Conservation Service). 2017. “Description of SSURGO database.” Accessed October 30, 2017. https://www.nrcs.usda.gov/wps/portal/nrcs/detail/soils/survey/?cid=nrcs142p2_053627.
Parajuli, P. B., N. O. Nelson, L. D. Frees, and K. R. Mankin. 2009. “Comparison of AnnAGNPS and SWAT model simulation results in USDA-CEAP agricultural watersheds in south-central Kansas.” Hydrol. Processes Int. J. 23 (5): 748–763. https://doi.org/10.1002/hyp.7174.
Patt, A., R. J. T. Klein, and A. De Vega-leinert. 2005. “Taking the uncertainty in climate-change vulnerability assessment seriously.” C.R. Geosci. 337 (4): 411–424. https://doi.org/10.1016/j.crte.2004.11.006.
Prudencio, L., and S. E. Null. 2018. “Stormwater management and ecosystem services: A review.” Environ. Res. Lett. 13 (3): 033002. https://doi.org/10.1088/1748-9326/aaa81a.
Refsgaard, J. C. 1997. “Parameterisation, calibration and validation of distributed hydrological models.” J. Hydrol. 198 (1–4): 69–97. https://doi.org/10.1016/S0022-1694(96)03329-X.
Rosenberg, E. A., P. W. Keys, D. B. Booth, D. Hartley, J. Burkey, A. C. Steinemann, and D. P. Lettenmaier. 2010. “Precipitation extremes and the impacts of climate change on stormwater infrastructure in Washington state.” Clim. Change 102 (1): 319–349. https://doi.org/10.1007/s10584-010-9847-0.
Roy, A. H., S. J. Wenger, T. D. Fletcher, C. J. Walsh, A. R. Ladson, W. D. Shuster, H. W. Thurston, and R. R. Brown. 2008. “Impediments and solutions to sustainable, watershed-scale urban stormwater management: Lessons from Australia and the United States.” Environ. Manage. 42 (2): 344–359. https://doi.org/10.1007/s00267-008-9119-1.
Saraswat, C., P. Kumar, and B. K. Mishra. 2016. “Assessment of stormwater runoff management practices and governance under climate change and urbanization: An analysis of Bangkok, Hanoi and Tokyo.” Environ. Sci. Policy 64 (Mar): 101–117. https://doi.org/10.1016/j.envsci.2016.06.018.
Schicht, R., J. R. Adams, and J. B. Stall. 1976. Water resources availability, quality, and cost in northeastern Illinois. Champaign, IL: Illinois State Water Survey.
Schilling, J., and J. Logan. 2008. “Greening the rust belt: A green infrastructure model for right sizing America’s shrinking cities.” J. Am. Plann. Assoc. 74 (4): 451–466. https://doi.org/10.1080/01944360802354956.
Schmidli, J., C. Frei, and P. L. Vidale. 2006. “Downscaling from GCM precipitation: A benchmark for dynamical and statistical downscaling methods.” Int. J. Climatol. 26 (4): 679–689. https://doi.org/10.1002/joc.1287.
Shoemaker, L., J. Riverson, K. Alvi, J. X. Zhen, and R. Murphy. 2012. Report on enhanced framework (SUSTAIN) and field applications to placement of BMPs in urban watersheds. Washington, DC: US Environmental Protection Agency.
Shoemaker, L., J. Riverson, K. Alvi, J. X. Zhen, S. Paul, and T. Rafi. 2009. Sustain: A framework for placement of best management practices in urban watersheds to protect water quality. Washington, DC: USEPA.
Sun, Y., S. Tong, and Y. J. Yang. 2016. “Modeling the cost-effectiveness of stormwater best management practices in an urban watershed in Las Vegas Valley.” Appl. Geogr. 76 (4): 49–61. https://doi.org/10.1016/j.apgeog.2016.09.005.
Sundberg, C., G. Svensson, and H. So. 2004. “Re-framing the assessment of sustainable stormwater systems.” Clean Technol. Environ. Policy 6 (2): 120–127. https://doi.org/10.1007/s10098-003-0227-6.
Taylor, K., R. J. Stouffer, and G. A. Meehl. 2012. “An overview of CMIP5 and the experiment design.” Bull. Am. Meteorol. Soc. 93 (2): 485–498. https://doi.org/10.1175/BAMS-D-11-00094.1.
Teutschbein, C., and J. Seibert. 2012. “Bias correction of regional climate model simulations for hydrological climate-change impact studies: Review and evaluation of different methods.” J. Hydrol. 456 (5): 12–29. https://doi.org/10.1016/j.jhydrol.2012.05.052.
Tzoulas, K., K. Korpela, S. Venn, V. Yli-Pelkonen, A. Ka, J. Niemela, and P. James. 2007. “Promoting ecosystem and human health in urban areas using green infrastructure: A literature review.” Landscape Urban Plann. 81 (3): 167–178. https://doi.org/10.1016/j.landurbplan.2007.02.001.
United Nations. 2018. “Revision of world urbanization prospects.” Accessed May 21, 2022. https://www.un.org/development/desa/publications/2018-revision-of-world-urbanization-prospects.html.
USEPA. 2015. Tools strategies and lessons learned from EPA green infrastructure technical assistance projects. Washington, DC: USEPA.
USEPA. 2022. “System for urban stormwater treatment and analysis integration (SUSTAIN).” Accessed May 21, 2022. https://www.epa.gov/water-research/system-urban-stormwater-treatment-and-analysis-integration-sustain.
Vieux, B. E., and P. B. Bedient. 2004. “Assessing urban hydrologic prediction accuracy through event reconstruction.” J. Hydrol. 299 (3–4): 217–236. https://doi.org/10.1016/S0022-1694(04)00366-X.
Vogel, J. R., T. L. Moore, R. R. Coffman, S. N. Rodie, S. L. Hutchinson, R. Kelsey, A. J. McLemore, and J. T. McMaine. 2015. “Critical review of technical questions facing low impact development and green infrastructure: A perspective from the Great Plains.” Water Environ. Res. 87 (9): 849–862. https://doi.org/10.2175/106143015X14362865226392.
Wagener, T., M. Sivapalan, P. Troch, and R. Woods. 2007. “Catchment classification and hydrologic similarity.” Geogr. Compass 1 (4): 901–931. https://doi.org/10.1111/j.1749-8198.2007.00039.x.
Walton, W. C. 1965. Ground-water recharge and runoff in Illinois. Champaign, IL: Illinois State Water Survey.
Willems, P., K. Arnbjerg-Nielsen, J. Olsson, and V. T. V. Nguyen. 2012. “Climate change impact assessment on urban rainfall extremes and urban drainage: Methods and shortcomings.” Atmos. Res. 103 (4): 106–118. https://doi.org/10.1016/j.atmosres.2011.04.003.
Wood, A. W., L. R. Leung, V. Sridhar, and D. P. Lettenmaier. 2004. “Hydrologic implications of dynamical and statistical approaches to downscaling climate model outputs.” Clim. Change 62 (1–3): 189–216. https://doi.org/10.1023/B:CLIM.0000013685.99609.9e.
Yang, J., P. Reichert, K. C. Abbaspour, and H. Yang. 2007. “Hydrological modelling of the Chaohe Basin in China: Statistical model formulation and Bayesian inference.” J. Hydrol. 340 (3–4): 167–182. https://doi.org/10.1016/j.jhydrol.2007.04.006.
Zhou, Q. 2014. “A review of sustainable urban drainage systems considering the climate change and urbanization impacts.” Water 6 (4): 976–992. https://doi.org/10.3390/w6040976.
Information & Authors
Information
Published In

Journal of Sustainable Water in the Built Environment
Volume 8 • Issue 4 • November 2022
Copyright
This work is made available under the terms of the Creative Commons Attribution 4.0 International license, https://creativecommons.org/licenses/by/4.0/.
History
Received: Sep 26, 2021
Accepted: Apr 2, 2022
Published online: Jun 20, 2022
Published in print: Nov 1, 2022
Discussion open until: Nov 20, 2022
ASCE Technical Topics:
- Benefit cost ratios
- Business management
- Climate change
- Climates
- Engineering fundamentals
- Environmental engineering
- Financial management
- Flow simulation
- Infrastructure
- Models (by type)
- Practice and Profession
- River engineering
- River systems
- Stormwater management
- Sustainable development
- Urban and regional development
- Water and water resources
- Water treatment
- Watersheds
Authors
Metrics & Citations
Metrics
Citations
Download citation
If you have the appropriate software installed, you can download article citation data to the citation manager of your choice. Simply select your manager software from the list below and click Download.
Cited by
- Alessandra Zanoletti, Elza Bontempi, Editorial: Urban runoff of pollutants and their treatment, Frontiers in Environmental Chemistry, 10.3389/fenvc.2023.1151859, 4, (2023).
- Bello M. Zailani, James G. Hunter, Camille Jenkins, Kamalesh Panthi, Sustainable Outcomes for Community-Driven Project Delivery: An Assessment of the Clean Water Partnership in Prince George’s County, MD, International Low Impact Development Conference 2023, 10.1061/9780784485002.003, (20-36), (2023).