Evaluation of Key Performance Aspects of a Novel Precast Noise Barrier Wall System Based on Nonlinear Finite-Element Simulations
Publication: Journal of Structural Engineering
Volume 150, Issue 11
Abstract
An extensive experimental program was performed to evaluate the structural behavior of a novel fully prefabricated noise barrier wall system. The experimental investigation entailed the fabrication and testing of two full-scale prototypes, which was the foundation for implementing a systematic parametric nonlinear finite-element analysis (NLFEA) study. The intent was to assess the impact of four critical parameters on the overall structural behavior of the noise barrier wall system for further optimization and improvement. These critical parameters include the integral column size, the presence of a gap, the type of steel section utilized, and the embedment length of the steel section. Therefore, the parent nonlinear finite-element analysis model was created, calibrated, and verified against the experimental results of the full-scale prototypes in terms of the load–deflection curves, load–strain curves, cracking patterns, and failure modes. Then, various nonlinear finite-element analysis models were created by expanding the parent model to allow for evaluating various possibilities from each parameter. For a preidentified performance acceptance criterion, the findings of the study revealed that the integral column size could be reduced from the size used in the prototypes, the embedment length of the steel section was already at an optimum length, the existence of a gap would result in the prevention of any sliding, and a circular hollow steel section (HSS) or would represent the most advantageous selection for the steel column section.
Background
Noise wall barriers, also known as sound or acoustic barriers, serve as purpose-built structures to minimize sound transfer between different areas. These barriers find typical placement along highways, railways, and transportation routes, which play a crucial role in alleviating the detrimental effects of noise pollution on adjacent communities. As highway networks continue to expand, the surge in traffic amplifies noise pollution levels, impacting nearby residential neighborhoods. The allure of convenient commuting to work, school, and leisure activities has spurred the growth of new residential developments in immediate proximity to these roadways.
Murphy and King (2014) reported that California’s first noise barriers were constructed in 1968. Since then, there has been a consistent increase in the adoption of noise barriers to mitigate noise pollution. Even though noise barriers can incur significant costs, they are widely employed as a frequent solution for reducing noise transmission along roads or railways. Noise barriers, including earth berms, stand as the prevailing form of mitigation embraced by multiple states in the US to address road traffic noise, as noted by Bendtsen (2010). As outlined in the Federal Highway Administration (FHWA) Noise Barrier Design Handbook for highways, various materials find application in constructing noise barriers. These materials encompass concrete, brick, masonry, metals, wood, transparent panels, plastics, and composites (FHWA 2000).
Noise barriers can be categorized into two main types: ground-mounted barriers and structure-mounted barriers. Ground-mounted barriers encompass noise berms, noise walls, and combinations of both. On the other hand, structure-mounted barriers include noise walls installed on bridges and retaining walls. The structural design of ground-mounted barriers focuses on providing standalone support structures, whereas structure-mounted ones rely on the existing structures for support and attachment (Illinois State Toll Highway Authority 2021). According to the AASHTO LRFD, the design of a noise barrier system involves assessing multiple design loads, including dead load, wind load, snow loads, seismic, and impact loads (AASHTO 2014).
The advancement and introduction of new wall systems are pivotal in various industries and sectors, ranging from construction and architecture to environmental mitigation and technology. These developments are critical for addressing evolving needs, challenges, and opportunities. In this context, innovation is not merely a luxury but a necessity that drives progress and helps overcome constraints, improve efficiency, and achieve sustainability goals. This introduction explores the significance of advancing wall systems and introducing new technologies and approaches to meet the demands of a rapidly changing world.
Farhat et al. (2017) developed and examined the structural performance of a prefabricated counterfort retaining wall system. The study evaluated the proposed retaining wall system’s structural performance using full-scale experimental testing. The fully prefabricated counterfort retaining wall system consisted of two prefabricated components: the wall component, which included a face panel with three counterforts, and the base slab component. The counterforts serve as face panel stiffeners and connect the wall to the base slab; each counterfort is connected to the base slab using headed anchors, thereby reinforcing the system’s integrity to accomplish full composite action. The prototype’s structural testing considered soil pressure, surcharge, and service load. The experimental testing results demonstrated that the proposed system’s efficacy is adequate for highway applications (Farhat and Issa 2017). It satisfies the requirement for accelerated construction. In addition, the results showed that the headed anchors met the specifications for serviceability and ultimate strength.
The study also involved the development of a three-dimensional (3D) nonlinear finite-element analysis (NLFEA) model, which served multiple purposes. Firstly, it aimed to validate whether the proposed system met the required structural stability requirements under service and ultimate loads. Additionally, the model was employed to investigate the deflection at various system heights. Furthermore, it was used to assess the behavior of the anchors responsible for connecting the wall system to the base slab and to determine if the provided steel reinforcement was adequate for the intended purpose (Farhat et al. 2019). The study findings indicated that the NLFEA models accurately anticipated the headed anchors’ performance, predicted the wall system’s deflection, and played a crucial role in determining the adequate steel reinforcement ratio. As a result of the precision of the 3D NLFEA model created, subsequent parametric investigations and assessments were conducted. These included examining the pull-out characteristics of the headed anchors and design optimization of the counterfort wall system.
Since the introduction of noise wall barriers in California in 1968, numerous advancements have been made, with a strong emphasis on enhancing their effectiveness, aesthetics, construction techniques, structural performance, and sustainability. In an experimental study, Vacek et al. (2015) investigated a new generation of concrete precast panels for noise barriers. The study aimed to create a precast panel for a noise barrier that could withstand its weight, wind, and snow loads but not lateral ground pressure. The researchers tested three full-scale prototypes of the suggested precast panels, including sound absorption and static loading tests. In contrast to existing noise wall barrier panels, composed of double-layer slabs of lightweight concrete, the suggested panel was made of a single slab of normal-weight concrete with a trapezoidal surface shape from the panel’s side facing the noise source. As a result, a cheaper precast panel with the same dimensions as conventional panels will be produced. The mechanical tests considered the wind load and the static action of the weight of the panels. All three tested panels proved capable of withstanding self-weight and wind load. The study highlighted that initial cracking was due to the weakened portions of the trapezoidal shape.
Daee and El Naggar (2017) evaluated a noise wall barrier’s structural behavior from polyurethane components. This innovative wall system consisted of rigid polyurethane foam cores reinforced with steel rebars that seamlessly linked to the wall’s foundation. A protective polyurea coating was applied to both sides of the polyurethane blocks to enhance its resilience against various environmental challenges, including abrasion, impact, weathering, fire, and water penetration. Following an extensive experimental program, which encompassed a thorough evaluation of the critical mechanical properties of rigid polyurethane foam and an in-depth assessment of the proposed wall system’s structural performance, a comprehensive 3D NLFEA model was developed using commercial software ABAQUS (Dassault Systèmes Simulia Corp. 2011). They evaluated the structural performance of the system, delving into key aspects such as load–strain relationships, load–deflection behavior, and moment–displacement. They also considered the influence of factors such as the system’s self-weight, vertical loading, and the effects of wind-induced forces. The study’s findings demonstrated that the NLFEA models accurately predicted the performance of the proposed wall system, achieving a level of precision that enabled the authors to pursue additional parametric investigations.
In the field of structural engineering, particularly in the analysis and design of concrete structures, the complex interaction of nonlinear behavior poses a significant challenge, prompting a thorough investigation into various numerical models to effectively capture the complex responses observed in these structures. Marzok et al. (2020) conducted a study that aimed to present how different models and software can provide various predictions and numerical solutions for the problem input. The study employed six different commonly used models to simulate the results of 12 previously reported experimental investigations. The study concluded that numerical solutions for the displacement capacity had a larger error when compared with solutions relating the moment capacity.
Ahmed et al. (2023) conducted an investigation exploring the behavior of slender reinforced concrete walls with complex configurations. The research presented a NLFEA 3D continuum modeling methodology to analyze both planar and nonplanar walls, including those with openings, under constant axial load, as well as unidirectional and bidirectional lateral loading conditions. The study employed the ATENA NC2 concrete constitutive model, incorporating 3D plastic damage with nonassociate to accurately characterize concrete behavior. The model enabled the precise simulation of nonlinear compression response, tensile response, reduced shear capacity due to cracking, and softening in tension and compression. The findings of the investigation contributed to a deeper understanding of the behavior of concrete reinforced walls with varying configurations.
Minaie et al. (2014) developed a 3D finite-element model to effectively analyze the effects of bidirectional loading on the response of reinforced masonry shear walls. The authors utilized the concrete damaged plasticity (CDP) model to simulate the behavior of masonry blocks, mortar, and grout. The study findings demonstrated that the CDP model accurately captured the nonlinear cyclic response of masonry, instilling confidence among researchers to utilize this model for future analyses of masonry behavior. Mortazavi and Zaeimdar (2021) utilized the macroscopic multiple vertical line element model (MVLEM) to model shear wall made of concrete with asymmetric openings. In addition, the authors employed the CDP model in ABAQUS software to simulate the stress–strain relationship for the concrete. The study concluded that MVLEM can provide acceptable accuracy when modeling concrete shear walls with asymmetric openings. Furthermore, the study indicated that using this technique resulted in reducing the time required for computational process.
Elrefae and Issa (2023) developed and examined the structural performance of a pioneering fully prefabricated noise wall barrier by carrying out full-scale experimental testing on two prototypes. The proposed system was developed per AASHTO LFRD Bridge Design Specifications (AASHTO 2014). This paper presents the developed NLFEA modeling of the proposed wall system in terms of parts, assembly, interaction, contact, restraints, material definitions, meshing, loading, convergence, failure criteria, and parametric study.
Objective and Significance
This study holds significant value in that it focuses on refining a NLFEA model. The resulting model will provide a more comprehensive understanding of the structural behavior of the entire wall system and serve as a fundamental tool for designing and optimizing the proposed noise wall barrier system. It considers critical field parameters such as integral column size, embedment length of the steel section, and intentional gap size, enabling more precise and informed design decisions.
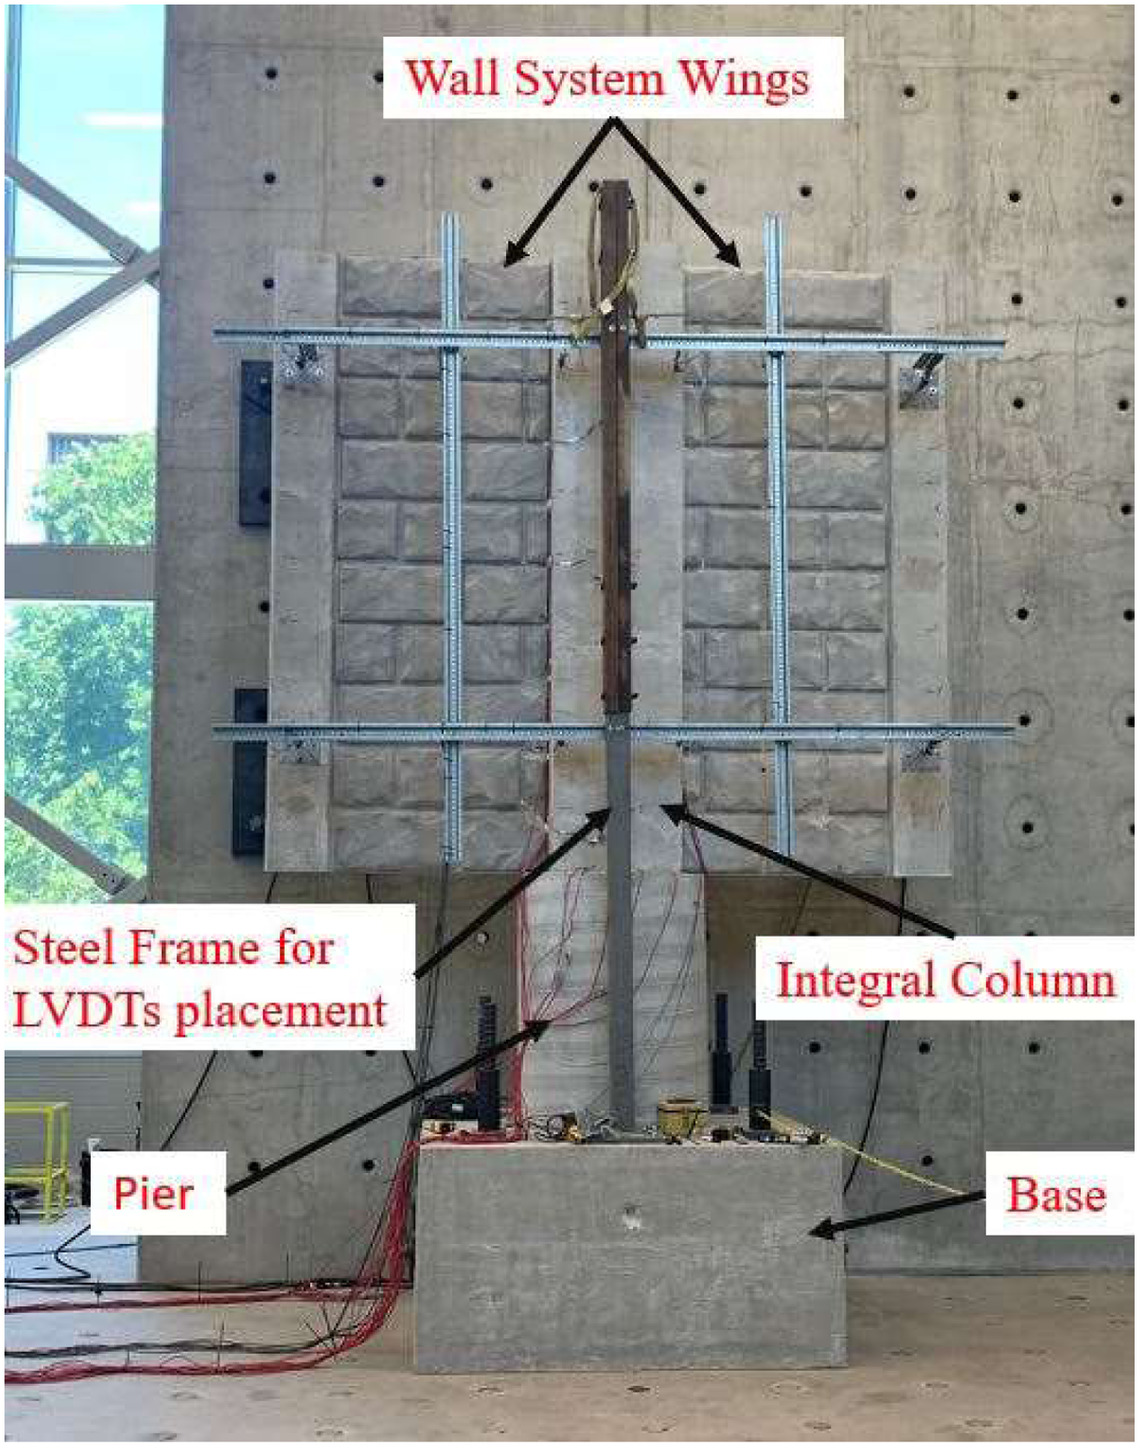
Description of the Wall System
The author’s proposed system is totally precast and prefabricated. Prior to conducting experimental testing, the authors developed a preliminary NLFEA to determine the shapes and dimensions of the wall system components. Subsequently, the experimental program commenced. Following this, the preliminary model underwent proper calibration to enable the development of a model capable of conducting parametric studies. The wall system can be divided into two main parts: the superstructure and the substructure. The noise barrier wall system has a total height of 17 ft (5.18 m) and a width of 11 ft (3.35 m). The superstructure includes an integral concrete column with two wings connected on each side, and the precast panels of the system will be installed on these wings. On the other hand, the substructure incorporates a concrete pier and base. The height of the wall system may vary depending on the location and noise levels in field applications.
Geometric and Reinforcement Details
Fig. 1 shows the proposed noise barrier wall system. The superstructure component entails an integral column and two wings on each side. The integral column measures 24 in. ( in. (609.6 mm) with a length of 10 ft (3.05 m). The substructure component of the system, also known as the foundation, is also precast, making it a unique feature of the system. It consists of a concrete pier and base. The concrete pier has a diameter of 3 ft (0.91 m) and 4 ft (1.22 m) long. Additionally, a 6-ft (1.83-m) steel section was embedded in the middle of the pier with a total embedment length of 2 ft (0.61 m), leaving the remaining 4 ft (1.22 m) free. The concrete base was added for lab testing to enable anchors to be inserted, thus ensuring the wall remained fixed during testing.
The normal-weight concrete used for casting the superstructure components of wall Prototypes 1 and 2 had an average 28-day compressive strengths () of 8.5 ksi (58 MPa) and 8.15 ksi (56 MPa), respectively, tested in accordance with ASTM (2015, 2019, 2021). For the substructure components of the wall Prototypes 1 and 2, the average 28-day compressive strengths () were 8.2 ksi (56.5 MPa) and 7.92 ksi (54.6 MPa), respectively. The yield strength of the steel reinforcement was (420 MPa), whereas for the steel section emerging from the pier and the square hollow steel section (HSS) within the integral column, the yield strength was (350 MPa).
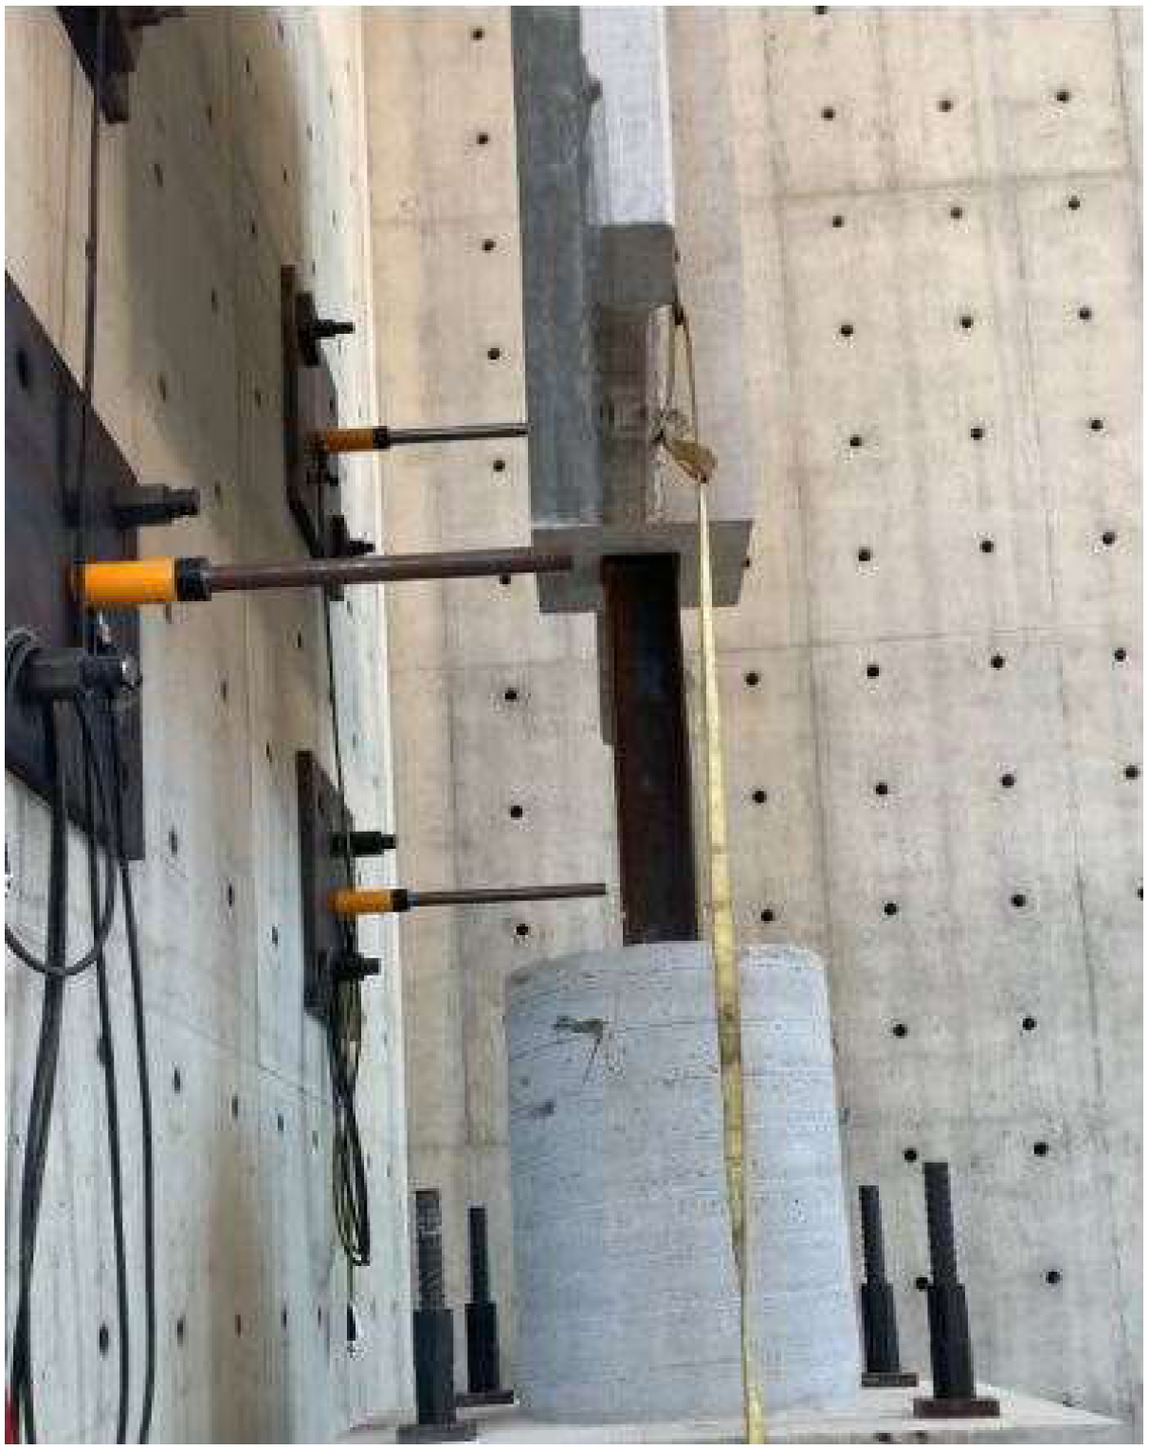
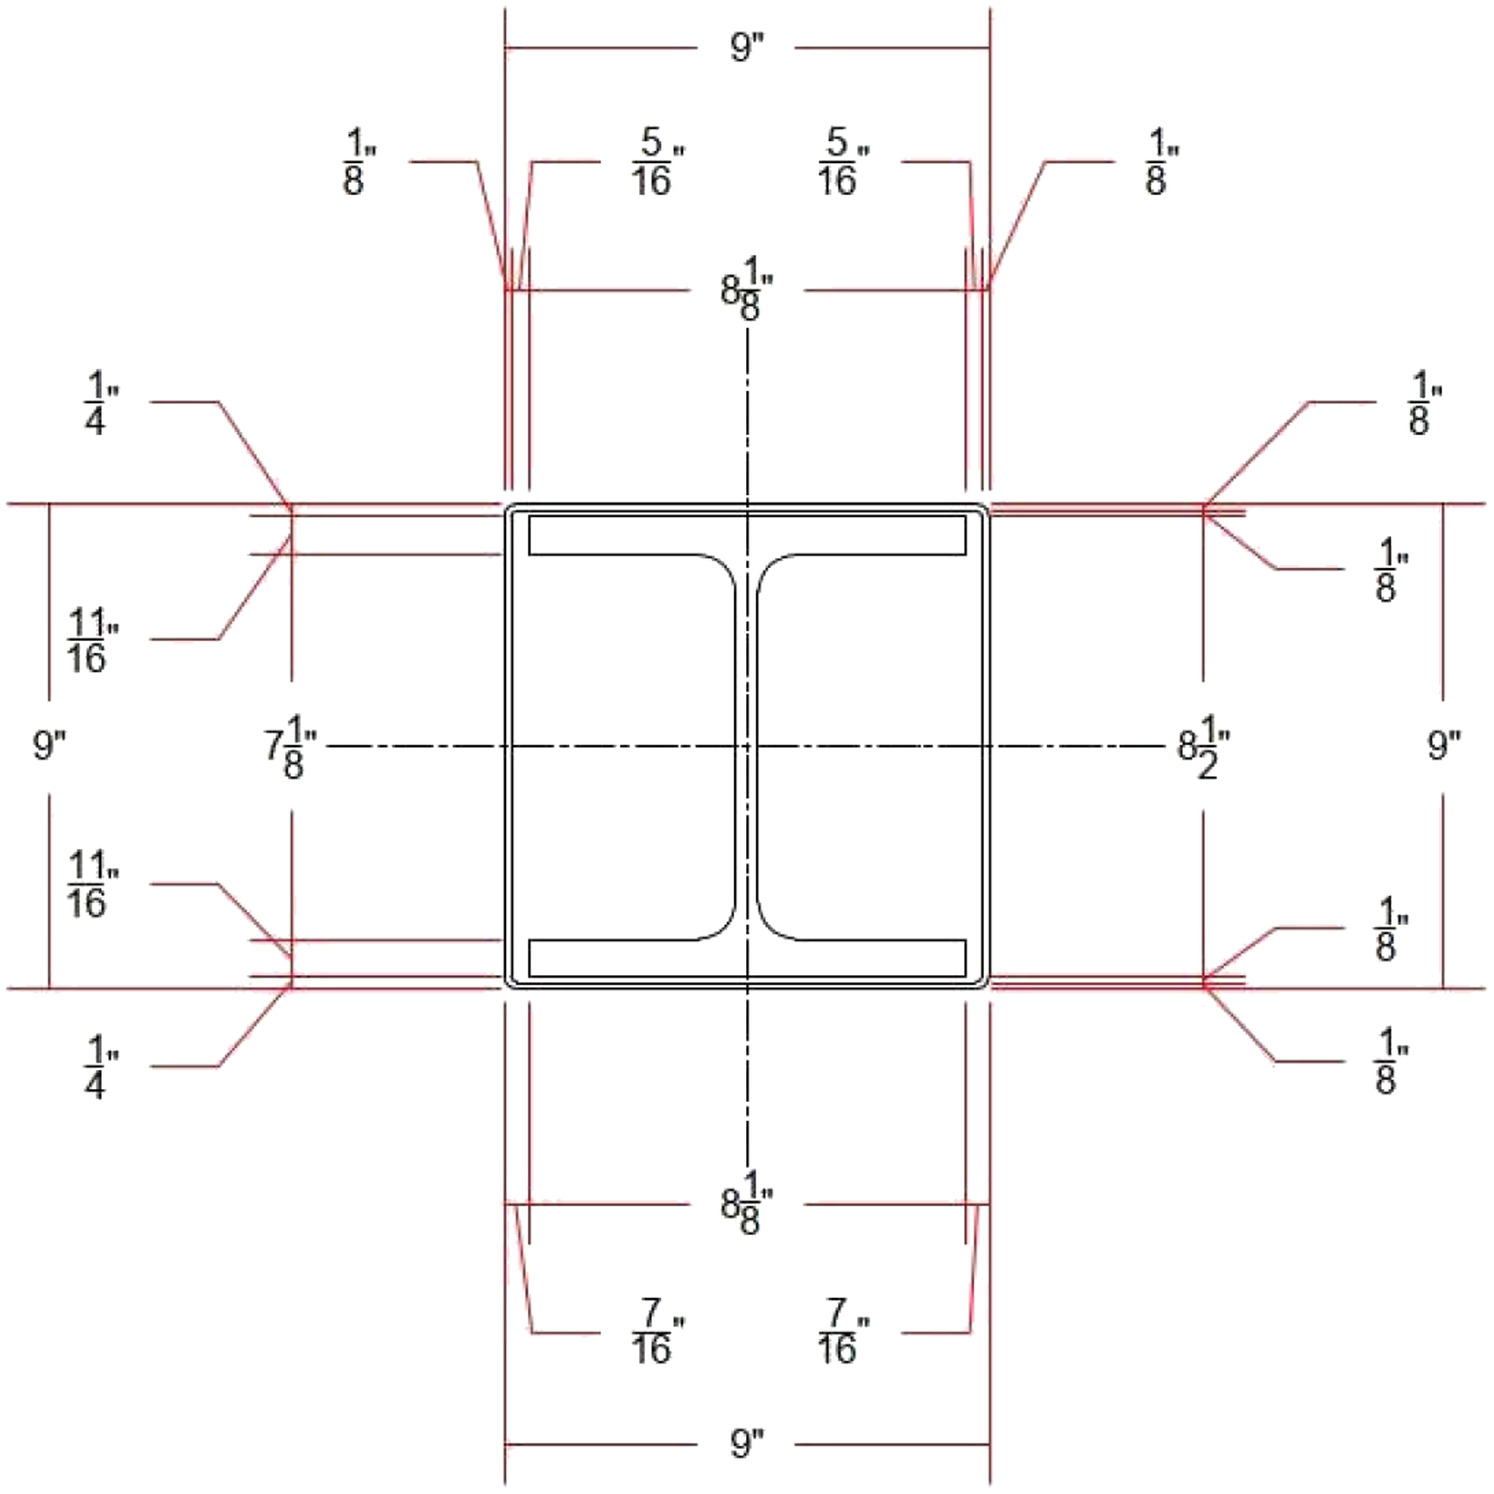
The wall system’s assembly process involved placing the integral column on top of the pier, allowing the steel section’s free part to be perfectly placed inside the groove, as demonstrated in Fig. 2. A 0.125-in. (3.175-mm) space was left between the steel tubing and steel section flanges, as shown in Fig. 3, to provide the system the flexibility and ability to rotate slightly to place the system panels without cracking or permanent deformation.
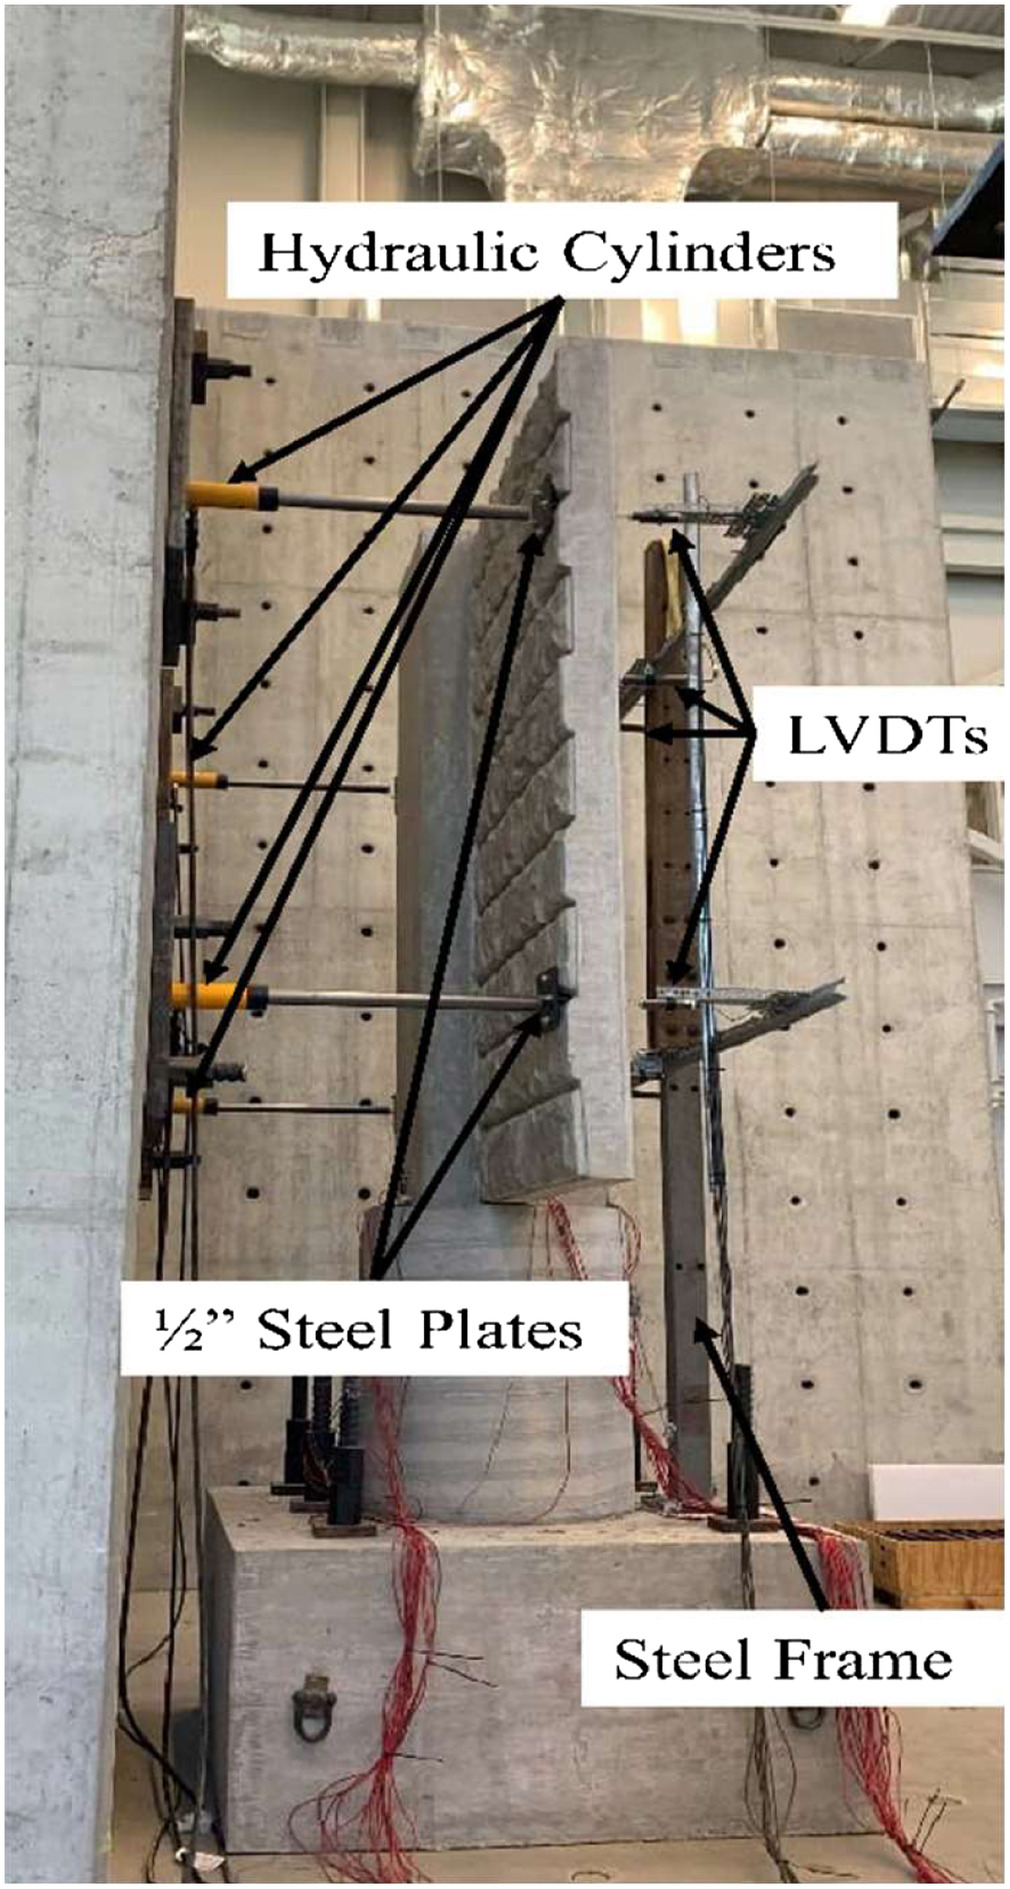
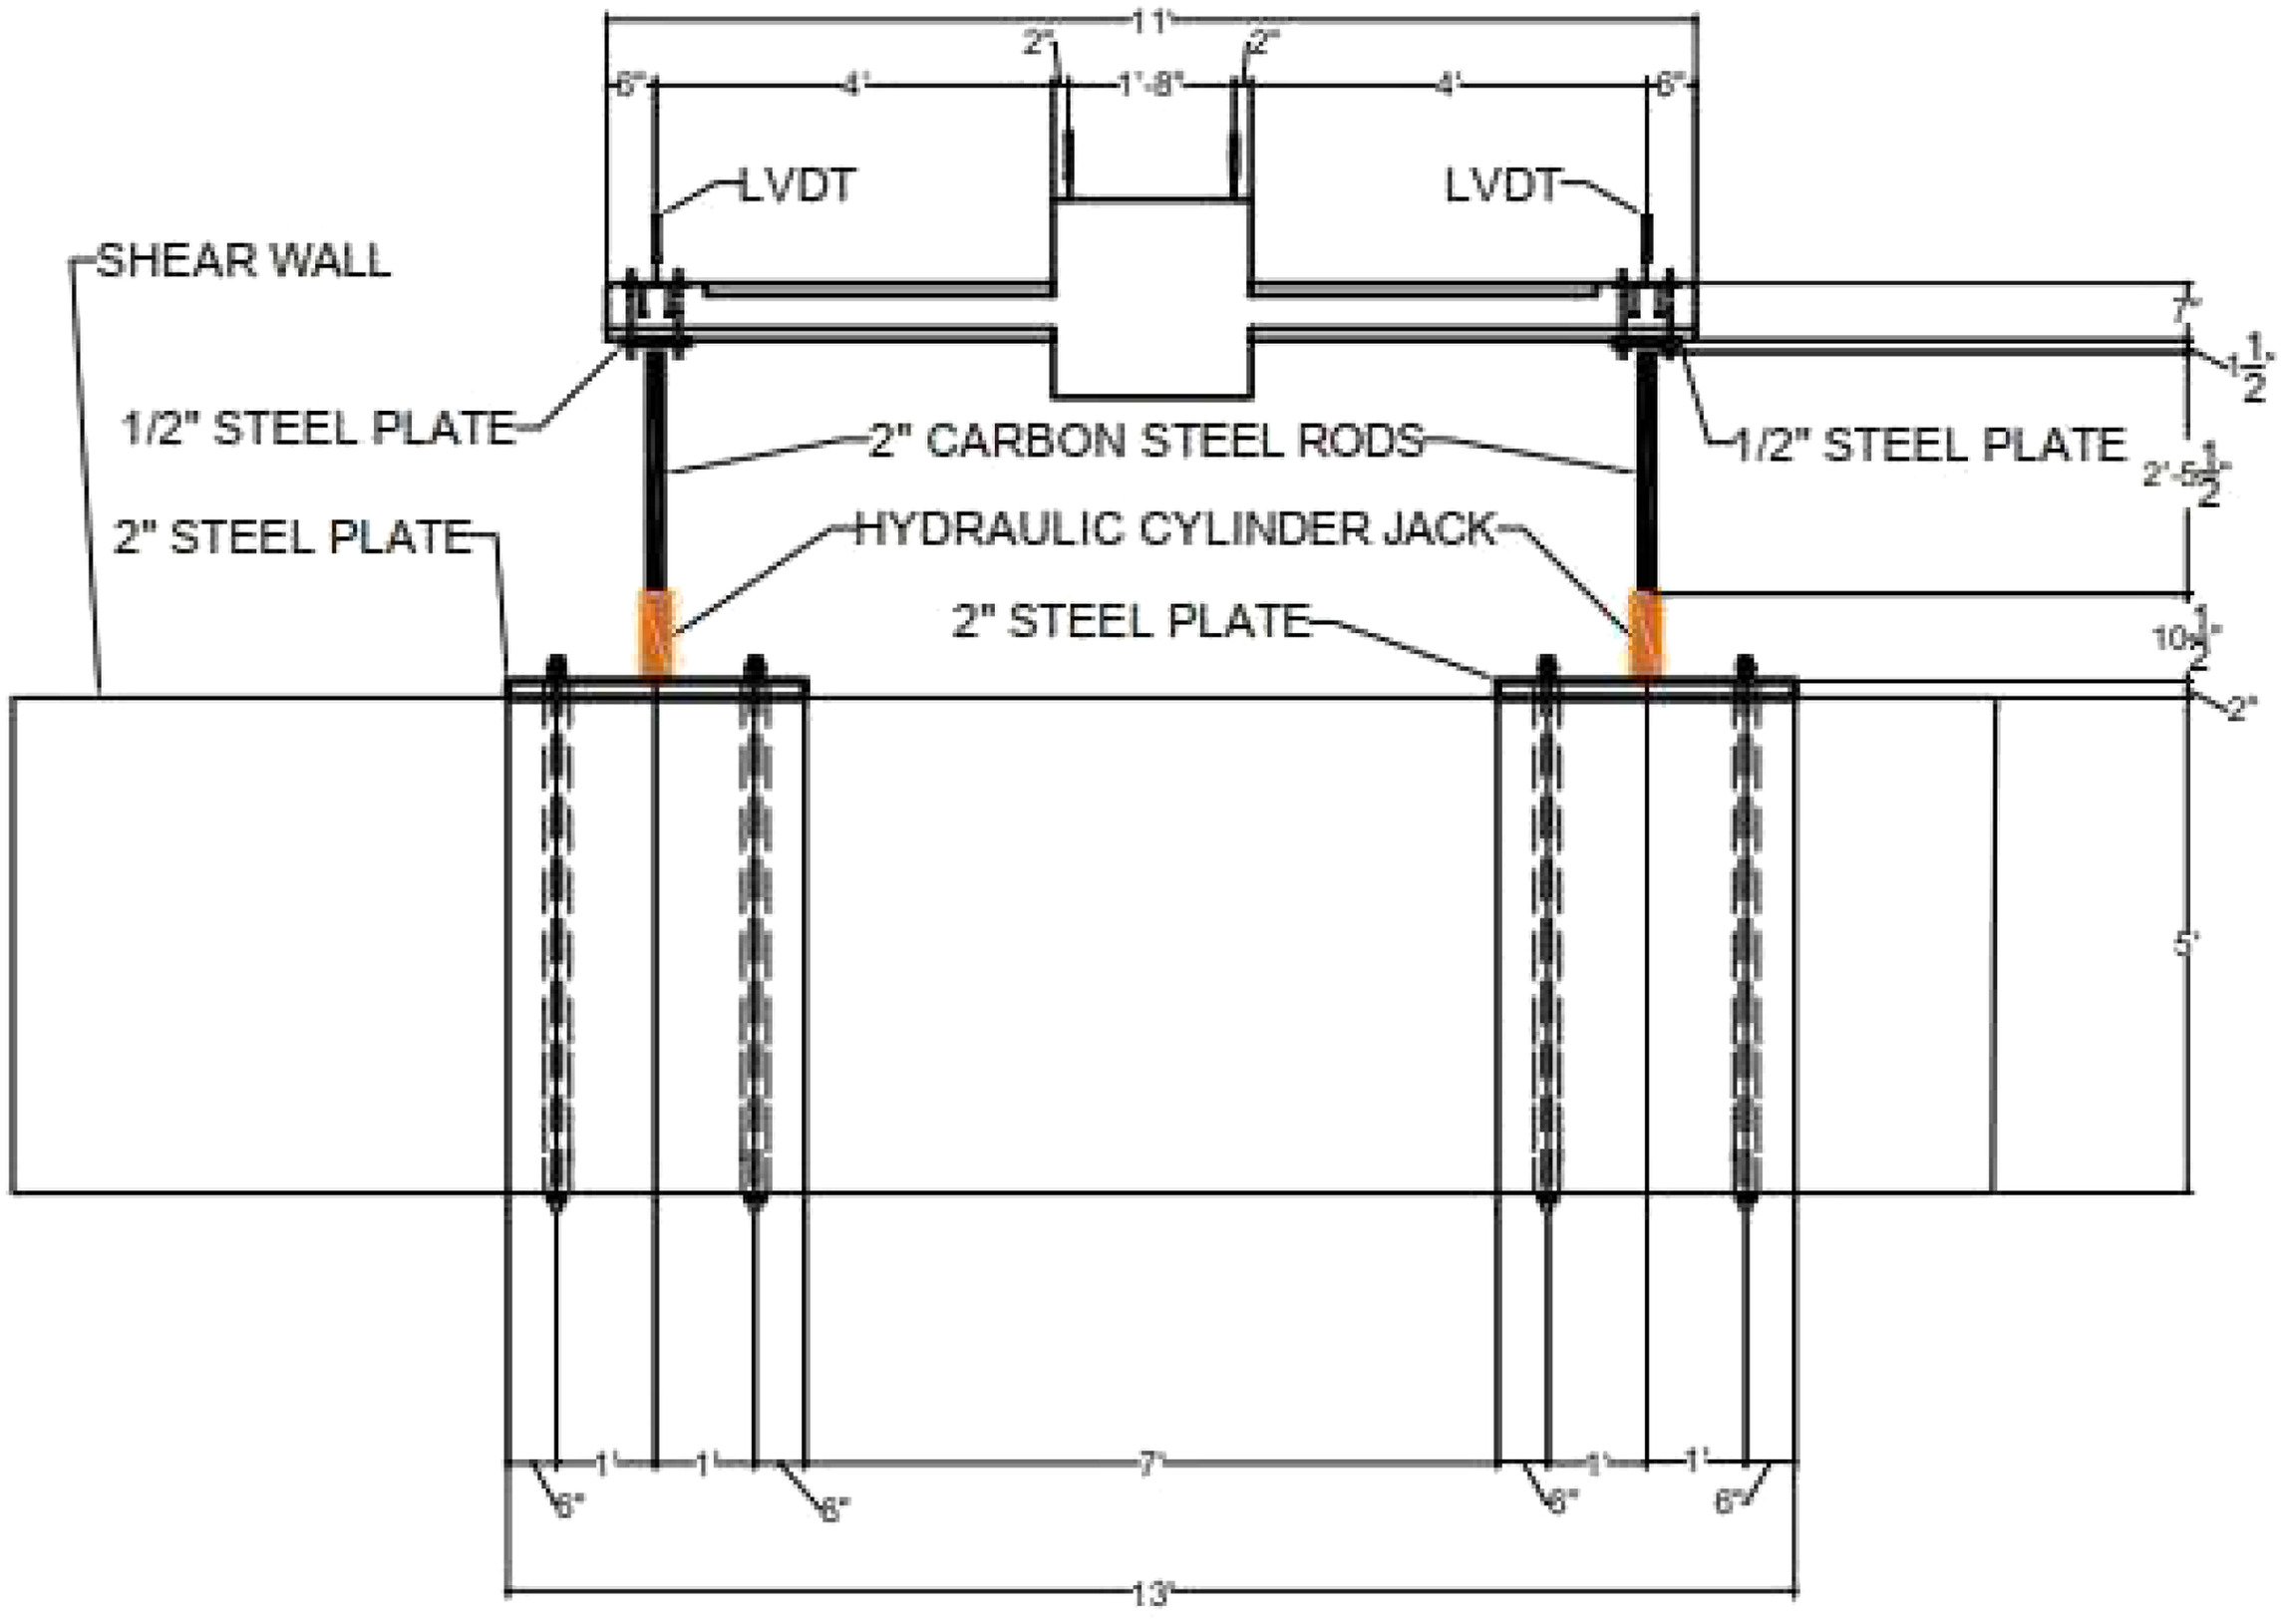
A total of 44 concrete and steel strain gauges were installed to measure the tensile and compressive strains at various points of interest on each wall system prototype. Deflection measurements were recorded using 10 LVDTs. The instruments were connected to a data logger system capable of providing instantaneous strain readings, load applied, and deflection. Figs. 4 and 5 demonstrate the experimental testing setup. The test utilized four single-acting hydraulic cylinder jacks, each with a 25-t capacity and a 6-in. (152-mm) stroke, as depicted in Fig. 5. The hydraulic cylinders were affixed to the rigid shear wall. To apply the load, carbon steel rods 2 in. (51 mm) in diameter were connected to the hydraulic cylinder jacks as presented in Fig. 4. Additionally, steel plates measuring 8 in. ( (12.7 mm) were fastened to the uneven texture of the wall wings to ensure even load distribution and prevent stress concentration. The applied loads per wing for Prototypes 1 and 2 were 16 kips (72 kN) and 20 kips (89 kN), respectively.
Experimental Testing Results
The results of the experimental testing are presented in terms of the deflection of the wall system wings, integral column, and uplift of the wall system superstructure. In addition, strain readings in the steel section, the system wing’s reinforcement, and the wing’s concrete surfaces were measured. The wall system wings achieved an average deflection of 0.125 in. (3.175 mm) when subjected to a load equivalent to a service wind pressure of 15 psf (6.01 kN). In comparison, the maximum allowable deflection under such loading was 0.675 in. (17.2 mm). The integral column achieved an average deflection of 0.16 in. (4.1 mm) when subjected to a load equivalent to the specified service wind pressure; the maximum allowable deflection under such loading was equal to 0.33 in. (8.5 mm), thus indicating that service limits were met for both the system wall wings and integral column.
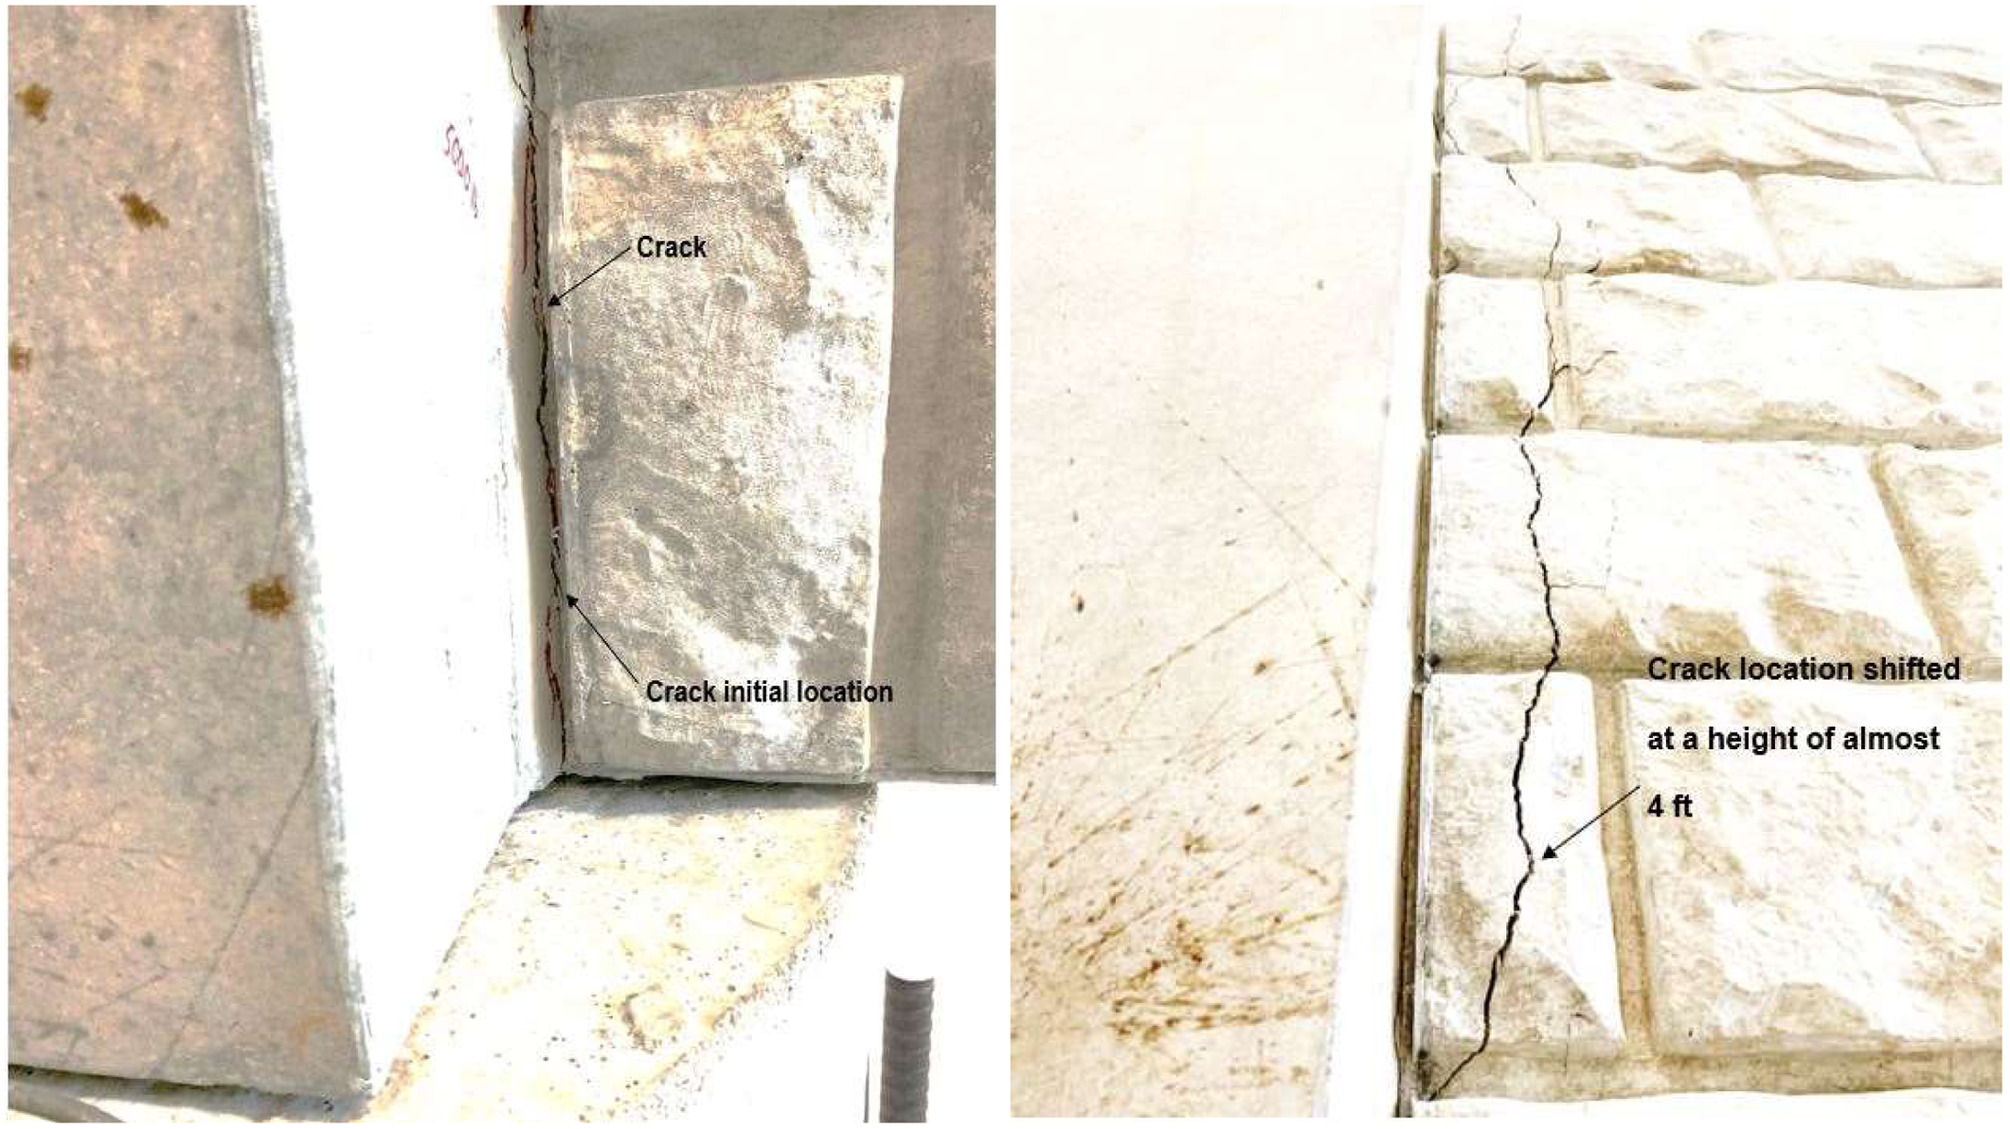
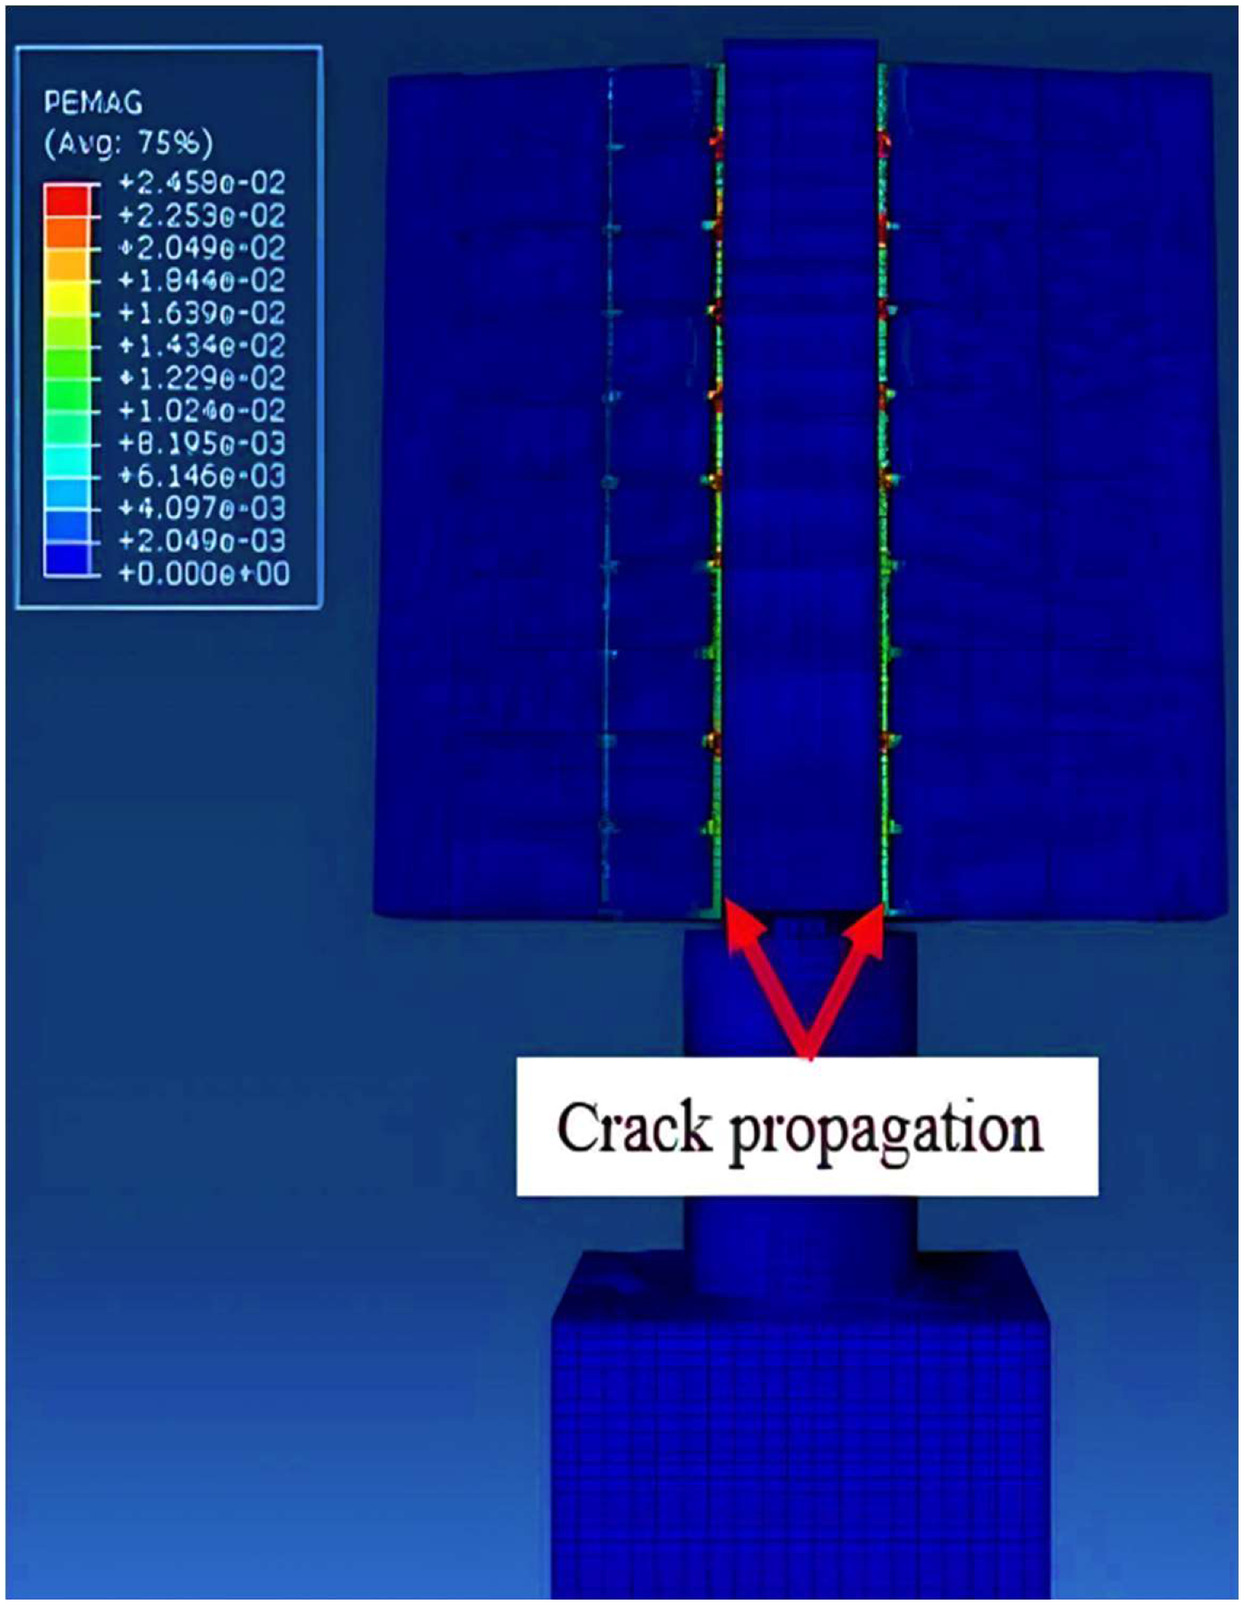
The wall system’s steel section for Prototype 2 developed tensile strains that exceeded the yielding strain of at an applied load that exceeded the serviceability and strength limits. During the testing program, a careful visual check of the wall’s tensile face showed visible cracks at the wing–integral column connection (Fig. 6), which is where the maximum moment location is located. The initial visible crack, measuring approximately 10 in. (254 mm) in length, initiated from the bottom of the wing–integral column connection and propagated along the height of the wall system.
The experimental program showed the wall system’s ability to ensure composite action among its various components. In addition, the experimental testing program showed the wall system’s ability to meet the requirements of the AASHTO LRFD and Illinois State Toll Highway Authority (2021) Structure Design Manual regarding strength and service under the applied loading.
NLFEA Modeling
Employing the commercial software ABAQUS version 2020, two 3D NLFEA models were meticulously developed to precisely simulate the structural responses of Prototypes 1 and 2 of the tested noise wall barrier system. After proper calibration and validation, the developed model for Prototype 2 was used to conduct parametric studies on critical parameters.
Material Constitutive Models
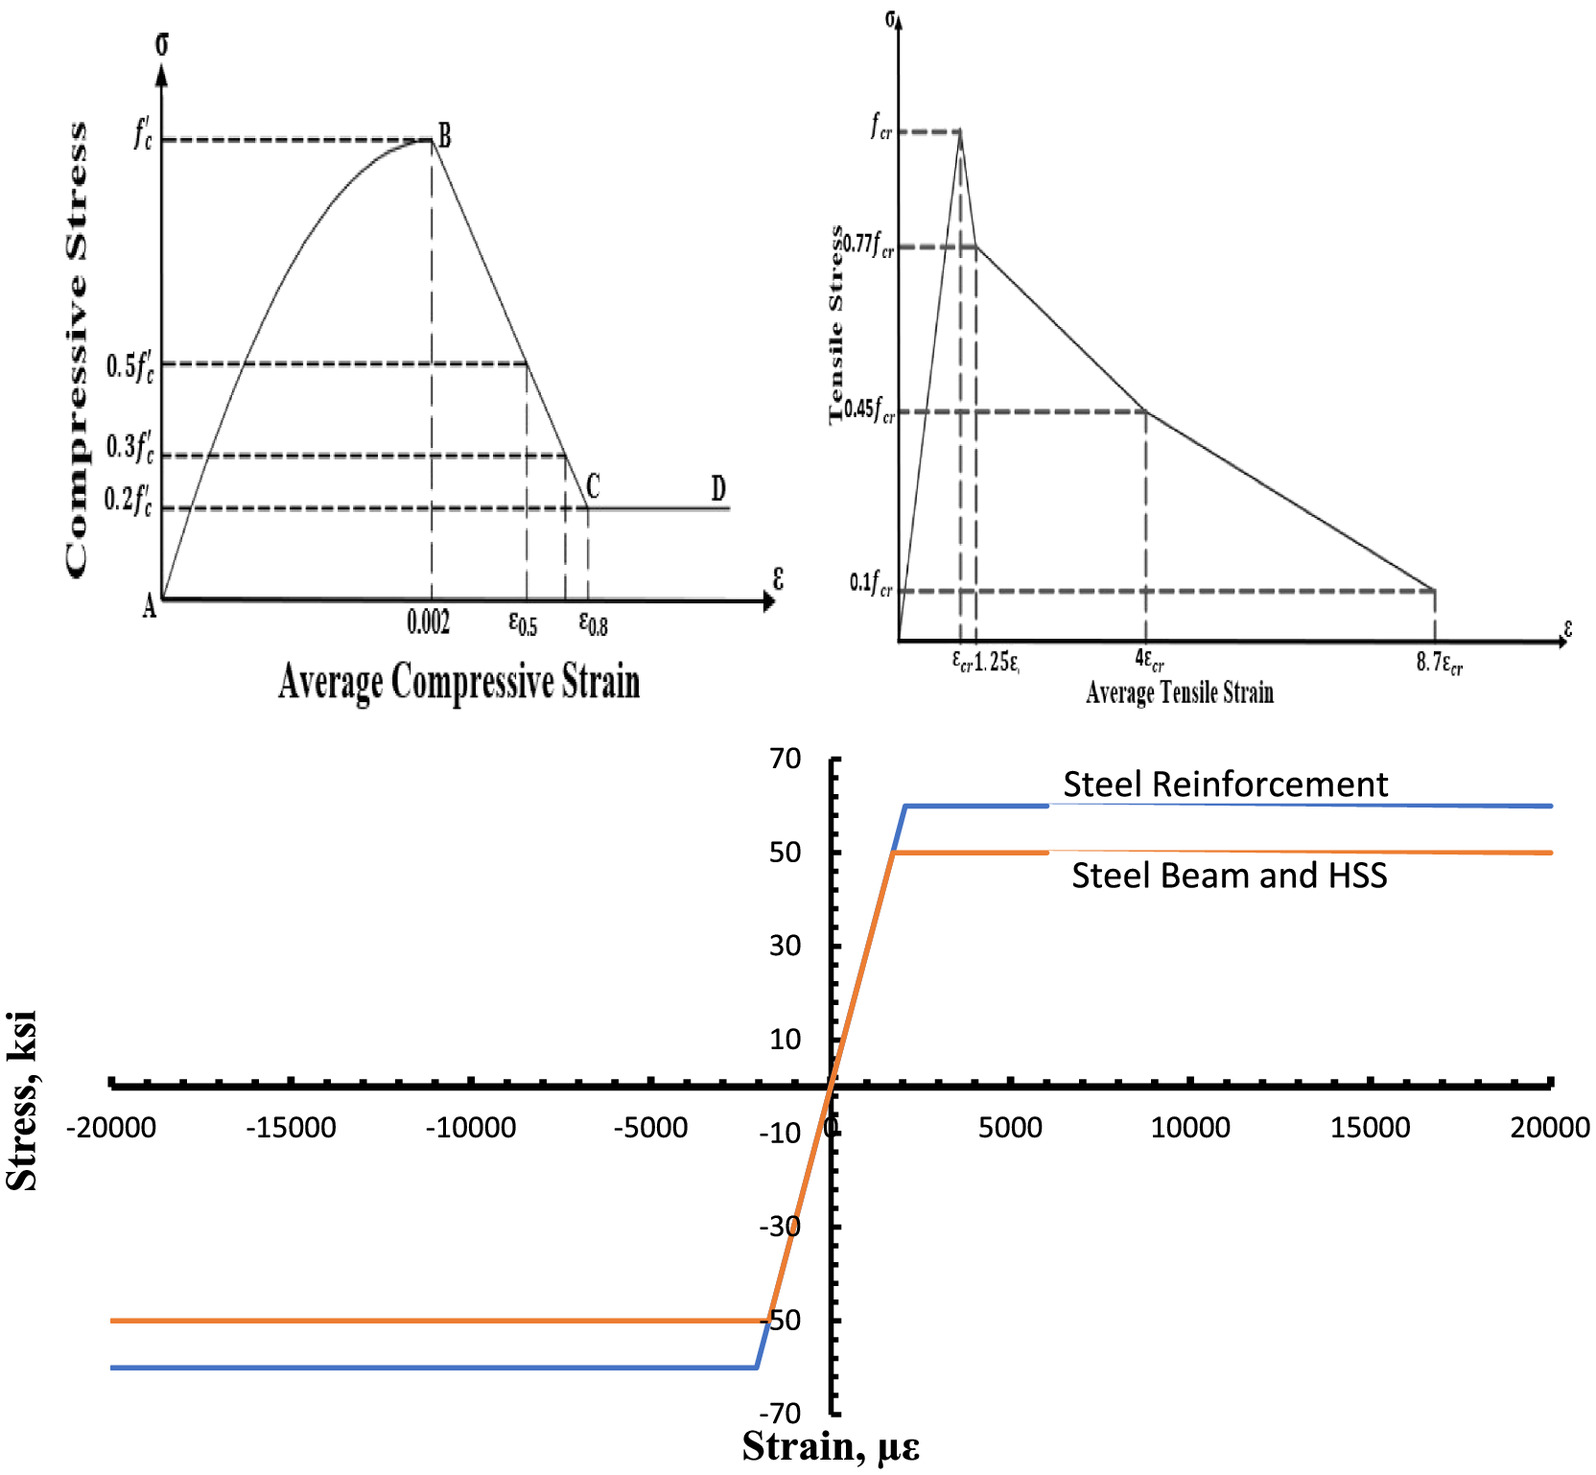
The concrete damage plasticity model has been used to define the plastic behavior of concrete in the noise barrier wall system’s model (Hafezolghorani et al. 2017). The compression stress–strain diagram for concrete has been calculated according to Kent and Park (1971). The Wahalathantri et al. (2011) constitutive model was used to model the concrete tensile behavior. The failure criteria used in the concrete stress–strain models are tensile cracking and compression crushing (Fig. 7). Tables 1–3 provide a summary of the concrete properties defined within the model.
| Material | Plasticity | ||
|---|---|---|---|
| Parameter | Value | Parameter | Value |
| 8,200 psi (56.5 MPa) | Dilation angle | 35 | |
| 5,145 ksi (35.5 GPa) | Eccentricity | 0.1 | |
| Poisson’s ratio | 0.2 | 1.16 | |
| — | 0.67 | ||
| — | Viscosity parameter | 0 | |
Note: .
| Concrete compressive behavior | Concrete compressive damage | ||
|---|---|---|---|
| Yield stress [psi (MPa)] | Inelastic strain | Damage parameter, | Inelastic strain |
| 2,460 (16.96) | 0 | 0 | 0 |
| 8,058 (55.6) | 0 | ||
| 8,109 (55.9) | 0.000128939 | 0 | 0.000128939 |
| 8,177 (56.3) | 0.000215737 | 0 | 0.000215737 |
| 8,200 (56.5) | 0.000311336 | 0 | 0.000311336 |
| 1,640 (11.3) | 0.002682267 | 0.8 | 0.002682267 |
Note: .
| Concrete tensile behavior | Concrete tensile damage | ||
|---|---|---|---|
| Yield stress [psi (MPa)] | Inelastic strain | Damage parameter, | Inelastic strain |
| 679 (4.68) | 0 | 0 | 0 |
| 522 (3.6) | 0.23 | ||
| 305 (2.11) | 0.000467105 | 0.55 | 0.000467105 |
| 67 (0.468) | 0.001131579 | 0.9 | 0.001131579 |
Note: .
A stress–strain relationship following the elastic perfectly plastic model, without strain hardening, was defined to characterize the behavior of the steel reinforcement and steel section in the model. The steel material had a Poisson’s ratio of 0.3 and an elastic modulus of 29,000 ksi (200 GPa). Specifically, the steel reinforcement was characterized by a yield stress of approximately 60 ksi (413 MPa), and the steel sections, including the HSS tubing, had a yield stress of 50 ksi (350 MPa). These material properties serve as essential inputs to accurately simulate the response of the steel components within the structural analysis.
Meshing, Constraints, and Loading
The C3D8R solid eight-noded hexahedral (brick) element, featuring hourglass control and reduced integration, was employed to model steel reinforcement, steel sections, and concrete (Krysl and Belytschko 1995; Nascimbene 2022). The mesh size selection was based on a previous convergence study (Elrefae and Issa 2023) conducted to ascertain any mesh size dependency in the numerical outcomes. The wall system components were modeled using mesh sizes of 2 in. (50.8 mm), 1 in. (25.4 mm), and 0.5 in. (12.7 mm). Results showed that mesh sizes of 1 in. (25.4 mm) and 0.5 in. (12.7 mm) provided accurate results in comparison with the experimental tests and were precise relative to each other. Consequently, a consistent mesh size of 1 in. (25.4 mm) was adopted across the entirety of the wall system.
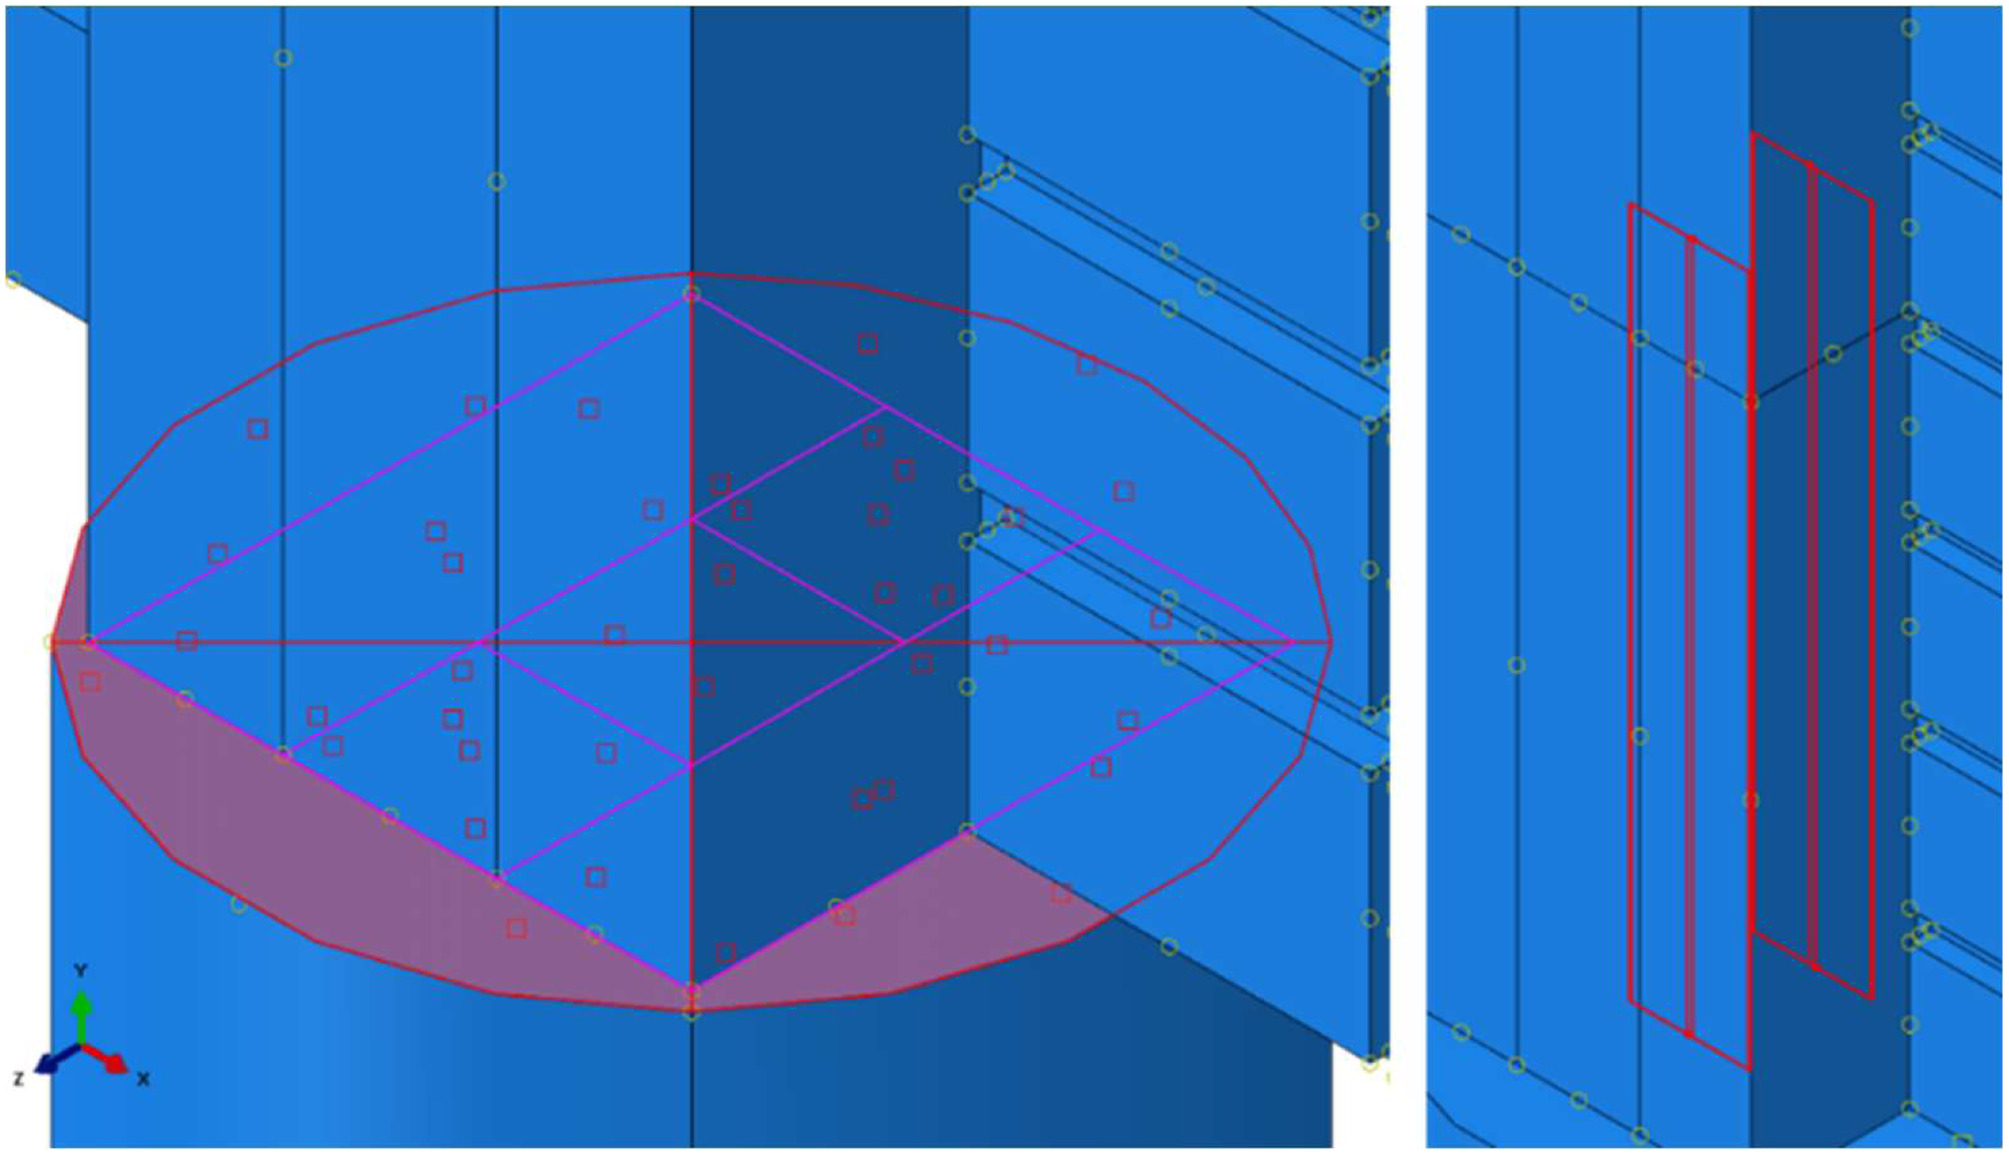
The developed model consisted of approximately 320,000 elements and 410,000 nodes. The computational process for each model took, on average, 17 h to obtain the solution. Fig. 8 shows the top view of meshing the noise wall barrier system’s prototype. A perfect bond between the concrete and steel reinforcement was assumed because no signs of reinforcement slippage were observed during the experimental testing. An embedded region was employed to simulate this perfect bond between concrete and steel reinforcement. A tie constraint that ties two separate surfaces together was used to define the relation between the outer face of the HSS tube and the inner surface of the integral column opening, as shown in Fig. 9.
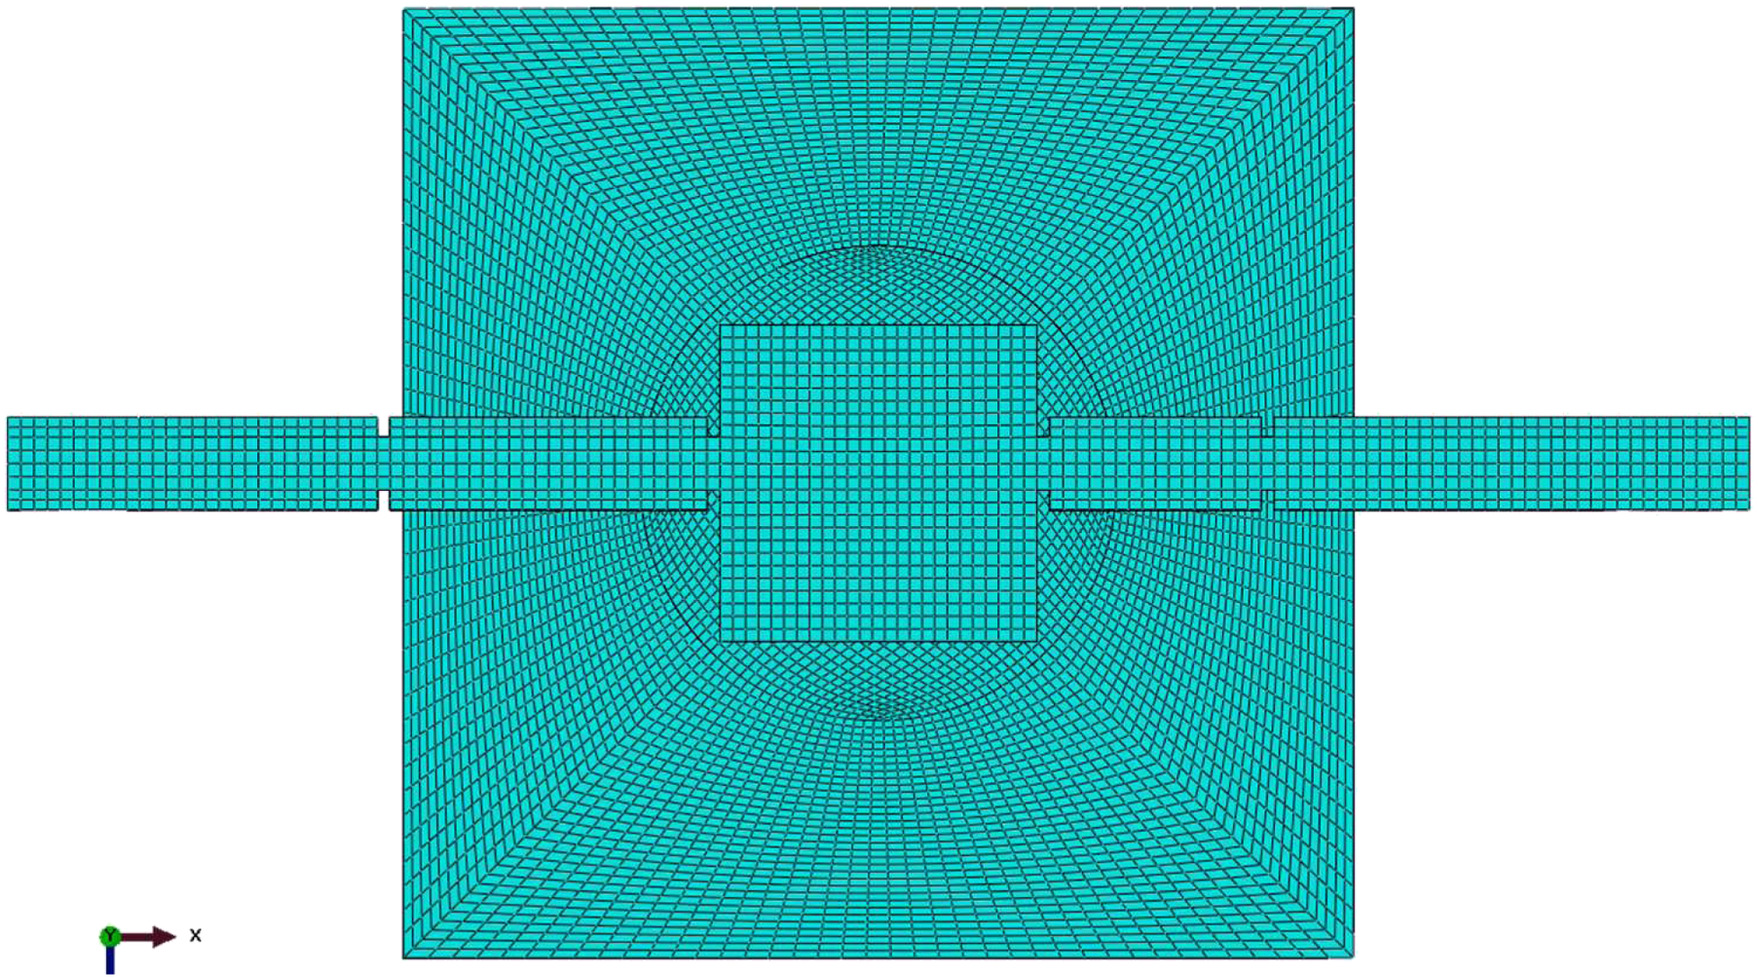
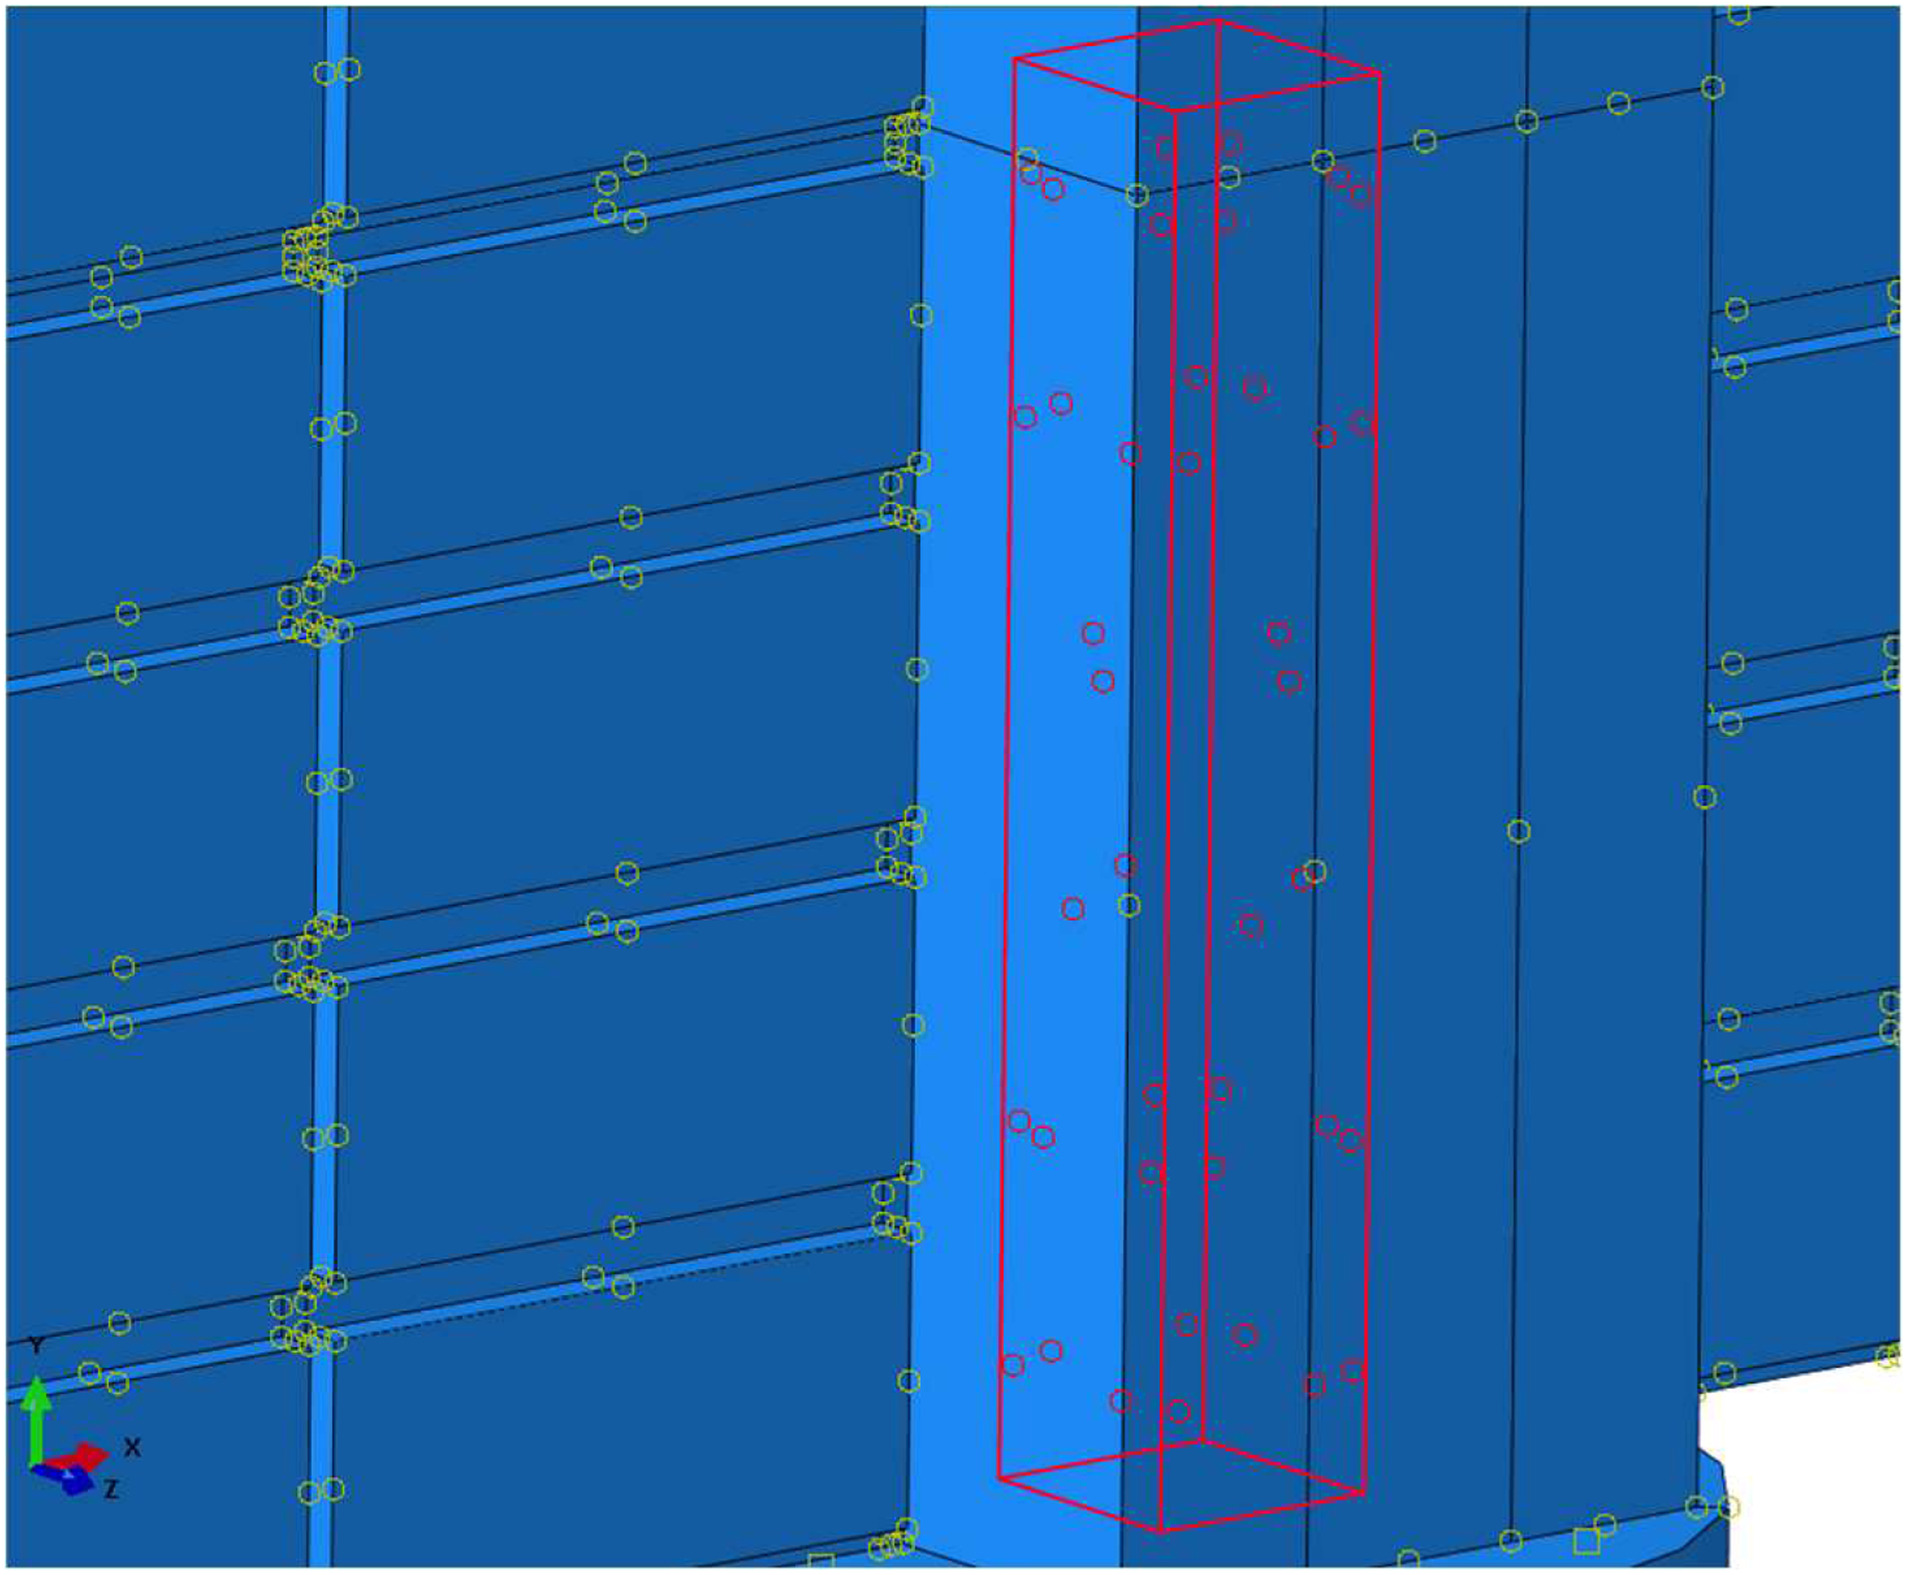
Fig. 10 shows the interacting surfaces that necessitated interaction definition. A general contact approach was employed to simulate the interaction between the steel section and the HSS tube embedded in the integral column. ABAQUS contact controls were utilized to define the procedures for addressing the initial gap before the surfaces of the steel section flange and HSS tube made contact (Boulbes 2020). In ABAQUS, contact initialization controls refer to the parameters that govern how contact interactions between surfaces or parts are initialized at the beginning of the analysis. An initial overclosure was specified with a distance of This parameter proved to be critical because it defines a distance threshold that determines when contact is considered to be initiated at the start of the analysis. This technique was used to define the gap between the embedded HSS tube and steel section.
In addition, surface-to-surface contact was used to define the interaction between the steel section and the HSS. Normal behavior was defined as hard contact, and tangential behavior was defined as penalty contact with a penalty coefficient of 0.05 (Amaireh and Haikal 2018). In the interaction between the integral column’s bottom surface and the pier’s top surface, surface-to-surface interaction was employed. The normal behavior for the contact is defined as hard contact, and the tangential behavior is defined as penalty contact with a penalty parameter coefficient of 0.25.
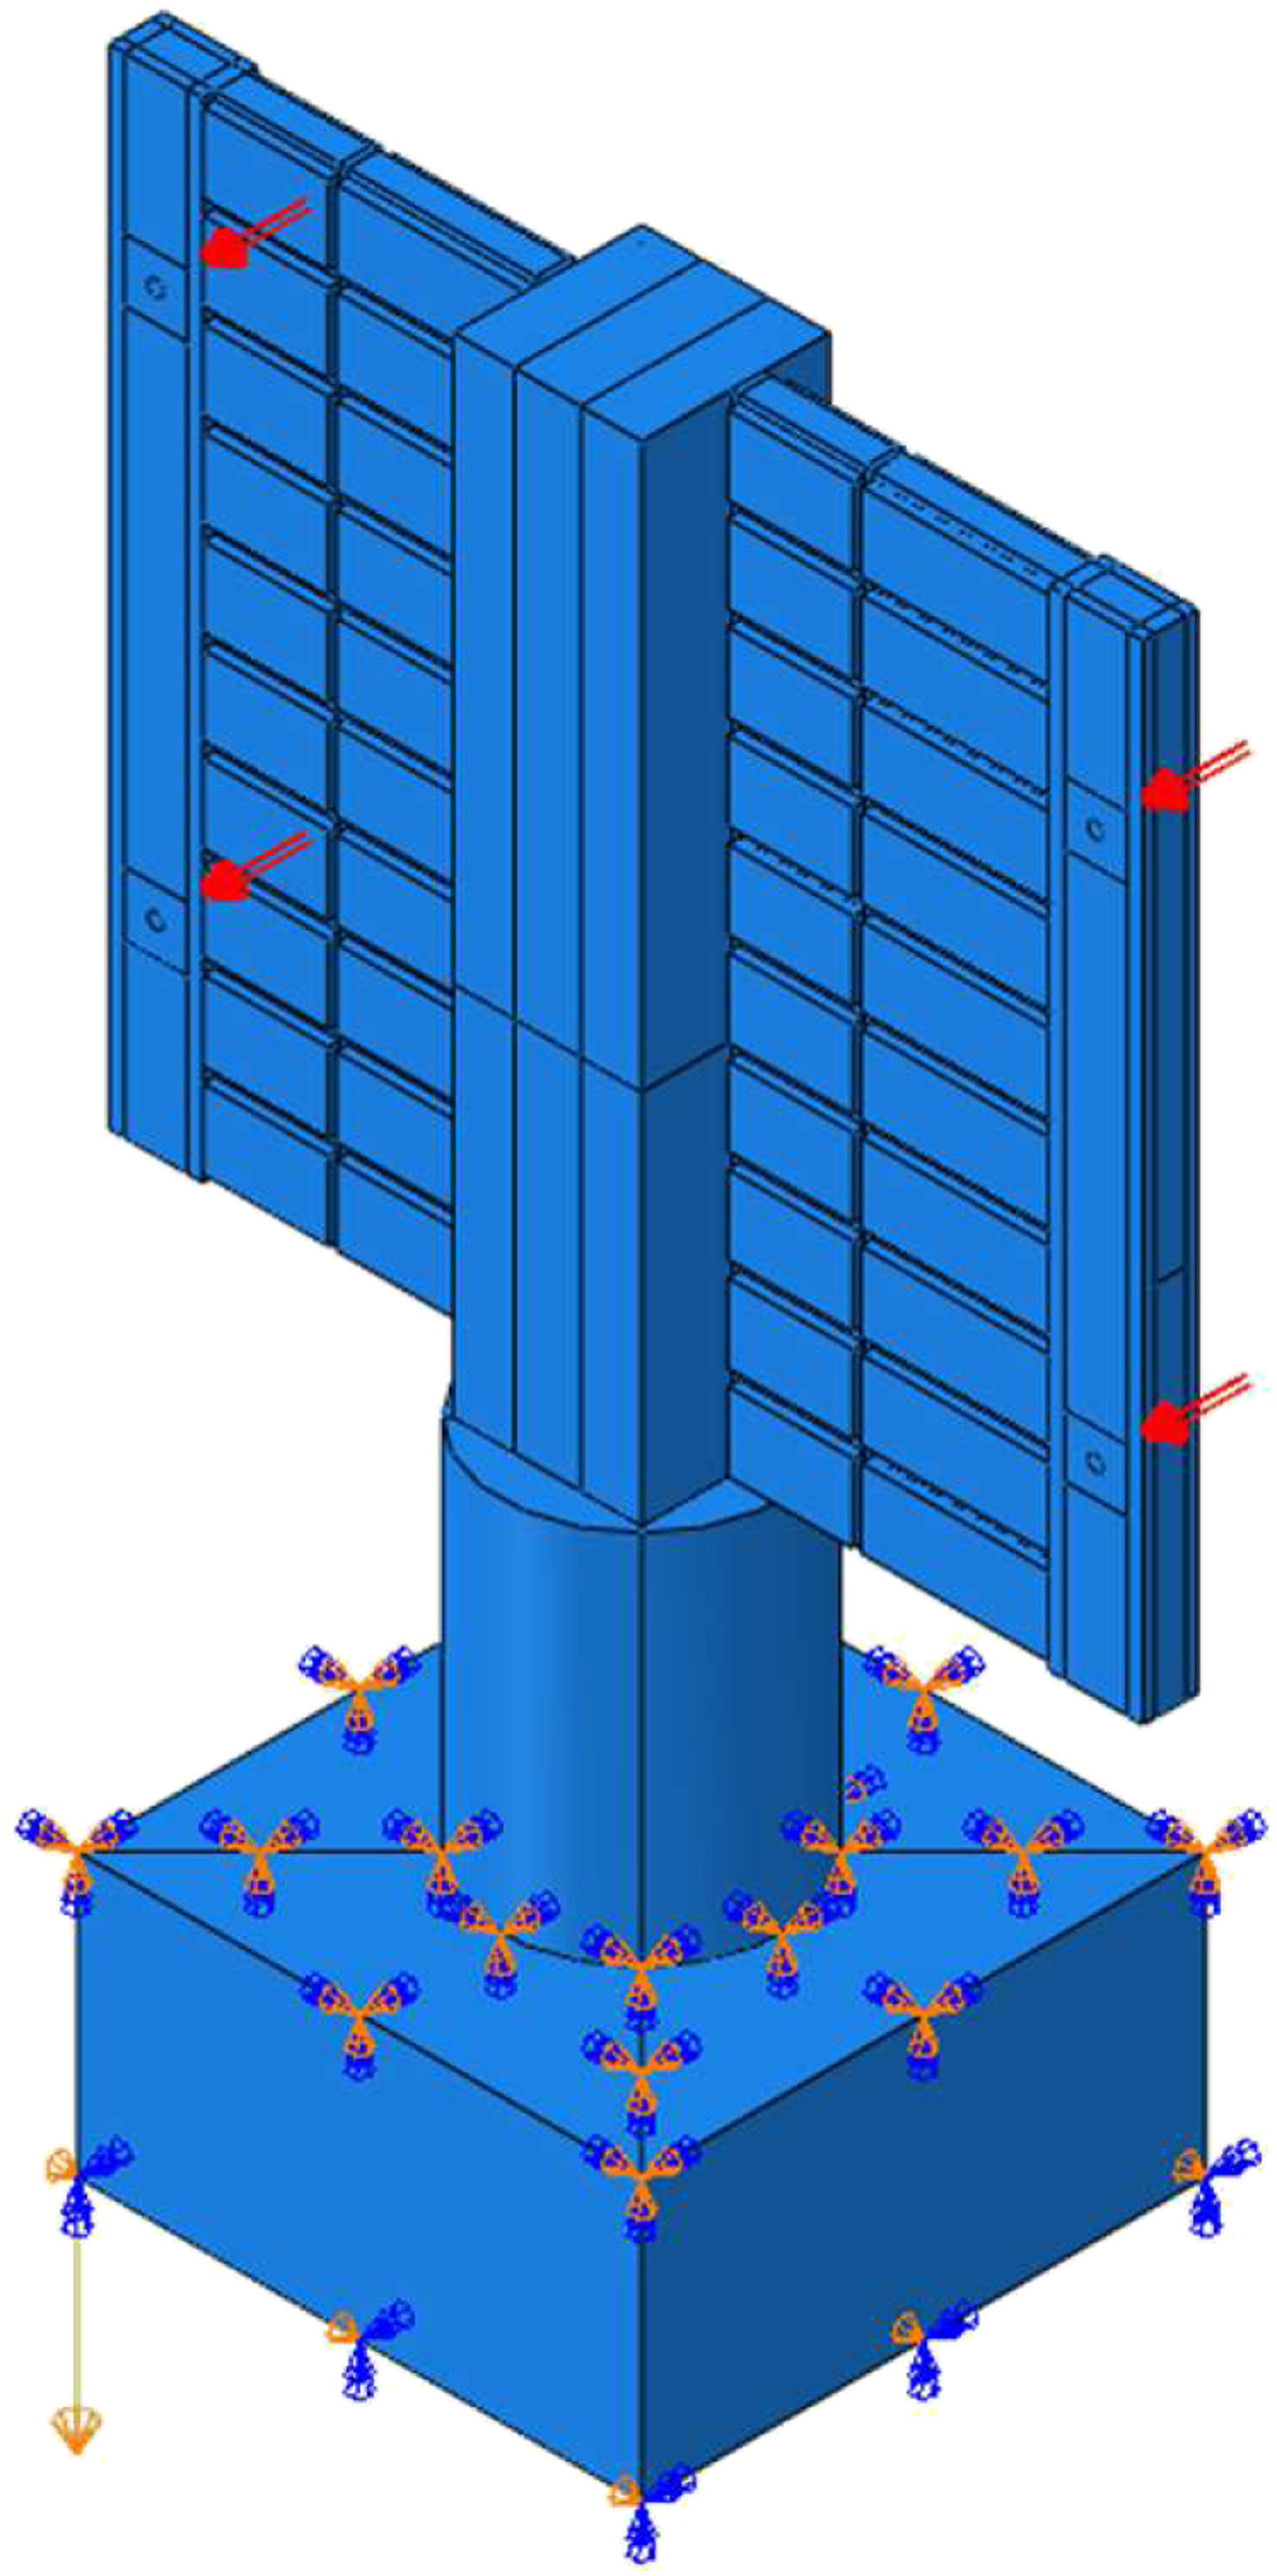
The authors conducted experimental testing using four 25-t-capacity single-acting hydraulic cylinder jacks (Elrefae and Issa 2023). This setup was followed to accurately simulate the load application process in the developed NLFEA model. The load application was divided into two distinct steps for accuracy. Step 1 encompassed the introduction of gravity loading with an initial time increment of 0.25 and a maximum increment size of 1. Step 2 involved applying the external load to simulate the testing conditions during the experiment accurately. The initial increment size that was specified for Step 2 was equal to 0.005 with a maximum increment size of 0.01. In order to obtain a solution in ABAQUS, both load Steps 1 and 2, as static general steps, were executed utilizing the direct solver in conjunction with the full Newton solution technique (Newton-Raphson approach). The analysis was defined as load-controlled, a pressure with a total force of 16 kips (72 kN) and 20 kips (89 kN) per wing were specified for Prototypes 1 and 2, respectively. Fig. 11 shows the assembly, loading, and restraints in the developed NLFEA model. The NLFEA models of the noise barrier wall system Prototypes 1 and 2 were loaded up to 32 kips (142 kN) and 40 kips (178 kN), and 16 kips (71 kN) and 20 kips (89 kN) per wing, respectively.
Calibration and Verification
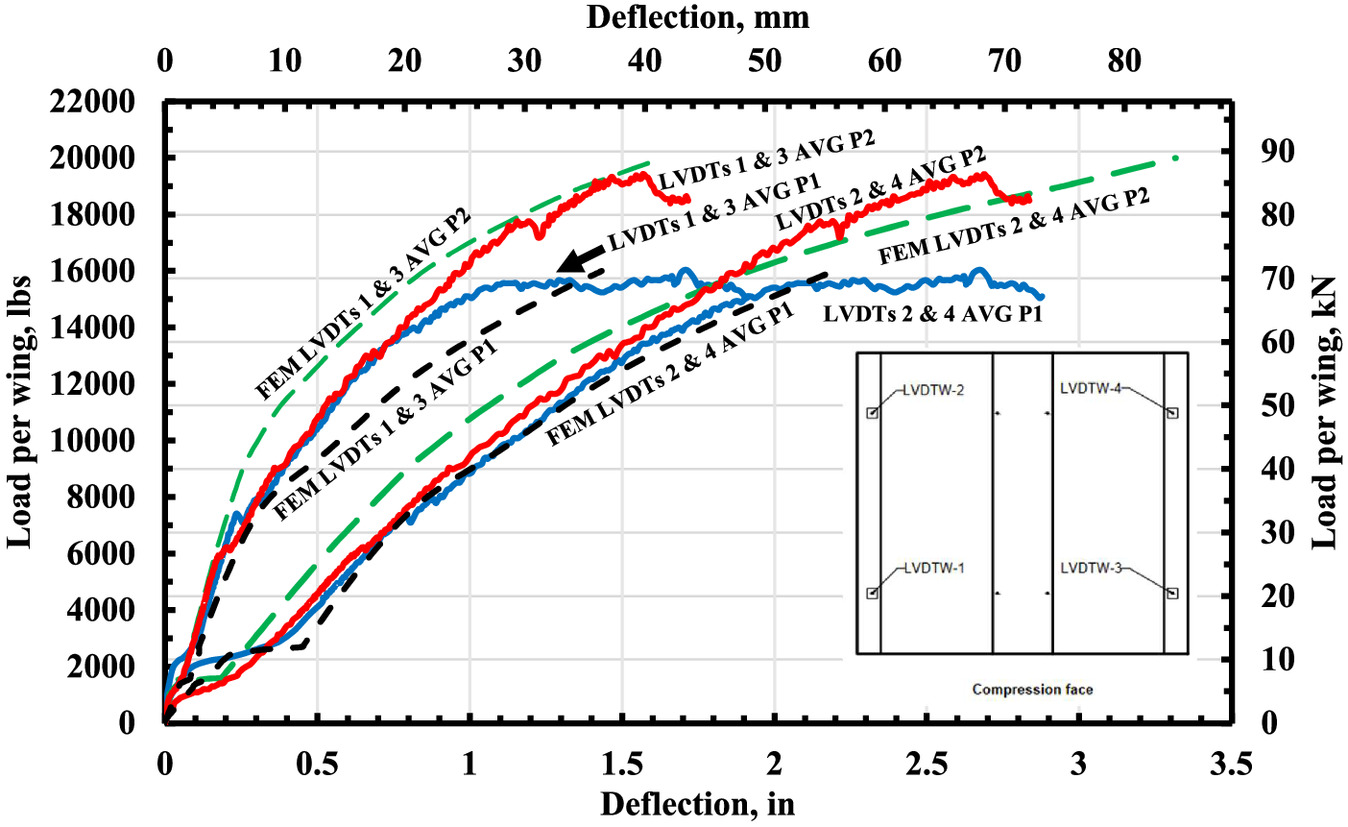
The NLFEA results were generated for both Prototype 1 and Prototype 2 using ABAQUS software. These NLFEA results, specifically the load–deflection and load–strain curves, were compared with the experimental data collected for both prototypes. Figs. 12 and 13 show the load–deflection curves for the wall system wings in Prototypes 1 and 2 for the NLFEA and experimental test results. A careful examination of these curves revealed a high level of agreement between the experimental results and the NLFEA simulations. Notably, the NLFEA accurately captured the sliding behavior of the wall system, which was intentionally designed with a gap.
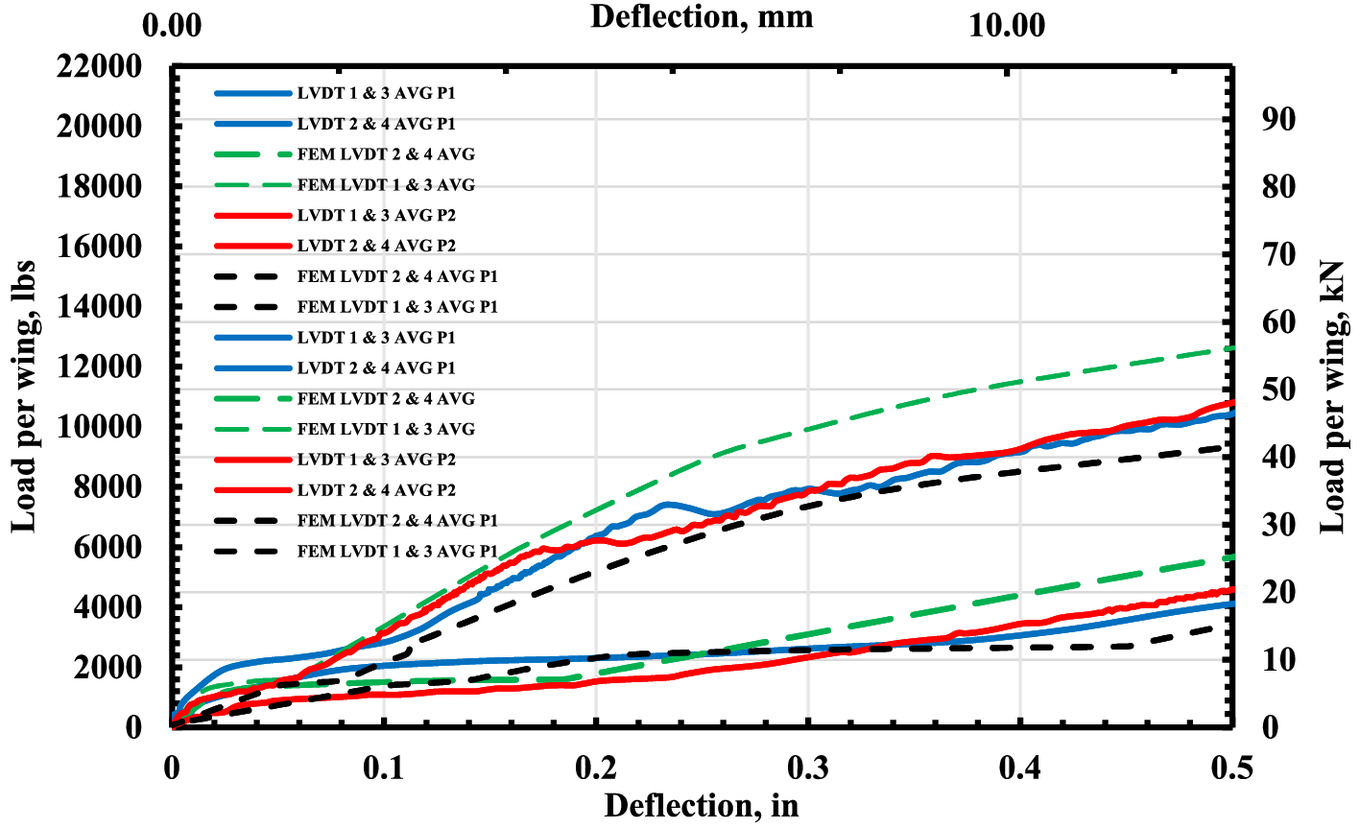
Figs. 14 and 15 show the load–deflection curves for the NLFEA and experimental test results of the wall system’s integral column. After Inspection of the curves, it is evident that, following an initial phase of sliding, a nearly linear load–deflection relationship persists, extending up to the maximum applied load, all without any noticeable signs of cracking or stiffness reduction.
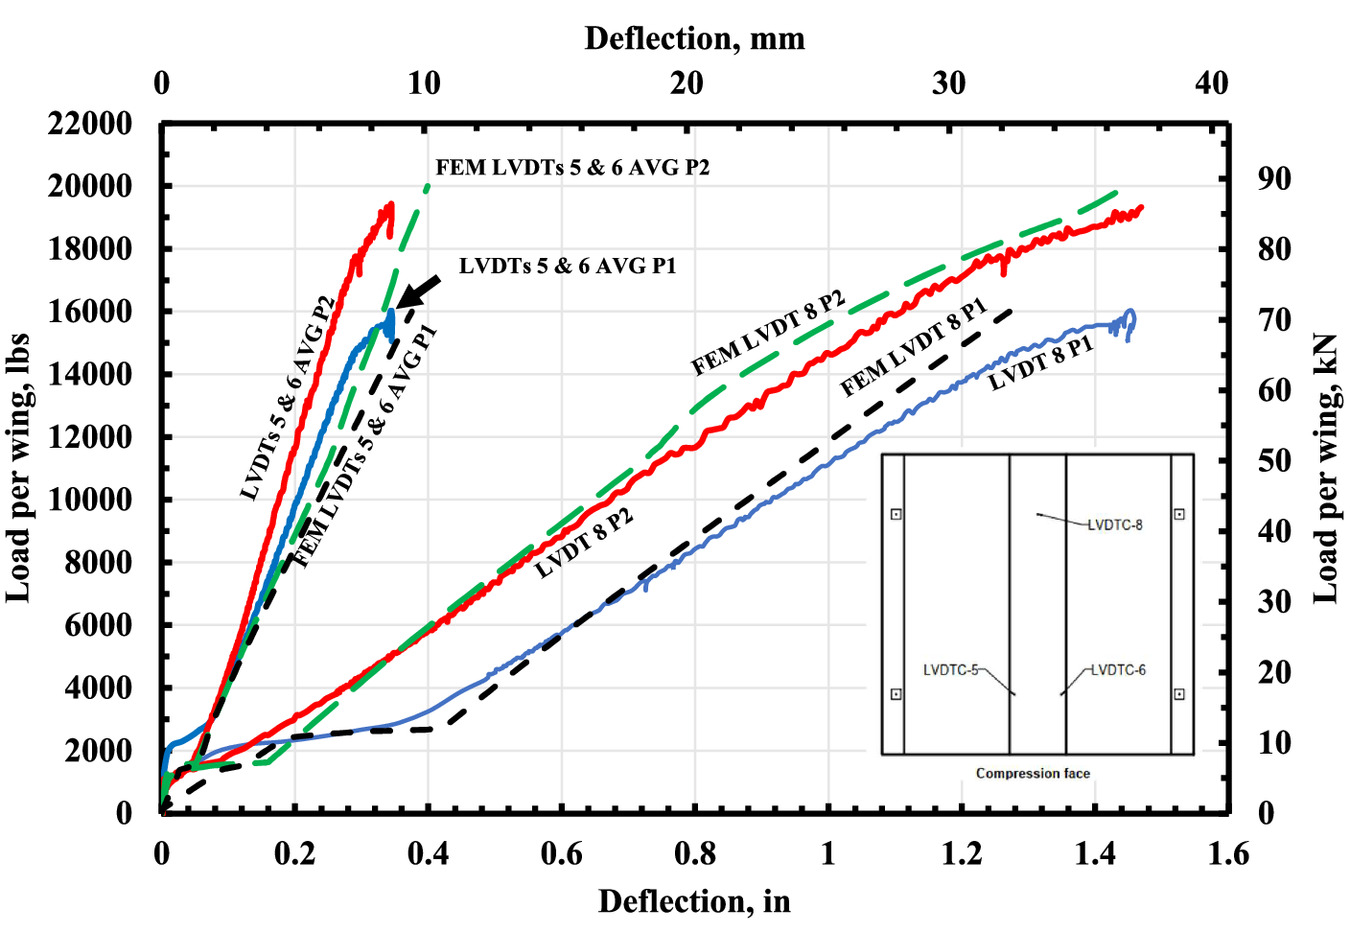
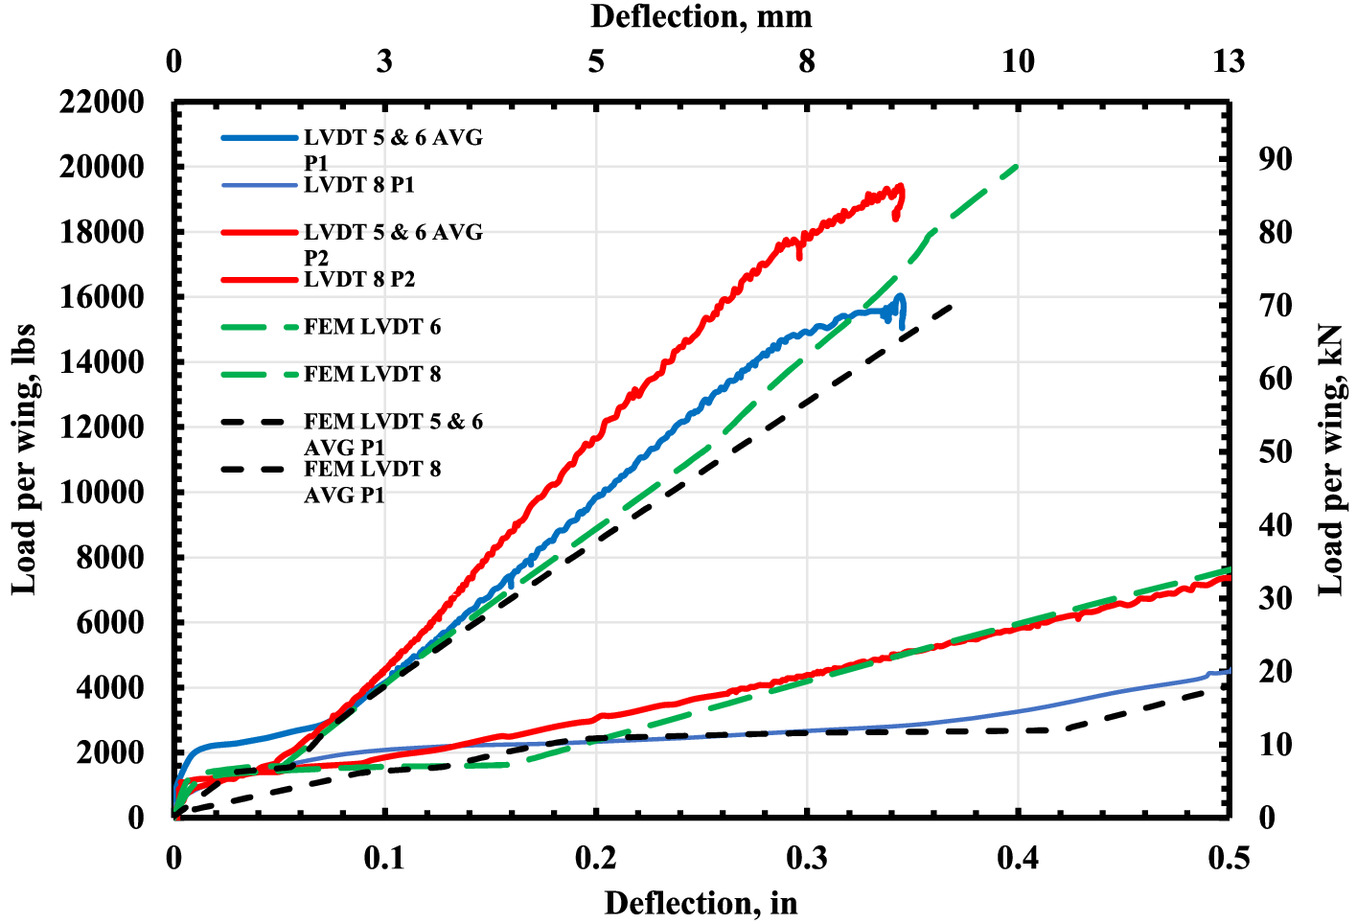
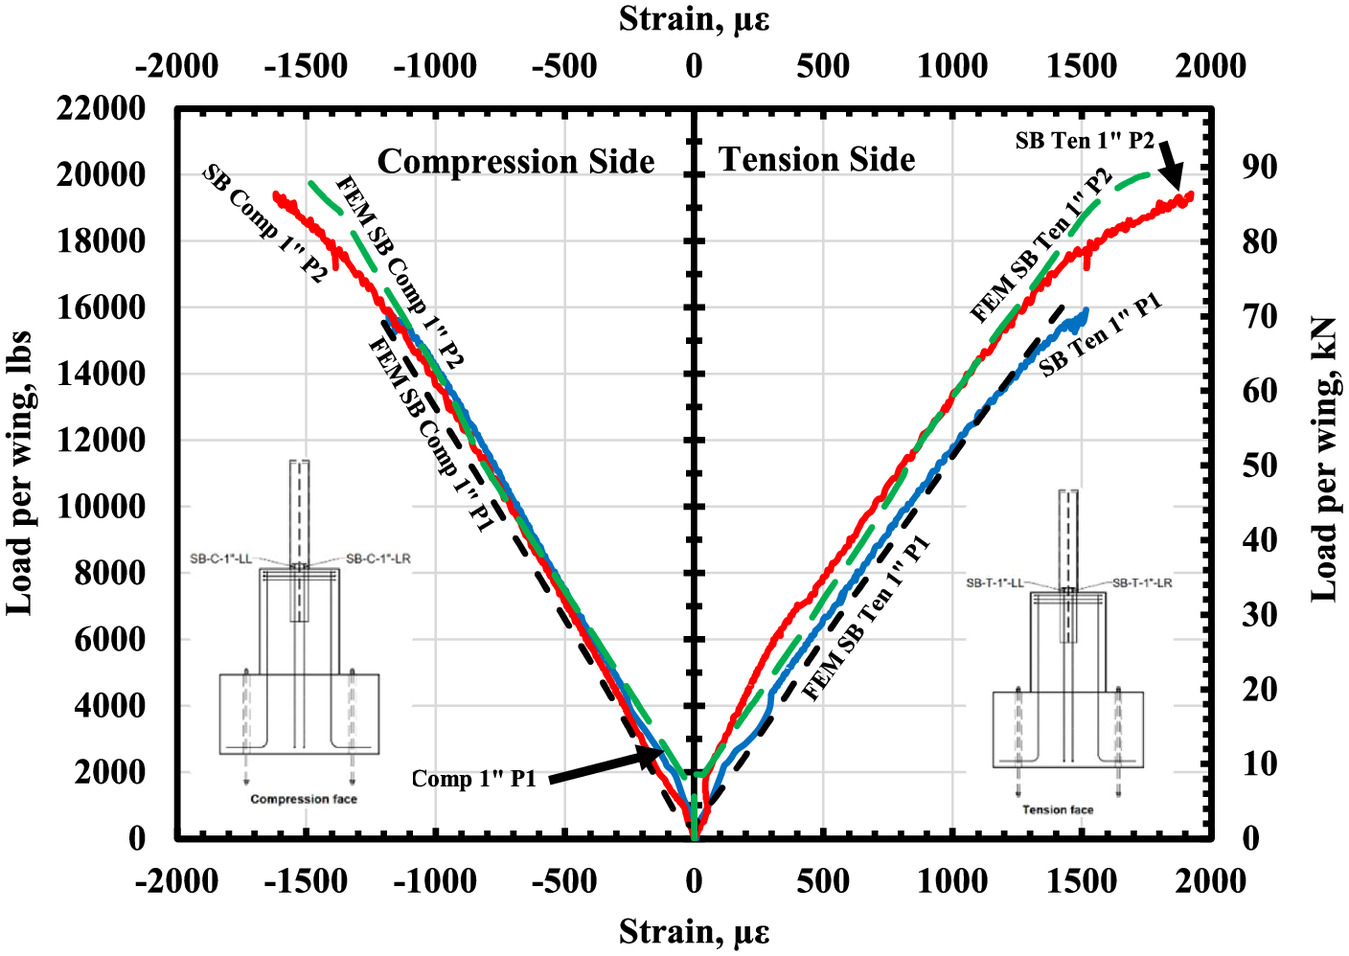
Table 4 summarizes the wall deflection results obtained from the experimental and NLFEA results under the Service I load level. The NLFEA results for the developed tensile and compressive strains in the steel section correlated well with the experimental test result (Fig. 16). The NLFEA showed that at Service I load, the tensile strains were approximately 359 and for Prototypes 1 and 2, respectively. At the same time, the experimental results at the same load level were 333 and . In addition, the NLFEA results showed that the steel section for Prototype 2 initially yielded at a load of approximately 18.9 kips (84 kN). The steel section yielded during the experimental testing at a load of roughly 18.5 kips (82.3 kN). Fig. 17 depicts the location of the developed cracking along the wing–integral column connection, mirroring the observed crack propagation observed during the experimental program.
| Location | Service I experimental [mm (in.)] | Service I NLFEA [mm (in.)] | Difference (%) |
|---|---|---|---|
| LVDTs 1 and 3, P1 | 1.04 (0.041) | 1.12 (0.044) | 7.31 |
| LVDTs 1 and 3, P2 | 0.559 (0.022) | 0.51 (0.02) | 9.09 |
| LVDTs 2 and 4, P1 | 2.13 (0.084) | 2.26 (0.089) | 5.95 |
| LVDTs 2 and 4, P2 | 2.72 (0.107) | 2.99 (0.118) | 10.28 |
| LVDTs 5 and 6, P1 | 2.62 (0.103) | 2.69 (0.106) | 2.912 |
| LVDTs 5 and 6, P2 | 2.44 (0.0961) | 2.64 (0.104) | 8.22 |
| LVDT 8, P1 | 12.4 (0.488) | 13.2 (0.518) | 6.14 |
| LVDT 8, P2 | 7.49 (0.295) | 7.29 (0.287) | 2.71 |
Note: ; and Service ().
Parametric Study
According to Kesten et al. (2020), key factors to be considered in the design of noise barriers include noise reduction effectiveness, visual appeal, affordability, ease of construction, and structural capacity. The parametric study undertaken had the primary objective of delving deeper into the impact of various key parameters on the structural behavior of this innovative noise barrier wall system. Through this systematic exploration, the authors sought to unveil valuable insights that enrich the understanding of the wall system and contribute to its optimization and performance enhancement. The study examined the influence of several pivotal parameters, including the integral column size, the intentional gap, the type of steel section, and the length of steel section embedment.
Table 5 summarizes the parameters investigated in each model. In each NLFEA model, only the specified parameter was altered. The NLFEA model developed for Prototype 2 served as the control model.
| Group | Specimen | Wall height [m (ft)] | [MPa (ksi)] | Steel section type | Column size [ ()] | Column embedment [m (ft)] | Gap [mm (in.)] |
|---|---|---|---|---|---|---|---|
| Prototype | P1 | 3.05 (10) | 56.5 (8.2) | () | 1.22 (4) | 3.175 (0.125) | |
| Column size | C1 | 3.05 (10) | 56.5 (8.2) | () | 1.22 (4) | 3.175 (0.125) | |
| C2 | 3.05 (10) | 56.5 (8.2) | () | 1.22 (4) | 3.175 (0.125) | ||
| C3 | 3.05 (10) | 56.5 (8.2) | () | 1.22 (4) | 3.175 (0.125) | ||
| Steel section | S-1 | 3.05 (10) | 56.5 (8.2) | HSS | () | 1.22 (4) | 3.175 (0.125) |
| S-2 | 3.05 (10) | 56.5 (8.2) | HSS | () | 1.22 (4) | 3.175 (0.125) | |
| Gap size | G-1 | 3.05 (10) | 56.5 (8.2) | () | 1.22 (4) | No gap | |
| Column embed | E-1 | 3.05 (10) | 56.5 (8.2) | () | 0.61 (2) | 3.175 (0.125) | |
| E-2 | 3.05 (10) | 56.5 (8.2) | () | 0.91 (3) | 3.175 (0.125) | ||
| E-3 | 3.05 (10) | 56.5 (8.2) | () | 1.52 (5) | 3.175 (0.125) | ||
| E-4 | 3.05 (10) | 56.5 (8.2) | () | 1.83 (6) | 3.175 (0.125) |
Note: 2 in the experimental testing program; ; ; and 1 in.= 25.4 mm.
Influence of the Integral Column Size
As part of the effort to achieve a more cost-effective design and lower the overall expense of the noise wall barrier system, reducing the column size while maintaining the structural integrity of the wall system stands out as a critical parameter. Consequently, the investigation of column size holds significant relevance within the scope of this study. The column size effect on the noise barrier wall system was examined in the Specimens C1, C2, and C3 group. Figs. 18 and 19 depict the load–deflection curves for the noise wall barrier wings and integral column.
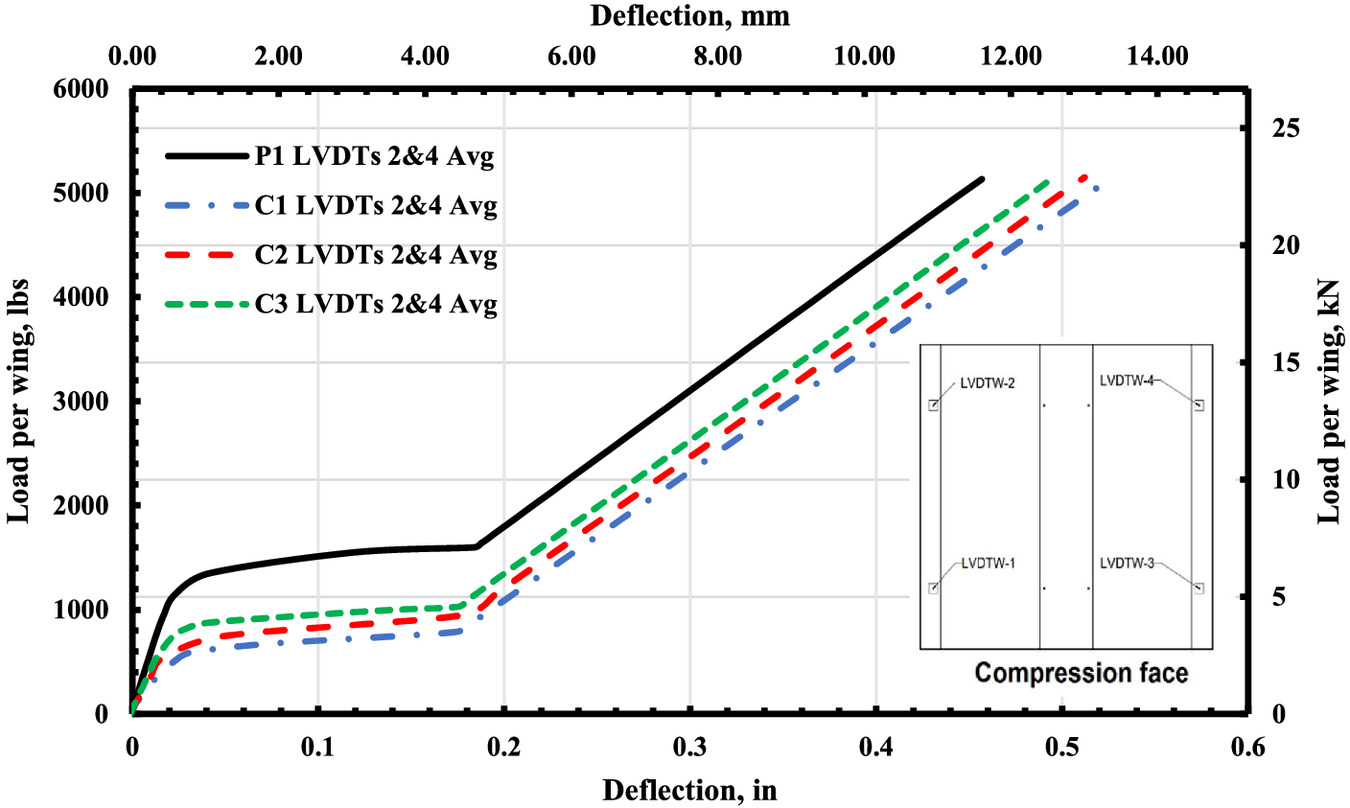
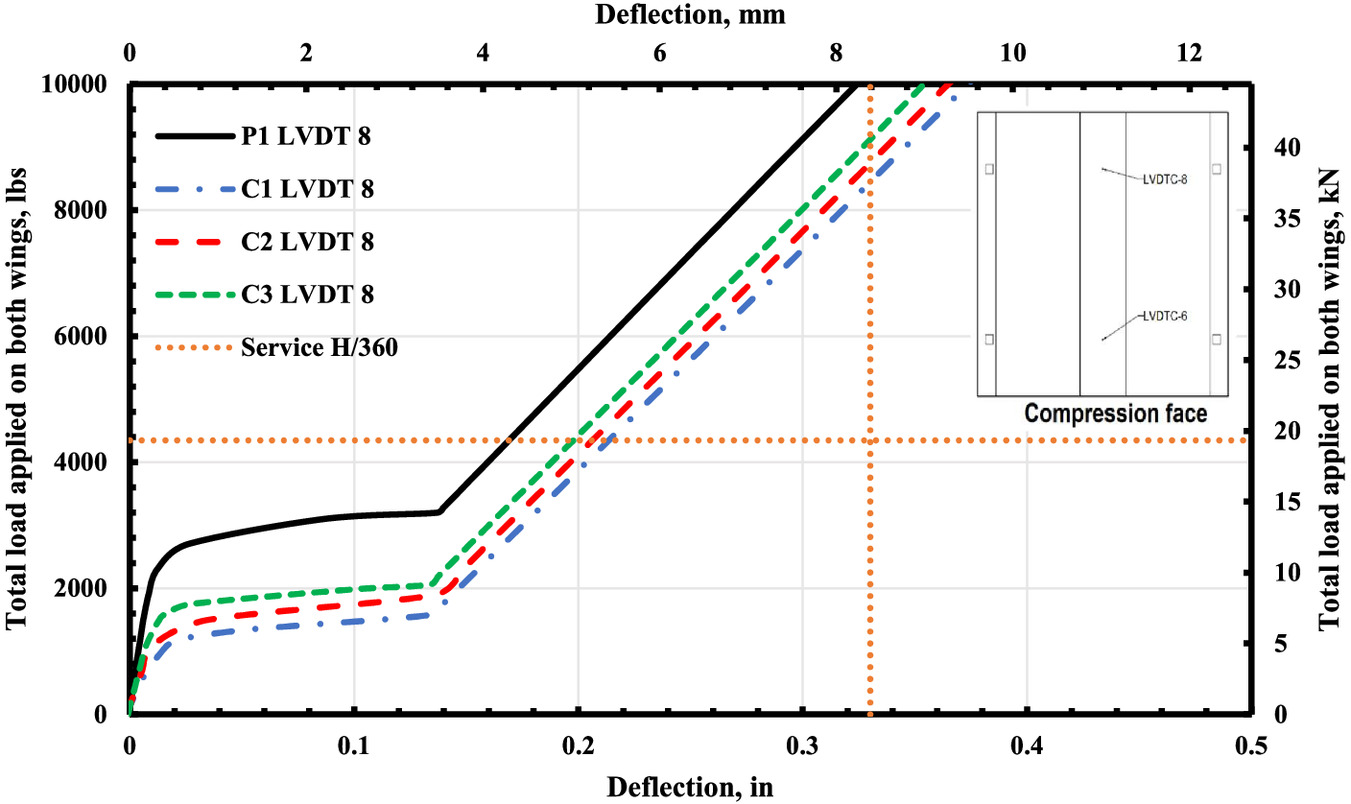
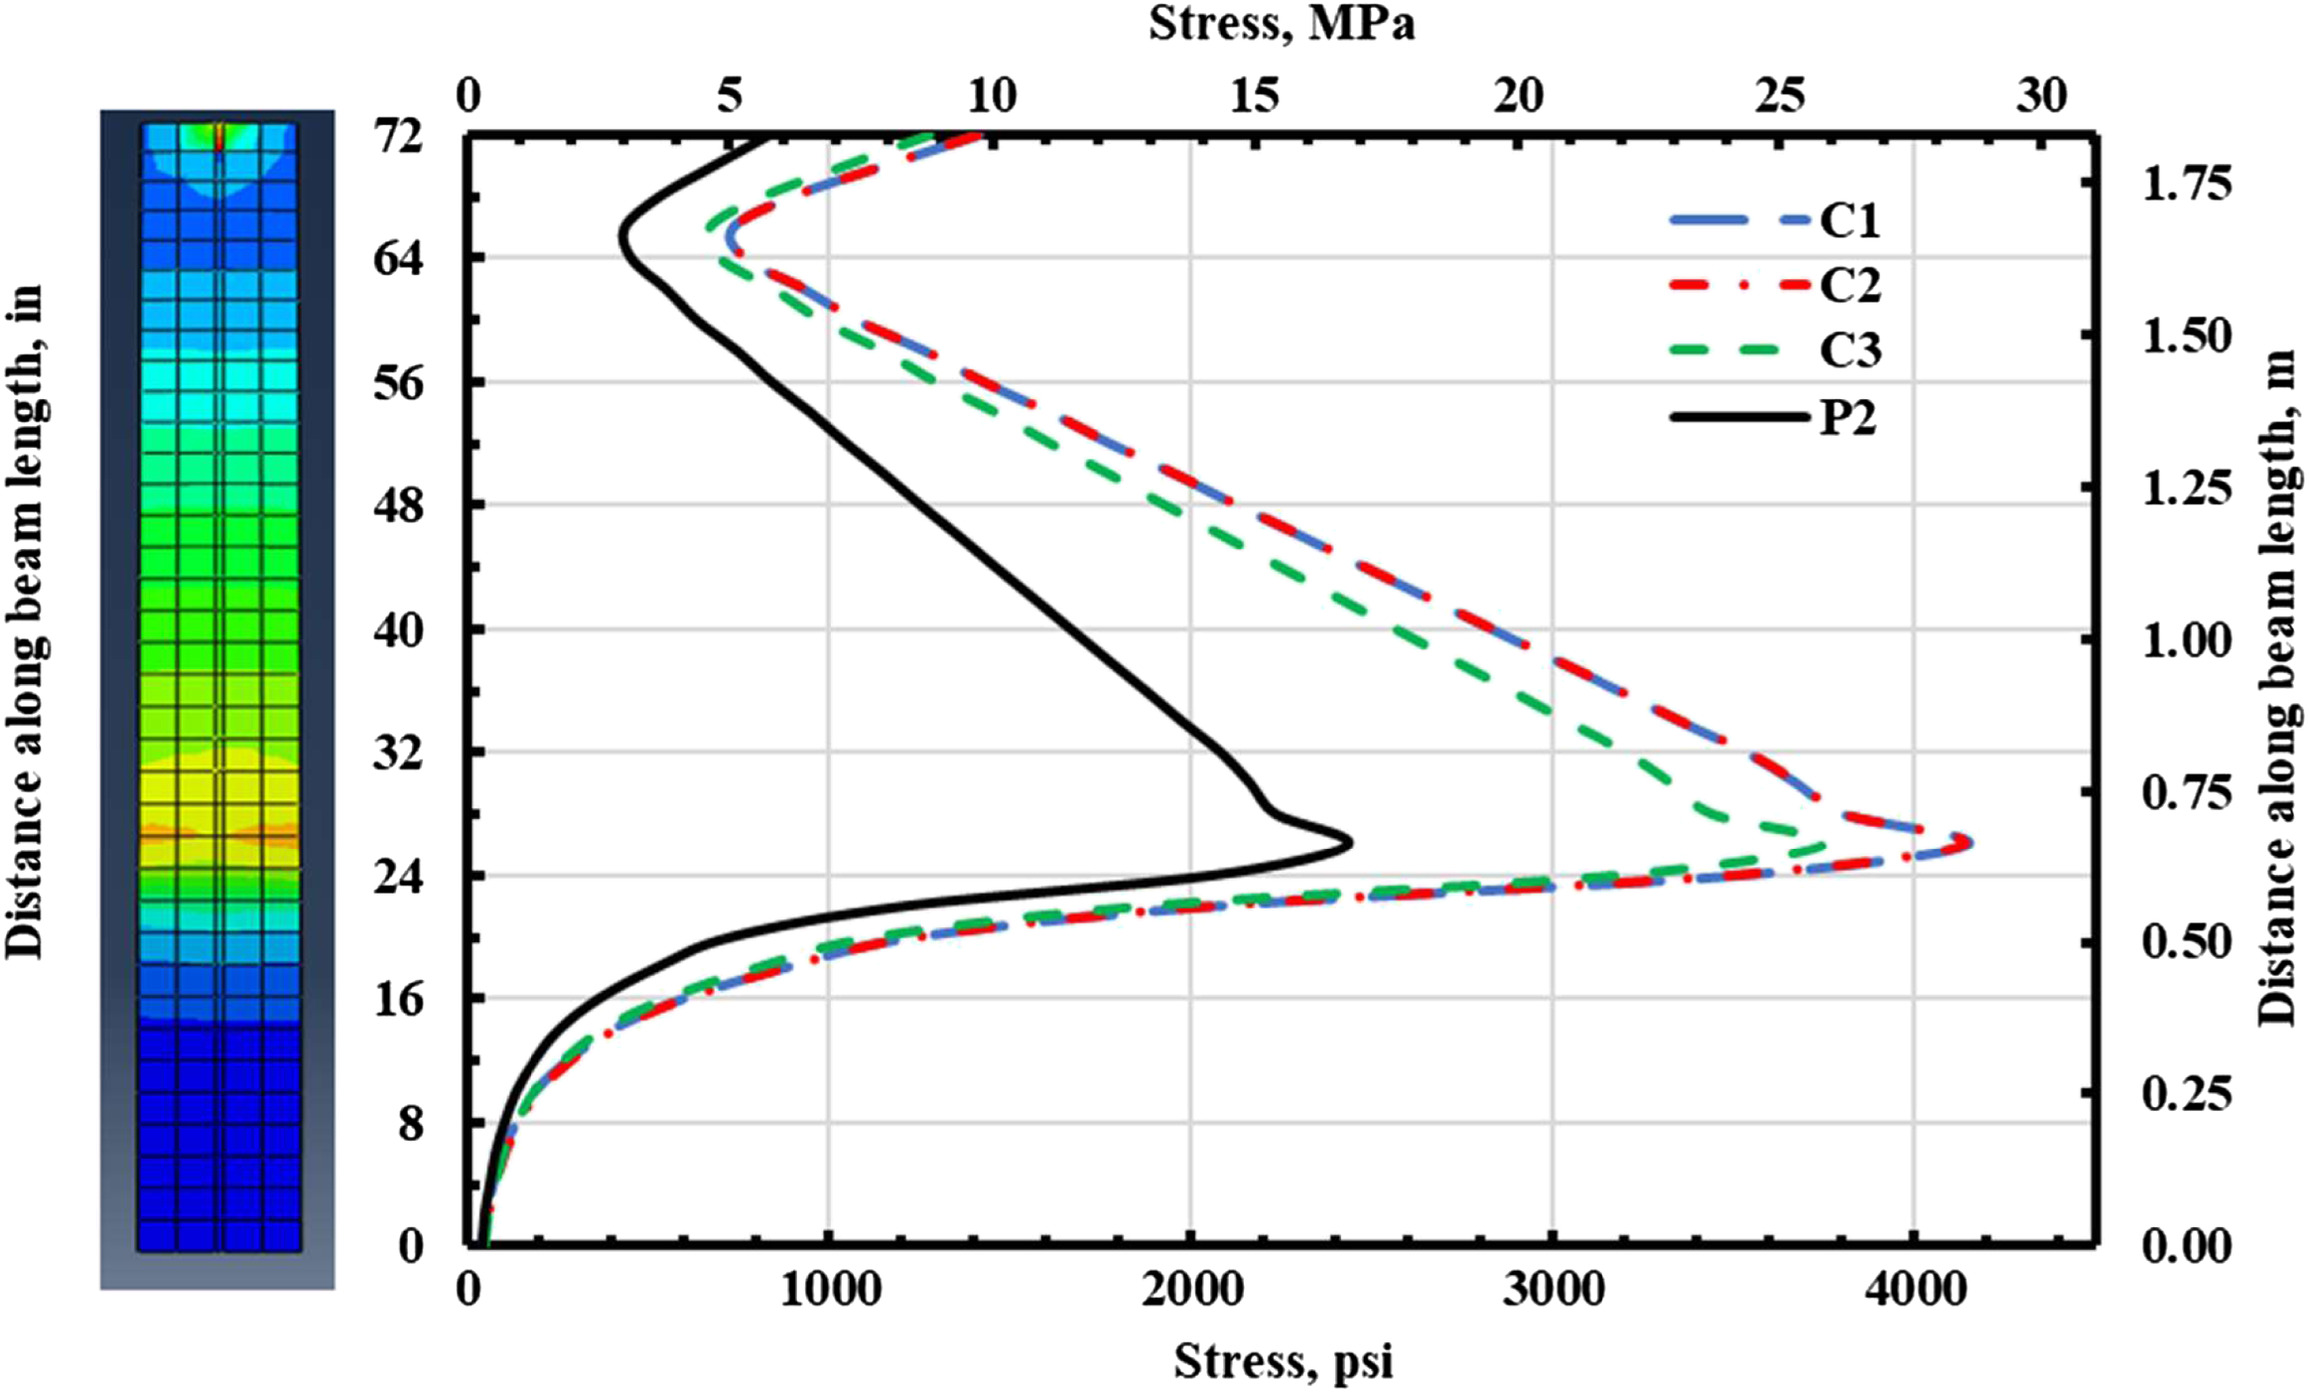
Inspection of Fig. 18 show that reducing the column size resulted in an increased deflection rate as the applied load increased. Importantly, each wing encountered a load of approximately 1,350 lb (6.01 kN) under a service limit state wind pressure of 15 psf (). Considering a panel length () of 162 in. (4,114.8 mm), the deflection limit is (17.2 mm), indicating that this limit has been met for all column sizes. The deflection limit for the integral column under a service load of approximately 4,350 lb (19.35 kN) and a height () of 120 in. (3,048 mm) is calculated as (8.5 mm). With sliding, the average deflections recorded for integral columns of Specimens C1, C2, and C3 under this service load were approximately 0.22 in. (5.59 mm), 0.21 in. (5.33 mm), and 0.19 in. (4.82 mm), respectively, indicating that Specimens C1, C2, and C3 have met the integral column’s deflection limit. Fig. 20 depicts the stress distribution along the length of the steel section at the Strength I limit state at a wind pressure 35 psf (), which is equivalent to a total applied load of 4,350 lb (19.4 kN). Examination of the curves shows that decreasing the integral column size led to higher stresses in the steel sections. However, it is important to emphasize that all steel sections maintained their elastic behavior without exhibiting plastic deformation under service and strength limit states.
Influence of the Steel Section Embedment Length in the Integral Column
As part of the comprehensive exploration of the noise wall barrier structural behavior, an investigation into the embedment length of the steel section into the integral column was conducted. Fig. 21 shows the load–deflection curves of the wall system wings. It can be observed that increasing the embedment length results in reduced sliding. Specimens E1 and E2 showed reduced wall system rigidity and stiffness, as expected due to the shorter embedment length. Notably, when subjected to a load of around 3,800 lb (16.9 kN), Specimen E1 displayed an increase in deflection with minimal or no corresponding increase in loading. Comparatively, Specimens E3 and E4 notably enhanced rigidity and stiffness. Initially, a consistent pattern of behavior was observed across all specimens, extending up to a load of 1,200 lb (5.34 kN), beyond which the sliding starts. After the sliding, a discernible trend emerged as deflection increased with the increased applied load incrementally and nearly linearly.
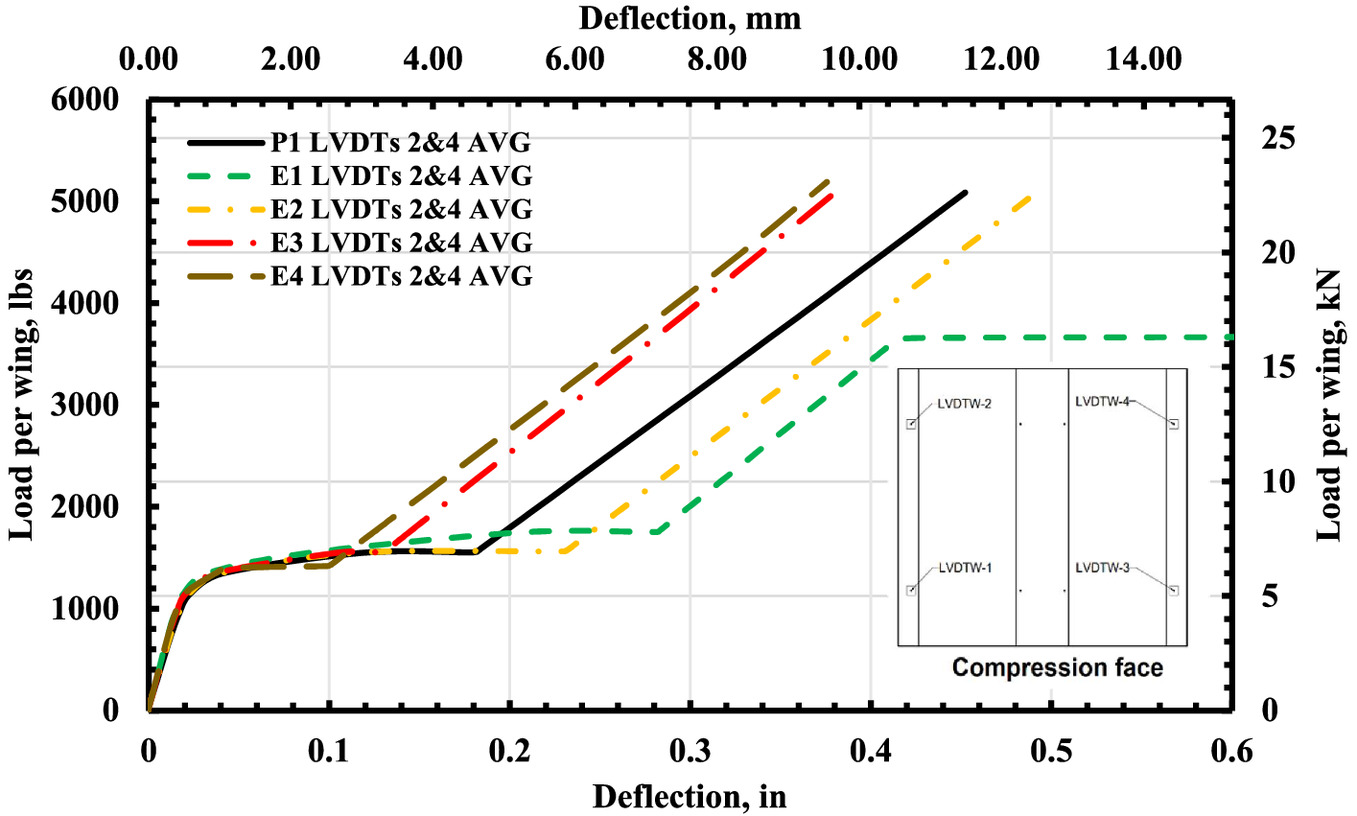
Fig. 22 shows the load–deflection curves of the wall system’s integral columns for specimens featuring different embedment lengths. The integral columns displayed a uniform behavior pattern, aligning with one another up to an approximate load of 3,800 lb (16.9 kN). At this load level, Specimen E1 exhibited an increase in deflection with minimal or no increase in the applied load, thus indicating that the embedment length of 2 ft (0.61 m) is not enough. Increasing the embedment length of the steel section in the integral column will lead to a noticeable reduction in deflection, enhancing the structural stability, stiffness, and performance of the noise barrier wall system. This is primarily because the increased embedment length provides additional support and rigidity, effectively reducing the deflection experienced by the system under load.
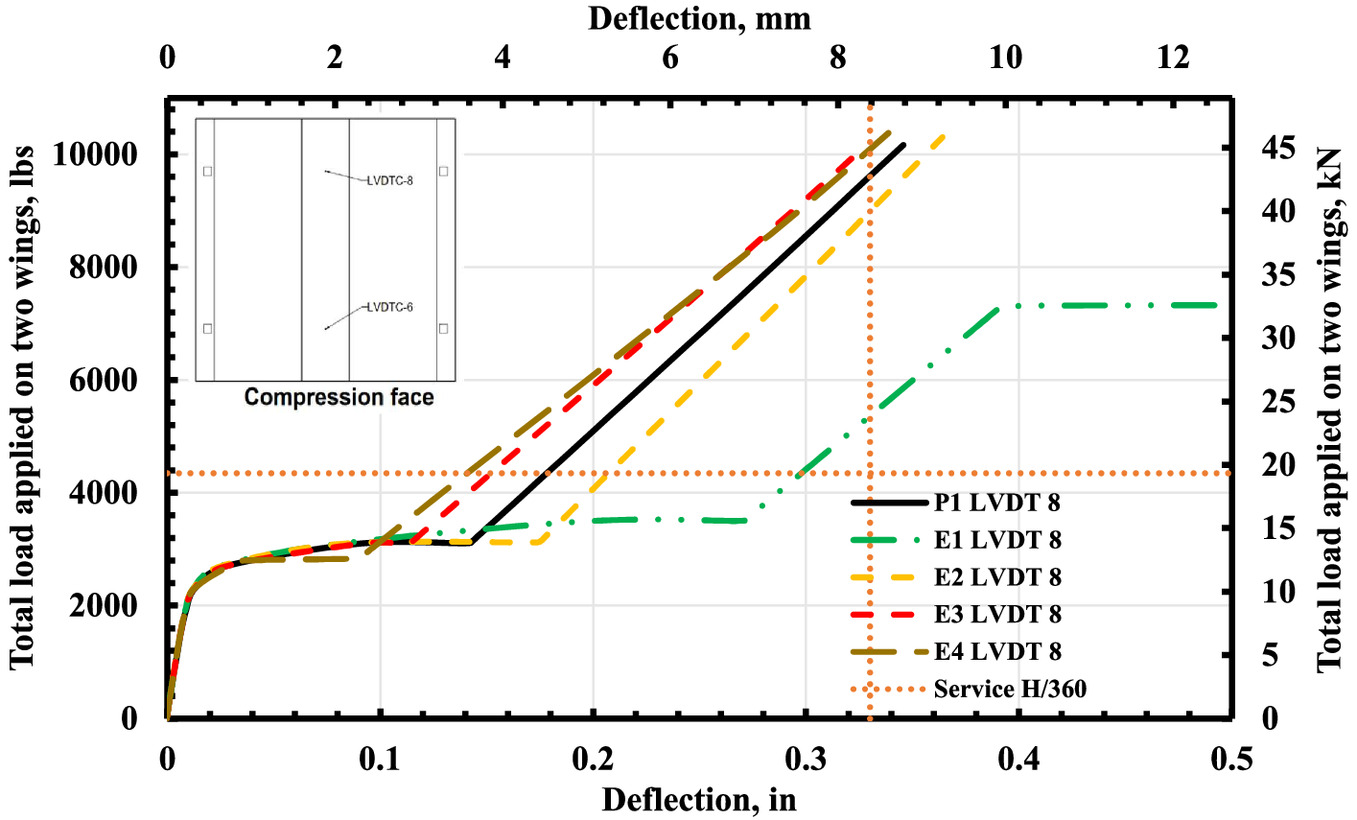
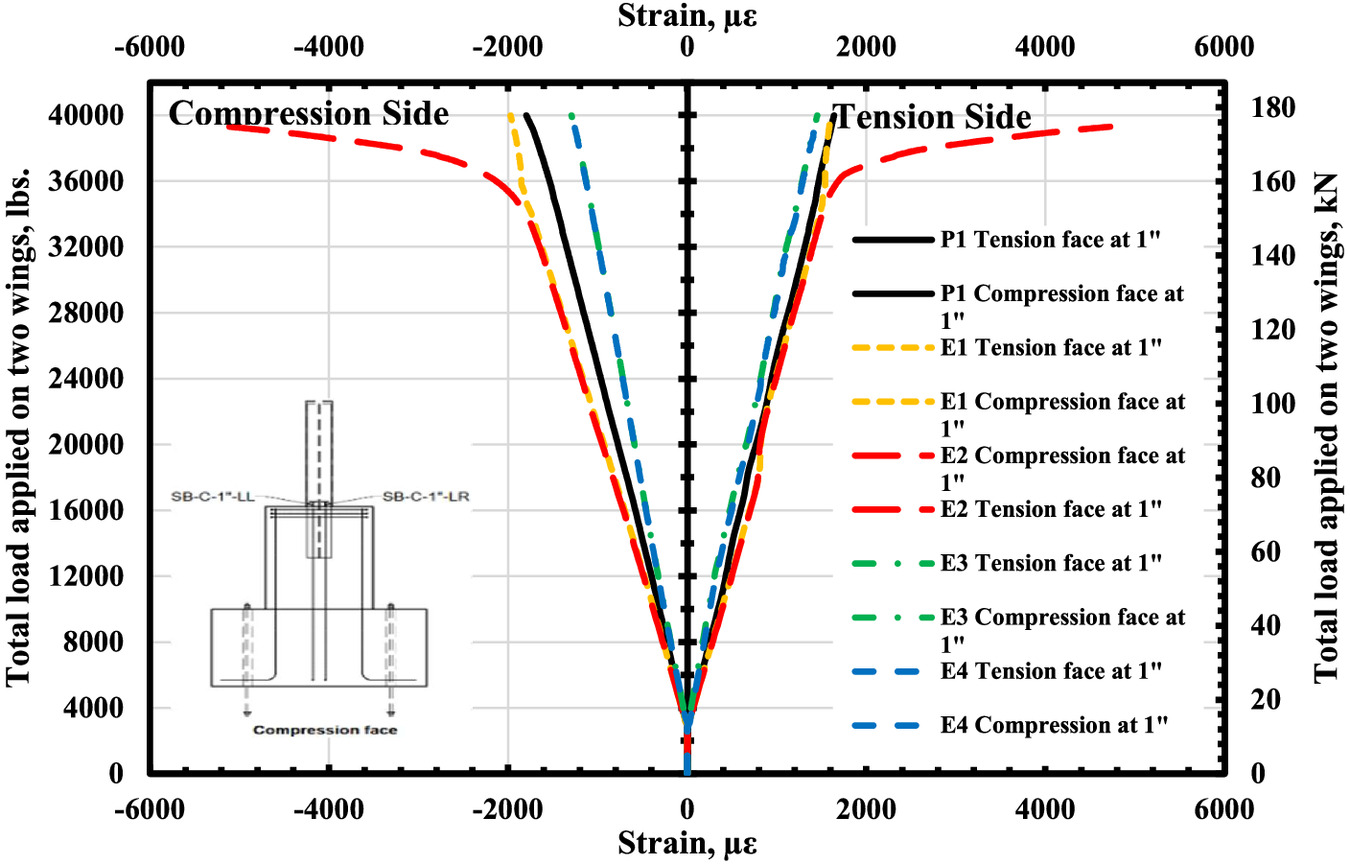
Fig. 23 shows the steel section’s load versus tensile and compressive strains at various locations. Examination of the load–strain curves revealed that minimal strains develop during the initial sliding stage because the full composite action has not yet been established for all specimens. However, once the sliding was complete and contact was established between the integral column and the steel section, both tensile and compressive strains increased linearly with the applied load. However, the steel section of Specimen E1 developed strains higher than all other specimens.
Influence of the Removal of the Intentional Gap
The structural performance of the noise wall barrier system is significantly influenced by the gap existing between the flange of the steel section and the inner surface of the square section embedded within the integral column, as illustrated in Fig. 3. The gap’s presence leads to the initial sliding of the entire superstructure of the wall system until contact is established between the two surfaces. The presence of the gap is essential because it allows for the easy insertion of the steel section into the column groove while also serving as a cushion for the subsequent placement of wall system panels. This is crucial to prevent cracking or permanent deformation, especially because the system may require slight rotation during installation, ensuring a secure and durable assembly.
Specimen G1 had the steel section inserted into the integral wall groove without any gap, resulting in direct contact between the beam flange and the embedded steel tube. The interaction between the beam surface and the steel tube was characterized as surface-to-surface contact, with normal behavior defined as hard contact, and tangential behavior defined as a penalty with a specified friction coefficient.
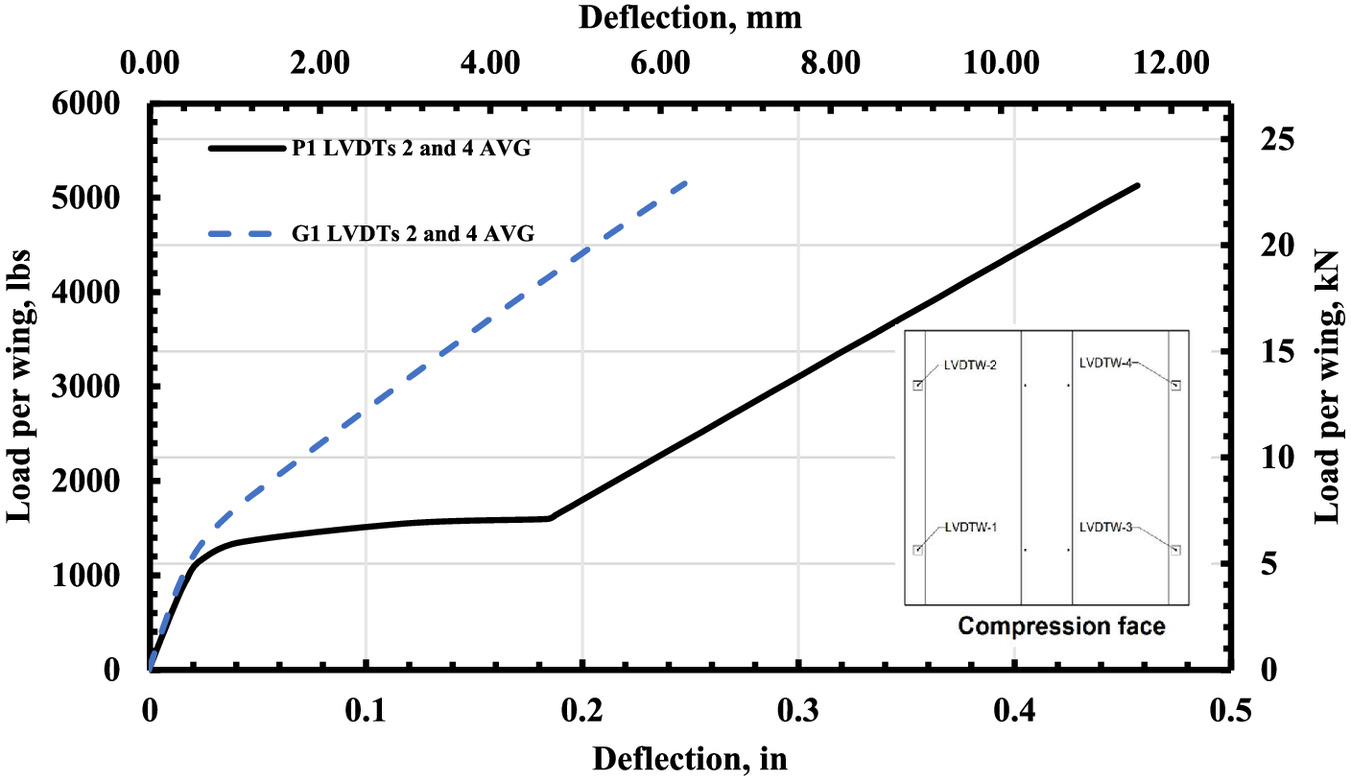
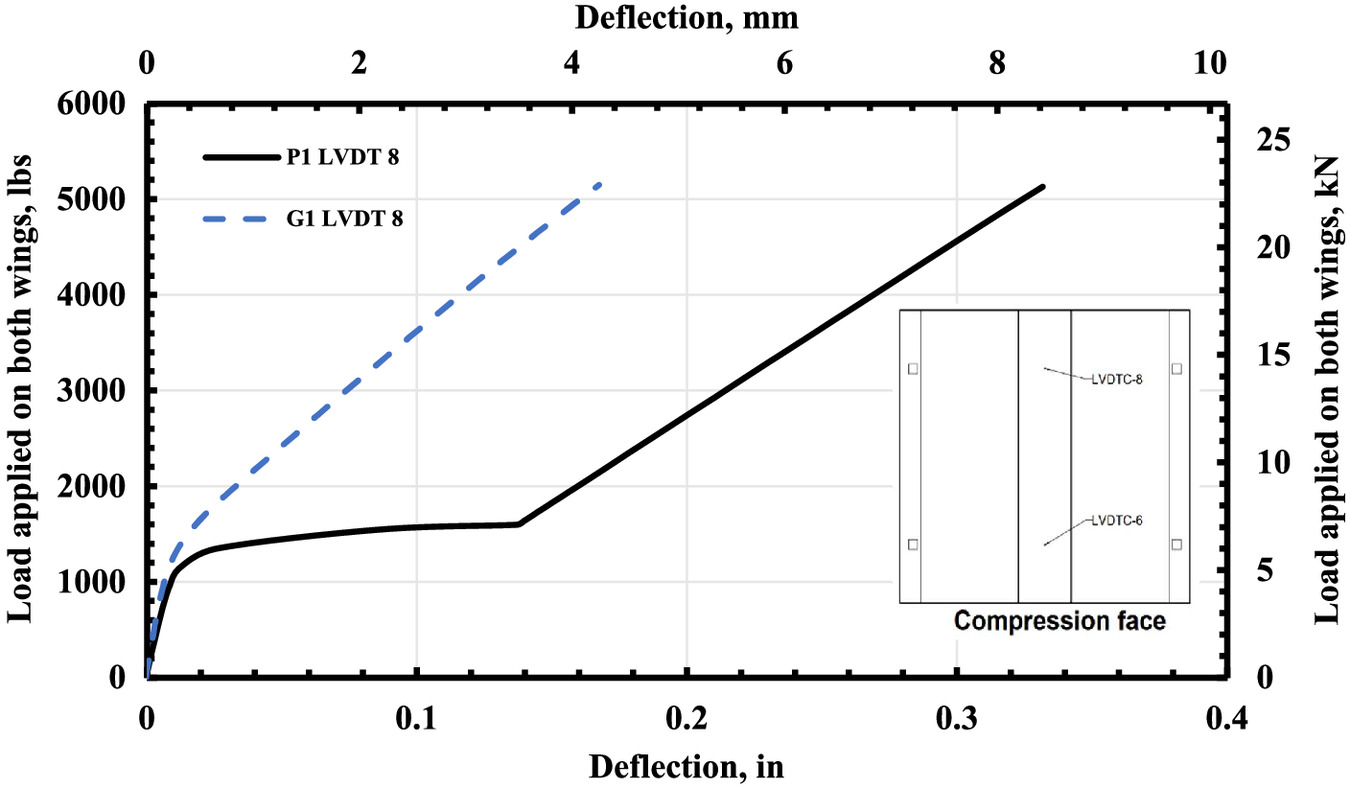
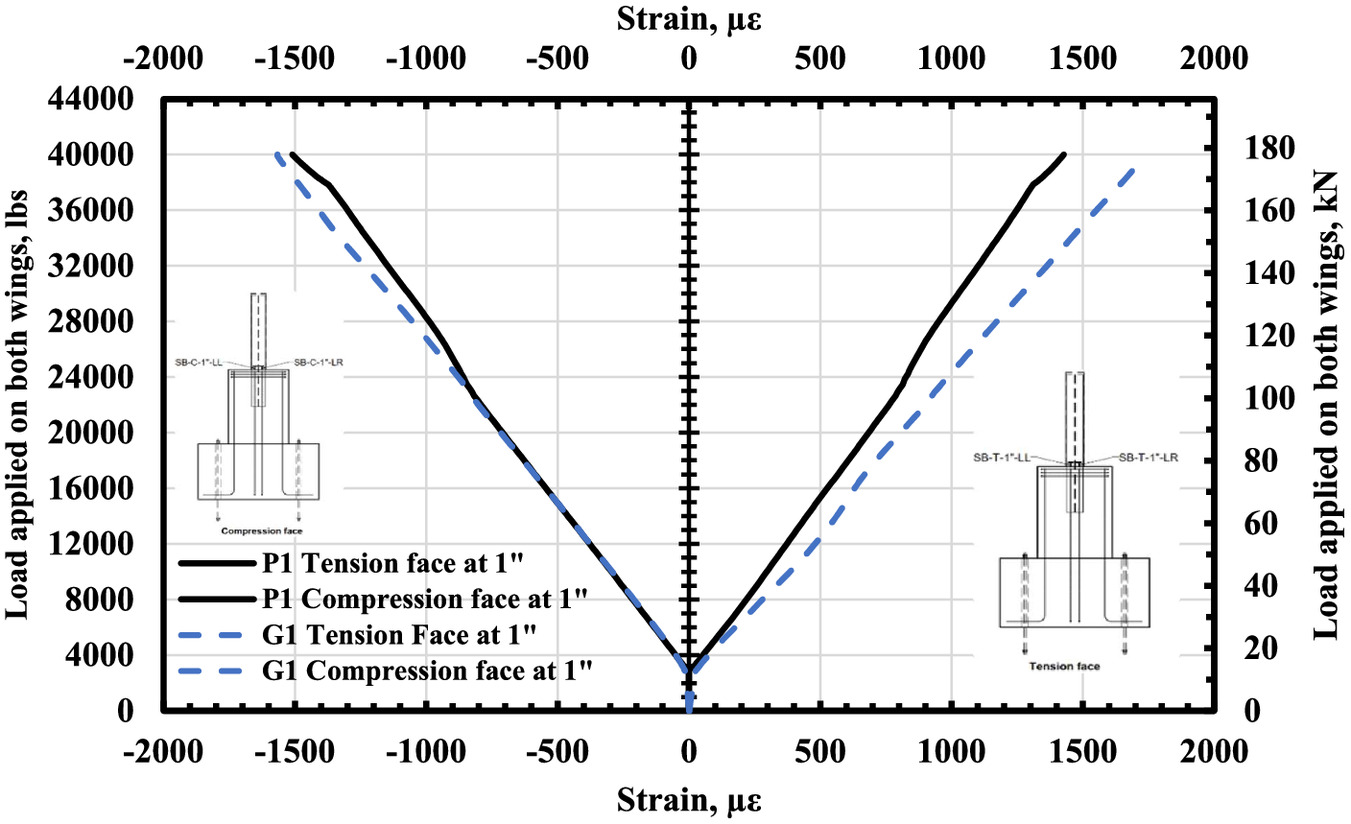
Figs. 24 and 25 depict the load–deflection curves of the wall system wings for Specimens P1 and G1. Notably, the absence of a gap is evident, leading to the absence of any sliding. A consistent pattern emerged when examining the load–deflection characteristics of the wall systems. The rate of the load–deflection increase after the initial sliding in S1 mirrored the increase observed in G1. Eliminating the gap between the flange face of the steel section and the inner face of the embedded HSS tube resulted in an increase of the strains developed at the lower portion of the steel section, specifically at the height of 1 in. (25.4 mm) of the pier surface. This is because without a gap, this specific region was subject to increased bending stresses that commence earlier due to immediate contact upon the initial load application. Fig. 26 shows the load–strain curves for Specimens P1 and G1 steel sections.
Influence of the Type of the Steel Section
The size and type of the steel section significantly influence the cost of the noise barrier wall system. The steel section is a pivotal element of the wall system because it provides the necessary stiffness and stability and plays a crucial role in transferring loads from the superstructure to the substructure. In the experimental program, the steel section was selected after undergoing multiple iterations and modeling processes. This study involved the development of various models to evaluate the impact of altering the steel section. Specifically, Specimens S-1 and S-2 were equipped with HSS (square) and HSS (round) sections (Figs. 27 and 28), respectively. It was decided to maintain a gap between the HSS tube and the steel section that will be inserted into the integral column to keep the system’s installation process.
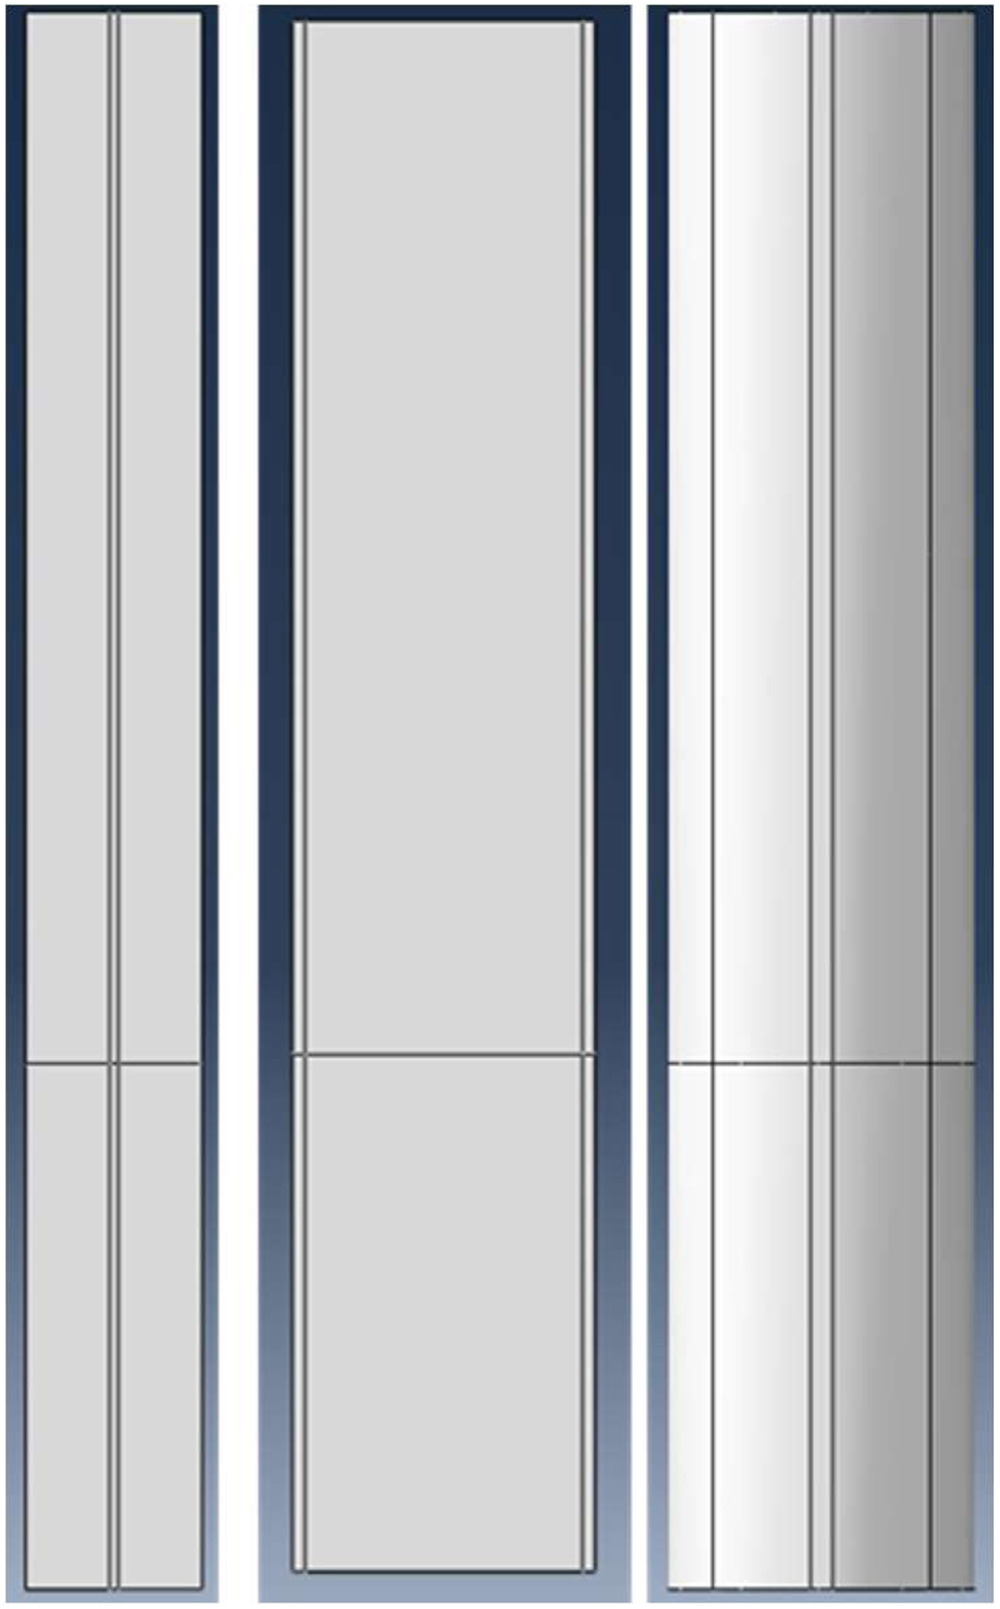
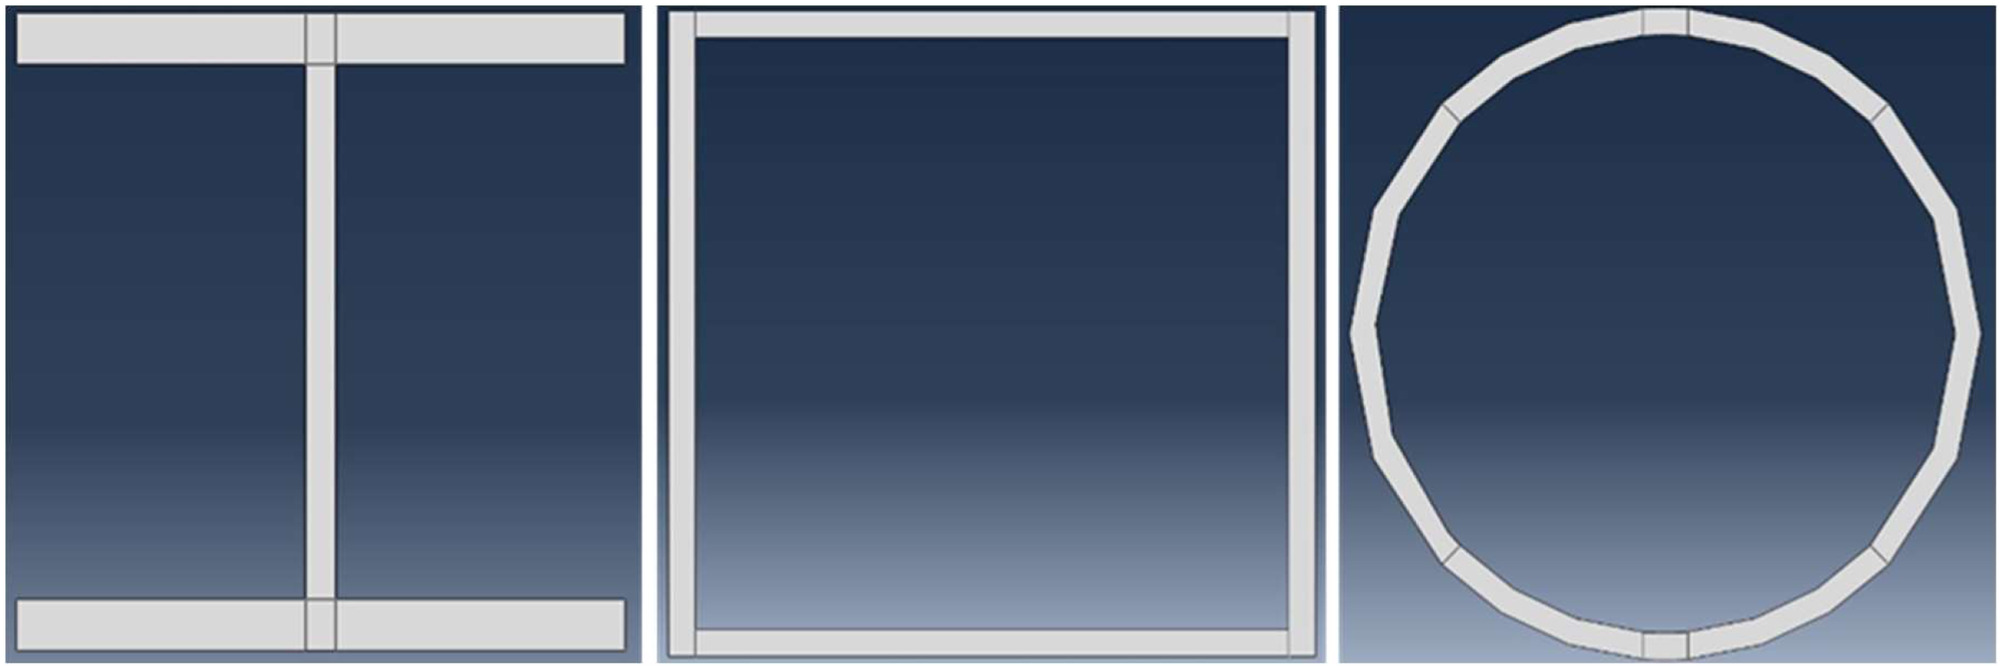
Fig. 29 demonstrates the load–deflection curves of the wall system wings. Specimens S1 and S2 provided the wall system with higher rigidity and stiffness. Each wing encountered a load of approximately 1,350 lb (6.01 kN) under a service limit state wind pressure of 15 psf (). Considering a panel length () of 162 in. (4,114.8 mm), the deflection limit is (17.2 mm). The average deflection measured at this service limit was approximately 0.125 in. (3.17 mm) for Specimen P1, indicating that this limit has been met for all specimens.
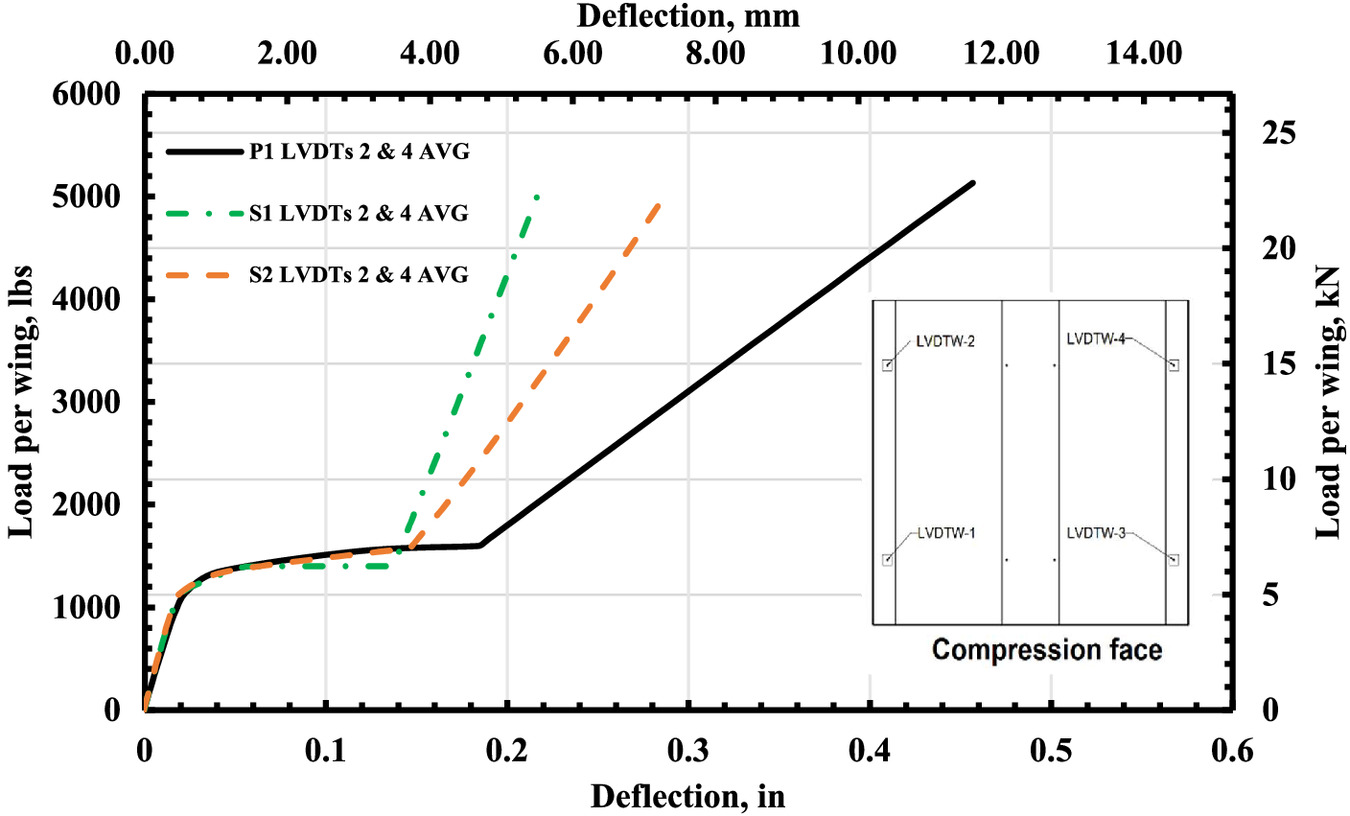
Fig. 30 demonstrates load–deflection curves of the wall system integral column. The deflection limit for the integral column under a service load of approximately 4,350 lb (19.35 kN) and a height () of 120 in. (3,048 mm) is calculated as (8.5 mm). With sliding, the maximum deflection recorded for integral columns under this service load was approximately 0.16 in. (4.1 mm) for Specimen P1. This indicates that the integral column’s deflection limit has also been met.
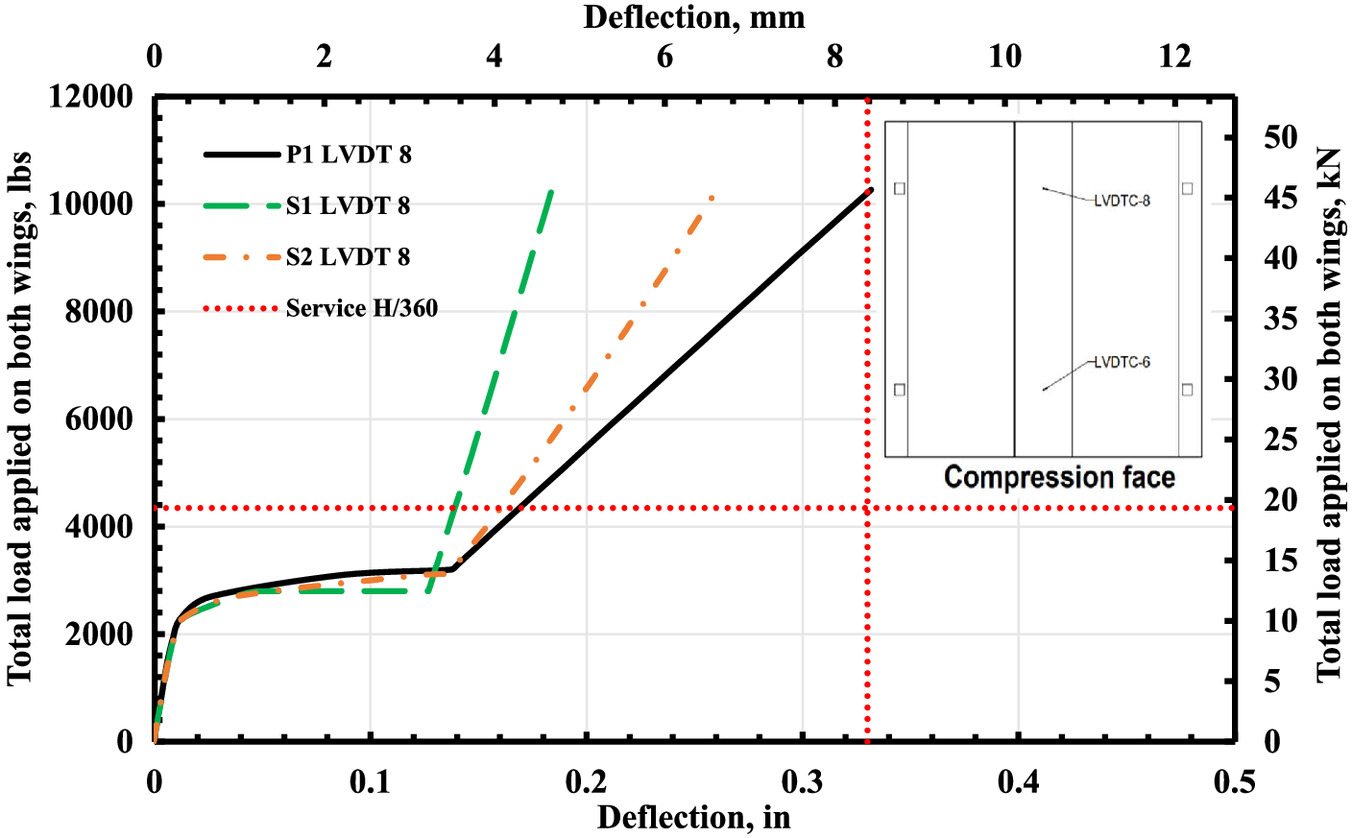
Fig. 31 shows the steel section’s load versus tensile and compressive strains at various locations for all specimens. Examination of the load–strain curves revealed that minimal strains developed during the initial sliding stage because the full composite action had not yet been established for all specimens. However, once the sliding was complete and contact established between the integral column and the steel section, both tensile and compressive strains increased linearly with the applied load. However, the steel section of Specimen P1 developed strains higher than those of Specimens S1 and S2.
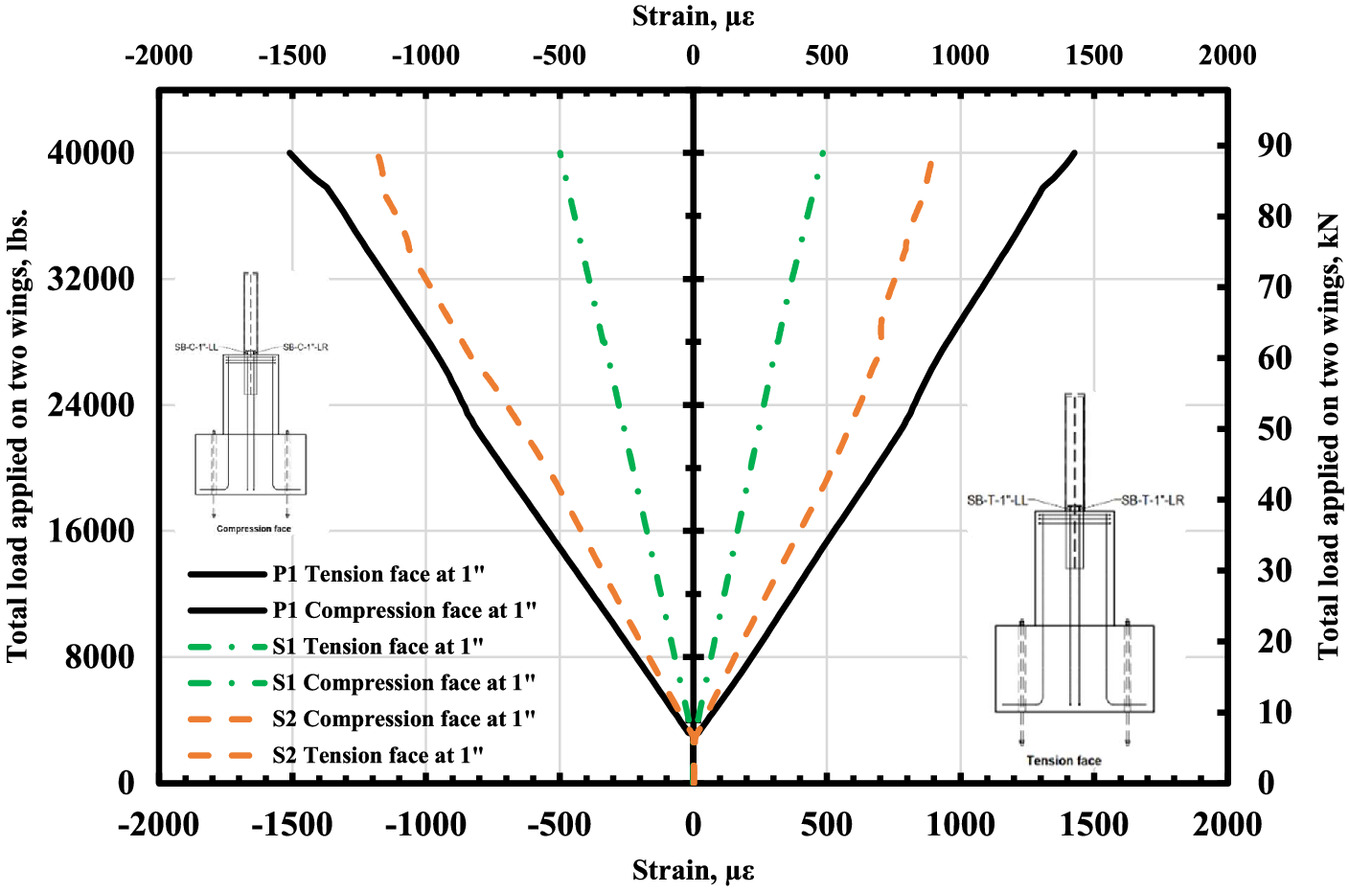
Fig. 32 demonstrates the stress distribution along the beam length. The impact of the steel section’s geometry on stress distribution can be observed. In the case of Specimen S1, the geometry of the HSS section results in maximum stress concentrations at the corner edges.
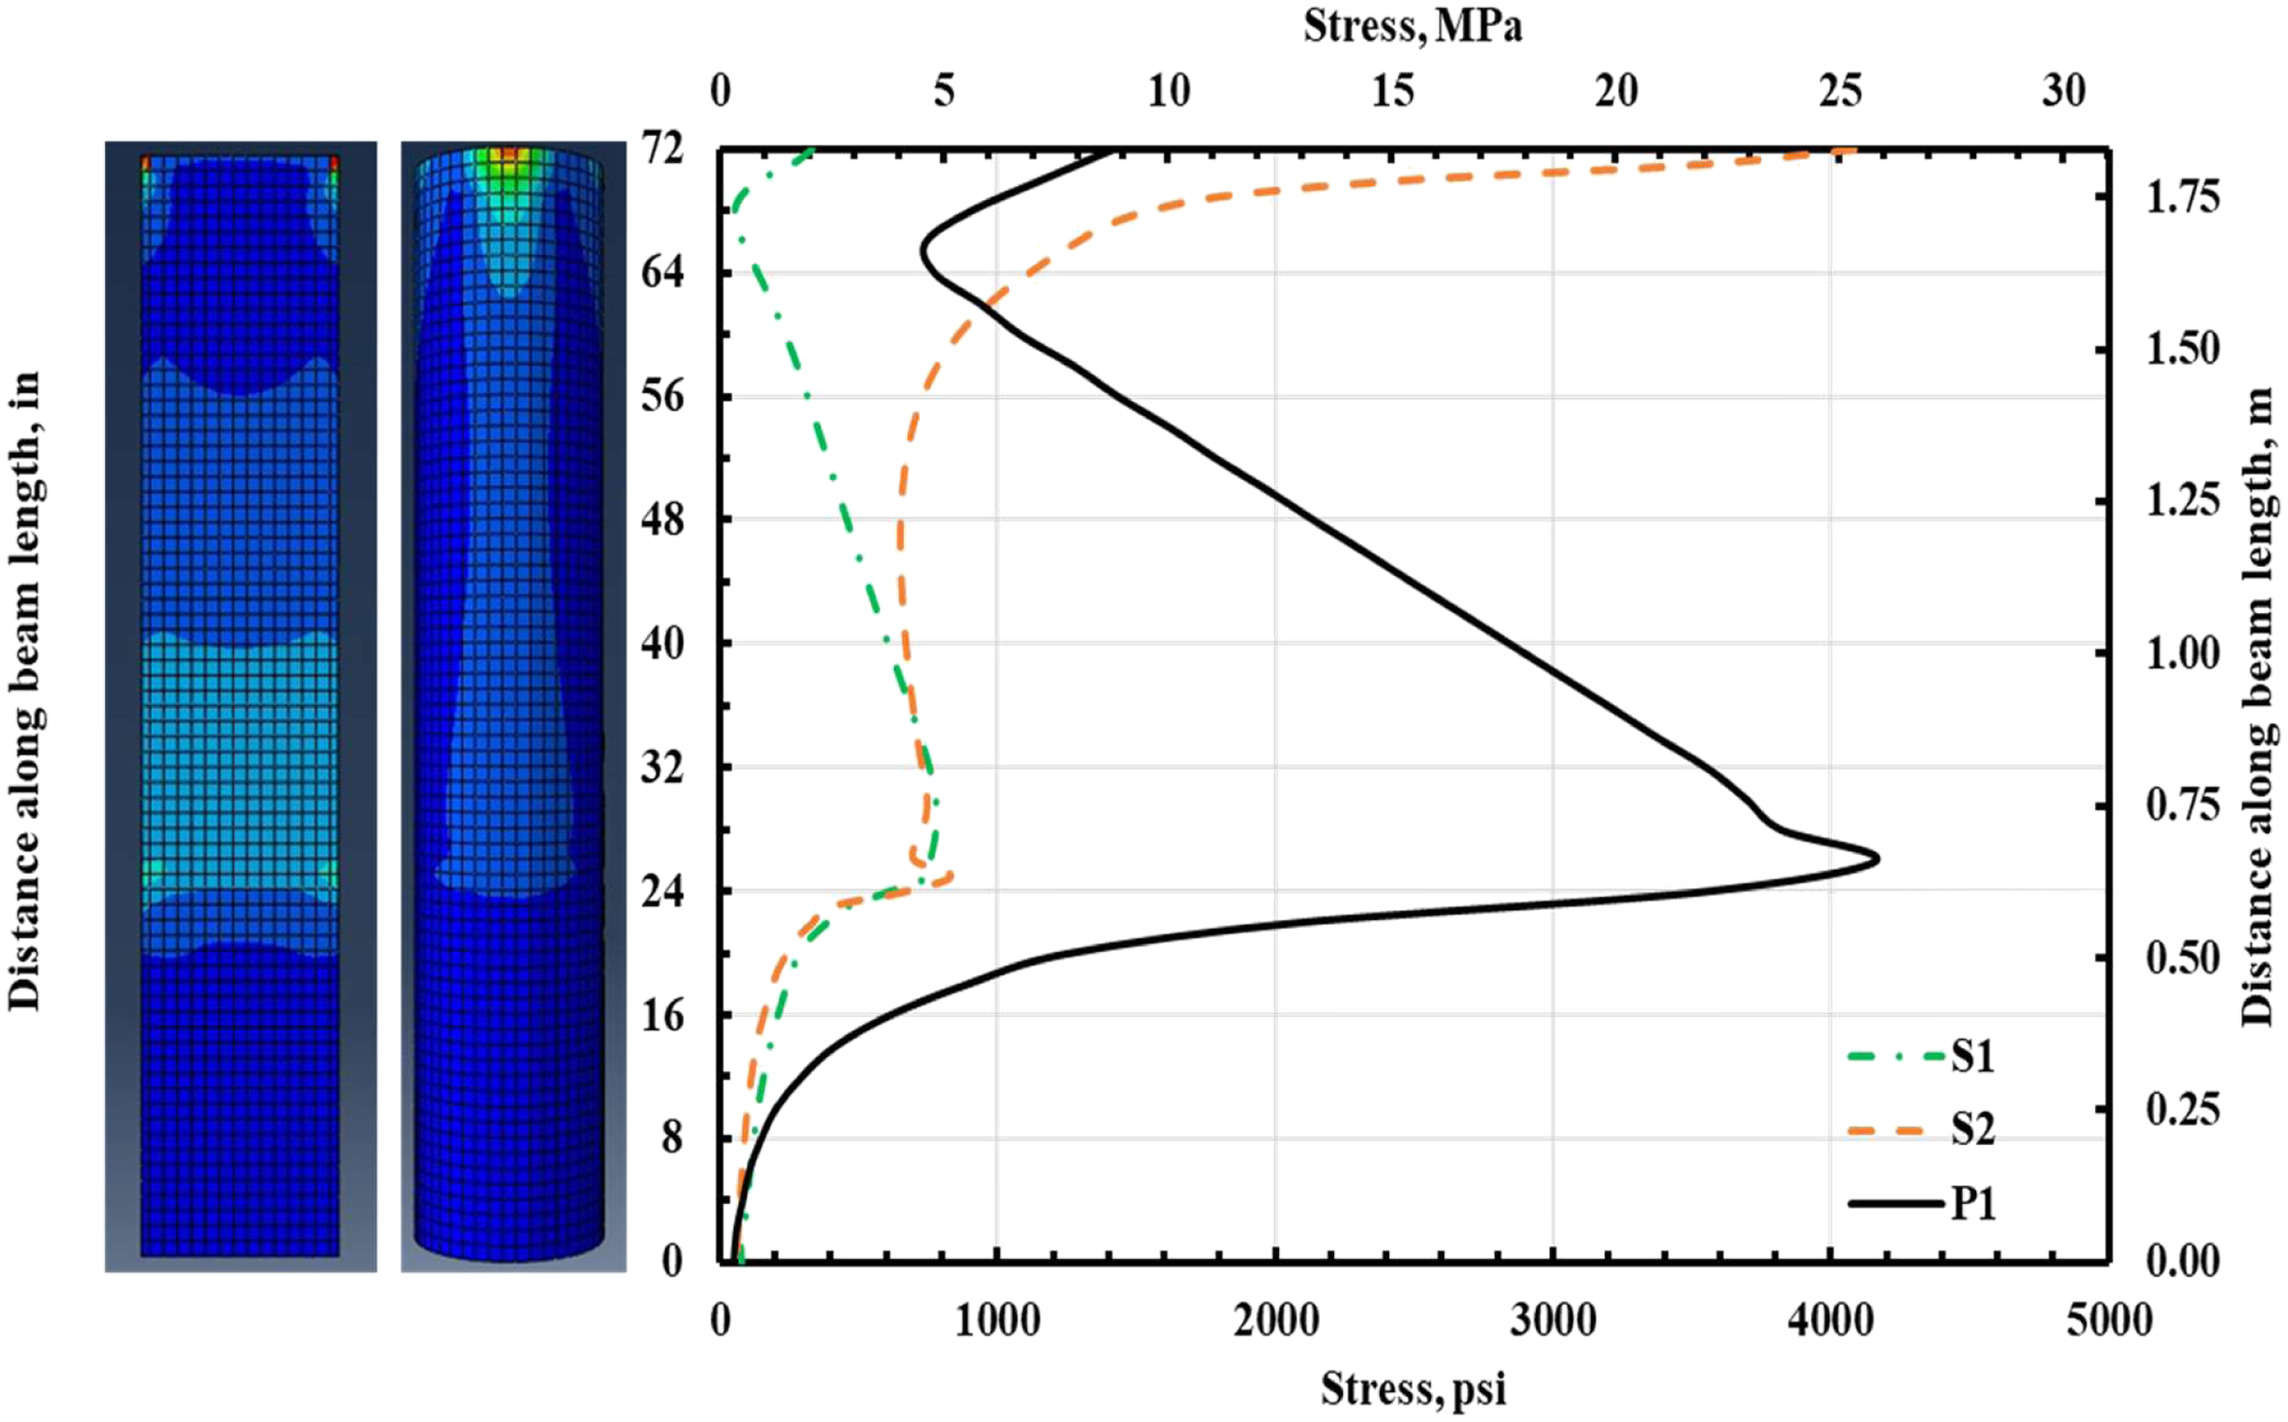
Conversely, for Specimen S2, we observed that maximum stress was predominantly situated near the middle top edge of the section. These distinct stress distributions can be attributed to the varying shapes and geometries of the sections. HSS provided the system with higher rigidity, which can be attributed to the shape’s higher stiffness in the horizontal direction. All the steel sections remained in the elastic region under service and strength limit states.
Conclusions
Three-dimensional NLFEA models were developed, calibrated, and compared with the full-scale experimental testing results of two pioneering noise barrier wall system prototypes. The NLFEA models for Prototypes 1 and 2 were subjected to an applied load per wing of 16 kips (72 kN) and 20 kips (89 kN), respectively. The deflection in the system wings, integral column, and developed tensile and compressive strains in the steel section were compared with the previous full-scale experimental testing. Following the validation of the developed models, the prototype model was used to conduct a series of parametric studies to evaluate the effect of various critical parameters.
Based on the NLFEA and parametric study results and findings, the following conclusions are drawn:
•
The developed NLFEA model was appropriately calibrated and verified and serves as a foundation for future designs and optimizations of the noise barrier wall system.
•
Reductions in the integral column size from 24 in. (609.6 mm) to 18 in. (457.2 mm), 16 in. (406.4 mm), or 14 in. (355.6 mm) would still ensure the structural integrity of the noise barrier wall system. This adjustment would also preserve the system’s capability to meet serviceability and strength limit states.
•
A circular HSS or section would be the ideal choice. Cost considerations primarily drive this recommendation because all tested sections demonstrated nearly elastic behavior under service and strength limit conditions.
•
Eliminating the gap between the flange face of the steel section and the inner face of the embedded HSS tube will lead to the absence of any sliding.
•
Increasing the embedment length will reduce strains developed at the bottom of the steel section, just 1 in. (25.4 mm) above the pier surface. In addition, the increase in embedment length resulted in reduced sliding of the wall system superstructure.
Data Availability Statement
All data, models, and code generated or used during the study appear in the published article.
Acknowledgments
Structural Enginuity, Inc., Naperville, Illinois, financially supported this research study under Grant #G1835 awarded to the University of Illinois at Chicago (UIC). The authors sincerely thank Structural Enginuity, Inc., for their generous support and trust in designing, analyzing, and testing the proposed noise wall system. In addition, the authors thank the technical support provided by the UIC technicians and staff and all who provided help and support to complete this project.
References
AASHTO. 2014. AASHTO LRFD bridge design specifications. 7th ed. Washington, DC: AASHTO.
Ahmed, K. A., L. N. Lowes, and D. E. Lehman. 2023. “Investigation of the behavior of slender reinforced concrete walls with complex configurations using nonlinear finite element analysis.” Resilient Cities Struct. 2 (1): 120–142. https://doi.org/10.1016/j.rcns.2023.02.010.
Amaireh, L. K., and G. Haikal. 2018. “The stick-slip decomposition method for modeling large-deformation Coulomb frictional contact.” Coupled Syst. Mech. 7 (5): 583–610. https://doi.org/10.12989/csm.2018.7.5.583.
ASTM. 2015. Standard practice for capping cylindrical concrete specimens. ASTM C617/C617M-15. West Conshohocken, PA: ASTM.
ASTM. 2019. Standard practice for making and curing concrete test specimens in the laboratory. ASTM C192/C192M-19. West Conshohocken, PA: ASTM.
ASTM. 2021. Standard test method for compressive strength of cylindrical concrete specimens. ASTM C39/C39M-21. West Conshohocken, PA: ASTM.
Bendtsen, H. 2010. Noise barrier design: Danish and some European examples. Rep. No. UCPRC-RP-2010-04. Sacramento, CA: Caltrans.
Boulbes, R. J. 2020. Troubleshooting finite-element modeling with ABAQUS with application in structural engineering analysis. Dordrecht, Netherlands: Springer. https://doi.org/10.1007/978-3-030-26740-7.
Daee, B., and H. El Naggar. 2017. “3D finite element analysis of composite noise barrier constructed of polyurethane products.” Front. Struct. Civ. Eng. 11 (1): 100–110. https://doi.org/10.1007/s11709-016-0364-8.
Dassault Systèmes Simulia Corp. 2011. ABAQUS/CAE user’s manual, version 6.11. Providence, RI: Dassault Systèmes Simulia Corp.
Elrefae, A. G., and M. A. Issa. 2023. “Full-scale testing and nonlinear finite element analysis of a pioneering fully prefabricated noise barrier wall system.” Eng. Struct. 293 (Mar): 116633. https://doi.org/10.1016/j.engstruct.2023.116633.
Farhat, M., and M. Issa. 2017. “Design principles of totally prefabricated counterfort retaining wall system compared with existing cast-in-place concrete structures.” PCI J. 62 (5): 89–106. https://doi.org/10.15554/pcij62.5-04.
Farhat, M., M. Issa, M. Ibrahim, and M. Rahman. 2017. “Full-scale experimental testing and finite element analysis of a totally prefabricated counterfort retaining wall system.” PCI J. 62 (3): 72–88. https://doi.org/10.15554/pcij62.3-03.
Farhat, M., M. Issa, and B. F. J. Prado. 2019. “Pull-out behavior of headed anchors used in a totally prefabricated counterfort retaining wall system.” PCI J. 64 (1): 10. https://doi.org/10.15554/pcij64.1-04.
FHWA (Federal Highway Administration). 2000. Noise barrier design handbook. Washington, DC: FHWA.
Hafezolghorani, M., F. Hejazi, R. Vaghei, M. S. Bin Jaafar, and K. Karimzade. 2017. “Simplified damage plasticity model for concrete.” Struct. Eng. Int. 27 (1): 68–78. https://doi.org/10.2749/101686616X1081.
Illinois State Toll Highway Authority. 2021. Structure design manual. Chicago: Illinois State Toll Highway Authority.
Kent, D. C., and R. Park. 1971. “Flexural members with confined concrete.” J. Struct. Div. 97 (7): 1969–1990. https://doi.org/10.1061/JSDEAG.0002957.
Kesten, S., Ö. Umut, and B. Ayva. 2020. “Acoustic and structural design of a highway noise barrier.” IOP Conf. Ser. Mater. Sci. Eng. 800 (1): 012029. https://doi.org/10.1088/1757-899X/800/1/012029.
Krysl, P., and T. Belytschko. 1995. “Analysis of thin plates by the element-free Galerkin method.” Comput. Mech. 17 (1): 26–35. https://doi.org/10.1007/BF00356476.
Marzok, A., O. Lavan, and A. N. Dancygier. 2020. “Predictions of moment and deflection capacities of RC shear walls by different analytical models.” Structures 26 (Dec): 105–127. https://doi.org/10.1016/j.istruc.2020.03.059.
Minaie, E., F. L. Moon, and A. A. Hamid. 2014. “Nonlinear finite element modeling of reinforced masonry shear walls for bidirectional loading response.” Finite Elem. Anal. Des. 84 (Dec): 44–53. https://doi.org/10.1016/j.finel.2014.02.001.
Mortazavi, S. M., and B. Zaeimdari. 2021. “Shear wall modeling with asymmetric openings by macro elements.” Structures 29 (Feb): 899–910. https://doi.org/10.1016/j.istruc.2020.08.049.
Murphy, E., and E. King. 2014. Environmental noise pollution. Amsterdam, Netherlands: Elsevier.
Nascimbene, R. 2022. “Penalty partial reduced selective integration: A new method to solve locking phenomena in thin shell steel and concrete structures.” Curved Layered Struct. 9 (1): 352–364. https://doi.org/10.1515/cls-2022-0027.
Vacek, V., J. Kolísko, J. Tichý, and R. Cvancigerová. 2015. “Concrete precast panel for noise barrier of new generation.” Adv. Mater. Res. 1106 (Dec): 114–117. https://doi.org/10.4028/www.scientific.net/amr.1106.114.
Wahalathantri, B. L., T. H. T. Chan, and Fawzia. 2011. “A material model for flexural crack simulation in reinforced concrete elements using ABAQUS.” In Proc., 1st Int. Conf. on Engineering, Designing and Developing the Built Environment for Sustainable Wellbeing, edited by C. J. L. Cowled, 260–264. Brisbane, QLD, Australia: Queensland Univ. of Technology.
Information & Authors
Information
Published In

Journal of Structural Engineering
Volume 150 • Issue 11 • November 2024
Copyright
This work is made available under the terms of the Creative Commons Attribution 4.0 International license, https://creativecommons.org/licenses/by/4.0/.
History
Received: Oct 16, 2023
Accepted: Jun 6, 2024
Published online: Sep 3, 2024
Published in print: Nov 1, 2024
Discussion open until: Feb 3, 2025
Authors
Metrics & Citations
Metrics
Citations
Download citation
If you have the appropriate software installed, you can download article citation data to the citation manager of your choice. Simply select your manager software from the list below and click Download.