Impact of Long-Duration Earthquakes on Successive Earthquake-Tsunami Fragilities for Reinforced Concrete Frame Archetypes
Publication: Journal of Structural Engineering
Volume 150, Issue 10
Abstract
This study quantifies the effects of long-duration earthquakes on the behavior of reinforced concrete (RC) buildings subjected to successive earthquake-tsunamis through the development of fragility surfaces. The suite is comprised of both ductile and nonductile systems, representing a portfolio of RC structures that could be found in a (coastal) community. Previous research has shown that long-duration earthquakes can significantly influence the structural responses and even the collapse behavior of building systems. Earthquakes with large moment magnitudes that produce tsunamis are often long duration events, yet ground motion duration has not been fully considered when generating tsunami fragility curves or successive earthquake-tsunami fragility surfaces. This study incorporates earthquake loading through a nonlinear time history analysis (NLTHA) and subsequent tsunami loading with a nonlinear static procedure. Detailed probabilistic structural models are subjected to both long-duration and regular-duration earthquakes through the NLTHA phase of the successive simulation to explore the possible impact of long-duration earthquakes on earthquake-tsunami fragility surfaces used to represent the behavior of these RC buildings. Results show that failure probabilities from the fragility surfaces are increased by up to 40% in some cases, with low- to mid-rise RC structures (ductile and nonductile; up to 8 stories) being adversely affected by long-duration earthquakes. Furthermore, this study reports the governing parameters of scalar and vector-valued fragility functions in the proposed RC portfolio exposed to long-duration earthquakes and tsunami hazards. These fragility surfaces can be useful in developing community-level models in risk-based or resilience-based decision-support for disaster mitigation.
Introduction
Offshore earthquakes have the potential to trigger tsunamis which can affect coastal communities near and far. While less frequent than the source earthquake itself, these events can cause widespread damage, loss of life, and subsequent socioeconomic impacts. For example, the Tohoku earthquake and subsequent tsunami that struck Japan in 2011 resulted in over 19,000 deaths, 6,000 injuries, and left 342,000 people houseless. In addition, according to Kajitani et al. (2013), about 119,000 residential buildings were completely destroyed, while 685,000 other buildings were partially damaged, resulting in direct losses of $211 billion (USD). As a result of these long-term impacts, many communities are exploring community resilience planning to ensure their community can recover from hazard events. Ideally, this process requires modeling using a comprehensive numerical platform encompassing component-to-community modeling procedures (Koliou et al. 2020). This resilience-based analysis can help to mitigate the impact of natural hazards on coastal communities both before and after an adverse event.
Presidential Policy Directive 21 (PPD 21, 2014) defines resilience as the ability to prepare for, withstand, and recover rapidly from adverse events. This means anticipating potential challenges, mitigating their impact, and promptly recovering from any resulting setbacks (Wang et al. 2021). Community resilience frameworks often use fragility functions as a first step to estimate the initial damage that a target community may experience after a single or compound hazard scenario, such as an earthquake, a tsunami, or both. Based on these initial risk-based damage assessments, scientists and engineers can evaluate the current functionality of a community after an event as well as the recovery path of complex socioeconomic institutions within that community (Watson et al. 2020). In this way, the fragility functions developed for existing structural typologies in a target community can use the output of a hazard analysis for a selected scenario event to assess the initial damage in a community.
Earthquake fragility curves have been developed for different structural systems in the past using both deterministic and fully probabilistic approaches (Bandyopadhyay et al. 1990; Chen et al. 2022; Li et al. 2014). However, tsunami fragility functions are not as prevalent in the literature, and most of them have been derived through empirical and statistical methods (Chua et al. 2021; Suppasri et al. 2011). Furthermore, tsunami fragility functions developed through physics-based simulations are typically for far-field tsunamis, which are based on the loadings from the tsunami hazard (Alam et al. 2018; Attary et al. 2017b; Petrone et al. 2017). These past studies employed a nonlinear static procedure (NSP) on a nonlinear structural model (deterministic or probabilistic), with a constant or adjustable lateral loading profile created based on an estimated equivalent tsunami force.
In contrast to the previously mentioned studies focused on far-field tsunamis, several investigations (Alam et al. 2019; Attary et al. 2021; Carey et al. 2019; Park et al. 2012; Petrone et al. 2020; Rossetto et al. 2019; Xu et al. 2021) have developed near-field tsunami fragility functions that can capture the cascading damage effects between earthquake and tsunami by taking into account loadings from both hazards. These studies typically utilized a two-phase successive analysis procedure consisting of a nonlinear time history analysis (NLTHA) for the earthquake loading, followed by a force-based NSP analysis for the tsunami hazard. However, these studies did not incorporate long-duration earthquakes in the NLTHA part of the successive simulation. Evidence from previous studies (Ando and Nakamura 2013; Carvajal et al. 2017) revealed that earthquakes with a large moment magnitude (M) can cause tsunami events, which were found to have a high positive correlation with the significant ground motion (GM) duration (Kempton and Stewart 2006; Mashayekhi et al. 2020; Salmon et al. 1992).
Previous research on the effect of earthquake strong motion duration across different structural systems, including reinforced concrete (RC) structures (Belejo et al. 2017; Hancock and Bommer 2007; Li et al. 2022), masonry (Bommer et al. 2004), dams (Xu et al. 2018; Zhang et al. 2013), steel frames (Barbosa et al. 2017; Chandramohan et al. 2016; Wang and Li 2022), and bridges (Su et al. 2023; Todorov and Billah 2021), has identified a marked positive correlation between earthquake duration and structural damage or collapse probability (Chandramohan et al. 2016). Furthermore, structures exhibiting deteriorative responses to seismic shaking, notably RC and masonry structures, have been shown to be more adversely affected by strong duration of earthquake motions, which aligns with the highest correlations observed in structural damage (Mashayekhi et al. 2019). The degree of this correlation is significantly influenced by the chosen engineering demand parameter (EDP) in these studies, encompassing both local and global damage indices. Local indices covered cumulative damage metrics such as the Park-Ang damage index (Park and Ang 1985), patterns of element cracks (Zhang et al. 2013), and hysteresis strength reduction (Bommer et al. 2004). Global indices incorporated measures like horizontal dam displacement (Xu et al. 2018), peak inter-story drift ratio (Belejo et al. 2017; Chandramohan et al. 2016), and floor acceleration (Li et al. 2022). While local indices, especially cumulative damage metrics, have shown a more pronounced correlation with the duration of strong earthquake motions (Hancock and Bommer 2007; Mashayekhi et al. 2019), peak interstory drift ratio (Belejo et al. 2017; Chandramohan et al. 2016) has been effectively employed in collapse and fragility assessments for higher earthquake intensity levels as an EDP, adeptly quantifying the impact of earthquake strong motion duration. It is important to note that these studies employed spectral matching to isolate the effect of earthquake strong motion duration from other amplitude-based earthquake parameters, aiming to solely quantify the impact of earthquake duration. This process involves adjusting or manipulating the frequency content of the original acceleration time series using spectral matching methods to match their response spectra to a target spectrum across all or a range of considered natural periods of vibration (Harati et al. 2021).
This paper employs a methodology proposed by Harati and van de Lindt (2024) to quantify the impact of long-duration earthquakes on the fragility surfaces of successive earthquake and tsunami hazards. The approach considers uncertainty characterization associated with the structural modeling procedure, input ground motions (GMs) for the NLTHA procedure, and NSP analysis for the equivalent tsunami force and its distribution for the lateral loading profiles. In this paper, we investigate and quantify the impact of long-duration earthquakes on the topological behavior of earthquake-tsunami fragility surfaces by applying both long-duration and regular-duration earthquake motions to a portfolio of RC frames, including both ductile and nonductile structures. The RC frame archetypes used in this study represent an RC building portfolio that could be used to populate a community-level model for a coastal community in areas exposed to tsunami and long-duration source earthquake risk.
Strong Motion Duration
There are various definitions in the literature for the strong motion duration of earthquake records. This study has selected significant duration for the definition of motion duration. Significant duration is based on a well-known integration-based relationship called Arias Intensity (AI), which provides a good representation of the earthquake input energy imparted to a structure. For a given earthquake motion, the AI can be calculated aswhere the AI of a motion is calculated using the acceleration time history of an earthquake record, denoted as , and a time window for the earthquake signal , where is less than or equal to the total duration of motion. The AI of an earthquake record is a function of time, which can be calculated based on the for the entire motion duration. Fig. 1 demonstrates the normalized AI of the 1989 Loma Prieta earthquake that has been calculated and plotted against motion duration.
(1)
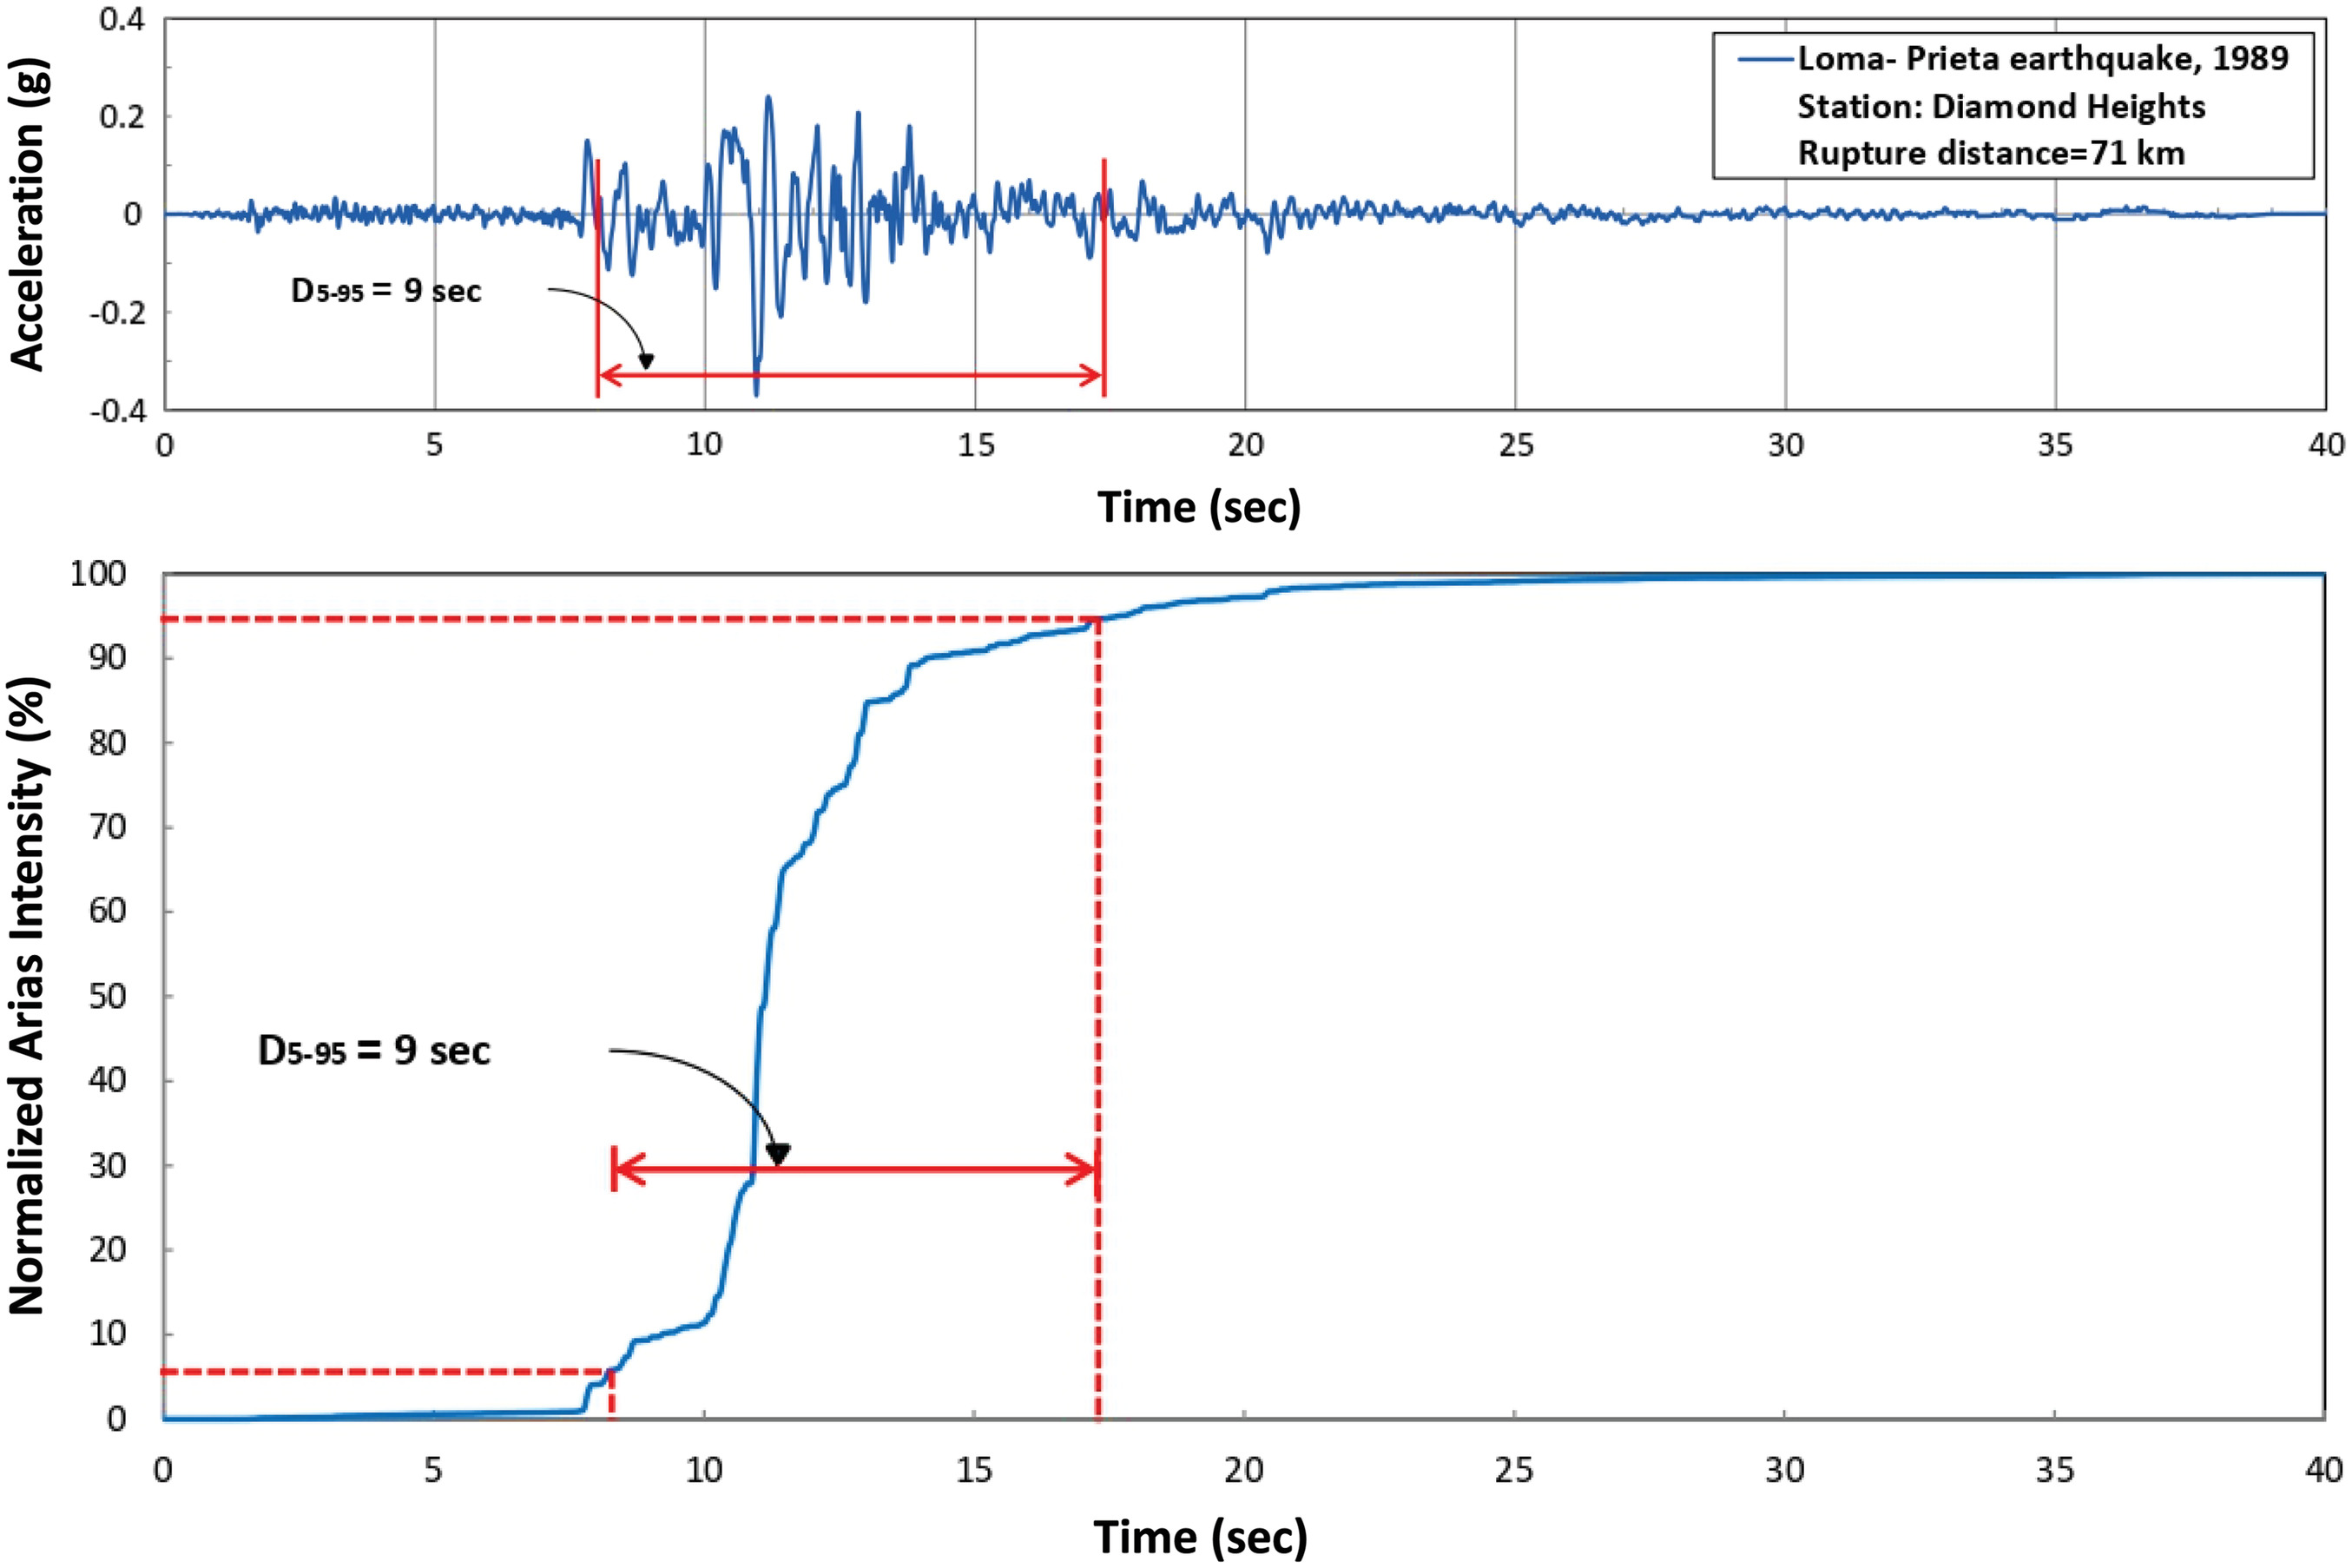
As illustrated in Fig. 1, significant duration is typically denoted as DX-Y, where X and Y represent the lower and upper bounds defined on the AI function of an earthquake motion, respectively (e.g., 5% and 95% in this figure). In this case, the duration between 5% and 95% of the AI plot of an earthquake record is considered as the significant duration (referred to as D5-95 hereafter). While other forms of significant duration (e.g., D5-75) exist in the literature (Bommer and Martínez-Pereira 1999), the D5-95 is more commonly used in the GM selection procedure (e.g., Afshari and Stewart 2016), so it has been selected as the duration-related metric for this study.
Earthquake and Tsunami Loads
Tsunamis and earthquakes are related natural hazards, but the damage they cause is not necessarily directly correlated. For example, a building exposed to near-field tsunami risk would first endure damage from the earthquake before being affected by the tsunami itself. Thus, it is crucial to consider earthquake and tsunami hazards in succession for communities susceptible to these types of multihazard events.
Earthquake Loading
The prediction of structural response during earthquakes is crucial for generating earthquake-tsunami fragility surfaces. An NLTHA procedure is typically utilized in Incremental Dynamic Analysis (IDA) and Multiple Stripe Analysis (MSA), though alternative methods like the Cloud and Hybrid methods are also available (Baker 2005). While the IDA procedure and the dynamic instability concept are used to develop collapse-level fragility functions, a Monte Carlo (MC) simulation and the MSA can generate earthquake fragility curves at different damage states (Baker 2015).
In MSA, a suite of ground motion records, ideally representative of the seismic threat at the corresponding spectral acceleration, is used for each stripe analysis, conducted at multiple spectral acceleration levels. However, it is common, though not always well justified, to use the same suite of records for all levels (Jalayer and Cornell 2009). This method entails scaling GMs, calculating EDPs using an NLTHA procedure, and comparing these EDPs to the damage threshold in each damage state. The spectral acceleration in the first mode, Sa(T1), is typically the earthquake intensity measure (IM) in both IDA and MSA. The exceedance probability of each damage state threshold at each intensity measure is assessed, and a lognormal cumulative distribution function (CDF) is fit to the data to derive the earthquake fragility functions.
Tsunami Loading
In order to generate earthquake-tsunami fragility surfaces, a two-phase successive analysis (discussed later in this section) is necessary: simulations for earthquake and tsunami loading. There are various methods for producing fragility curves for structures exposed to tsunami hazards, which can differ in terms of the total equivalent tsunami force applied to the structure, the type of tsunami IM used as input, the analysis method and load profile shape, and the location of the equivalent tsunami force vector along the building height. The expected tsunami forces may have hydrostatic, hydrodynamic, impulsive, and debris impact components (Attary et al. 2021). However, the hydrodynamic component was considered as the most important part of expected tsunami force in previous studies (Alam et al. 2018; Attary et al. 2017a; Petrone et al. 2017). The combination of flow depths and velocities results in a hydrodynamic force that can be estimated by the equation in ASCE07 (ASCE 2022)where = drag coefficient recommended to be within a range of 1.25–2 [ASCE07 (ASCE 2022)]; the inundation depth of tsunami () measured from the foundation level of a building, and its flow velocity () are two factors that play a crucial role in determining the tsunami momentum flux ().
(2)
Two methods are generally used to investigate the potential impacts of tsunami forces on structures. The first one is to utilize an NLTHA procedure to assess the structural behavior of a building under recorded tsunami force histories (Petrone et al. 2017). Since the time histories of the tsunami forces, recorded in the past events, are limited to a few rare cases, NSP analyses are typically used as an alternative method in the literature for the fragility and structural damage assessments of a building under tsunami actions (Belliazzi et al. 2021; Medina et al. 2019). The equivalent tsunami force can be applied to structural models using different profile shapes for lateral loading in the NSP analysis, including profile shapes with constant height (CH) or variable height (VH). In the CH profile, the tsunami loading height remains uniform throughout the analysis, irrespective of the combinations of and in Eq. (2). Conversely, the VH profile, which adjusts according to the predicted tsunami inundation depth in each iteration or realization of the simulation, offers a more realistic representation of tsunami impact.
Successive Analysis Procedure
The development of earthquake-tsunami fragility surfaces requires sequential simulations of the effects of earthquakes and tsunamis on structures. Fig. 2 shows the successive analysis procedure, which includes two main phases: (1) structural response to a GM using an MSA procedure; and (2) structural response to tsunami action through an NSP analysis with a VH profile.
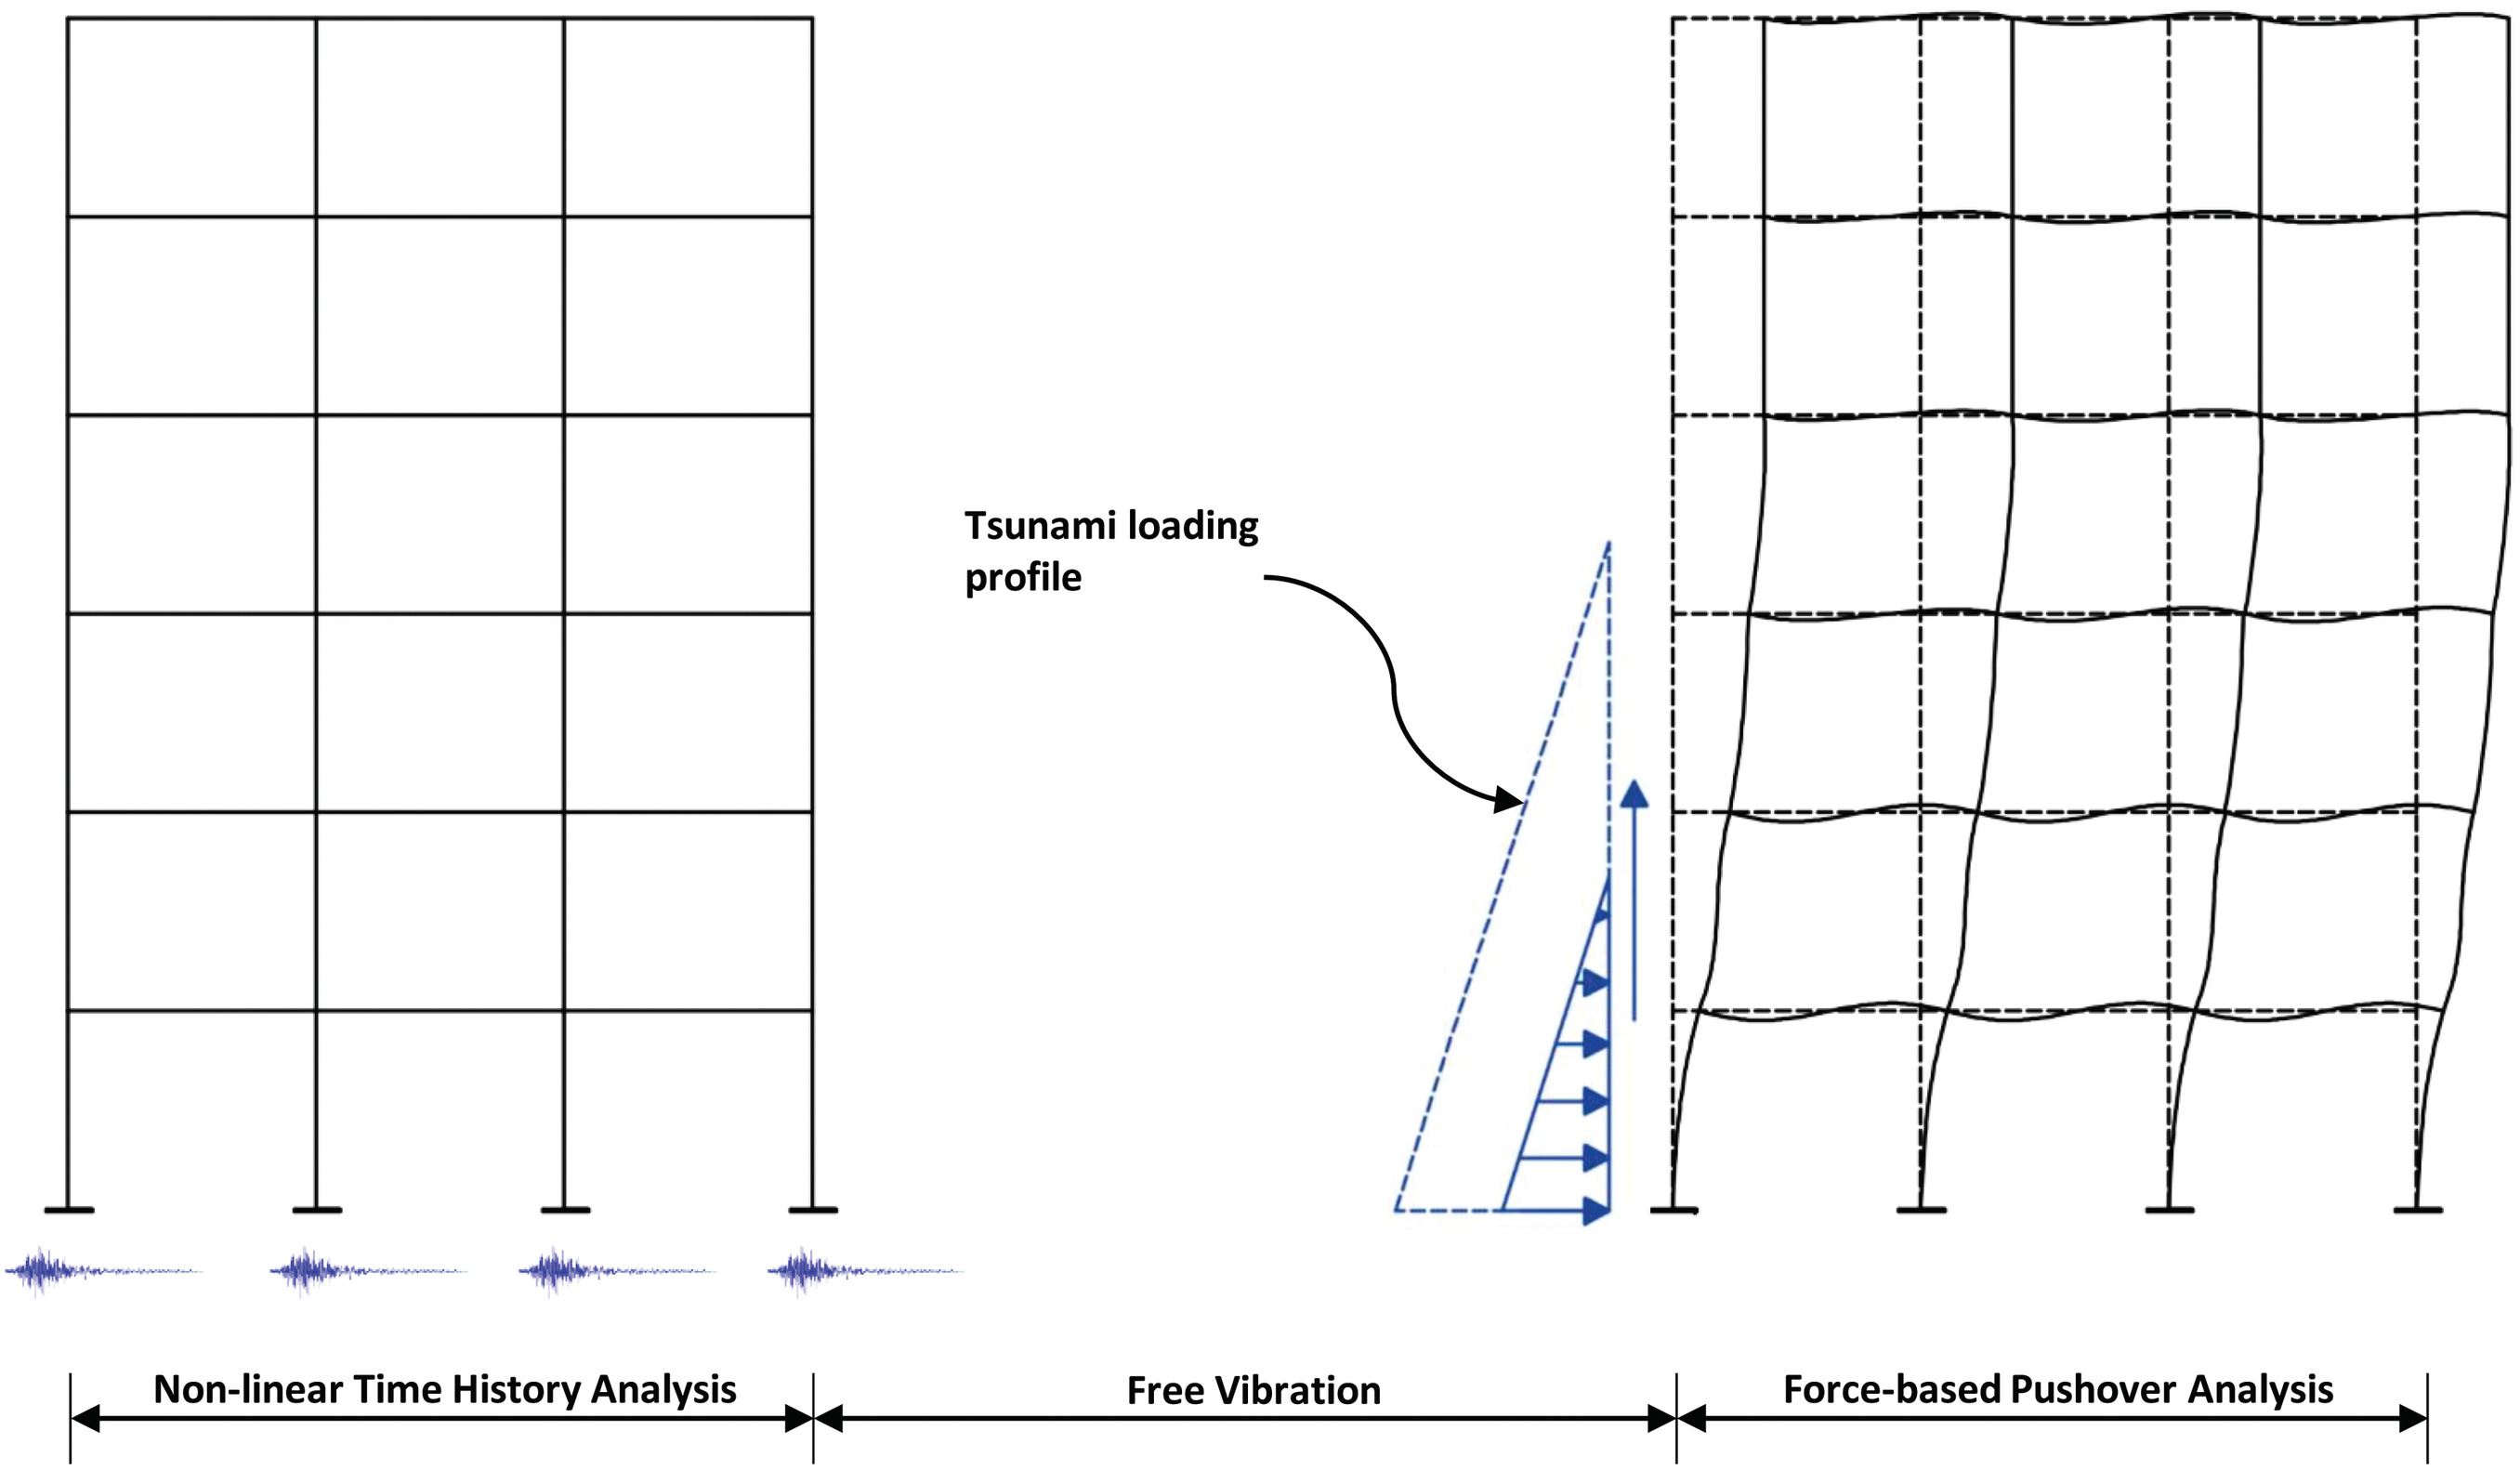
The peak interstory drift ratio (PIDR) was selected as the EDP for the first phase of the simulation to define slight, moderate, and complete damage states based on FEMA (2020) recommendations. The degraded strength and stiffness from this analysis phase are then transferred to the tsunami simulation as the initial conditions. In the second phase, a force-based nonlinear static procedure (NSP) analysis, following a free vibration analysis, was utilized to predict the structural response under tsunami loading.
The selection of PIDR as the EDP is informed by several key considerations. Firstly, the choice of PIDR is aligned with its use as an EDP in the tsunami phase of the successive analysis, ensuring consistency across different simulation phases. Additionally, PIDR is a prevalent choice in collapse-level simulations for earthquake hazards, particularly in IDA procedure and fragility function development. As shown in the introduction part of the paper, it has been used in the past as the EDP for fragility function development under long-duration earthquakes (Chandramohan et al. 2016) as well. This choice also facilitates the application of well-defined performance criteria for different damage levels as per HAZUS guidelines. In contrast, using cumulative damage measures as EDPs poses challenges in defining clear performance criteria for all damage states.
The modified formula of the tsunami hydrodynamic force, Eq. (3), considers the effect of openings:where = closure coefficient, varying between 0.35 and 1.0 based on suggestions by Alam et al. (2018). The range for was set at 0.35–1, with indicating no opening and indicating full opening. This range was selected because the structure modeled in Alam et al. (2018) is a moment resisting frame (MRF) system, closely resembling the RC buildings investigated in this paper. The momentum flux () in this equation has been selected as the tsunami IM, because it was demonstrated to be well correlated with the structural damage (Attary et al. 2017a). The PIDR and the shear demand of seaward columns are used as the EDPs in the second phase of the simulation. Accordingly, the failure criteria have been established as a combination of drift-based damage states and a postprocessing assessment for columns, in accordance with the recommendations of Biskinis et al. (2004), to evaluate the shear capacity of the columns. Consequently, the structural response history from the earthquake and tsunami hazards is produced at the end of this two-phase successive analysis, allowing for the evaluation of EDPs and the expected cascading failures after a tsunami following the source earthquake.
(3)
RC Frame Archetypes
The buildings analyzed in this study focus on a suite of RC buildings, which include both ductile and nonductile RC MRFs, different heights, configurations, and design details. The MRF systems were chosen to represent both older and newer RC frame buildings located in an arbitrary US west coast coastal community vulnerable to seismic hazards.
This study specifically examines six RC ductile frames and four RC nonductile frames with space frame lateral resisting systems that had previously been designed and analyzed in other studies (Haselton et al. 2011; Liel et al. 2011). It is important to note that all 10 structural systems were designed as office buildings with a flat-surface floor system of 20.32 cm (8 inches) in thickness. RC ductile frames range from one-story to twenty-story levels, whereas RC nonductile frames range from two-story to twelve-story levels. Table 1 summarizes the geometric configurations of the lateral systems, as well as the corresponding design methods employed for each frame. The study, consistent with Liel and Deierlein (2008) assumes that nonductile RC frames were constructed before 1960 and designed according to the highest seismic zone in California at the time, which is equivalent to Zone 3 of the 1967 UBC code. Therefore, the design of these frames followed essential building code requirements such as maximum and minimum reinforcement ratios, stirrup designs, and maximum spacings. For more information on the nonductile MRF systems employed in this study, readers can refer to a scientific report by Liel and Deierlein (2008). On the other hand, the ductile RC frames were consistent with Haselton (2006) and designed according to more recent codes like International Building Code, ASCE07 (ASCE 2002), and ACI 318 (ACI 2002) to satisfy the applicable code requirements for strength, stiffness, design capacity, and dimensional details for structural members. Essentially, more ductility for structural members is provided in this case by implementing provisions such as strong column-weak beam ratios, enhanced joint shear capacities, and regulations regarding transverse confinement in plastic hinge zones. Despite adjustments to the period-based equation for designing base shear, the base shear coefficients for nonductile and ductile RC frames of equivalent height are relatively similar (Liel et al. 2011). This similarity holds except in the case of the shortest structures, where notable differences in the base shear coefficient may be observed. For more details about the design procedure for the ductile RC frames, Haselton (2006) provided a comprehensive report.
| Structure ID | Number of stories | Ductility status | Seismic code | Bay length (m) | Base shear coefficient | Ground floor height (m) | Typical floor height (m) | Fundamental period (s) |
|---|---|---|---|---|---|---|---|---|
| RC1 | 1 | Ductile | ASCE 7-02 | 6 | 0.121 | 4.6 | 4 | 0.39 |
| RC2 | 2 | Ductile | ASCE 7-02 | 6 | 0.125 | 4.6 | 4 | 0.61 |
| RC3 | 4 | Ductile | ASCE 7-02 | 6 | 0.092 | 4.6 | 4 | 0.94 |
| RC4 | 8 | Ductile | ASCE 7-02 | 6 | 0.050 | 4.6 | 4 | 1.85 |
| RC5 | 12 | Ductile | ASCE 7-02 | 6 | 0.044 | 4.6 | 4 | 2.04 |
| RC6 | 20 | Ductile | ASCE 7-02 | 6 | 0.044 | 4.6 | 4 | 2.45 |
| RC7 | 12 | Nonductile | UBC (1967) | 7.62 | 0.047 | 4.6 | 4 | 2.26 |
| RC8 | 8 | Nonductile | UBC (1967) | 7.62 | 0.054 | 4.6 | 4 | 2.11 |
| RC9 | 4 | Nonductile | UBC (1967) | 7.62 | 0.068 | 4.6 | 4 | 1.98 |
| RC10 | 2 | Nonductile | UBC (1967) | 7.62 | 0.086 | 4.6 | 4 | 0.95 |
Structural Modeling Procedure
In this study, RC frames were numerically modeled using OpenSeesPy (Zhu 2021). OpenSeesPy was initially written in the TCL programming language but has now been converted to a Python library, allowing for the integration of structural analysis scripts into Python codes for parallel computations and postprocessing tasks. To reduce the computational demands of the two-phase successive analysis mentioned earlier, the 3D structural systems were transformed into 2D finite element (FE) models. However, it is important to note that this 2D modeling approach inherently implies that earthquakes and tsunamis are applied in the same direction. While this may be considered a conservative assumption, it does present a limitation of the current study by potentially simplifying the multidirectional nature of these hazards, but nevertheless the discrepancy between regular- and long-duration earthquakes is still investigated.
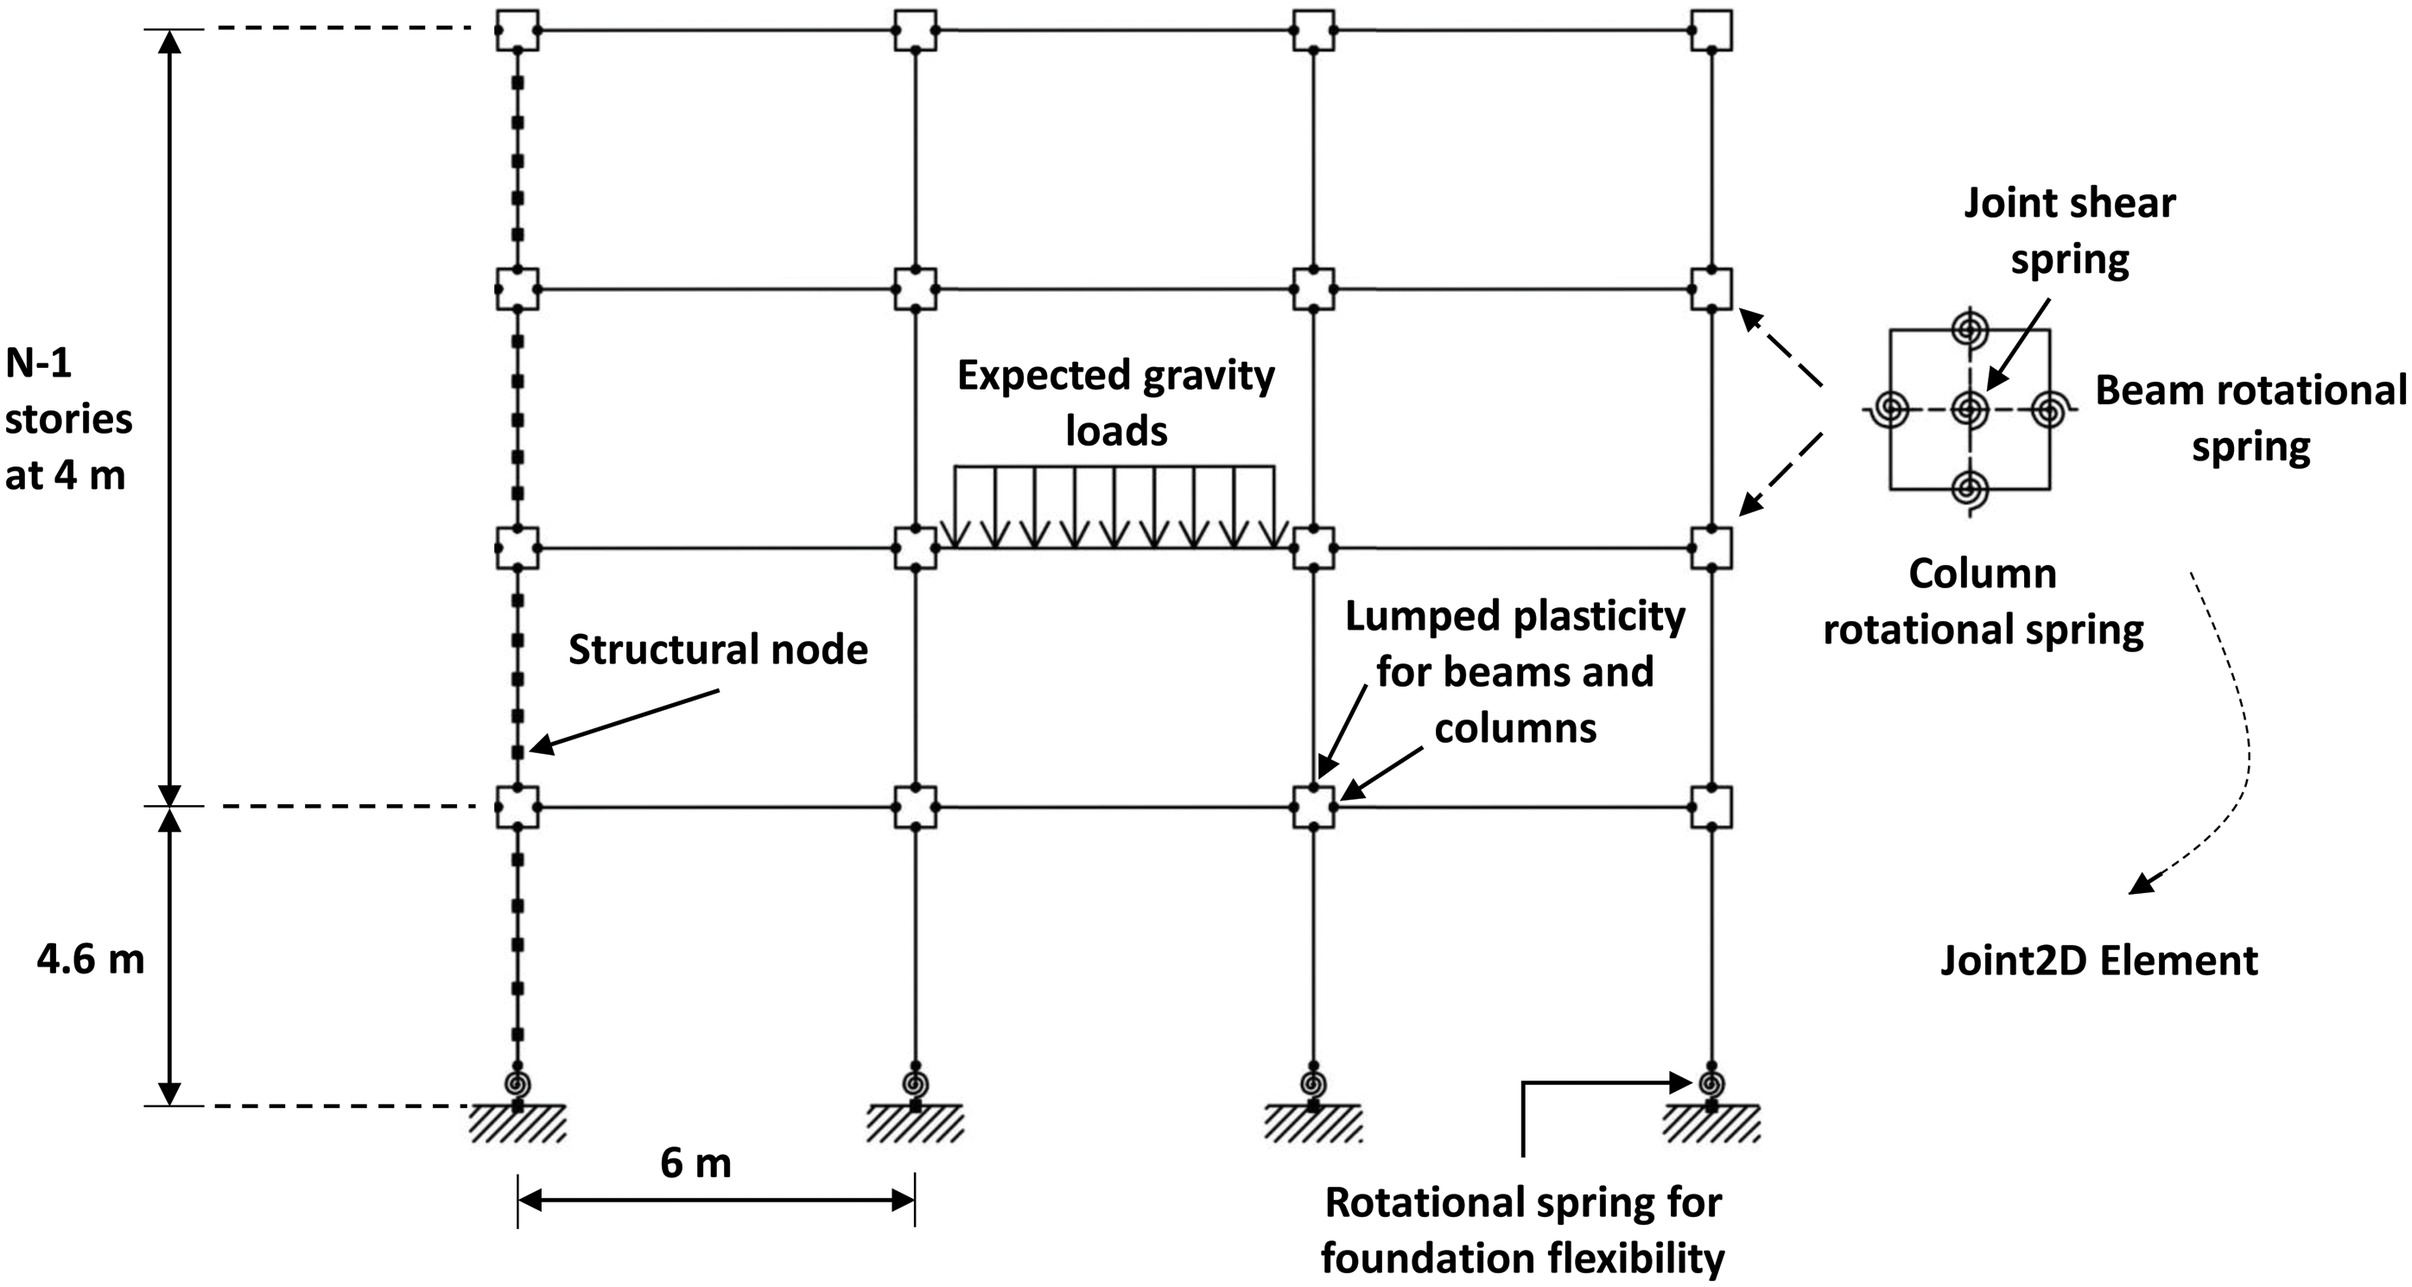
Fig. 3 presents the 2D structural model used for simulating successive hazard events. It contrasts two methods: the fiber and concentrated plasticity approaches, for modeling structures under tsunami or earthquake impacts. The fiber method is crucial for depicting inelastic behaviors along a structure, especially beyond column ends, essential for handling distributed tsunami loads. However, a major concern is shear failure in columns, particularly under lower inundation levels where shear demands are high, potentially leading to failure before reaching the first floor. Beam and column shear capacities, dependent on axial loading, vary across earthquake-tsunami phases, necessitating explicit simulation or post-processing for shear failure analysis. Force- or displacement-based distributed plasticity elements are effective here, allowing for moment-axial-shear interactions and a comprehensive view of structural responses to multihazard events. This method, demonstrated in prior studies (e.g., Alam et al. 2019, 2018; Carey et al. 2019; Petrone et al. 2020, 2017; Rossetto et al. 2019), incorporates both flexural and shear failures, using adjusted shear links or shear failure checks in postprocessing, providing a robust assessment framework for this multihazard scenario.
Conversely, other studies (e.g., Attary et al. 2021, 2017a, b; Haselton 2006; Haselton et al. 2011; Liel et al. 2011) have utilized the concentrated plastic hinge method. This technique involves lumped plasticity elements and finite joint shear springs, selected for their superior performance in capturing strain softening due to rebar buckling and spalling, essential for simulating the collapse of RC frames (Haselton 2006; Haselton et al. 2011). Based on empirical data from extensive testing on both ductile and nonductile RC columns, this method ensures accurate modeling. However, it primarily calibrates model parameters to axial compression levels in columns due to gravity loads and does not fully account for axial-flexure-shear interaction during the analysis, a factor that may be important in taller structures (Liel et al. 2011). While the fiber-spring model offers an alternative, it demonstrates less numerical stability in dynamic analysis and struggles with simulating severe strain softening, a critical failure mechanism in collapse scenarios (Haselton 2006; Haselton et al. 2011). In contrast, the lumped-plasticity model effectively captures this aspect, exhibiting severe strain softening at a roof drift ratio of approximately 3% or higher (Haselton 2006), thus proving more fit for seismic load simulations.
It is important to recognize that the concentrated plastic hinge method may not adequately simulate tsunami responses due to the development of inelasticity away from the seaward column ends under distributed loading. However, in the simulations, structures first undergo earthquake-induced damage, serving as an initial damage condition for subsequent analysis. This necessitates accurate modeling of the collapse or near-collapse response of the system. To address the limitations in simulating tsunami impacts, a postprocessing procedure is employed to incorporate the shear failure of seaward columns, thereby mitigating the trade-off errors, and enhancing the model’s overall accuracy in representing this multi-hazard scenario. As shown in Fig. 3, the structural elements for beams and columns are created using a linear elastic element connected to two nonlinear rotational springs at the endpoints. The nonlinear rotational springs provide regions with concentrated plasticity for these elements, allowing the formation of plastic hinges at the endpoints throughout the analysis. The seismic mass mounted to linear beam elements is calculated according to the guidelines provided by ASCE07 (ASCE 2022) regulations.
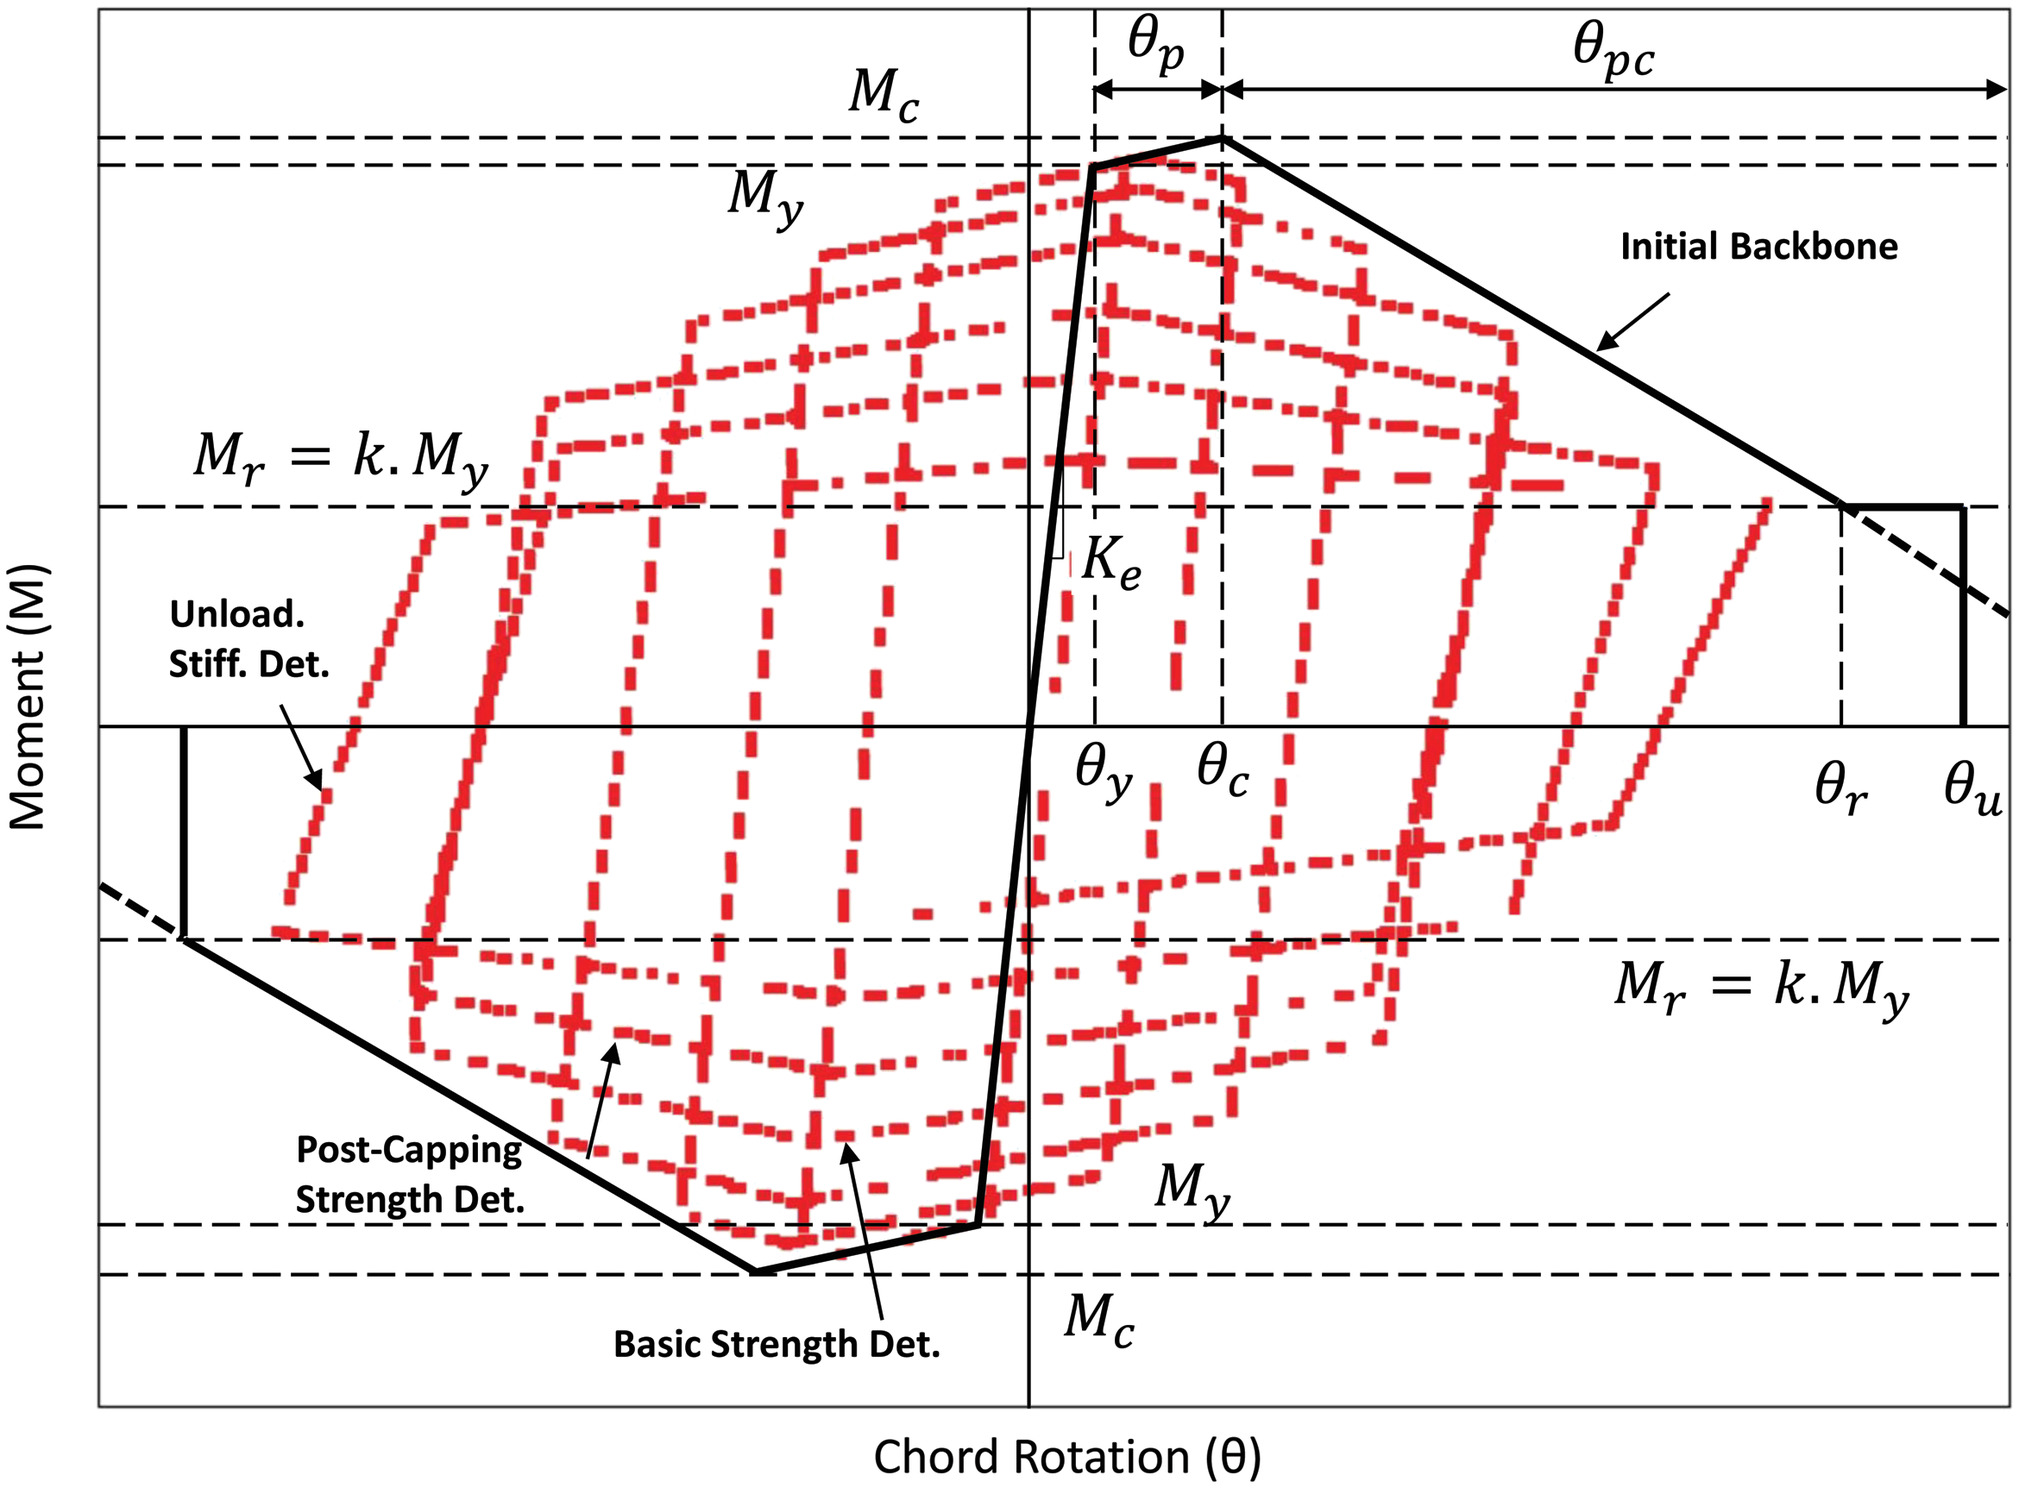
TThe modified Ibarra-Medina-Krawinkler (IMK) model (Ibarra et al. 2005; Lignos and Krawinkler 2011) is employed in this study as the nonlinear rotational springs, which can provide a deterioration model for the behavior of plastic hinges. As shown in Fig. 4, the IMK model can effectively control the strength and stiffness cyclic degradation of plastic hinges in both ductile and non-ductile RC members. This is mainly due to its ability to adjust based on the expected ductility an element can demonstrate during a numerical earthquake simulation. For example, the governing parameters of the IMK model can be tuned in such a way that it represents the hysteresis response of a nonductile RC column with limited ductility capacity. In addition, as shown in Fig. 4, the plastic hinge model is capable of capturing the cyclic behavior of elements with asymmetric hysteresis responses, such as RC beams working with concrete slabs in a fully composite manner.
In addition to defining plastic hinge regions in beams and columns, the modeling procedure also considers the shear behavior of beam-column joints. This is accomplished using a 2D joint element in OpenSeesPy as suggested by Haselton et al. (2011), which has four perimeter nodes that can be connected to the beam and column elements using IMK plastic hinges, as well as a central node that accounts for the shear deformation of the joint. For nonductile RC frames, a uniaxial material model recommended by Celik and Ellingwood (2008) has been assigned to the central node of the 2D joint elements to model the shear deformation behavior of the beam-column joints. On the other hand, in ductile systems, a uniaxial material with large elastic properties was used for the central node of the joints, as ATC (2017) reported that joints in RC ductile frames are compatible with the provisions of current seismic codes and exhibit a rigid behavior. In order to account for the interaction between the foundation and superstructure, linear spring links have been used in this study. The properties of these springs were determined based on the grade-beam design and soil stiffness properties (Liel et al. 2011). Furthermore, the structural level simulation incorporates viscous damping through the Rayleigh damping method, utilizing a random damping ratio with a mean value of 0.065, applied to the beam and column elements of the entire structural system.
Fig. 5 illustrates the pushover curve for the RC3 building’s structural model developed in this research, in comparison with the curve documented by Haselton et al. (2011). A detailed analysis of Fig. 5 reveals a notable consistency between these two pushover curves, indicating a robust correlation in their structural responses. The derivation of these pushover results in both studies stems from the application of median values of the input parameters used in the structural modeling process. For this study, the structural model is formulated on the foundation of the modified IMK model (Lignos and Krawinkler 2011). This contrasts with the approach of Haselton et al. (2011), who employed an earlier version of the IMK plastic hinge element (Ibarra et al. 2005) in their modeling.
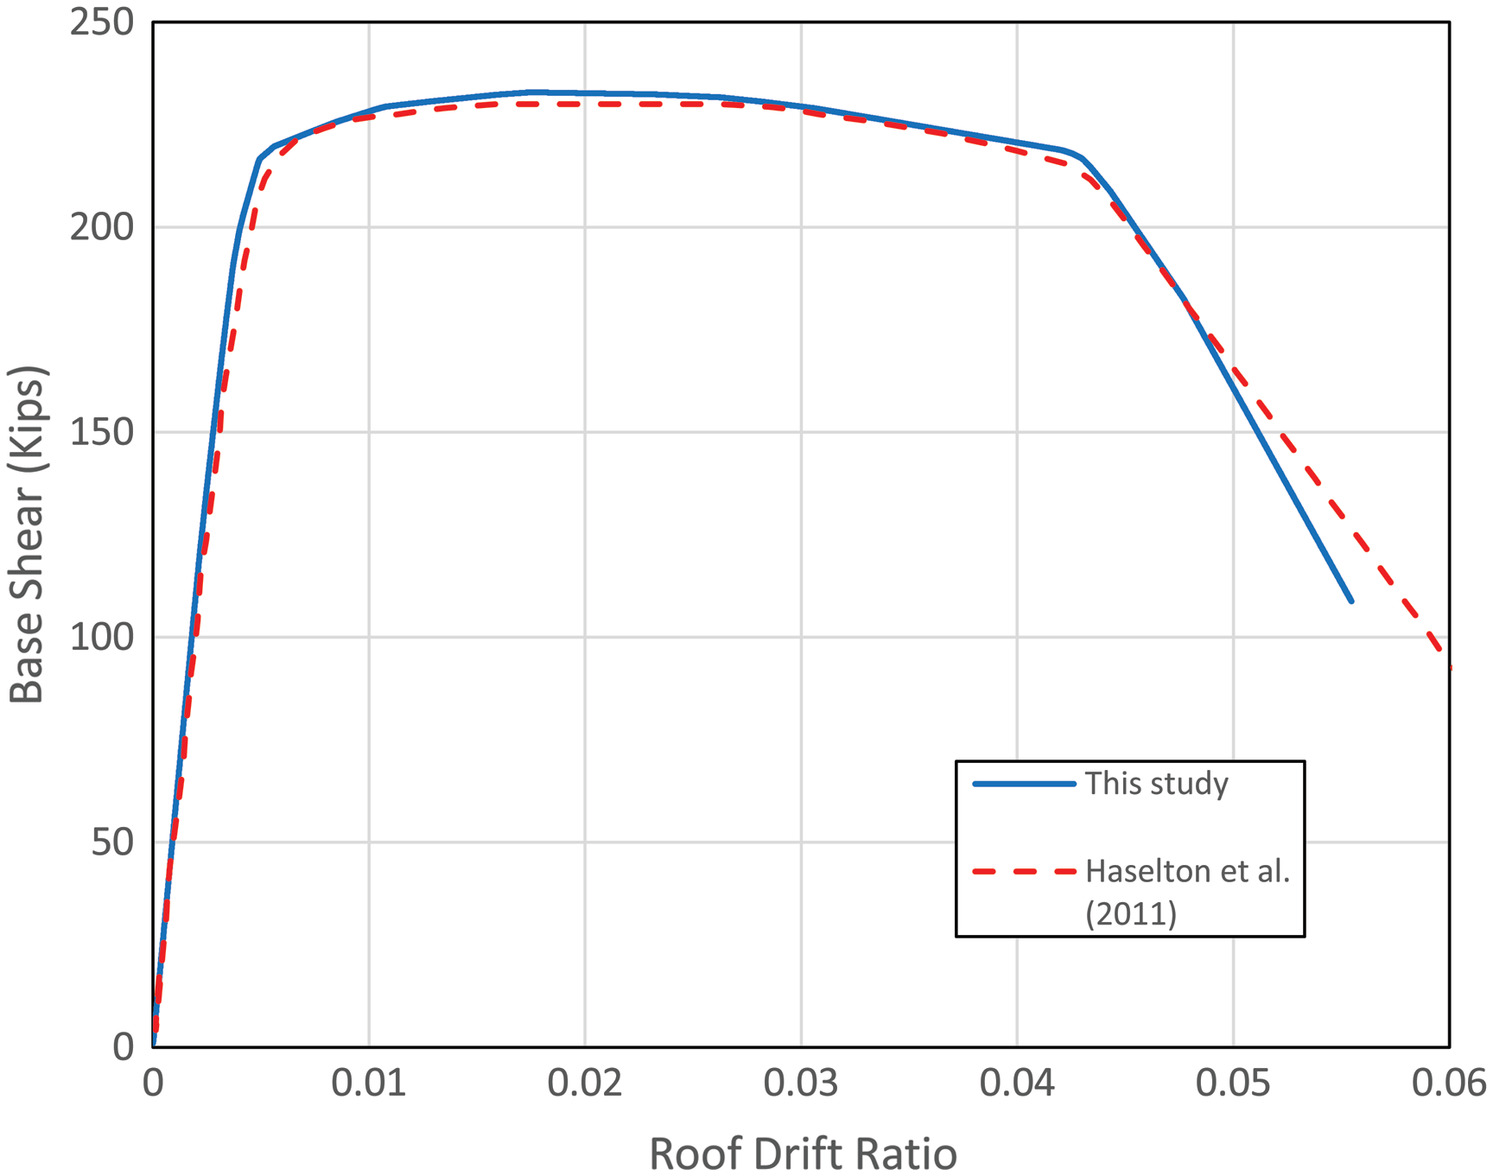
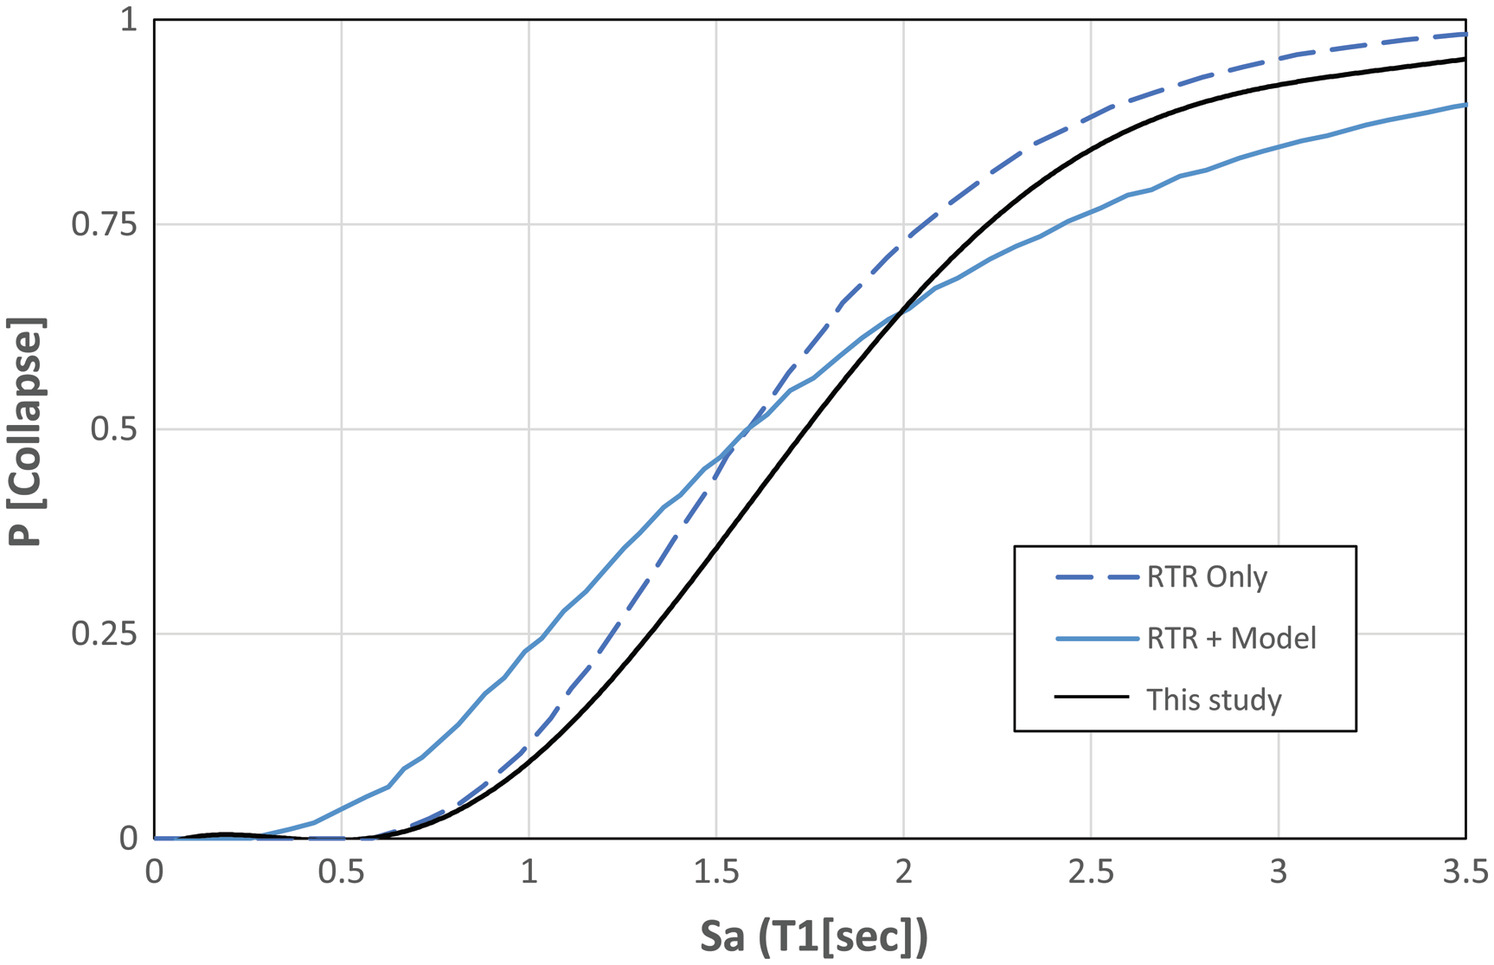
Fig. 6 shows the scalar earthquake fragility function for the complete damage state, derived using the Multiple-Stripe Analysis (MSA) procedure and uncertainty modeling outlined later in this paper, depicted by a black line. The dashed blue curve illustrates the fragility findings of Haselton et al. (2011), considering the record-to-record (RTR) variability in earthquake motions. Furthermore, another fragility curve by Haselton et al. (2011) is shown with a solid blue line, integrating both the RTR variability and the structural uncertainties present in the finite element (FE) modeling process. Observations from Fig. 6 reveal a general alignment between these earthquake fragility curves. However, noticeable differences exist in certain segments, likely attributable to the varying assumptions and methodologies employed in their development. While the fragility curves in this study are derived from the MSA method and MC simulations, Haselton et al. (2011) based their earthquake fragility assessment on IDA and the concept of dynamic instability. These kinds of disparities in approach and results have been noted and discussed in other studies (Baker 2015; Pang and Wang 2021), highlighting the diverse methodologies and interpretations within this field of research.
Nonlinear verification procedures were uniformly applied across all structural models of the archetypes in this study, ensuring consistency across various typologies. Refer to Table 1 for details on structural geometry, design methodologies, and eigenvalues of archetypes.
To enable the formation of VH tsunami load profiles in the second phase of the successive analysis procedure, columns on the seaward side of the structure were divided into six segments at each story. This allows the tsunami loading profile to evolve vertically through the segments of each discretized element. These columns are expected to be subjected to relatively large shear demand from the tsunami flow. However, the presented modeling procedure explained herein fails to account for the direct shear failure of these columns during the analysis. To address this limitation, the shear demands of the seaward columns are checked against the computed shear capacity through a post-processing procedure, as discussed earlier in this paper. Specifically, if the peak drift ratio in one analysis realization is less than the predefined damage state, but shear demand in one or more columns exceeds the pertinent shear capacity, the entire analysis would be interpreted as a failed case. Table 2 provides detailed acceptance criteria for various building damage states, with PIDRs for DS1 to DS3 sourced from HAZUS. Importantly, the criterion for DS3 centers on the collapse potential of seaward columns, which is used to define the column shear failure (CSF) performance metric. It should also be mentioned that the modeling procedure explained herein does not consider the contribution of infill walls in the structural response, particularly under sequential seismic loadings. This omission represents a limitation of the study, as infill walls may influence the seismic performance of the structure, and their damage could also impact the forces induced by the tsunami. Therefore, the numerical simulation considers primarily the sideways collapse mode of the system, with an acknowledgment of the need for future research to comprehensively address the role of infills in this context.
| Structure ID | Hazard | EDPs | DS1 | DS2 | DS3 |
|---|---|---|---|---|---|
| RC1 | Earthquake | PIDR (%) | 0.9% | 2.3% | 6% |
| Tsunami | PIDR (%) + CSF | 0.9% | 2.3% | 6% or CSF | |
| RC2 | Earthquake | PIDR (%) | 0.9% | 2.3% | 6% |
| Tsunami | PIDR (%) + CSF | 0.9% | 2.3% | 6% or CSF | |
| RC3 | Earthquake | PIDR (%) | 0.9% | 2.3% | 6% |
| Tsunami | PIDR (%) + CSF | 0.9% | 2.3% | 6% or CSF | |
| RC4 | Earthquake | PIDR (%) | 0.6% | 1.5% | 3.96% |
| Tsunami | PIDR (%) + CSF | 0.6% | 1.5% | 3.96% or CSF | |
| RC5 | Earthquake | PIDR (%) | 0.9% | 2.3% | 6% |
| Tsunami | PIDR (%) + CSF | 0.9% | 2.3% | 6% or CSF | |
| RC6 | Earthquake | PIDR (%) | 0.45% | 1.15% | 3% |
| Tsunami | PIDR (%) + CSF | 0.45% | 1.15% | 3% or CSF | |
| RC7 | Earthquake | PIDR (%) | 0.4% | 1% | 2.5% |
| Tsunami | PIDR (%) + CSF | 0.4% | 1% | 2.5% or CSF | |
| RC8 | Earthquake | PIDR (%) | 0.53% | 1.32% | 3.3% |
| Tsunami | PIDR (%) + CSF | 0.53% | 1.32% | 3.3% or CSF | |
| RC9 | Earthquake | PIDR (%) | 0.8% | 2% | 5% |
| Tsunami | PIDR (%) + CSF | 0.8% | 2% | 5% or CSF | |
| RC10 | Earthquake | PIDR (%) | 0.8% | 2% | 5% |
| Tsunami | PIDR (%) + CSF | 0.8% | 2% | 5% or CSF |
Ground Motion Selection
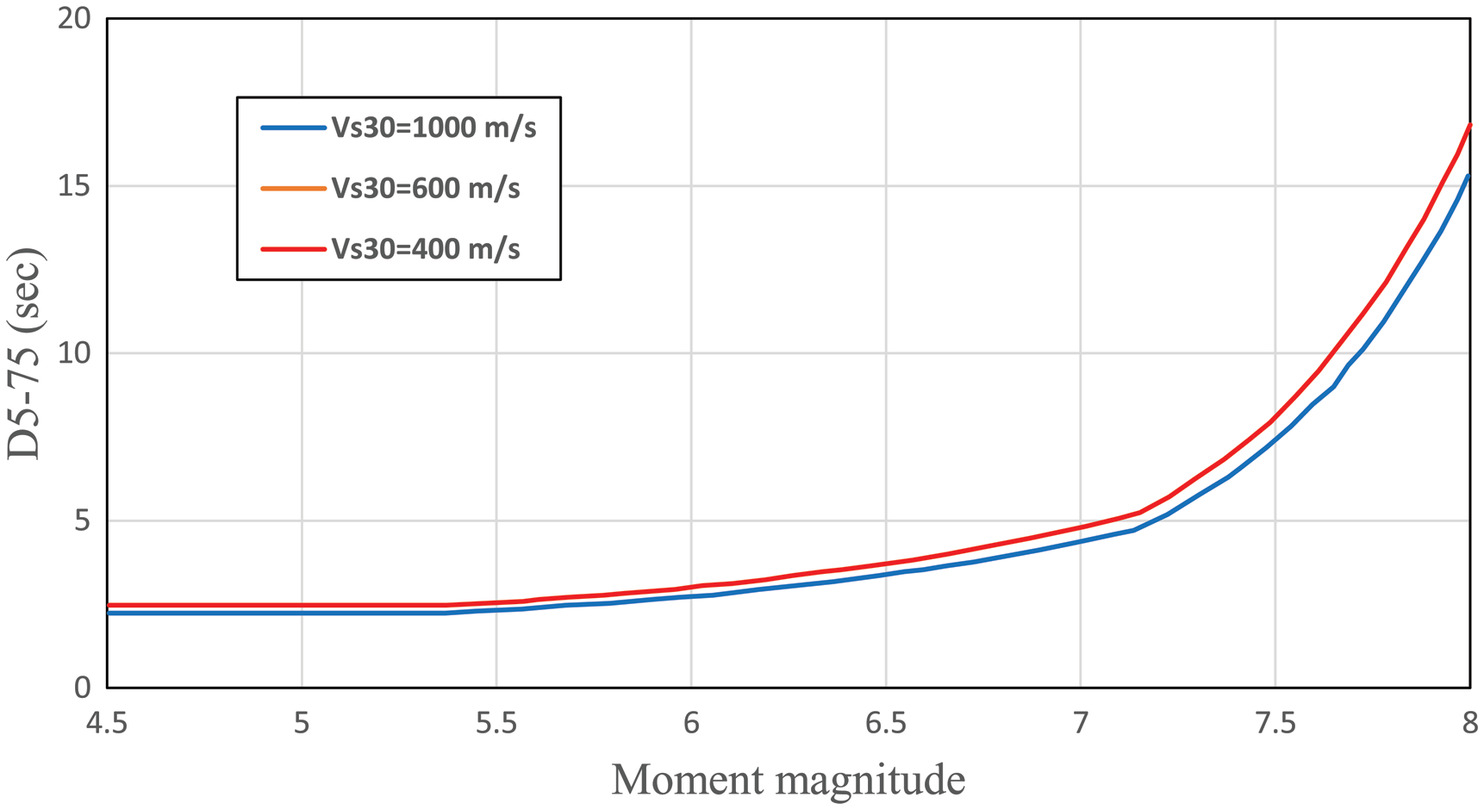
As previously discussed, earthquakes with large moment magnitudes can generate tsunamis when they occur in seas or oceans. As illustrated in Fig. 7, produced through millions of GM simulations by using the relationship developed by Mashayekhi et al. (2020), earthquakes with longer motion durations can contribute to such multihazard events triggered by source earthquakes with larger moment magnitudes. Fig. 7 shows that the median value of strong motion durations of earthquakes varies exponentially with their moment magnitude in different soil types, indicating that larger significant durations (i.e., D5-75) should be expected from earthquakes with larger moment magnitudes. Therefore, selecting source earthquakes with long motion durations appears to be a more rational approach for numerical simulations of fragility functions in multi-hazard events, such as tsunamis. In this study, two different GM suits were selected: long-duration earthquakes and regular-duration earthquakes.
In this study, a set of synthetic GMs (referred to as the M9 Project records hereafter) generated for a variety of earthquake rupture scenarios on the Cascadia subduction zone (megathrust) approaching magnitude 9.0 have been chosen specifically for long-duration earthquakes (Frankel et al. 2018). For regular-duration earthquakes, the far-field ground motions recommended by FEMA P-695 (FEMA 2011) have also been selected as the reference earthquake motions in this investigation.
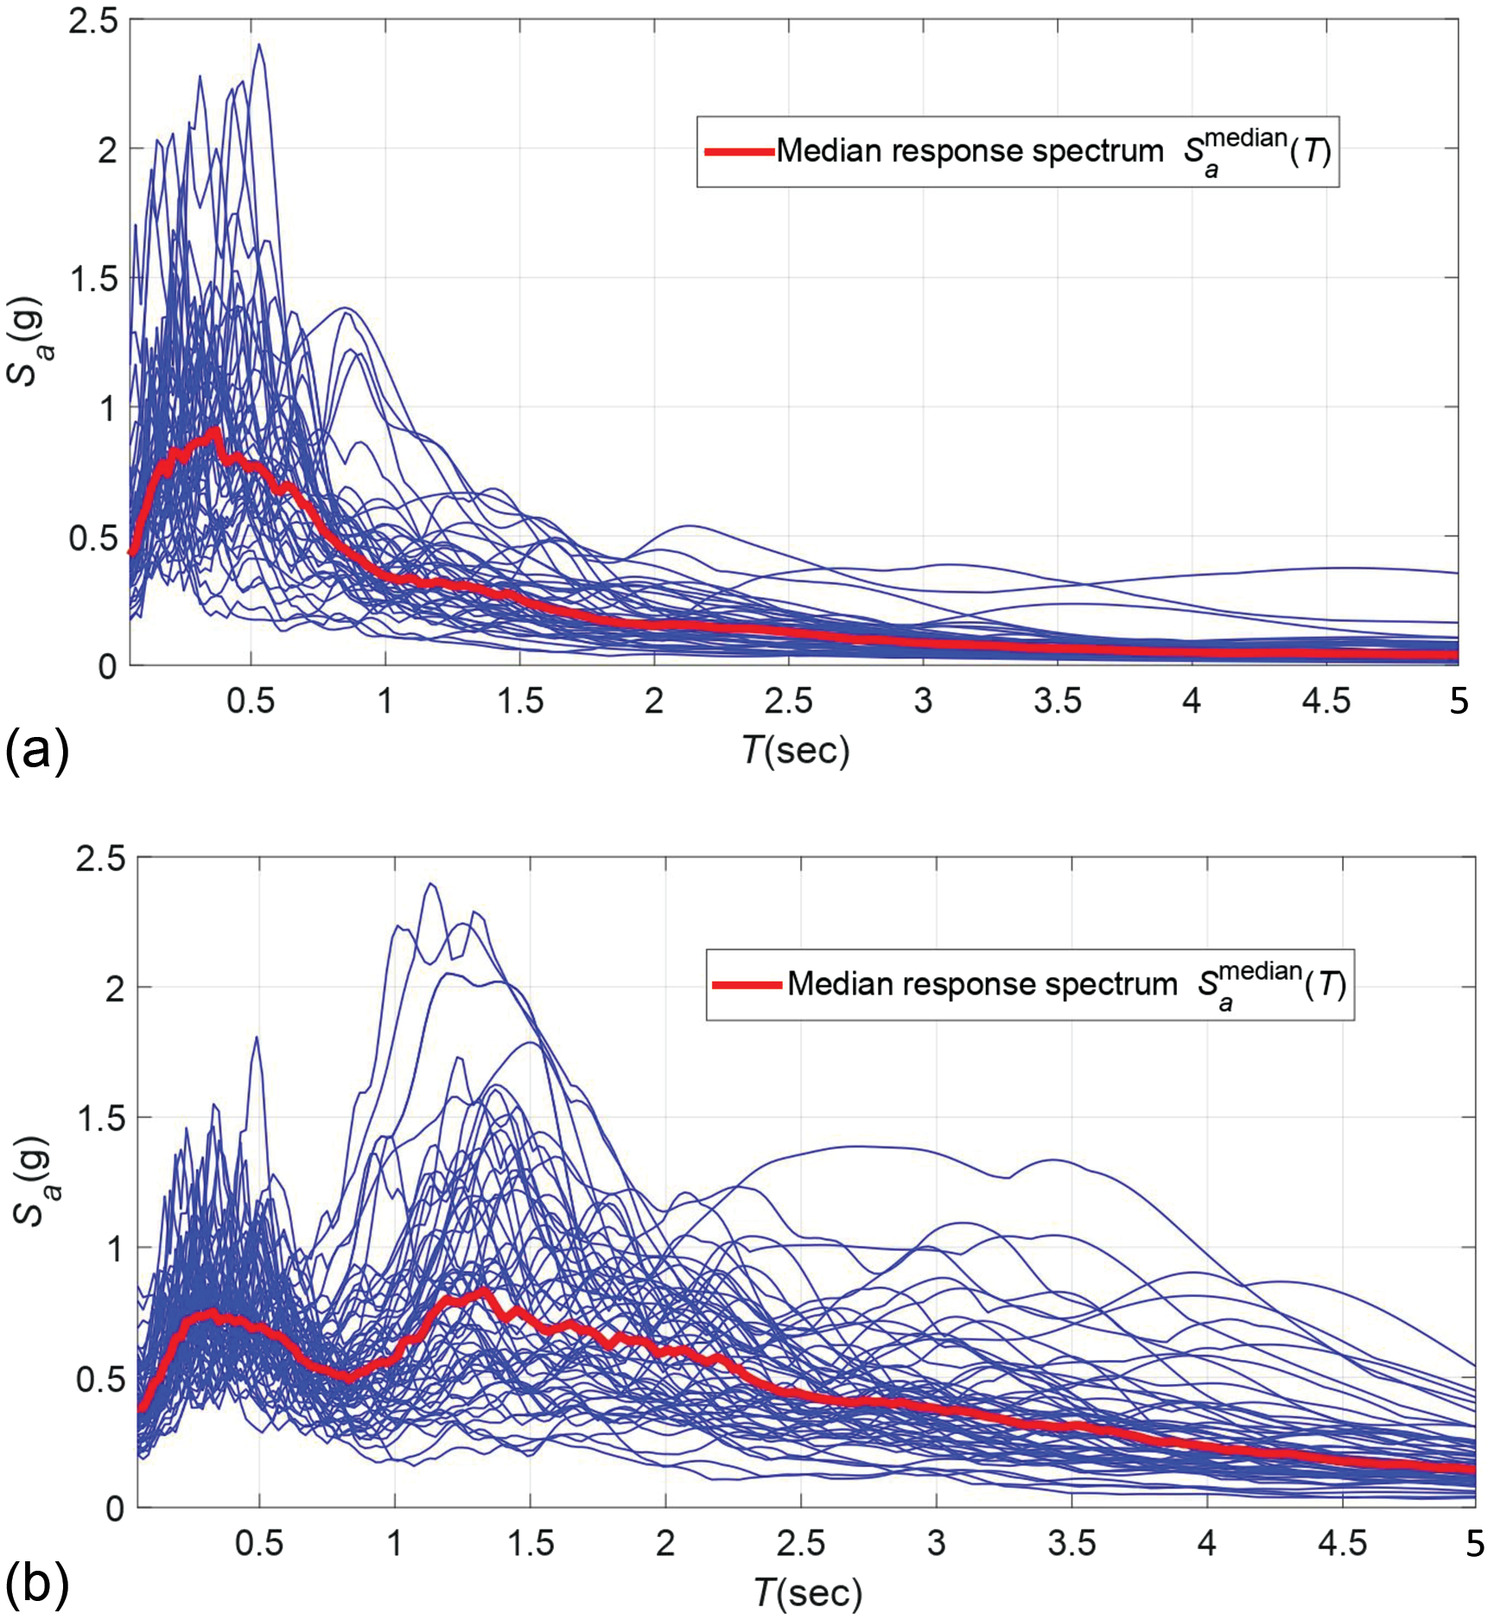
Spectral matching techniques (Hancock and Bommer 2007; Harati et al. 2021) were not implemented for GM records in this study to avoid altering earthquake time series to match a predefined response spectrum. It is important to recognize that response spectra are not the only critical intensity measure of earthquakes. Modifying earthquake records to conform to a single response spectrum can inadvertently affect other vital earthquake characteristics, such as frequency content and the displacement and velocity time series of ground motions (Harati et al. 2021). Other investigations (Chandramohan et al. 2016; Hancock and Bommer 2007; Harati et al. 2019) aimed to separate strong motion duration from other earthquake characteristics to determine its independent effect on structural damage. As noted by Mashayekhi et al. (2019), amplitude-based earthquake parameters (like PGA or SA) and strong motion duration (e.g., D5-75) are interrelated. Separating the duration component can alter the earthquake’s frequency content and modify the amplitude-based characteristics. Isolating the duration allows for assessing its sole impact on structural response metrics. However, this approach alters the final outcome, such as fragility functions. These modified vulnerability functions, having adjusted GMs in terms of frequency content and amplitude-based parameters, may not be reliable for use in risk and community resilience analysis due to potential inaccuracies in representing real earthquake characteristics. Fig. 8 presents the earthquake response spectra for the selected ground motions.
Two distinct categories for earthquake selection were utilized in this study: ground motions with long duration (M9 Project) and those with regular duration (FEMA P-695). In other words, the study investigates the impact of long-duration earthquakes (not the duration parameter of these motions) with their duration-based and amplitude-based characteristics against a set of regular-duration motions (and keeping all of its parameters) being employed as a reference GM set for developing fragility functions in the western United States. The normalized AI plots for the two selected GM suites are shown in Fig. 9, revealing two distinct patterns of input earthquake energy between the GMs from FEMA P-695 and the M9 Project.
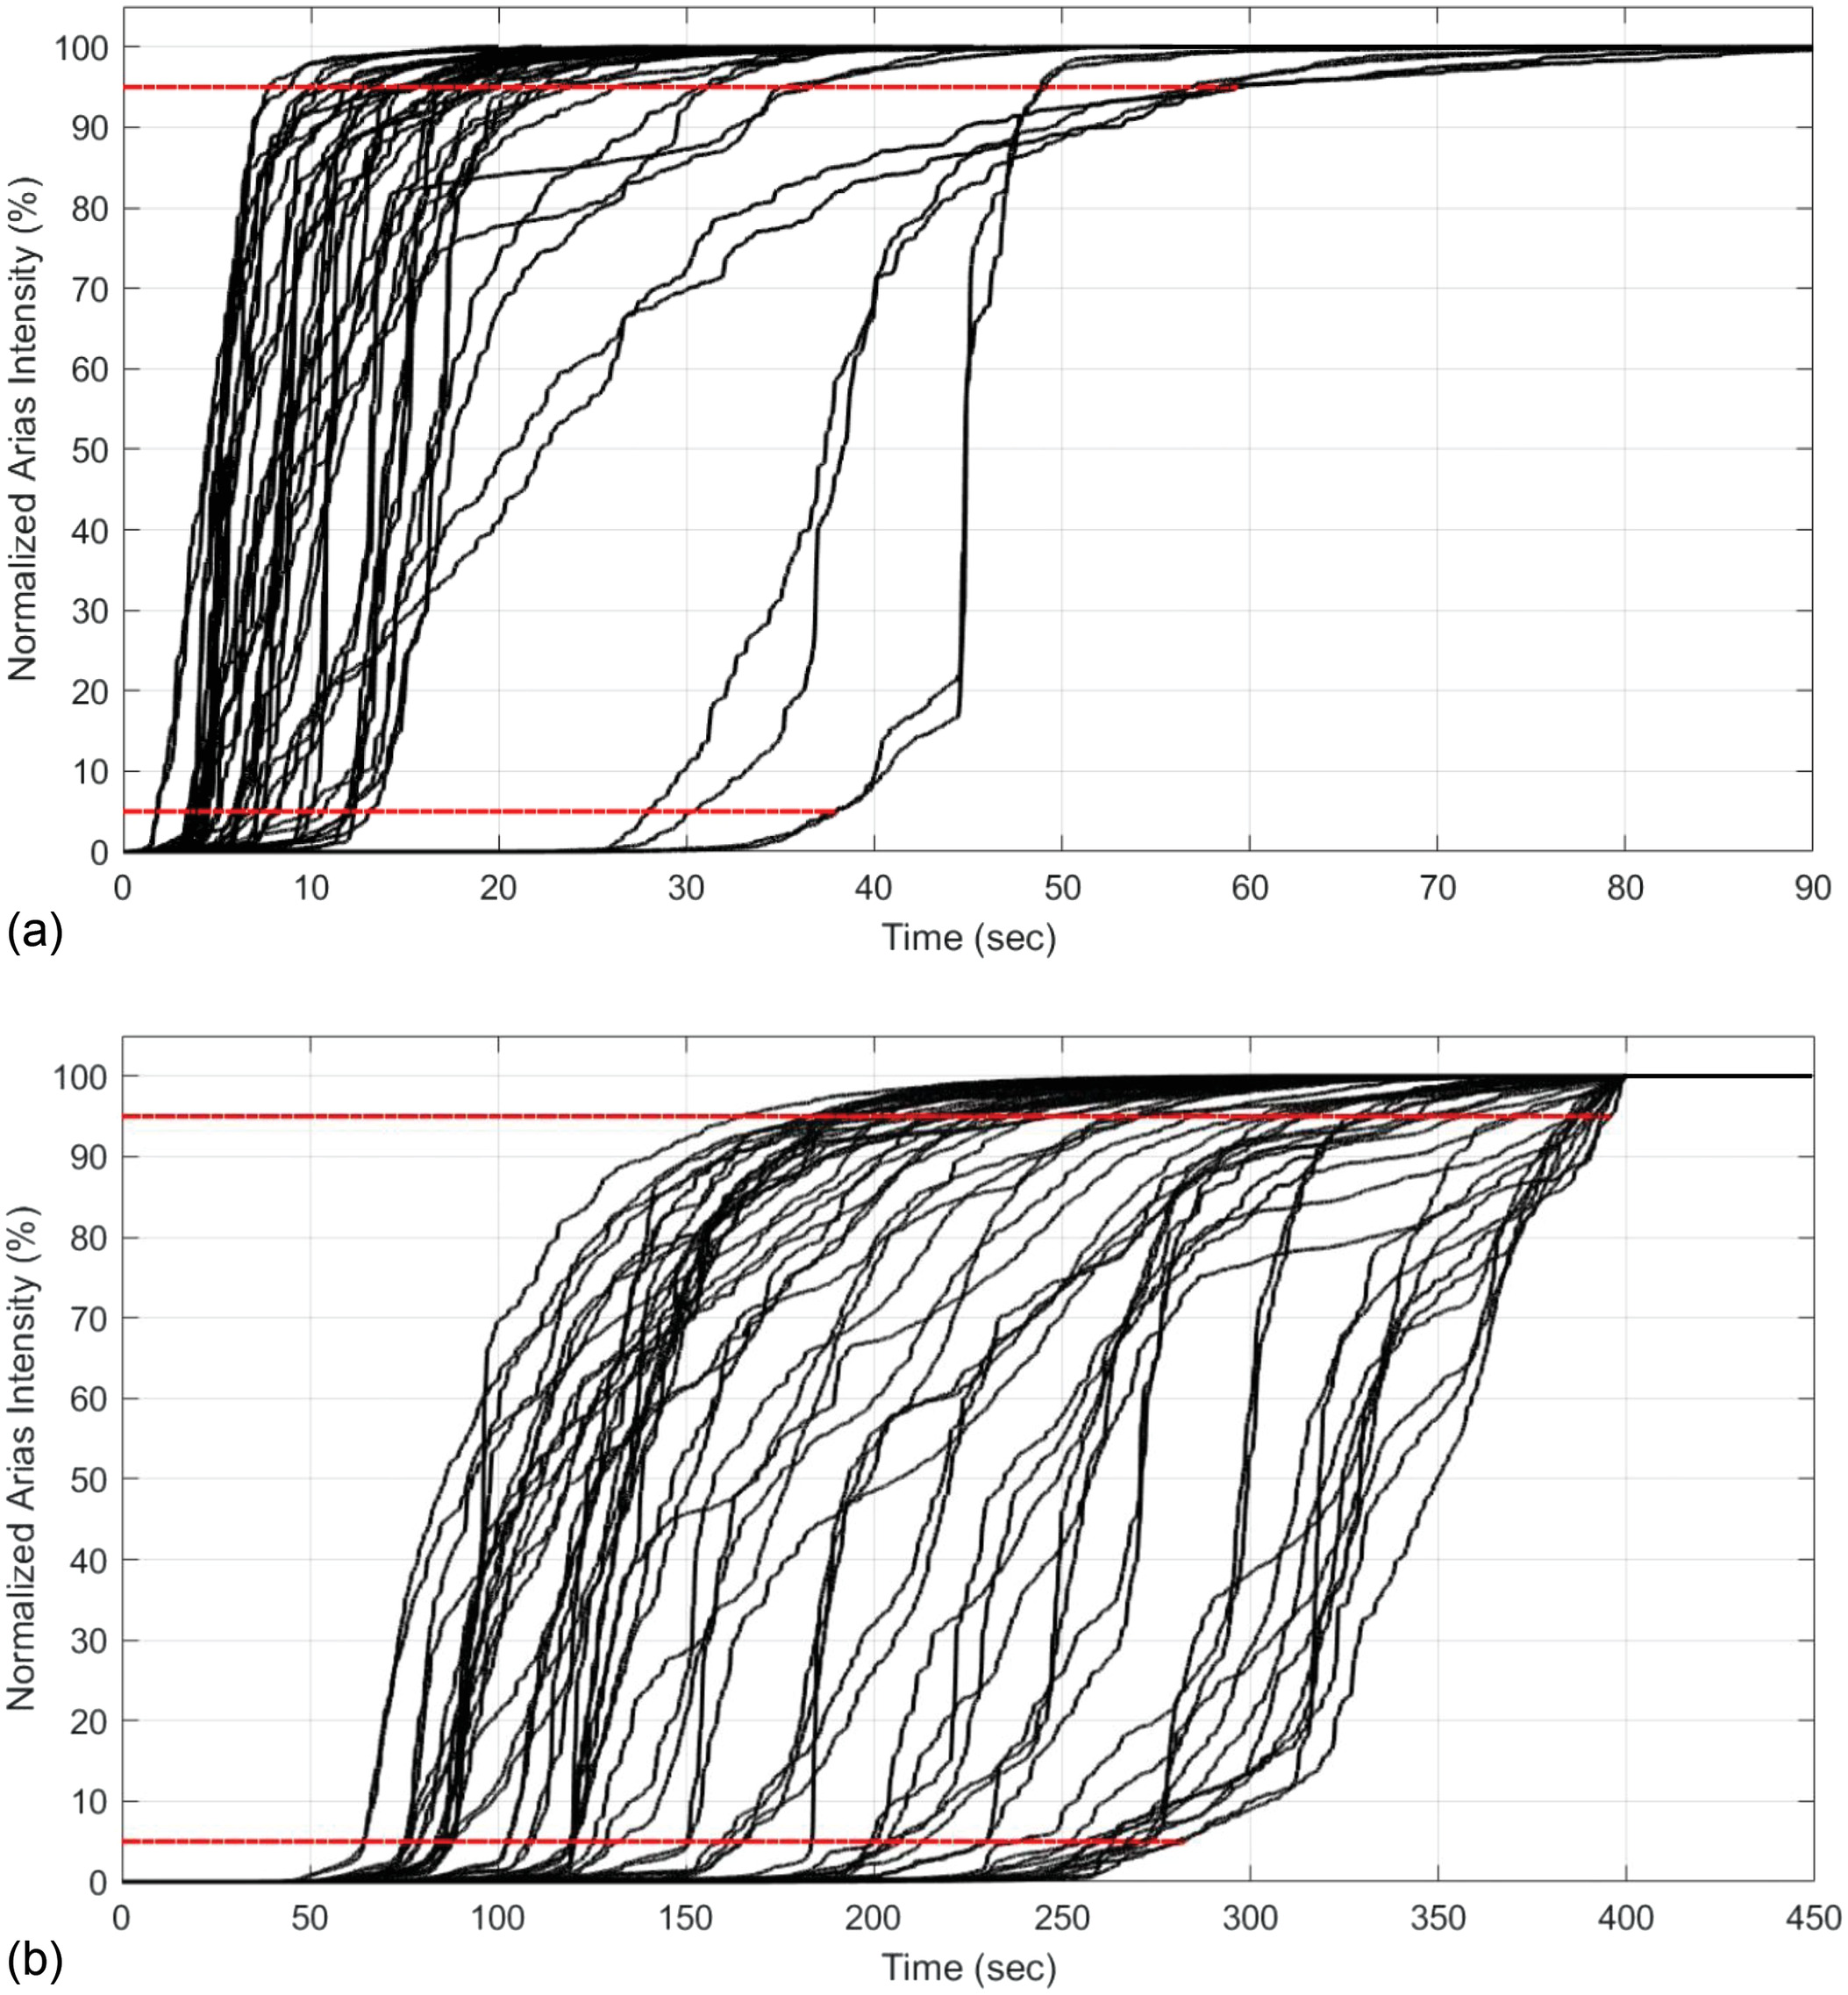
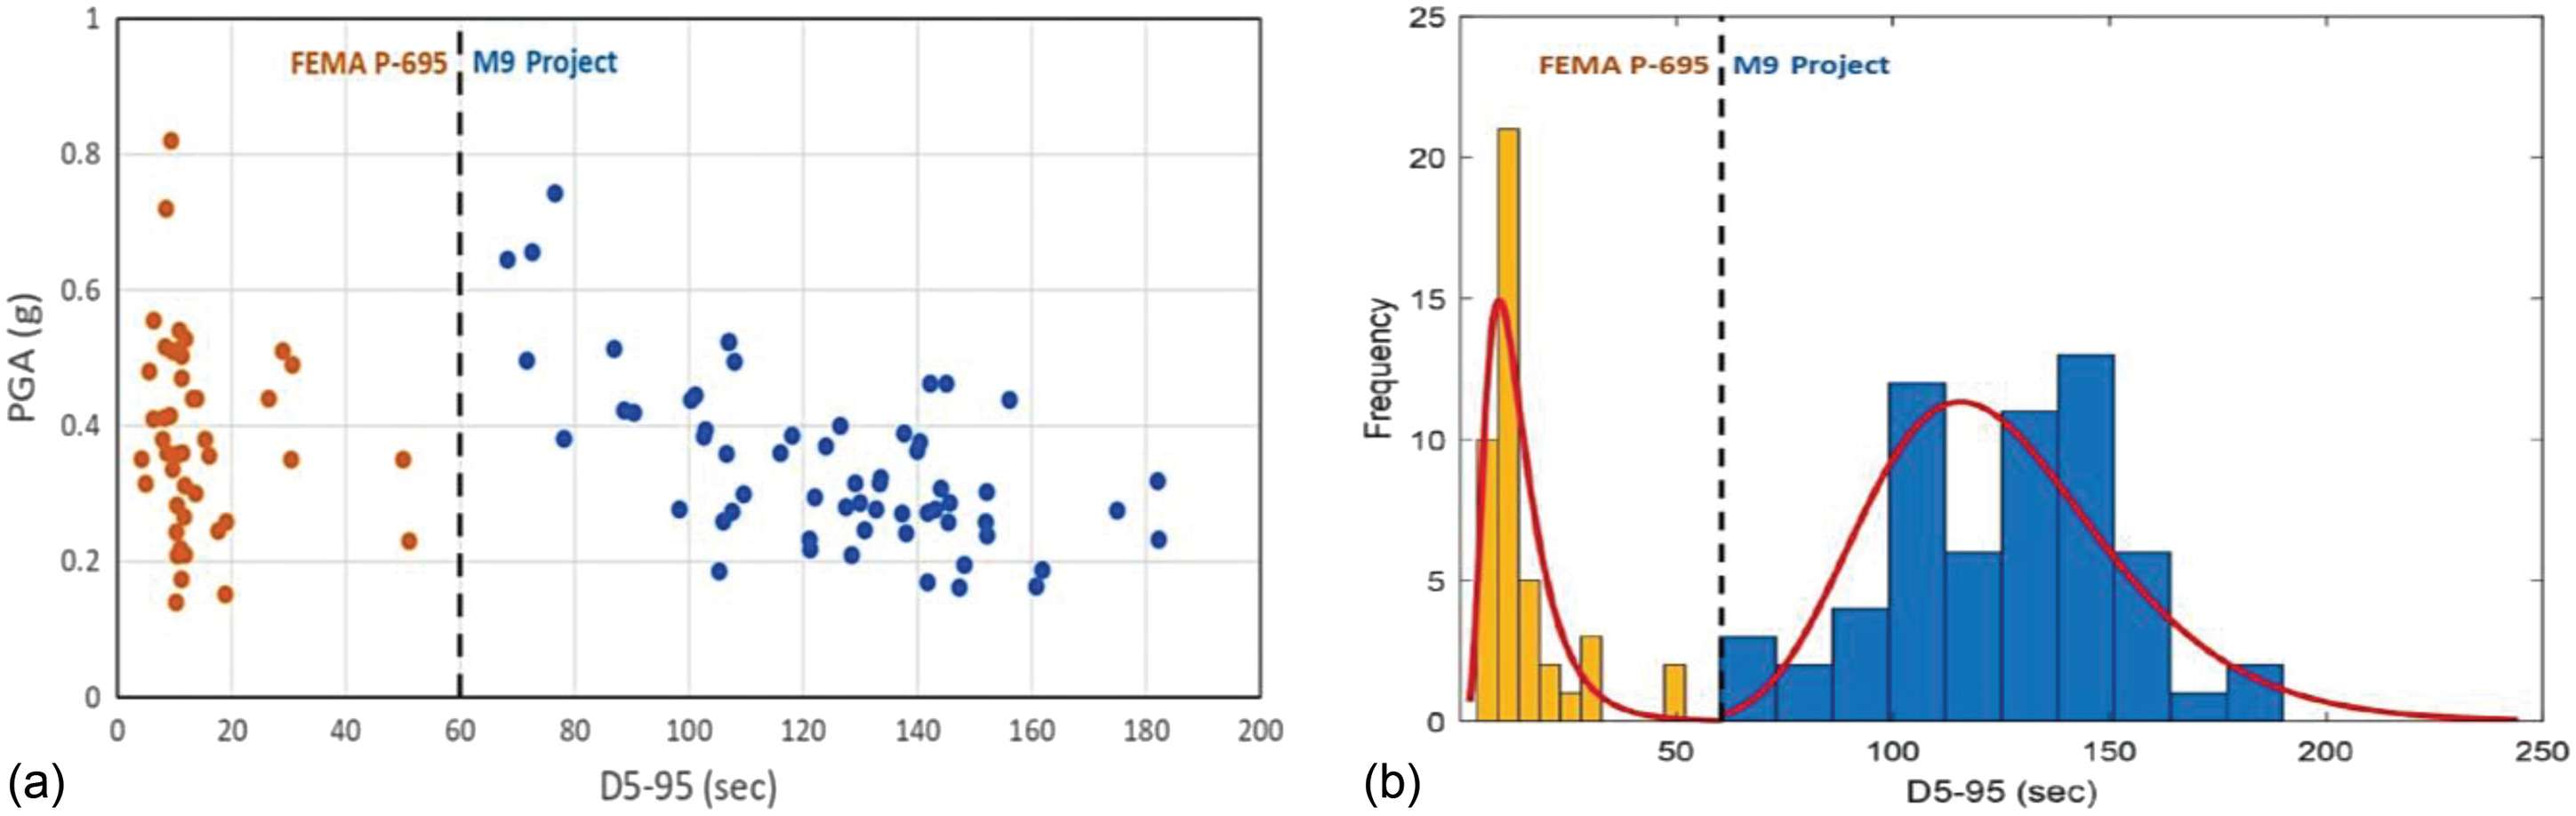
Fig. 10(b) presents a scatter plot illustrating the relationship between significant durations (D5-95) and the PGA values of the records in both GM sets (long and non-long suits) selected for this study. It is clear from both Figs. 10(a and b) that these two record sets are distinctly separated in the vicinity of the D5-95 equal to 60 s, through inspection of the fitted lognormal distributions for their data in Fig. 10(b).
Methodology
This study uses the methodology proposed by Harati and van de Lindt (2024) to develop earthquake-tsunami fragility surfaces for representative RC frame archetypes exposed to long-duration earthquakes and subsequent tsunami loading. A two-phase, probabilistic successive analysis approach, grounded in the Monte Carlo simulation (MCS), is used to determine joint failure probabilities for specific damage states, represented as discrete data points. Initially, MCS selects and scales a GM based on a joint IM, where the spectral acceleration (Sai) serves as the earthquake IM. The method involves generating uncertain parameters for both the FE nonlinear structural model and the calculation of equivalent tsunami forces. The FE integrates random variables, including those relevant to the development of plastic hinges, dead and live loads, damping ratios, and beam-column joint modeling, as indicated in Table 3. This uncertainty propagation ensures a realistic representation of structural behavior under varying conditions. Alam et al. (2018) and Attary et al. (2021) identified two primary variables for the equivalent tsunami force calculation, which are probabilistically modeled using uniform distribution as specified in Table 3.
| Random variable | Distribution type | Mean | COV | Reference(s) |
|---|---|---|---|---|
| Dead load and seismic mass | Lognormal | 1.05 × (computed) | 0.1 | Ellingwood (1980) |
| Damping ratio | Lognormal | 0.065 | 0.60 | Porter et al. (2002) |
| Element initial stiffness | Lognormal | 1.0 × (computed) | 0.36 | Fardis and Biskinis (2003) |
| Plastic rotation capacity | Lognormal | 1.0 × (computed) | 0.60 | Panagiotakos and Fardis (2001) |
| Post-capping stiffness | Log-normal | 0.08 × (-Kelastic) | 0.60 | Ibarra and Krawinkler (2005) |
| Column footing rotational stiffness | Lognormal | 1.0 × (computed) | 0.3 | Haselton et al. (2008) |
| Joint shear strength | Lognormal | 1.40 | 0.1 | Altoontash (2004) |
| Uniform (0.35–1) | — | — | Alam et al. (2018) | |
| Uniform (1.25–2) | — | — | Attary et al. (2021) | |
| Element strength | Lognormal | 1.0 × (computed) | 0.12 | Panagiotakos and Fardis (2001) |
| Element hardening stiffness | Lognormal | 0.5 × (computed) | 0.50 | Wang et al. (1978) |
Source: Data from Harati and van de Lindt (2024).
Next, a nonlinear structural model is developed using the distribution functions from Table 3, and the equivalent tsunami force is calculated using Eq. (3). This equation considers random variables and , along with the momentum flux (MFi)—the tsunami IM in this study. The bay length (B) in Eq. (3) is constant, representing the structural system’s bay length perpendicular to the 2D building model. The fluid density parameter , accounting for water density with sediments in tsunami scenarios, is conservatively set at (Hashimoto et al. 2023). The uncertainty in parameters like inundation depth () and velocity () in Eq. (3) is incorporated in the second phase of the simulation. The algorithm calculates flow velocity from MFi and checks the Froude number (Fr) to ensure velocity is within acceptable limits (). If Fr is ≤ 2, the algorithm calculates the equivalent tsunami force for creating a lateral tsunami load profile. Successive analyses incrementally increase the tsunami flow depth (), starting from zero or the water depth above the foundation, up to the building’s maximum height (). The flow depth’s initial and increment values are based on the columns’ discretization on the seaward side at each story, resulting in various VH profiles with different tsunami flow depths but identical MFi values.
After the successive analyses, the EDPs from both phases are compared against predefined damage states. Failure is declared for any MCS realization where the structure does not meet the damage state under the hazard scenario. Acceptance criteria for different building damage states are outlined in Table 2. To obtain a near-continuous function that governs the earthquake-tsunami fragility surface, a surface fitting procedure is performed on discrete data points of the joint failure probabilities. In this framework, surface fitting is carried out using an equation suggested by Kern et al. (2004)where the parameter , along with the tuning parameters , , , and for the fragility surface over each desired damage state, were optimized using a nonlinear least squares (NLS) method. While Kern et al. (2004) found the value of to be 1.01, in this study, is also treated as a target variable for optimization, along with , , , and . This approach results in five parameters being optimized to define the fragility surface. The NLS method was selected for its effectiveness in aligning model parameters with observed data, aiming to minimize the sum of squared differences between observed fragility data and the predictions of the model. This involved iterative adjustment of the parameter values, starting from initial estimates, to ensure the most accurate fit and minimize discrepancies.
(4)
Furthermore, a comprehensive sensitivity analysis was conducted to evaluate the impact of various optimization algorithms on the NLS problem. This included a systematic comparison of the Levenberg-Marquardt, Nelder-Mead, BFGS, and Conjugate Gradient algorithms, under consistent initial conditions and data sets. The convergence behavior, iteration count, stability, and sensitivity to initial parameter estimates of each algorithm were closely monitored. The robustness and efficiency of these algorithms were assessed in terms of solution reliability and computational resource demands, with the process repeated under different initial parameter estimates to test each algorithm’s performance under varied conditions. The findings indicated that the Levenberg-Marquardt algorithm was most effective for the specific NLS problem at hand. Combining aspects of the Gauss-Newton algorithm and gradient descent method, it showed superior convergence speed and accuracy. Its ability to adapt between the Gauss-Newton approach and gradient descent based on the problem’s nature and the residual sum of squares was particularly beneficial, given the complexity of the fragility function. The results of the sensitivity analysis guided the selection of the Levenberg-Marquardt algorithm, ensuring precision and reliability in predicting these multidimensional fragility functions.
Meanwhile, the employed methodology can indirectly generate two independent scalar fragility functions at the boundaries of the surface, one fragility curve for earthquake hazard and the other for tsunami hazard. These scalar curves appear on the edges of the horizontal plane composed of the relevant IM axes. A repetitive optimization-based procedure is used to extract the controlling parameters of the lognormal CDF, as follows:where = variable for the discrete data points of failure probabilities for a particular hazard (earthquake or tsunami) under a specific damage state; and and = mean and standard deviation of the vector IM considered. To achieve this, a function representing the lognormal CDF is defined, and the Nelder-Mead algorithm is used to identify the optimal parameters (mean and standard deviation) that provide the best fit. This process is applied across different data sets, each representing varying earthquake-only or tsunami-only hazard scenarios, ensuring a nuanced fitting of the lognormal CDF to the extracted edge data and accurately reflecting the statistical properties. The Nelder-Mead simplex algorithm is particularly well-suited for handling nonlinear optimization problems where derivatives of the objective function are not available or difficult to compute. Recognized as a well-established technique in the realm of unconstrained optimization, the Nelder-Mead method is especially known for its application in multidimensional optimization problems. Its primary advantage in this context is its ability to navigate complex, nonlinear spaces without necessitating the gradient of the objective function. The goal of the optimization is to minimize the discrepancy between empirical data and the theoretical lognormal CDF.
(5)
The optimized parameters and , obtained through the Nelder-Mead method, can be readily utilized to reproduce the scalar fragility curves for earthquake-only or tsunami-only hazards. This precision in parameter optimization, achieved through the effective use of the Nelder-Mead algorithm, ensures a more accurate and reliable representation of the scalar fragility curves, critical for assessing structural vulnerability in single-hazard scenarios.
Fragility Surfaces for the RC Building Portfolio Subjected to Long-Duration Earthquake
The methodology outlined in this paper has been utilized to assess the earthquake-tsunami fragility surface of a 4-story ductile RC frame, which is one of the RC buildings included in this study. This is achieved by generating earthquake-tsunami fragility surfaces for the complete damage state using two different sets of GMs: the M9 Project for long-duration earthquakes, and the records from the FEMA P-695 for non-long-duration earthquakes. Fig. 11 displays the discrete data points of failure probabilities, along with the corresponding fitted surfaces for both sets of GMs.
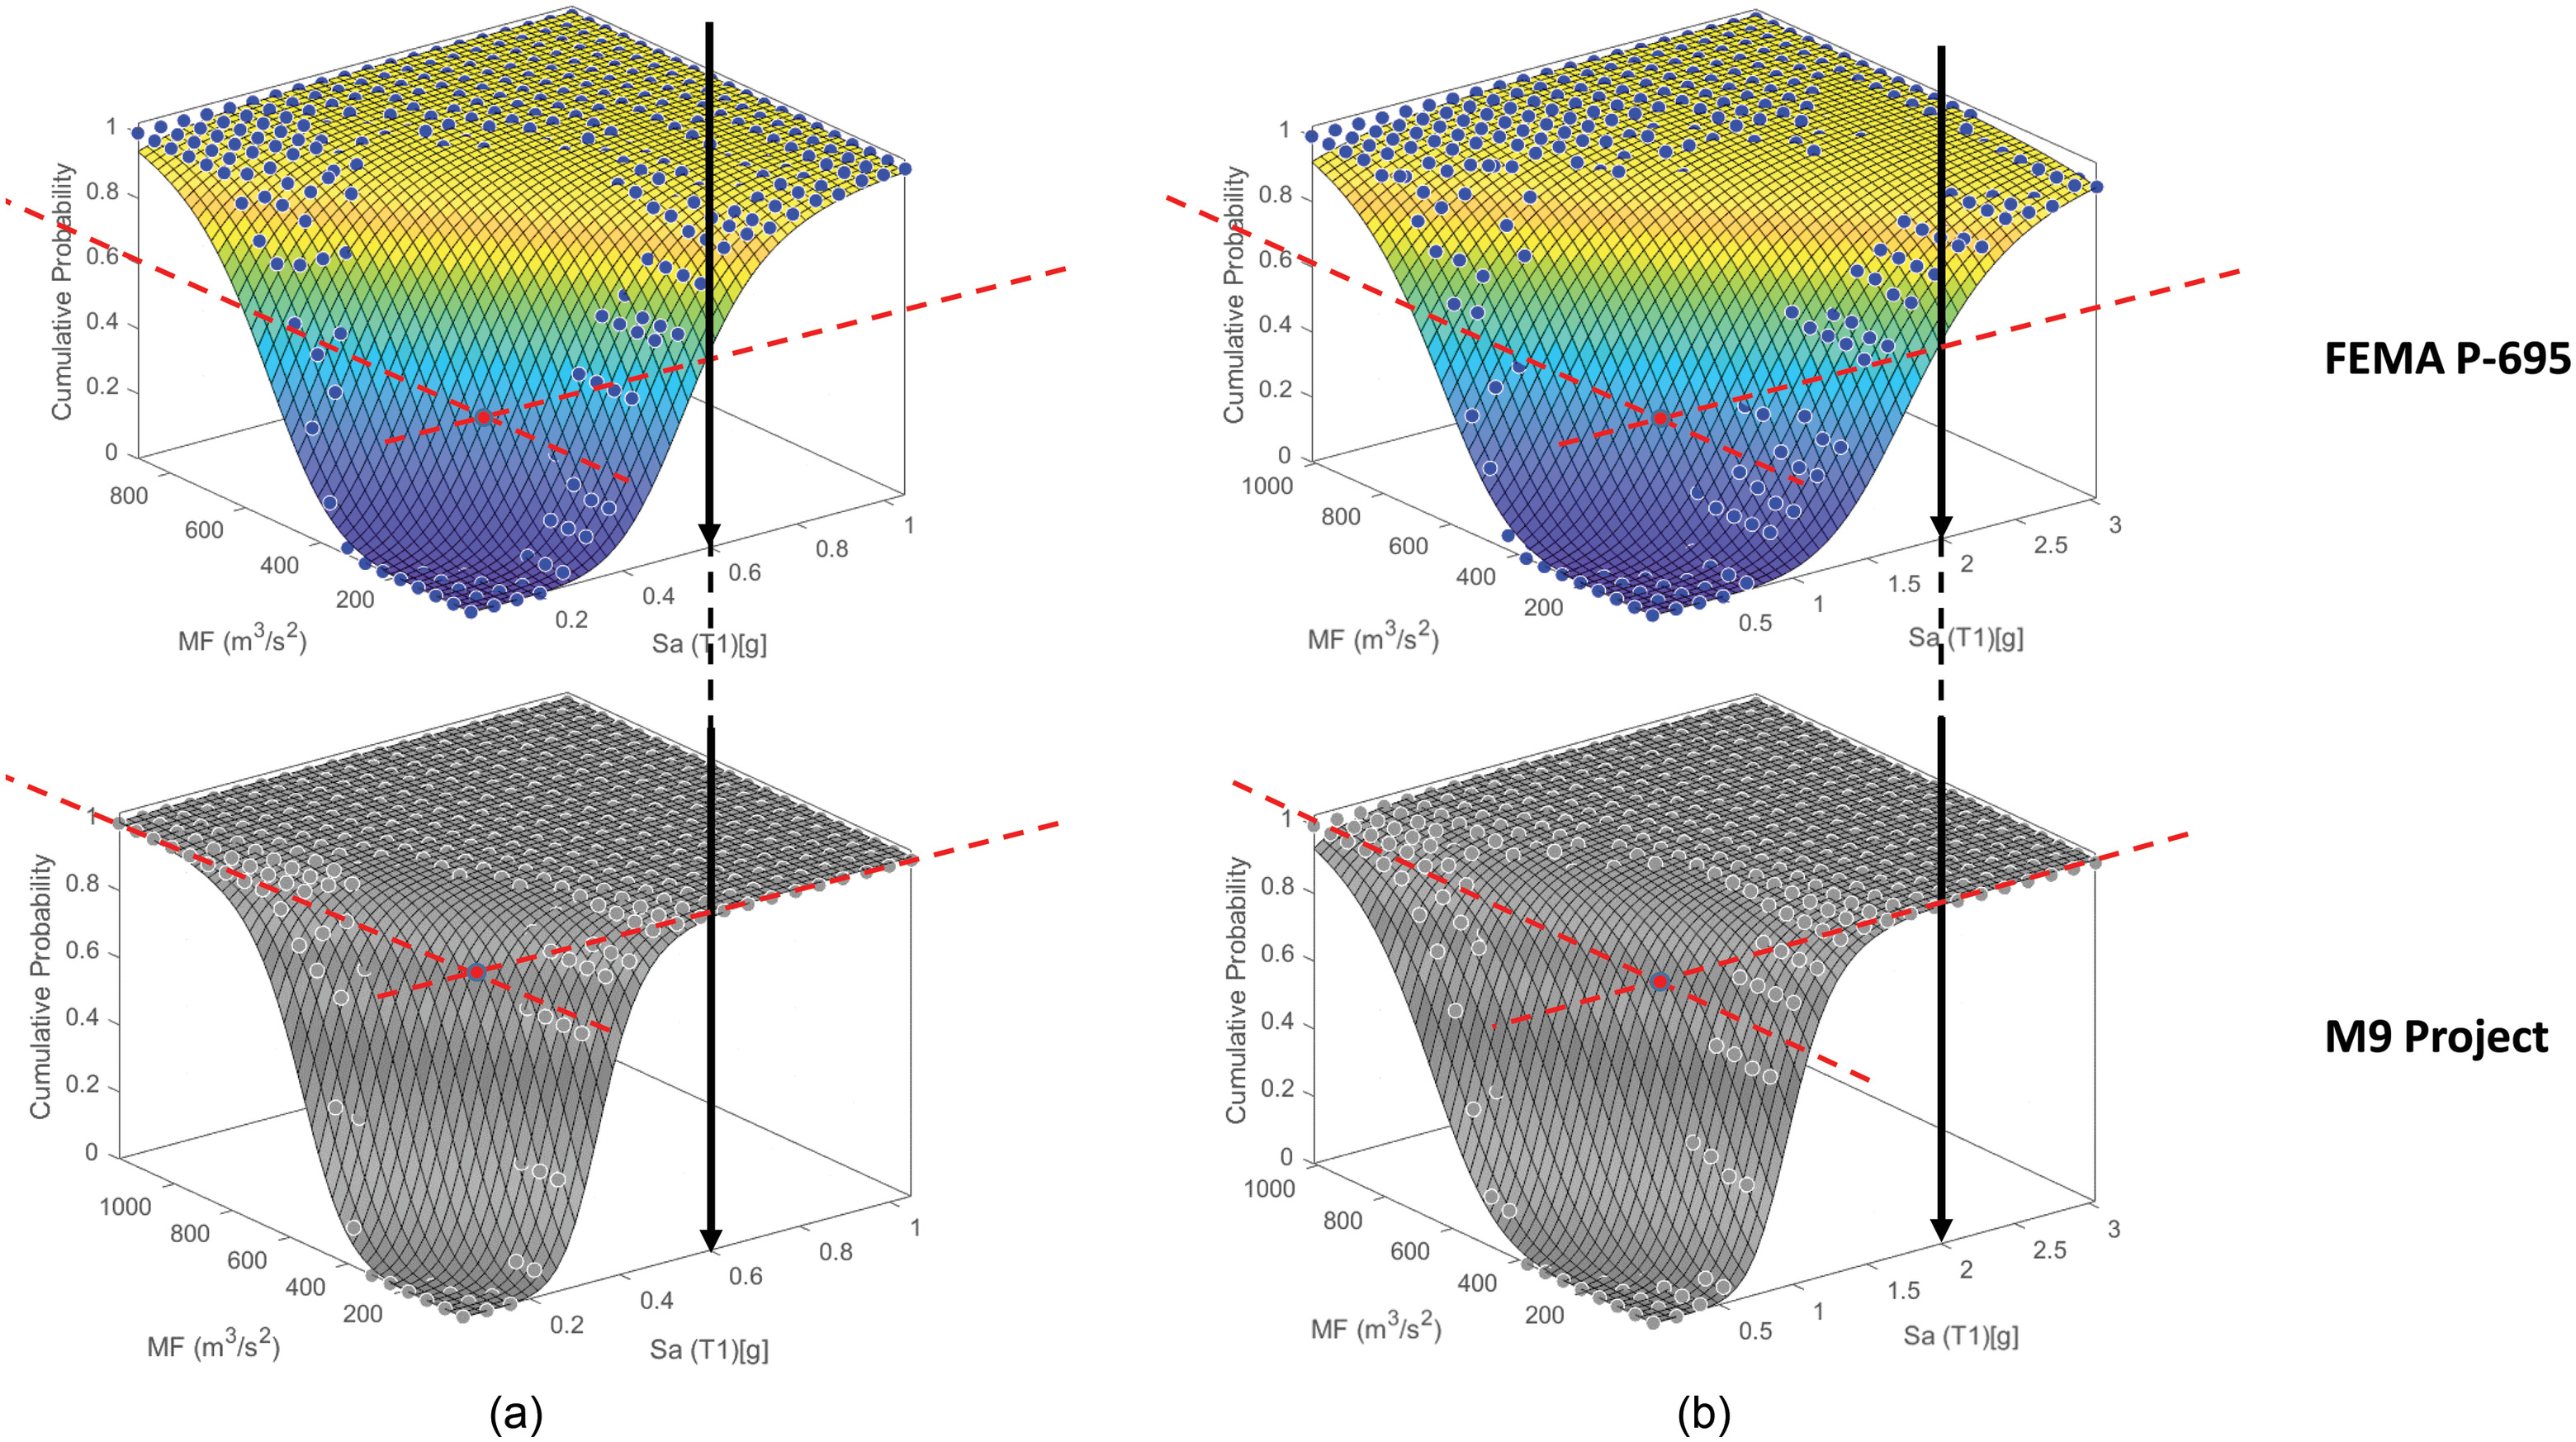
As evident from Fig. 11, the fragility surfaces obtained from the two sets of GMs for 4-story RC buildings (ductile and non-ductile frames) exhibit a noticeable difference, indicating a shift in the fragility surface toward the vertical or z-axis when derived based on the M9 Project ground motions. This shift implies a higher probability of complete damage to the structure for a given joint IM of an earthquake-tsunami event when long-duration earthquakes are selected for the simulation procedure. For example, following the vertical black line with the arrow downward in Fig. 11(b) for an of 2g in this structure, the intensity of the tsunami event would have to be very large to have an exceedance probability approaching unity when exposed to regular-duration earthquakes. However, when subjected to long-duration earthquakes, the RC frame building reaches this failure probability with any value of the tsunami IM, indicating that it collapses before facing the incoming tsunami waves simply from the long-duration earthquake. This pattern of failure is also observed for the nonductile frame (RC9) depicted in Fig. 11(a), which exhibits a higher failure probability for lower earthquake IMs compared to its ductile counterpart, highlighting the critical influence of structural ductility on seismic resilience.
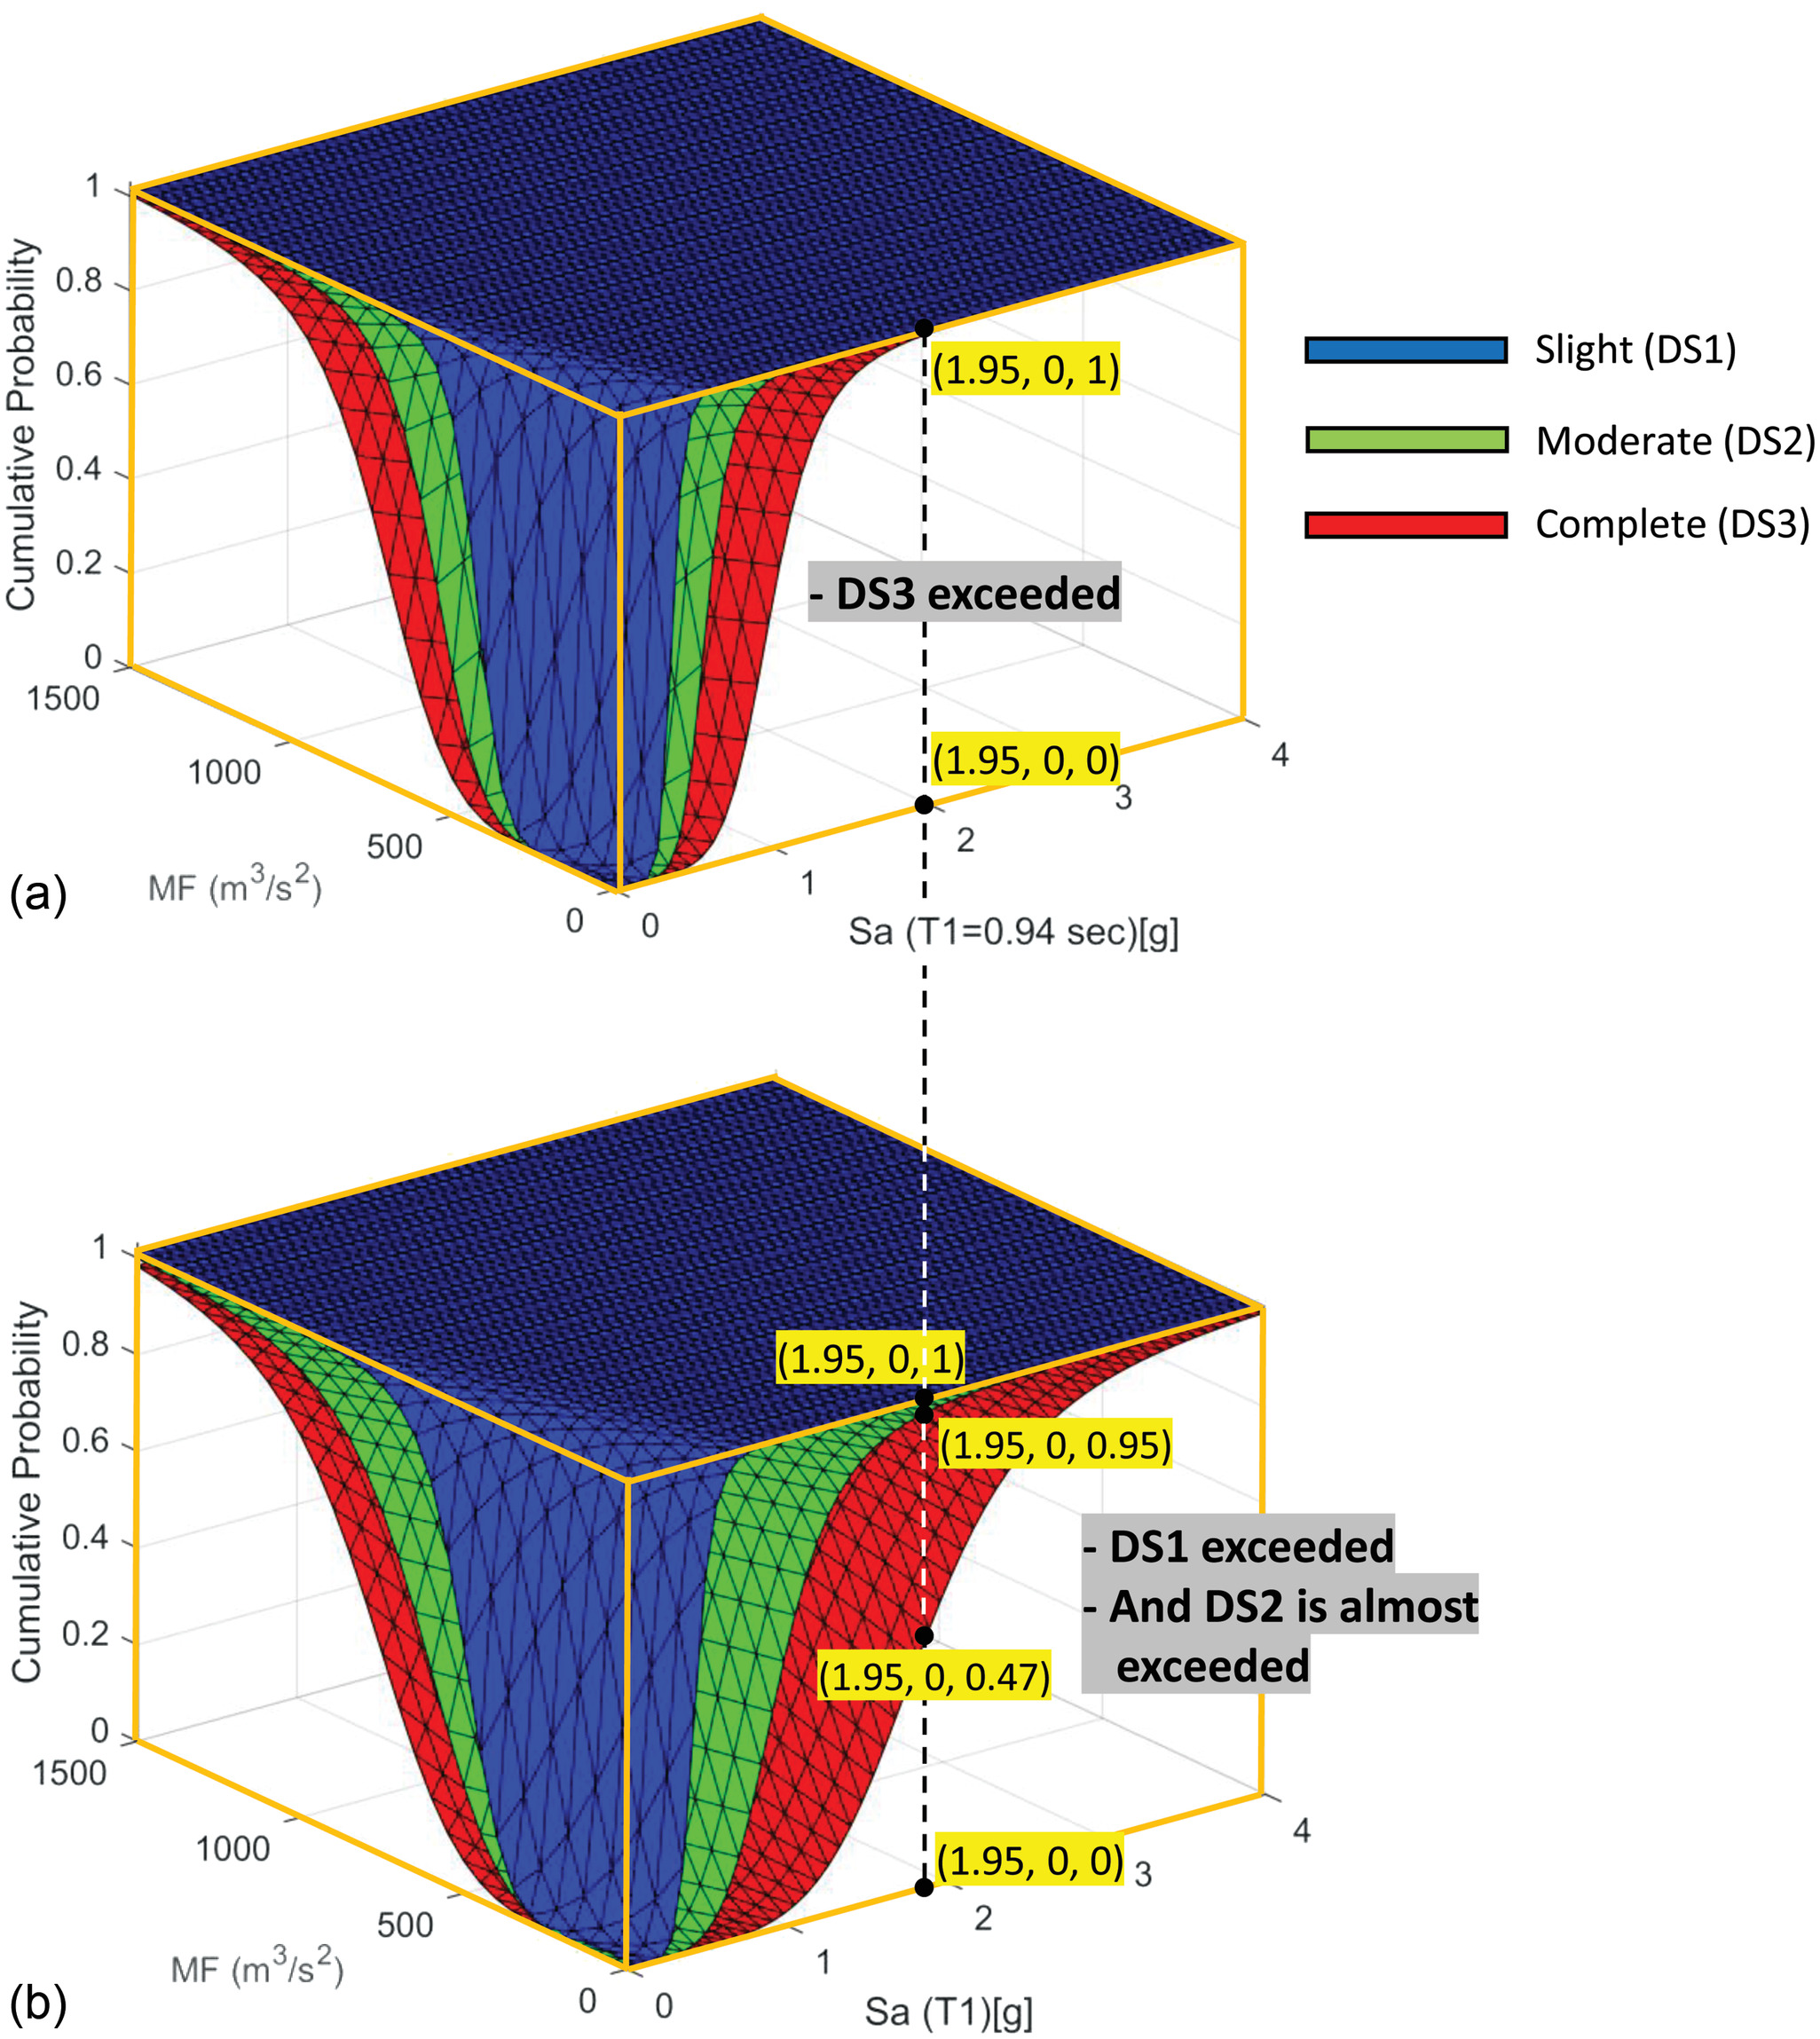
The earthquake-tsunami fragility surfaces for the 4-story RC ductile system at different considered damage states—slight, moderate, and complete—are derived for both sets of GMs selected in this study, as shown in Figs. 12(a and b). These fragility surfaces are accompanied by governing equations that enable analysts to calculate exceedance failure probabilities for a desired joint IM under each considered damage state enabling researchers to populate a database for community-level modeling with a portfolio of RC buildings. The surfaces in Fig. 12 include damage state exceedance probability calculations for the joint IM of (1.95, 0) as a demonstration. As shown on the fragility surfaces, the structures exposed to long-duration earthquakes have significantly higher failure probabilities compared to their regular-duration earthquake.
The earthquake-tsunami fragility surfaces for both sets of GMs for the complete damage state (DS3) are presented side-by-side in Fig. 13. The scalar fragility functions for tsunami-only and earthquake-only hazards are extracted from the edges of these fragility surfaces and displayed in Figs. 13(b and c), respectively.
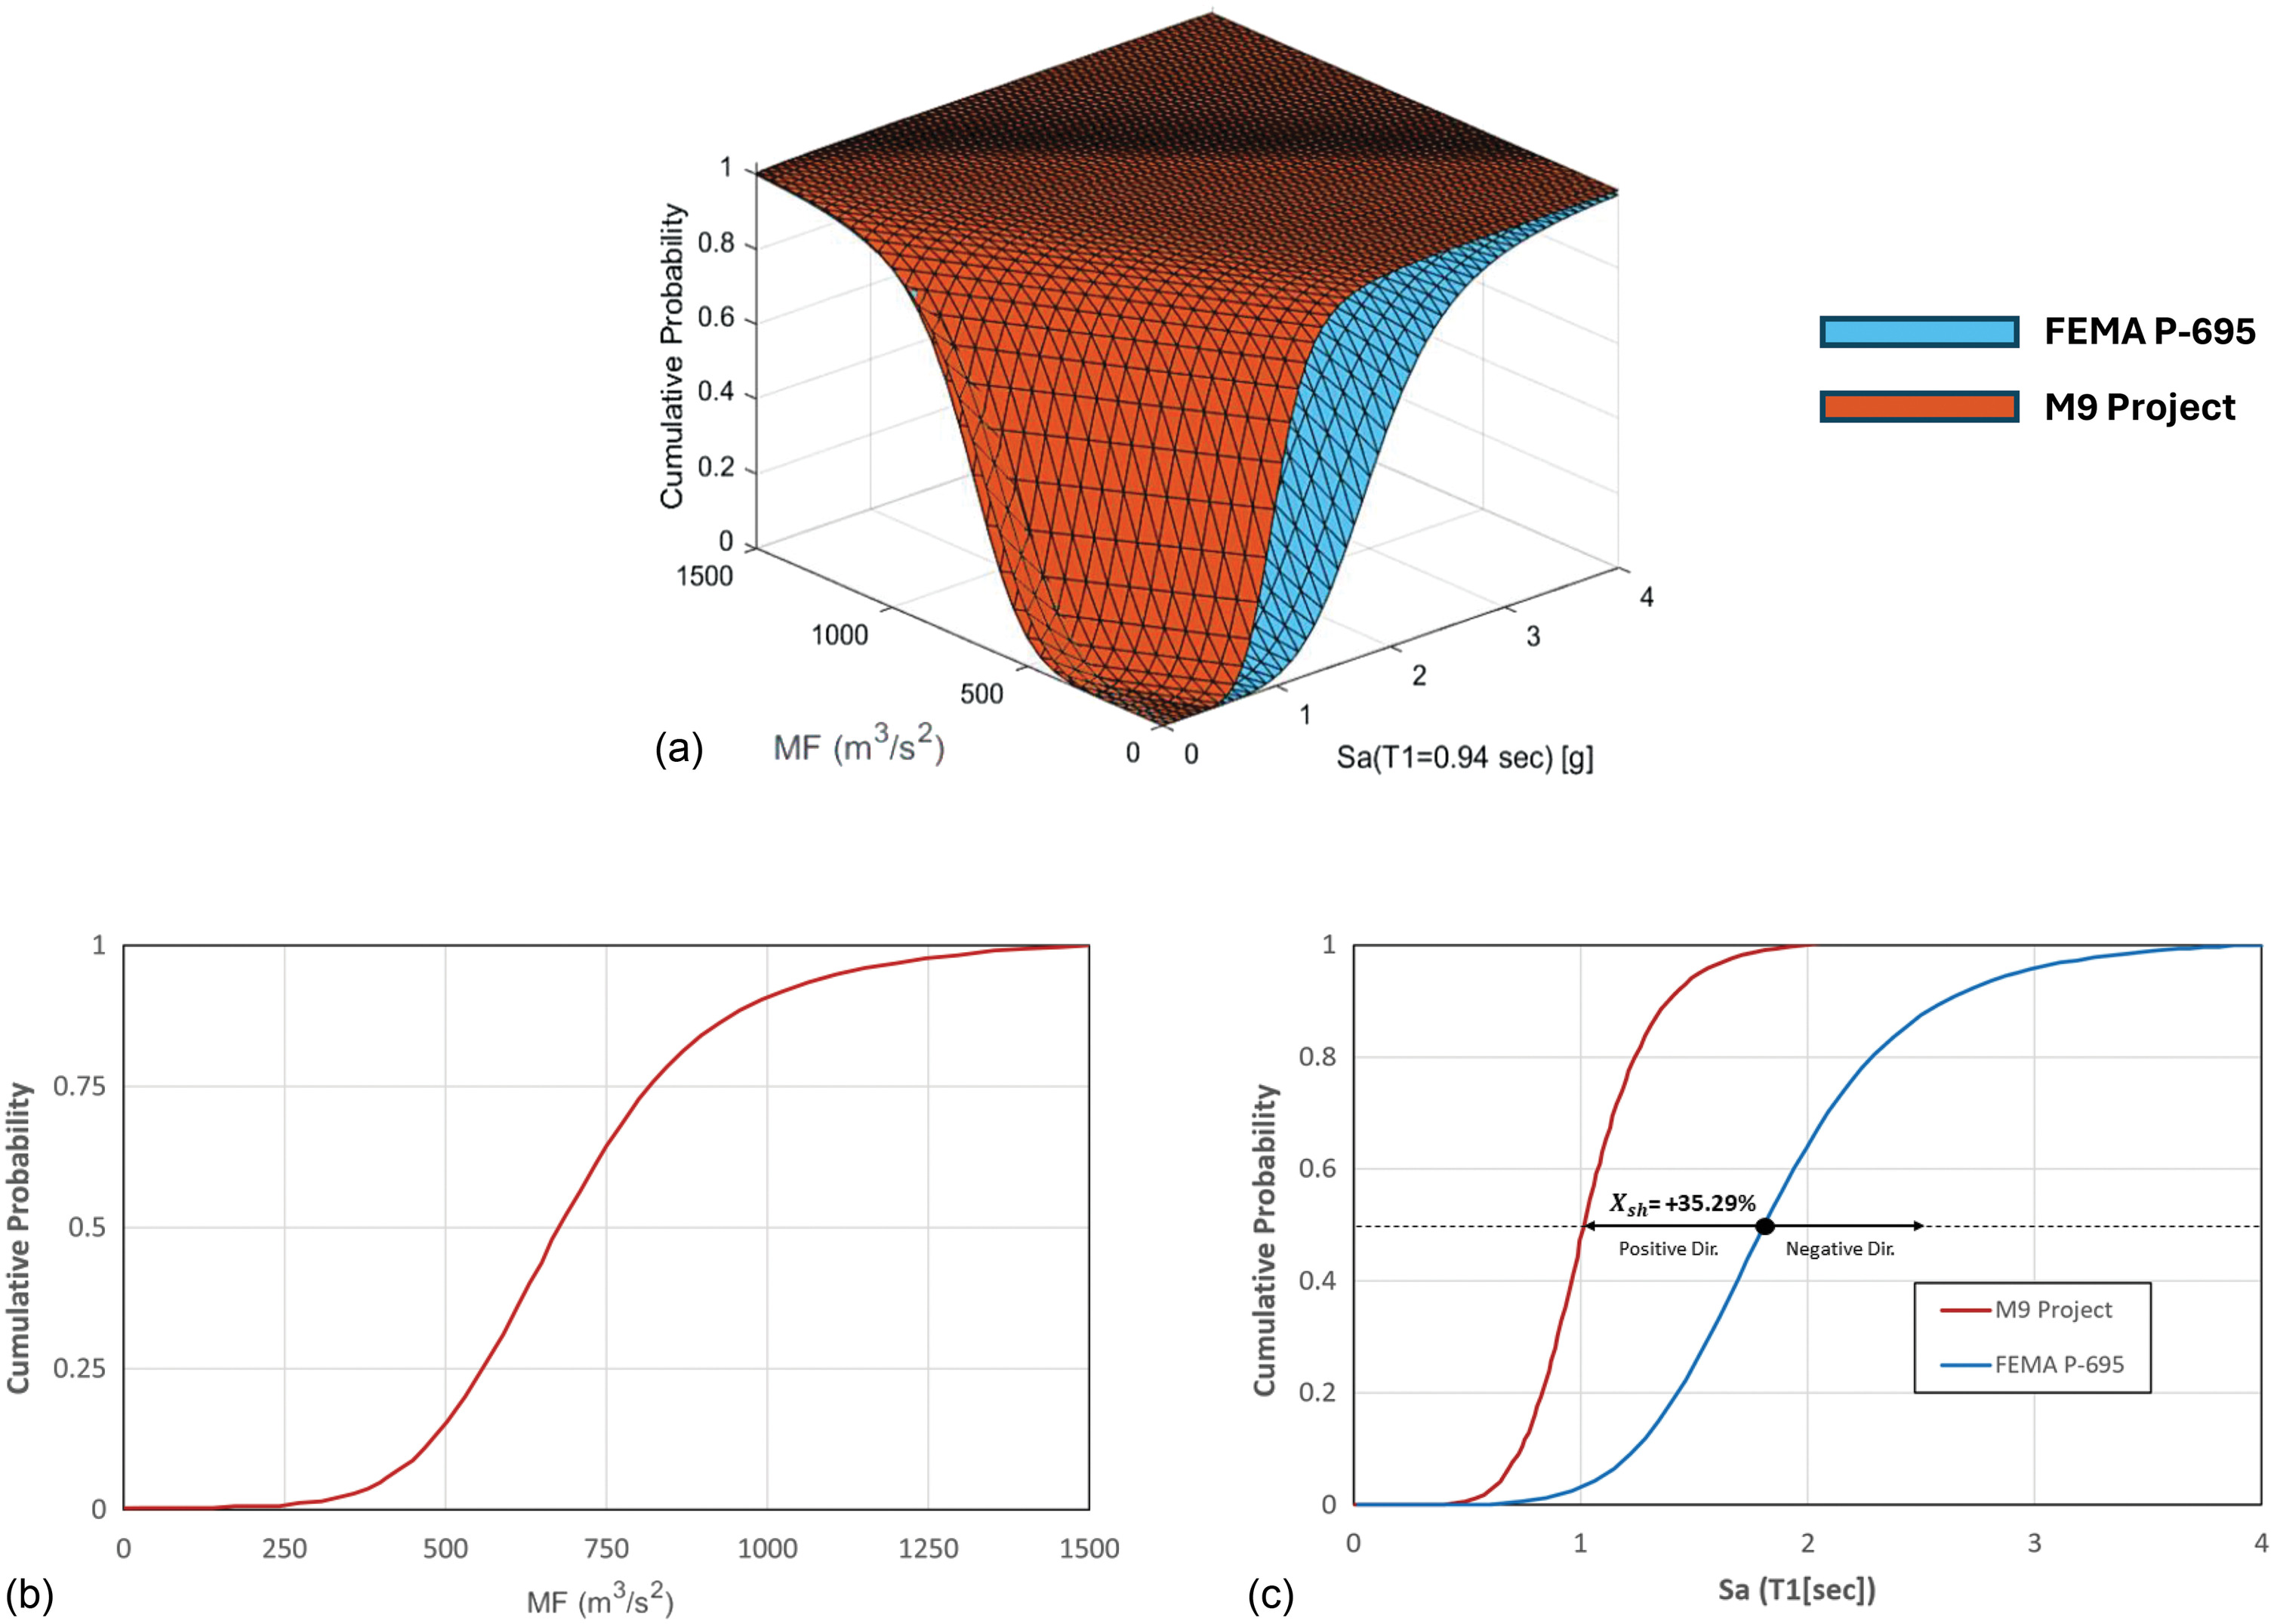
As shown in Fig. 13(b), the scalar fragility curves for the tsunami-only hazard for both GM sets are closely aligned and share overlapping data points, indicating that the structures have a similar vulnerability to different levels of tsunami IM when prior seismic damage from the source earthquake is not taken into account. Since no earthquake is run for the tsunami-only analysis, one can see that the two surfaces converge in the three-dimensional surface plot for both earthquake sets to form the tsunami-only fragility. But as seen in Fig. 13(c), the scalar earthquake fragility curve of the long-duration set is shifted to the left side, indicating that more structural damage can be expected from long-duration earthquakes.
The degree of the fragility curve shift () has been quantified as a percentage, using the 50% cumulative probability of exceedance reference point for for regular-duration motions. A positive shift is defined if the fragility curve generated using the long-duration motions is shifted to the left side compared to the reference point, demonstrating more initial seismic damage from the earthquake phase in this successive simulation. For example, in the four-story ductile RC frame illustrated in Fig. 13, the positive shift is approximately 35%. This shift could be attributed to several factors, such as longer shaking duration leading to more cumulative damage to the structure or different spectral contents and their interaction with higher vibration modes in the structure of interest. This initial earthquake damage would affect the structural response for the tsunami in the second phase of the simulation, as demonstrated by the earthquake-tsunami fragility surface derived from long-duration motions.
Fig. 14 displays the shift in fragility () between long-duration and regular-duration earthquakes for both ductile and nonductile systems. As previously noted, an of zero suggests a negligible shift in response due to long-duration earthquakes, implying almost identical responses for both sets of GM records. The impact on low- to mid-rise RC frames, irrespective of their design ductility levels, is more significant from long-duration earthquakes, showing a shift of more than 40%, compared to their response under regular-duration earthquakes. In contrast, high-rise RC structural systems show minimal shifting when subjected to long-duration motions, indicating that their fragility behavior is relatively similar when exposed to earthquake sets from both the FEMA P-695 and the M9 Project. This pattern suggests that in taller structures, long-duration earthquakes do not notably alter the structural response compared to regular-duration earthquakes, likely due to their specific dynamic characteristics or the seismic input’s nature at higher modes. Moreover, the values are directly influenced by the initial damage each structure endures, as depicted in Fig. 11. This figure clearly demonstrates that nonductile frames are inherently more susceptible to earthquake damage, regardless of the type. Consequently, the variance observed in fragility shifts for ductile versus nonductile frames should be interpreted based on the initial and reference damage states (based on regular-duration earthquakes) and inherent vulnerabilities of the considered structural systems, rather than as an indication of the direct structural responses of the buildings being examined under different seismic events.
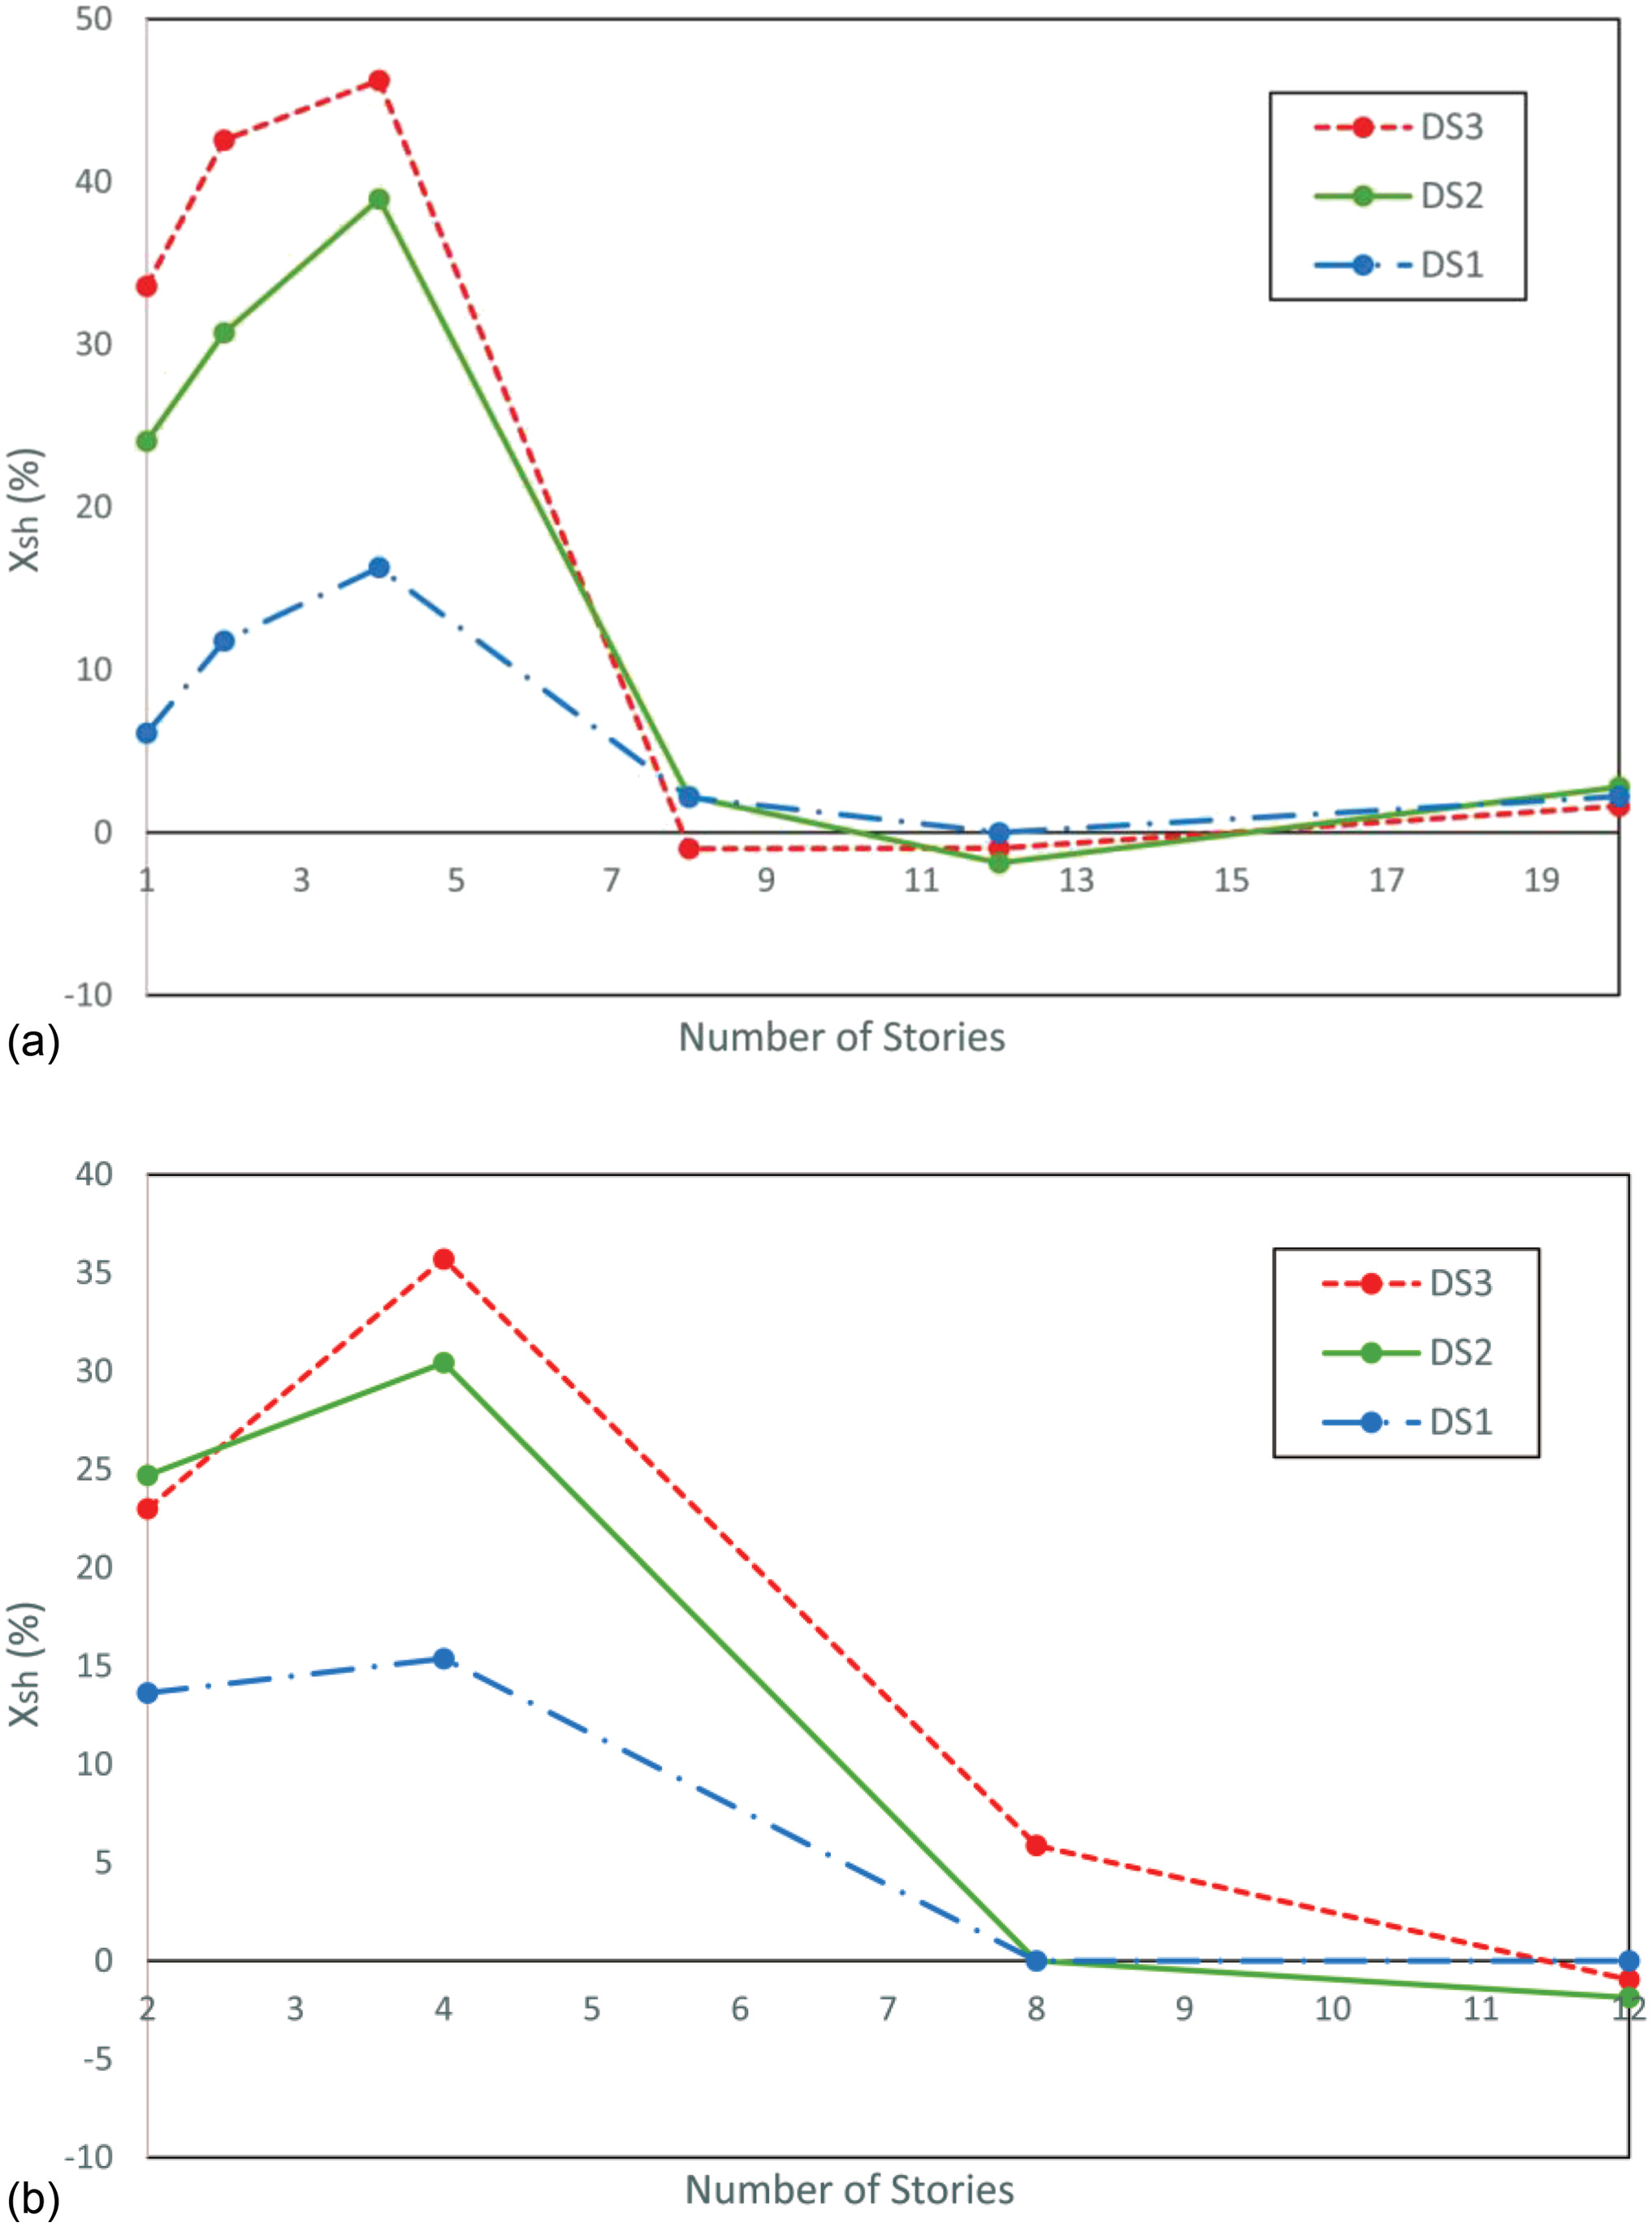
Fig. 15 shows scalar tsunami fragility functions for collapse or complete DS, conditioned on earthquake IMs for two distinct GM categories: FEMA P-695 and the M9 Project. These fragility functions are illustrated across various earthquake intensity levels, with specific focus on values of 0.5g, 1.0g, and 1.5g. Each section of the figure demonstrates the changes in fragility functions corresponding to different values, highlighting how these variations are key in determining the likelihood of varying levels of structural damage under tsunami loading post-earthquake. The comparative analysis of the two GM categories at each intensity level sheds light on the impact of different GM characteristics on structural vulnerability during tsunamis following earthquakes. Notably, the fragility curves for tsunamis, conditioned on each value, exhibit a vertical compression and initiate from a higher cumulative probability in scenarios where a near-field tsunami follows a long-duration earthquake.
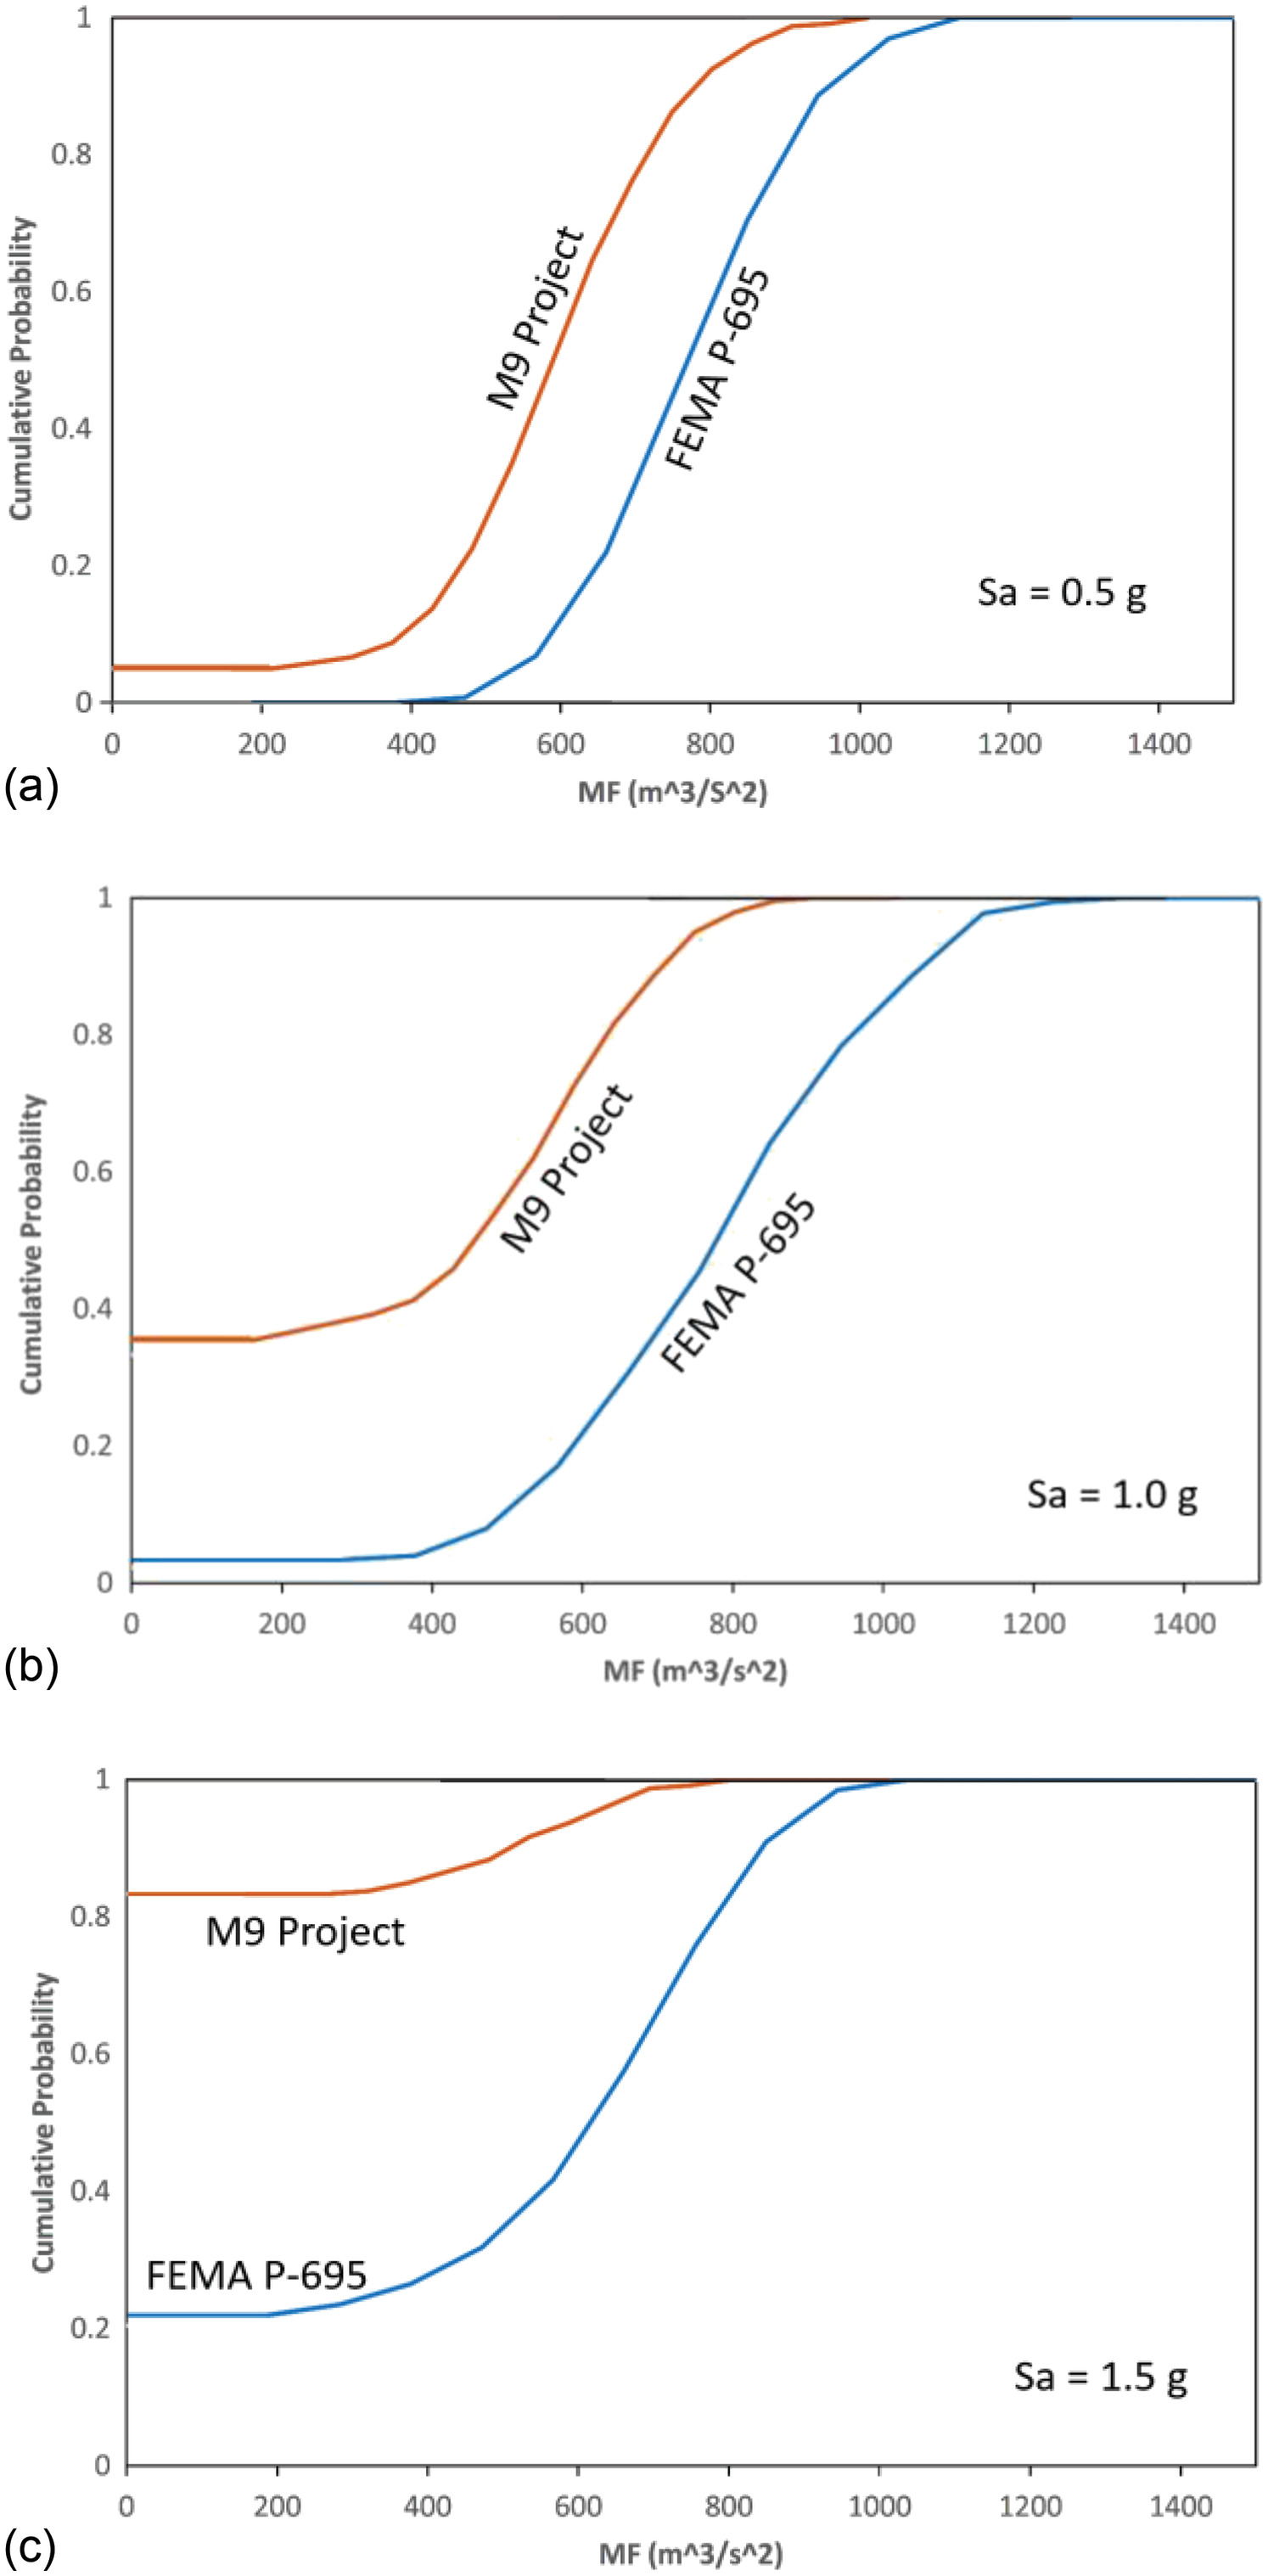
This vertical shift is evident at the beginning of each tsunami fragility curve under long-duration GM sets. Therefore, for this specific building archetype (RC3), the probability of collapse following a near-field tsunami event is generally higher when the structure experiences a seismic event characterized by a long-duration earthquake. However, it is essential to acknowledge that these observed vertical shifts in the fragility curves occur when there is a positive horizontal shift () in earthquake fragility curves. In cases where is zero or minimal, such vertical shifts in the scalar tsunami fragility (conditioned on ) would not be observed. Furthermore, the rate of change in this vertical shifting tends to accelerate with larger values, indicating a direct correlation between the magnitude of horizontal shift and the rate of vertical shift in the fragility curves.
The key parameters of the long-duration earthquake-tsunami fragility surfaces for ductile RC structures, have been extracted and presented in Table 4. These parameters (, , , , and ) govern Eq. (4) and can be utilized to replicate the fragility surfaces for buildings assigned these archetypes for community-level modeling. Additionally, Table 5 contains the controlling parameters of the governing equations of near-continuous surfaces of nonductile RC structures.
| Structure ID | Parameters | DS1 | DS2 | DS3 |
|---|---|---|---|---|
| RC1 | 0.9940 | 0.9940 | 0.9940 | |
| 1.1862 | 1.4549 | 1.6663 | ||
| 222.1572 | 293.0203 | 418.8514 | ||
| 0.5183 | 0.6065 | 0.7210 | ||
| 8.6144 | 7.6151 | 8.7140 | ||
| RC2 | 1.0695 | 1.0695 | 1.0695 | |
| 0.5255 | 1.0043 | 1.4251 | ||
| 475.1265 | 540.6804 | 614.5086 | ||
| 0.5187 | 0.5885 | 0.6545 | ||
| 8.1644 | 8.2881 | 7.9010 | ||
| RC3 | 0.9990 | 0.9990 | 0.9990 | |
| 0.3516 | 0.5274 | 0.8871 | ||
| 460.4590 | 546.6160 | 625.0746 | ||
| 0.5037 | 0.5957 | 0.6849 | ||
| 11.1587 | 10.7195 | 9.8662 | ||
| RC4 | 0.9977 | 0.9977 | 0.9977 | |
| 0.2439 | 0.3933 | 0.8008 | ||
| 463.0644 | 549.4345 | 648.6586 | ||
| 0.4556 | 0.5416 | 0.6254 | ||
| 8.4877 | 7.7198 | 6.2002 | ||
| RC5 | 0.9980 | 0.9980 | 0.9980 | |
| 0.2039 | 0.3153 | 0.5767 | ||
| 580.5488 | 664.6450 | 761.6400 | ||
| 0.5261 | 0.5879 | 0.6519 | ||
| 9.5713 | 8.3730 | 7.8906 | ||
| RC6 | 0.9967 | 0.9967 | 0.9967 | |
| 0.1783 | 0.2811 | 0.4307 | ||
| 808.9316 | 1,026.1764 | 1,251.7859 | ||
| 0.4595 | 0.4977 | 0.2927 | ||
| 5.8915 | 4.6345 | 2.7773 |
| Structure ID | Parameters | DS1 | DS2 | DS3 |
|---|---|---|---|---|
| RC7 | 0.9995 | 0.9995 | 0.9995 | |
| 0.1314 | 0.2124 | 0.3530 | ||
| 428.0241 | 462.7721 | 618.5010 | ||
| 0.4436 | 0.5040 | 0.6295 | ||
| 12.4349 | 8.8843 | 7.0898 | ||
| RC8 | 0.9996 | 0.9996 | 0.9996 | |
| 0.1489 | 0.2367 | 0.2896 | ||
| 371.4985 | 407.5319 | 519.4316 | ||
| 0.3963 | 0.4588 | 0.5544 | ||
| 11.8137 | 8.2911 | 8.6633 | ||
| RC9 | 0.9985 | 0.9985 | 0.9985 | |
| 0.2143 | 0.3001 | 0.3292 | ||
| 370.6026 | 442.1421 | 562.5499 | ||
| 0.4333 | 0.5169 | 0.6046 | ||
| 10.1249 | 8.3911 | 9.9739 | ||
| RC10 | 0.9987 | 0.9987 | 0.9987 | |
| 0.4168 | 0.6155 | 0.7284 | ||
| 264.0658 | 306.6170 | 417.7384 | ||
| 0.3899 | 0.4784 | 0.5775 | ||
| 8.7944 | 7.8252 | 8.0893 |
The parameters governing the scalar fragility curves for earthquake-only and tsunami-only hazards have been extracted and presented in Tables 6 and 7, respectively. These tables contain the parameters controlling the lognormal CDF function introduced in Eq. (5), which plays a critical role in determining the vulnerability of RC structures to earthquake-only and tsunami-only hazards. It is worth noting that the scalar earthquake fragilities for the RC frames when subjected to long-duration earthquakes can be constructed using the parameters presented in Table 6. The scalar earthquake fragility curves developed in this study can be utilized to model and assess the vulnerability of RC structures in a region anticipated to be exposed to long-duration earthquakes only, i.e., not near the coast, which can aid in community-level planning and decision-making for seismic risk reduction.
| Structure ID | Parameters | DS1 | DS2 | DS3 |
|---|---|---|---|---|
| RC1 | 0.1696 | 0.3793 | ||
| 0.2728 | 0.3925 | 0.3060 | ||
| RC2 | 0.1957 | |||
| 0.1767 | 0.2727 | 0.3503 | ||
| RC3 | ||||
| 0.1984 | 0.1845 | 0.2655 | ||
| RC4 | ||||
| 0.2204 | 0.3613 | 0.5010 | ||
| RC5 | ||||
| 0.2250 | 0.3607 | 0.5803 | ||
| RC6 | ||||
| 0.4446 | 0.6648 | 0.7286 | ||
| RC7 | ||||
| 0.1211 | 0.2979 | 0.4408 | ||
| RC8 | ||||
| 0.1641 | 0.3058 | 0.2238 | ||
| RC9 | ||||
| 0.1722 | 0.2383 | 0.1993 | ||
| RC10 | ||||
| 0.1565 | 0.2053 | 0.2761 |
| Structure ID | Parameters | DS1 | DS2 | DS3 |
|---|---|---|---|---|
| RC1 | 5.2687 | 5.5930 | 5.9295 | |
| 0.1907 | 0.1764 | 0.1605 | ||
| RC2 | 5.9923 | 6.1523 | 6.2917 | |
| 0.1896 | 0.1887 | 0.1471 | ||
| RC3 | 6.0807 | 6.2821 | 6.5174 | |
| 0.1814 | 0.1769 | 0.1743 | ||
| RC4 | 5.8794 | 6.1350 | 6.4179 | |
| 0.1706 | 0.2122 | 0.2022 | ||
| RC5 | 6.1467 | 6.3874 | 6.6136 | |
| 0.1712 | 0.1926 | 0.1757 | ||
| RC6 | 6.5222 | 6.8849 | 7.1218 | |
| 0.2738 | 0.2162 | 0.1782 | ||
| RC7 | 5.2153 | 5.9160 | 6.2901 | |
| 0.4822 | 0.2408 | 0.1942 | ||
| RC8 | 5.1703 | 5.7789 | 6.0769 | |
| 0.2094 | 0.1759 | 0.2090 | ||
| RC9 | 5.5567 | 5.8509 | 6.1068 | |
| 0.1284 | 0.1666 | 0.1761 | ||
| RC10 | 5.3008 | 5.5734 | 5.8858 | |
| 0.1887 | 0.2211 | 0.1957 |
Summary and Conclusions
This study utilized a fully probabilistic simulation within a two-phase successive analysis procedure to investigate the potential impact of long-duration earthquakes on RC frame buildings. This was accomplished through the investigation in the changes in earthquake-tsunami fragility surfaces for a selected suite of typical RC frame buildings. The successive analysis includes a NLTHA procedure for earthquake loading and an NSP analysis for the tsunami hazard. Additionally, uncertainty is included in the simulation at different levels for both the structural resistance and modeling and the earthquake and tsunami loading. The selected RC frames in this study are representative of both ductile and nonductile systems found in US (coastal) communities and form an RC building portfolio, varying in design philosophy, bay geometry, story heights, and the number of stories.
The vector-valued fragility surfaces for the earthquake and tsunami for the suite of RC frame buildings, exposed to both long-duration and regular-duration earthquakes, were evaluated in this study. The information pertinent to the parameters of scalar fragility curves for earthquake-only (with long durations) or tsunami-only, can be extracted directly from the edges of the fragility surfaces in their respective planes. Parameters for both the surfaces and scalar fragilities are provided for community modeling purposes and can serve as a data set for this suite of 10 RC frame buildings.
Additionally, studies have shown that initial seismic damage resulting from the source earthquake in low- to mid-rise structures increases the probability of failure by up to 40% when subjected to long-duration earthquakes. Specifically, RC buildings up to eight stories in height, including both ductile and nonductile RC frames, are at a higher risk of structural damage and failure (defined with DS1, DS2, or DS3) in the earthquake before the tsunami strikes. Furthermore, equivalent tsunami forces in the second phase of the simulation exacerbate the condition of structures with more initial earthquake damage as one would expect. This study indicates that the conclusions can potentially be applicable to a wide range of buildings facing strength and stiffness degradation, although their current scope is confined to RC frame buildings. Further research is essential to determine their generalizability to other types of structures.
Data Availability Statement
Some or all data, models, or code that support the findings of this study are available from the corresponding author upon reasonable request.
Acknowledgments
The Center for Risk-Based Community Resilience Planning is a NIST-funded Center of Excellence; the Center is funded through a cooperative agreement between the US National Institute of Standards and Technology and Colorado State University (NIST Financial Assistance Award Nos. 70NANB15H044 and 70NANB20H008). The views expressed are those of the presenter and may not represent the official position of the National Institute of Standards and Technology or the US Department of Commerce.
References
ACI (American Concrete Institute). 2002. Building code requirements for structural concrete (ACI 318-02) and commentary. ACI 318R-02. Farmington Hills, MI: ACI.
Afshari, K., and J. P. Stewart. 2016. “Physically parameterized prediction equations for significant duration in active crustal regions.” Earthquake Spectra 32 (4): 2057–2081. https://doi.org/10.1193/063015EQS106M.
Alam, M. S., A. R. Barbosa, M. H. Scott, D. T. Cox, and J. W. van de Lindt. 2018. “Development of physics-based tsunami fragility functions considering structural member failures.” J. Struct. Eng. 144 (3): 04017221. https://doi.org/10.1061/(ASCE)ST.1943-541X.0001953.
Alam, M. S., A. R. Barbosa, M. H. Scott, D. T. Cox, and J. W. van de Lindt. 2019. “Multi-hazard earthquake-tsunami structural fragility assessment framework.” In Proc., 13th Int. Conf. on Applications of Statistics and Probability in Civil Engineering (ICASP13), 1318–1325. Reston, VA: ASCE. https://doi.org/10.22725/ICASP13.244.
Altoontash, A. 2004. Simulation and damage models for performance assessment of reinforced concrete beam-column joints. Stanford, CA: Stanford Univ.
Ando, M., and M. Nakamura. 2013. “Seismological evidence for a tsunami earthquake recorded four centuries ago on historical documents.” Geophys. J. Int. 195 (2): 1088–1101. https://doi.org/10.1093/gji/ggt270.
ASCE. 2002. Minimum design loads for buildings and other structures. ASCE/SEI 7-02. Reston, VA: ASCE.
ASCE. 2022. Minimum design loads for buildings and other structures. ASCE/SEI 7-22. Reston, VA: ASCE.
ATC (Applied Technology Council). 2017. Guidelines for nonlinear structural analysis and design of buildings. Part IIb—Reinforced concrete moment frames. NIST GCR 17-917-46v3. Gaithersburg, MD: NIST.
Attary, N., V. U. Unnikrishnan, J. W. van de Lindt, D. T. Cox, and A. R. Barbosa. 2017a. “Performance-based tsunami engineering methodology for risk assessment of structures.” Eng. Struct. 141 (Jun): 676–686. https://doi.org/10.1016/j.engstruct.2017.03.071.
Attary, N., J. W. van de Lindt, V. U. Unnikrishnan, A. R. Barbosa, and D. T. Cox. 2017b. “Methodology for development of physics-based tsunami fragilities.” J. Struct. Eng. 143 (5): 04016223. https://doi.org/10.1061/(ASCE)ST.1943-541X.0001715.
Attary, N., J. W. Van De Lindt, A. R. Barbosa, D. T. Cox, and V. U. Unnikrishnan. 2021. “Performance-based tsunami engineering for risk assessment of structures subjected to multi-hazards: Tsunami following earthquake.” J. Earthquake Eng. 25 (10): 2065–2084. https://doi.org/10.1080/13632469.2019.1616335.
Baker, J. W. 2005. Vector-valued ground motion intensity measures for probabilistic seismic demand analysis. Stanford, CA: Stanford Univ.
Baker, J. W. 2015. “Efficient analytical fragility function fitting using dynamic structural analysis.” Earthquake Spectra 31 (1): 579–599. https://doi.org/10.1193/021113EQS025M.
Bandyopadhyay, K. K., C. H. Hofmayer, M. K. Kassir, and S. E. Pepper. 1990. Seismic fragility of nuclear power plant components (Phase II). New York: Brookhaven National Lab. https://doi.org/10.2172/7252519.
Barbosa, A. R., F. L. A. Ribeiro, and L. A. C. Neves. 2017. “Influence of earthquake ground-motion duration on damage estimation: Application to steel moment resisting frames.” Earthquake Eng. Struct. Dyn. 46 (1): 27–49. https://doi.org/10.1002/eqe.2769.
Belejo, A., A. R. Barbosa, and R. Bento. 2017. “Influence of ground motion duration on damage index-based fragility assessment of a plan-asymmetric non-ductile reinforced concrete building.” Eng. Struct. 151 (Nov): 682–703. https://doi.org/10.1016/j.engstruct.2017.08.042.
Belliazzi, S., G. P. Lignola, M. Di Ludovico, and A. Prota. 2021. “Preliminary tsunami analytical fragility functions proposal for Italian coastal residential masonry buildings.” Structures 31 (Jun): 68–79. https://doi.org/10.1016/j.istruc.2021.01.059.
Biskinis, D. E., G. K. Roupakias, and M. N. Fardis. 2004. “Degradation of shear strength of reinforced concrete members with inelastic cyclic displacements.” Struct. J. 101 (6): 773–783. https://doi.org/10.14359/13452.
Bommer, J. J., G. Magenes, J. Hancock, and P. Penazzo. 2004. “The influence of strong-motion duration on the seismic response of masonry structures.” Bull. Earthquake Eng. 2 (1): 1–26. https://doi.org/10.1023/B:BEEE.0000038948.95616.bf.
Bommer, J. J., and A. Martínez-Pereira. 1999. “The effective duration of earthquake strong motion.” J. Earthquake Eng. 3 (2): 127–172. https://doi.org/10.1080/13632469909350343.
Carey, T. J., H. B. Mason, A. R. Barbosa, and M. H. Scott. 2019. “Multihazard earthquake and tsunami effects on soil–foundation–bridge systems.” J. Bridge Eng. 24 (4): 04019004. https://doi.org/10.1061/(ASCE)BE.1943-5592.0001353.
Carvajal, M., M. Cisternas, A. Gubler, P. A. Catalán, P. Winckler, and R. L. Wesson. 2017. “Reexamination of the magnitudes for the 1906 and 1922 Chilean earthquakes using Japanese tsunami amplitudes: Implications for source depth constraints.” J. Geophys. Res. Solid Earth 122 (1): 4–17. https://doi.org/10.1002/2016JB013269.
Celik, O. C., and B. R. Ellingwood. 2008. “Modeling beam-column joints in fragility assessment of gravity load designed reinforced concrete frames.” J. Earthquake Eng. 12 (3): 357–381. https://doi.org/10.1080/13632460701457215.
Chandramohan, R., J. W. Baker, and G. G. Deierlein. 2016. “Quantifying the influence of ground motion duration on structural collapse capacity using spectrally equivalent records.” Earthquake Spectra 32 (2): 927–950. https://doi.org/10.1193/122813eqs298mr2.
Chen, L., C. Huang, H. Chen, and Z. Zheng. 2022. “Seismic fragility models of a bridge system based on copula method.” Earthquake Spectra 38 (2): 1417–1437. https://doi.org/10.1177/87552930211052573.
Chua, C. T., et al. 2021. “Tsunami damage to ports: Cataloguing damage to create fragility functions from the 2011 Tohoku event.” Nat. Hazards Earth Syst. Sci. 21 (6): 1887–1908. https://doi.org/10.5194/nhess-21-1887-2021.
Ellingwood, B. 1980. Development of a probability based load criterion for American National Standard A58. Gaithersburg, MD: National Bureau of Standards.
Fardis, M. N., and D. Biskinis. 2003. “Deformation capacity of RC members, as controlled by flexure or shear.” In Proc., Int. Symp. Honoring Shunsuke Otani on Performance-based Engineering for Earthquake Resistant Reinforced Concrete Structures, 511–530. Tokyo: Univ. of Tokyo.
FEMA. 2011. “FEMA P-695, quantification of building seismic performance factors—Applied technology council online store.” Accessed November 30, 2009. https://store.atcouncil.org/index.php?dispatch=products.view&product_id=210.
FEMA. 2020. HAZUS-MH 4.2 technical manual. Washington, DC: FEMA.
Frankel, A., E. Wirth, and N. Marafi. 2018. The M9 project ground motions. Austin, TX: Texas Advanced Computing Center. https://doi.org/10.17603/DS2WM3W.
Hancock, J., and J. J. Bommer. 2007. “Using spectral matched records to explore the influence of strong-motion duration on inelastic structural response.” Soil Dyn. Earthquake Eng. 27 (4): 291–299. https://doi.org/10.1016/j.soildyn.2006.09.004.
Harati, M., M. Mashayekhi, M. Ashoori Barmchi, and H. Estekanchi. 2019. “Influence of ground motion duration on the structural response at multiple seismic intensity levels.” Numer. Methods Civ. Eng. 3 (4): 10–23. https://doi.org/10.29252/nmce.3.4.10.
Harati, M., M. Mashayekhi, and H. Estekanchi. 2020. “Correlation of ground motion duration with its intensity metrics: A simulation based approach.” J. Soft Comput. Civ. Eng. 4 (3): 17–39. https://doi.org/10.22115/scce.2020.227576.1207.
Harati, M., M. Mashayekhi, H. Mohammadnezhad, H. Jaberi, and H. E. Estekanchi. 2021. “On the reduction of the number of required motions in the dynamic analysis using a refined spectral matching.” Earthquakes Struct. 21 (4): 425–444. https://doi.org/10.12989/eas.2021.21.4.425.
Harati, M., and J. W. van de Lindt. 2024. “Methodology to generate earthquake-tsunami fragility surfaces for community resilience modeling.” Eng. Struct. 305 (Apr): 117700. https://doi.org/10.1016/j.engstruct.2024.117700.
Haselton, C. B. 2006. “Assessing seismic collapse safety of modern reinforced concrete moment frame buildings.” Ph.D. thesis, Dept. of Civil and Environmental Engineering, Stanford Univ.
Haselton, C. B., C. A. Goulet, J. Mitrani-Reiser, J. L. Beck, G. G. Deierlein, K. A. Porter, J. P. Stewart, and E. Taciroglu. 2008. An assessment to benchmark the seismic performance of a code-conforming reinforced concrete moment-frame building. Berkeley, CA: Univ. of California.
Haselton, C. B., A. B. Liel, G. G. Deierlein, B. S. Dean, and J. H. Chou. 2011. “Seismic collapse safety of reinforced concrete buildings. I: Assessment of ductile moment frames.” J. Struct. Eng. 137 (4): 481–491. https://doi.org/10.1061/(ASCE)ST.1943-541X.0000318.
Hashimoto, T., T. Honda, and Y. Oda. 2023. “Study on the effect of density change due to suspended fine sediment on tsunami force.” In Proc., 33rd Int. Ocean and Polar Engineering Conf. Cupertino, CA: International Society of Offshore and Polar Engineers.
Ibarra, L. F., and H. Krawinkler. 2005. Global collapse of frame structures under seismic excitations. Berkeley, CA: Pacific Earthquake Engineering Research Center.
Ibarra, L. F., R. A. Medina, and H. Krawinkler. 2005. “Hysteretic models that incorporate strength and stiffness deterioration.” Earthquake Eng. Struct. Dyn. 34 (12): 1489–1511. https://doi.org/10.1002/eqe.495.
Jalayer, F., and C. A. Cornell. 2009. “Alternative non-linear demand estimation methods for probability-based seismic assessments.” Earthquake Eng. Struct. Dyn. 38 (8): 951–972. https://doi.org/10.1002/eqe.876.
Kajitani, Y., S. E. Chang, and H. Tatano. 2013. “Economic impacts of the 2011 Tohoku-Oki earthquake and tsunami.” Supplement, Earthquake Spectra 29 (1_suppl): 457–478. https://doi.org/10.1193/1.4000108.
Kempton, J. J., and J. P. Stewart. 2006. “Prediction equations for significant duration of earthquake ground motions considering site and near-source effects.” Earthquake Spectra 22 (4): 985–1013. https://doi.org/10.1193/1.2358175.
Kern, S. E., G. Xie, J. L. White, and T. D. Egan. 2004. “A response surface analysis of propofol–remifentanil pharmacodynamic interaction in volunteers.” Anesthesiology 100 (6): 1373–1381. https://doi.org/10.1097/00000542-200406000-00007.
Koliou, M., J. W. van de Lindt, T. P. McAllister, B. R. Ellingwood, M. Dillard, and H. Cutler. 2020. “State of the research in community resilience: Progress and challenges.” Sustainable Resilient Infrastruct. 5 (3): 131–151. https://doi.org/10.1080/23789689.2017.1418547.
Li, T., Y. Yang, K. Dai, Q. Ge, and J. Wang. 2022. “Influence of ground motion duration on seismic performance of RC frame isolated by high damping rubber bearings.” Eng. Struct. 262 (Jul): 114398. https://doi.org/10.1016/j.engstruct.2022.114398.
Li, Y., R. Song, and J. W. Van De Lindt. 2014. “Collapse fragility of steel structures subjected to earthquake mainshock-aftershock sequences.” J. Struct. Eng. 140 (12): 04014095. https://doi.org/10.1061/(ASCE)ST.1943-541X.0001019.
Liel, A., and G. Deierlein. 2008. Assessing the collapse risk of California’s existing reinforced concrete frame structures: Metrics for seismic safety decisions. Stanford, CA: Stanford Univ.
Liel, A. B., C. B. Haselton, and G. G. Deierlein. 2011. “Seismic collapse safety of reinforced concrete buildings. II: Comparative assessment of nonductile and ductile moment frames.” J. Struct. Eng. 137 (4): 492–502. https://doi.org/10.1061/(ASCE)ST.1943-541X.0000275.
Lignos, D. G., and H. Krawinkler. 2011. “Deterioration modeling of steel components in support of collapse prediction of steel moment frames under earthquake loading.” J. Struct. Eng. 137 (11): 1291–1302. https://doi.org/10.1061/(ASCE)ST.1943-541X.0000376.
Mashayekhi, M., M. Harati, M. Ashoori Barmchi, and H. E. Estekanchi. 2019. “Introducing a response-based duration metric and its correlation with structural damages.” Bull. Earthquake Eng. 17 (11): 5987–6008. https://doi.org/10.1007/s10518-019-00716-y.
Mashayekhi, M., M. Harati, A. Darzi, and H. E. Estekanchi. 2020. “Incorporation of strong motion duration in incremental-based seismic assessments.” Eng. Struct. 223 (Nov): 111144. https://doi.org/10.1016/j.engstruct.2020.111144.
Medina, S., J. Lizarazo-Marriaga, M. Estrada, S. Koshimura, E. Mas, and B. Adriano. 2019. “Tsunami analytical fragility curves for the Colombian Pacific coast: A reinforced concrete building example.” Eng. Struct. 196 (Oct): 109309. https://doi.org/10.1016/j.engstruct.2019.109309.
Panagiotakos, T. B., and M. N. Fardis. 2001. “Deformations of reinforced concrete members at yielding and ultimate.” Struct. J. 98 (2): 135–148. https://doi.org/10.14359/10181.
Pang, Y., and X. Wang. 2021. “Cloud-IDA-MSA conversion of fragility curves for efficient and high-fidelity resilience assessment.” J. Struct. Eng. 147 (5): 04021049. https://doi.org/10.1061/(ASCE)ST.1943-541X.0002998.
Park, S., J. W. van de Lindt, D. Cox, R. Gupta, and F. Aguiniga. 2012. “Successive earthquake-tsunami analysis to develop collapse fragilities.” J. Earthquake Eng. 16 (6): 851–863. https://doi.org/10.1080/13632469.2012.685209.
Park, Y., and A. H.-S. Ang. 1985. “Mechanistic seismic damage model for reinforced concrete.” J. Struct. Eng. 111 (4): 722–739. https://doi.org/10.1061/(ASCE)0733-9445(1985)111:4(722).
Petrone, C., T. Rossetto, M. Baiguera, C. D. la Barra Bustamante, and I. Ioannou. 2020. “Fragility functions for a reinforced concrete structure subjected to earthquake and tsunami in sequence.” Eng. Struct. 205 (Feb): 110120. https://doi.org/10.1016/j.engstruct.2019.110120.
Petrone, C., T. Rossetto, and K. Goda. 2017. “Fragility assessment of a RC structure under tsunami actions via nonlinear static and dynamic analyses.” Eng. Struct. 136 (Apr): 36–53. https://doi.org/10.1016/j.engstruct.2017.01.013.
Porter, K. A., J. L. Beck, and R. V. Shaikhutdinov. 2002. “Sensitivity of building loss estimates to major uncertain variables.” Earthquake Spectra 18 (4): 719–743. https://doi.org/10.1193/1.1516201.
Rossetto, T., C. De la Barra, C. Petrone, J. C. De la Llera, J. Vásquez, and M. Baiguera. 2019. “Comparative assessment of nonlinear static and dynamic methods for analysing building response under sequential earthquake and tsunami.” Earthquake Eng. Struct. Dyn. 48 (8): 867–887. https://doi.org/10.1002/eqe.3167.
Salmon, M. W., S. A. Short, and R. P. Kennedy. 1992. Strong motion duration and earthquake magnitude relationships. Washington, DC: US Department of Energy.
Su, J., D. Wu, and X. Wang. 2023. “Influence of ground motion duration on seismic behavior of RC bridge piers: The role of low-cycle fatigue damage of reinforcing bars.” Eng. Struct. 279 (Mar): 115587. https://doi.org/10.1016/j.engstruct.2023.115587.
Suppasri, A., S. Koshimura, and F. Imamura. 2011. “Developing tsunami fragility curves based on the satellite remote sensing and the numerical modeling of the 2004 Indian Ocean tsunami in Thailand.” Nat. Hazards Earth Syst. Sci. 11 (1): 173–189. https://doi.org/10.5194/nhess-11-173-2011.
Todorov, B., and A. H. M. M. Billah. 2021. “Seismic fragility and damage assessment of reinforced concrete bridge pier under long-duration, near-fault, and far-field ground motions.” Structures 31 (Jun): 671–685. https://doi.org/10.1016/j.istruc.2021.02.019.
Wang, J., and B. Li. 2022. “Seismic fragility analysis of CFT frames with buckling-restrained braces and steel braces under long- and short-duration ground motions.” Structures 39 (May): 848–865. https://doi.org/10.1016/j.istruc.2022.03.078.
Wang, P.-T., A. E. Naaman, and S. P. Shah. 1978. “High-strength concrete in ultimate strength design.” J. Struct. Div. 104 (11): 1761–1773. https://doi.org/10.1061/JSDEAG.0005033.
Wang, W., J. W. van de Lindt, N. Rosenheim, H. Cutler, B. Hartman, J. Sung Lee, and D. Calderon. 2021. “Effect of residential building wind retrofits on social and economic community-level resilience metrics.” J. Infrastruct. Syst. 27 (4): 04021034. https://doi.org/10.1061/(ASCE)IS.1943-555X.0000642.
Watson, M., Y. Xiao, J. Helgeson, and M. Dillard. 2020. “Importance of households in business disaster recovery.” Nat. Hazard. Rev. 21 (4): 05020008. https://doi.org/10.1061/(ASCE)NH.1527-6996.0000393.
Xu, B., X. Wang, R. Pang, and Y. Zhou. 2018. “Influence of strong motion duration on the seismic performance of high CFRDs based on elastoplastic analysis.” Soil Dyn. Earthquake Eng. 114 (Nov): 438–447. https://doi.org/10.1016/j.soildyn.2018.08.004.
Xu, J.-G., G. Wu, D.-C. Feng, and J.-J. Fan. 2021. “Probabilistic multi-hazard fragility analysis of RC bridges under earthquake-tsunami sequential events.” Eng. Struct. 238 (Jul): 112250. https://doi.org/10.1016/j.engstruct.2021.112250.
Zhang, S., G. Wang, B. Pang, and C. Du. 2013. “The effects of strong motion duration on the dynamic response and accumulated damage of concrete gravity dams.” Soil Dyn. Earthquake Eng. 45 (Feb): 112–124. https://doi.org/10.1016/j.soildyn.2012.11.011.
Zhu, M. 2021. “OpenSeesPy documentation.” Accessed August 21, 2021. https://openseespydoc.readthedocs.io/_/downloads/en/stable/pdf/.
Information & Authors
Information
Published In

Journal of Structural Engineering
Volume 150 • Issue 10 • October 2024
Copyright
This work is made available under the terms of the Creative Commons Attribution 4.0 International license, https://creativecommons.org/licenses/by/4.0/.
History
Received: Jul 21, 2023
Accepted: Apr 5, 2024
Published online: Jul 16, 2024
Published in print: Oct 1, 2024
Discussion open until: Dec 16, 2024
ASCE Technical Topics:
- Concrete
- Concrete frames
- Concrete structures
- Disaster risk management
- Disasters and hazards
- Ductility
- Earthquakes
- Engineering materials (by type)
- Engineering mechanics
- Frames
- Geohazards
- Geotechnical engineering
- Material mechanics
- Material properties
- Materials engineering
- Mechanical properties
- Natural disasters
- Reinforced concrete
- Structural behavior
- Structural engineering
- Structural members
- Structural systems
- Structures (by type)
- Tsunamis
Authors
Metrics & Citations
Metrics
Citations
Download citation
If you have the appropriate software installed, you can download article citation data to the citation manager of your choice. Simply select your manager software from the list below and click Download.
Cited by
- Mojtaba Harati, John W. van de Lindt, Community-Level resilience analysis using earthquake-tsunami fragility surfaces, Resilient Cities and Structures, 10.1016/j.rcns.2024.07.006, 3, 2, (101-115), (2024).