Regional Recovery Modeling and Postdisaster Model Updating: The Case of the 2010 Kraljevo Earthquake in Serbia
Publication: Journal of Structural Engineering
Volume 150, Issue 2
Abstract
Modeling disaster consequences and postdisaster recovery is a key enabler of holistic community disaster resilience planning and implementation. An important step toward the application of such models in practice consists in ensuring that model parameters can be reliably estimated, building trust in model outputs, as well as reducing output uncertainty. This study aims to tackle these issues first by constructing a regional housing recovery model and validating its results for a real event, the 2010 Kraljevo, Serbia earthquake, and second, by presenting how regional recovery models can be updated following a disaster using early-arriving damage inspection data to reduce output uncertainty. The model outputs are updated postevent using 600 building damage assessment reports, reducing the uncertainty in recovery time predictions. The results confirm the practical applicability of the proposed regional recovery model and postevent updating, while identifying its main shortcomings, such as the lack of consideration for the weather conditions affecting the recovery process and the need for better methods to estimate the community’s ability to mobilize its recovery resources.
Introduction
In addition to direct losses, such as casualties and repair-and-replacement cost, earthquakes inflict indirect losses, dominated by the downtime, during which buildings cannot safely harbor their intended function. Disruption of housing capacity may lead to negative long-term consequences (Potter et al. 2015), while business interruption may comprise a large amount of total losses (Cremen et al. 2020). Consequently, the primary objective of postearthquake recovery simulation is to estimate the time needed to recover building functionality and get the community back to normal (EERI 2016), while identifying primary factors that hinder recovery.
Building recovery time consists of the delay time, the time between the disaster occurrence and the start of building repair, and the repair time (Comerio and Blecher 2010). Several approaches, often based on the FEMA P-58 framework (FEMA 2018), have been proposed to create high-fidelity models to predict the repair time of individual buildings (Terzić et al. 2021; Molina Hutt et al. 2022). Models that integrate delay time into the building recovery time estimates (e.g., Almufti and Willford 2013) divide the delay time into several impeding factors, whose sequence and duration are often based on expert opinion and data from a limited number of past events. Although such frameworks provide the basis for future research, the expert opinion and empirical estimates used to inform such models focus on the US context. However, the delay time and the repair time largely depend on local regulations and traditions, as evidenced by the application process for public funding after the 2009 L’Aquila earthquake (Di Ludovico et al. 2017a, b). Thus, a recovery modeling framework that explicitly takes into account the local context is required, because the paucity of postdisaster recovery data hinders derivation of comprehensive empirical recovery functions (Fu et al. 2021).
Furthermore, both delay and repair time of a building depend on the state of the entire community, not only the considered building, as functional recovery of buildings involves resources that are shared on a community level (Blagojević and Stojadinović 2022), socioeconomic factors (Nejat et al. 2020; Burton et al. 2022), and performance of infrastructure systems supporting building functions, such as transportation and electricity (You et al. 2021; Blagojević et al. 2022f). Therefore, regional recovery models that can consider the local context and the state of the infrastructure are needed to reliably assess the recovery time of buildings in a community.
Miles et al. (2019) summarized the current trends in regional recovery modeling. Burton et al. (2016) proposed a framework to include building performance into resilience quantification by modeling the steps required to recover to several functionality levels. Costa et al. (2021) modeled housing recovery for a scenario earthquake in Vancouver with an agent-based housing recovery model, including socioeconomic factors. A model that integrates the effect of recovery resource constraints, socioeconomic context, and postdisaster policies on housing recovery is proposed by Sutley and Hamideh (2018). Nasrazadani and Mahsuli (2020) proposed a comprehensive agent-based model for regional recovery simulations and resilience assessment that considers interdependencies among various community systems, from healthcare to civil infrastructure systems. Didier et al. (2018) proposed a framework that characterizes the recovery process by explicitly modeling community postdisaster demand and supply for infrastructure services. The framework has been extended to capture resource and service constraints affecting recovery (Blagojević et al. 2021a; Blagojević and Stojadinović 2022).
Although significant advances in regional recovery modeling have been made in recent years, the application of such models in practice is not widespread. The limited application of regional recovery models is primarily due to challenges in estimating model parameters, variations in recovery and resilience metrics, and the absence of a standardized validation approach for such models. Most regional recovery frameworks are applied to virtual or semivirtual case studies (e.g., Burton et al. 2016; Blagojević and Stojadinović 2022), where numerous model parameters are set for illustration purposes, without guarantee that they will be applicable or available in practical applications. In general, model parameters can be estimated using empirical data, experimental data, or expert opinion. Empirical data related to postdisaster recovery is scarce, incomplete, and sometimes unreliable. Experiments at regional scales are not feasible, while shake-out exercises and similar training activities rely on expert opinion. Thus, postdisaster expert experience and opinion remain as the basis for regional recovery model validation and parameter calibration. Therefore, it is crucial that model parameters are tangible quantities, formulated to be easily understood and estimated by the experts, and potentially generalizable to other disasters, regions, and circumstances. Another aspect of disaster recovery model validation are the utilized recovery and resilience metrics. Available validation studies use different metrics, depending on the available data and the features of the model, making it difficult to generalize and develop a common regional recovery modeling approach. Furthermore, longitudinal postdisaster data collection and processing studies are needed to generate comprehensive data sets for recovery model validation.
Despite the scarcity of empirical recovery data, it is important to validate regional recovery models by comparing their predictions to the recovery dynamics observed after a real disaster. This has been done in only a few published studies. Constrained postearthquake recovery resources have been modeled with stochastic queuing models by Alisjahbana and Kiremidjian (2020). The model was used to simulate the housing recovery after the 2018 Lombok, Indonesia, earthquake. Model parameters were calibrated using the housing recovery data from the considered event for a single region, followed by a comparison of the predicted and observed recovery trajectories for the remaining affected regions. Longman and Miles (2019) used the DESaster recovery simulation library to model the recovery of 100 houses damaged by the 2015 Nepal earthquake and compared their predicted state 2 years after the earthquake with the collected recovery data. Nejat et al. (2020) calibrated a spatial logistic regression model using the data collected by interviewing affected single-family households to predict the household recovery decisions in Staten Island, New York, following Hurricane Sandy in 2012. Aghababaei et al. (2020) validated and updated recovery time fragility functions using the data collected in a 5-year longitudinal study of the Joplin, Missouri, community following a 2011 tornado. Similarly, Wang and van de Lindt (2021) validated a regional recovery model against the field data pertaining to 1,874 buildings repaired after the 2011 Joplin, Missouri tornado, considering both the delay times and the repair times conditioned on the building inhabitants’ incomes.
In the early aftermath of a damaging earthquake event, regional recovery predictions may provide valuable, although uncertain, information for planning and execution of various recovery efforts. Considering the continuous inflow of ground-truth impact data is crucial to ensure that decision makers get up-to-date recovery model predictions. Results from the first few days of a safety screening and damage assessment campaign, for instance, provide valuable information on the inflicted damage. Yet, most recovery modeling studies focus on the immediate postevent state, and do not consider inflow of damage information from inspections (e.g., Costa et al. 2021; Nasrazadani and Mahsuli 2020). Very few studies modeled the recovery process by considering dynamically evolving damage data (Tomar et al. 2022).
In this paper, we illustrate how a regional recovery model, based on the bottom-up demand/supply-based iRe-CoDeS framework, is constructed to simulate the recovery of residential buildings following a real event, the 2010 Kraljevo, Serbia, earthquake. We choose the iRe-CoDeS recovery framework due to its ability to account for the local context by including different building-level recovery trajectories and capturing the recovery resource constraints. Apart from recovery resource constraints, the bottom-up demand/supply approach is used to simulate the dynamic interdependencies among infrastructure systems: component interactions depend on the flow of services and resources among components and can change dynamically during the recovery time (Blagojević et al. 2022f). Notably, component interactions are not based on static one-to-one dependency relation defined before the event. Furthermore, the iRe-CoDeS-based regional housing recovery model extends the well-established regional disaster risk assessment methodology and uses tangible quantities that can be reliably estimated through expert opinion as recovery model parameters. The proposed iRe-CoDeS-based residential housing recovery model presented herein has three advantages: first, it can dynamically assess the effect of infrastructure failure on building’s functional recovery (Blagojević et al. 2022f, g) and access to repair (Blagojević et al. 2021a); second, it can be dynamically updated using the incoming stream of building damage inspection data (Bodenmann et al. 2023, 2021); third, the outputs of this iRe-CoDeS-based regional housing recovery model can be used to probabilistically assess community resilience goals (Blagojević et al. 2022c, d) and shape effective resilience-improving measures (Blagojević et al. 2022e; Blagojević and Stojadinović 2022).
This paper starts with an overview of the iRe-CoDeS-based regional housing recovery model. Then, a method to improve estimates of regional housing recovery using early inspection data is introduced. Finally, the proposed framework for recovery prediction is applied in a case study based on the 2010 Kraljevo earthquake, a 5.4 magnitude event that caused damage to about 16,000 buildings, resulted in two fatalities, and required about 2 years of recovery efforts. The 2010 Kraljevo case study shows how parameters of an iRe-CoDeS regional housing recovery model can be obtained by consulting experts and using scarce empirical data. Furthermore, recovery predictions obtained from the iRe-CoDeS model are compared to the postevent data in an effort to validate the model and identify its main shortcomings. Importantly, the iRe-CoDeS regional housing recovery model can be integrated with methods that use early-arriving damage inspection data to update the damage predictions on the regional level, showing how such immediate and continuous postevent updating can be used to reduce the uncertainty in recovery time predictions.
Regional Recovery Modeling Workflow
To model regional recovery, this study employs a bottom-up simulation workflow that is based on three main components: exposure information, the estimation of physical damage, and finally, the recovery simulation. These components are explained below, with a particular focus on recovery simulation.
The bottom-up prediction of earthquake-induced damage and the subsequent recovery process requires high-resolution exposure information. Such information is compiled from multiple sources and, in many cases, additionally relies on predictive models to estimate building attributes that are not directly available in existing databases (Pittore et al. 2018; Crowley et al. 2020; Diana et al. 2019). Physical damage to buildings and infrastructure systems’ components is then quantified using sequential, collectively exhaustive, and mutually exclusive damage states, ranging from no damage to complete damage, and estimated via a well-established simulation workflow. First, conditional on the earthquake rupture characteristics, ground-motion intensity measures (IMs) at the building or component locations are sampled from their joint multivariate log-normal distribution (Jayaram and Baker 2008). Then, conditional on the sampled IM, damage states are drawn from a categorical distribution, where the individual probabilities are derived from fragility functions (Crowley et al. 2021b).
Once the damage of buildings and infrastructure systems’ components, labelled together as components, considered in the regional recovery analysis is estimated, the recovery of each component is simulated as a sequence of recovery activities, related to delay and repair times (Blagojević and Stojadinović 2022). Such a sequence is conditioned on the component’s characteristics (e.g., occupancy type, ownership structure) and its initial postdisaster damage. Each recovery activity is characterized by its preceding activities that need to be completed before the activity can start, resource demand, representing the resources required to perform the activity, and duration, the amount of time needed to finish the activity once it starts.
In the iRe-CoDeS framework, interactions among components are simulated at each time step of the recovery simulation as a flow of various resources among components. Such an approach is used to capture recovery resource constraints (Blagojević and Stojadinović 2022), dynamic component interdependencies and cascading effects (Blagojević et al. 2022f), access to repair (Blagojević et al. 2021a), the effect of infrastructure systems on building’s functional recovery (Blagojević et al. 2022g), and estimate the components’ resource consumption to assess system’s ability to meet its resilience goals (Blagojević et al. 2022c). To capture the listed aspects of regional recovery, each component is characterized by its supply, operation demand, and recovery demand. Resource supply at a certain time step represents the amount of resources that the component is providing to other components and depends on component’s state of damage and its operation demand fulfillment at that time step. The component’s recovery demand consists of all resources that a component needs for its recovery activities to progress at a certain time step of the recovery simulation. In the same manner in which the component’s supply is conditioned on component’s operation demand fulfillment, the progress of recovery activities is conditioned on the recovery demand fulfillment.
The steps to define an iRe-CoDeS regional recovery model are outlined in an earlier report (Blagojević et al. 2022f) and summarized here. To construct an iRe-CoDeS recovery model, the spatial limits of the considered region need to be first defined, followed by the selection of systems (e.g., infrastructure systems and/or housing) and the resources to be considered in the analysis. Then, components of each system are characterized by their predisaster supply and operation demand, and a set of functions that describe how their physical damage and interdependencies affect their postdisaster supply and operation demand. Finally, component recovery models are adopted to simulate the increase in their functionality over the recovery period.
The parameters required to define the recovery model of a building or a component are the recovery activities sequence and the duration and resource demands for each recovery activity. Such information can be found in the literature (FEMA 2018, 2020; Terzić et al. 2021), but the sources are region-specific. For regions where no systematic data collection was done, the recovery activities sequence, duration, and resource demands can be obtained through expert elicitation and/or empirical data. While recovery activities sequences are usually defined based on the adopted recovery plans or the experience from past events, most recovery models do not explicitly consider the effect of regional resource constraints (e.g., Almufti and Willford 2013). In such models, the estimated duration of recovery activities includes both the time that the building waits to obtain a resource, the waiting time, and the actual duration of the activity (the time needed to perform the activity once the resources it needs are provided). The waiting time is context-specific and depends on the regional supply and demand for recovery resources, access to repair, and building’s priority for resource allocation. Such a complex variable is difficult to reliably assess only through expert opinion. To alleviate this issue in iRe-CoDeS, the waiting time of a recovery activity is explicitly captured by simulating the flow of recovery resources among damaged buildings and conditioning their recovery on their recovery demand fulfillment. Thus, in iRe-CoDeS, the experts need to estimate the actual duration of an activity, which, according to our experience, the experts can estimate with less uncertainty. Furthermore, this estimate is transferable to similar regions. To simulate the waiting time, the information on regional supply, buildings’ resource demand, and resource allocation priority is needed. A building’s resource demand can be reliably estimated using expert opinion (e.g., how many engineers are needed to inspect a building or how many workers are needed for repairs), while a building’s resource allocation priority depends on the selected resource allocation strategy, and is an input to the regional recovery model. The regional supply of recovery resources can also be estimated using expert opinion, the data on the regional workforce availability, or data from recent events in the considered region. Therefore, in iRe-CoDeS an effort is made to define the recovery model parameters as tangible quantities that can be reliably estimated or defined based on the adopted recovery plans and are transferable to other regions, while allowing disaster management decisions to be incorporated as model inputs.
Updating Regional Recovery Predictions Using Early Inspection Data
In the immediate aftermath of an earthquake, regional recovery predictions rely on model-based estimates of earthquake-induced damage. The precision and accuracy of such damage estimates depend on the density of the seismic network used to constrain the uncertainty in the geographic distribution of ground-motion IMs, the available exposure information, and on how well the fragility functions reflect the seismic behavior of the local building stock, among other inputs. Recently, Bodenmann et al. (2023) proposed to use Gaussian process (GP) models for a dynamic updating of regional damage estimates using observed damage data from early inspections.
The proposed method leverages building inspection data to update the initially specified fragility functions and to constrain the uncertainties of the ground-motion IM geographical distribution. Namely, the random field of logarithmic ground-motion IMs is expressed as a function with a GP prior (Rasmussen and Williams 2006), whose mean and covariance functions are specified using ground-motion and spatial correlation models. Then, variational inference is used to compute updated fragility functions, as well as an approximate posterior distribution of the ground-motion IM conditional on the observed damage data from building inspection. Finally, the posterior predictive distribution of the ground-motion IM is computed for the locations of buildings that have not yet been inspected. Generating correlated samples from that distribution, in combination with the updated fragility functions, leads to improved regional damage estimates (Bodenmann et al. 2023).
Case Study: 2010 M5.4 Kraljevo Earthquake
On November 3, 2010, at 1:56AM local time, a 5.4 magnitude earthquake struck the municipality of Kraljevo, Serbia (Antonijević et al. 2013). The epicenter was located close to the center of the city of Kraljevo, which, in 2010, housed more than half of the 120,000 people living in the entire region. The earthquake claimed 2 casualties and 180 injuries. Around 16,000 houses and 8,500 multifamily dwelling units were damaged (UN 2011; RTS 2011).
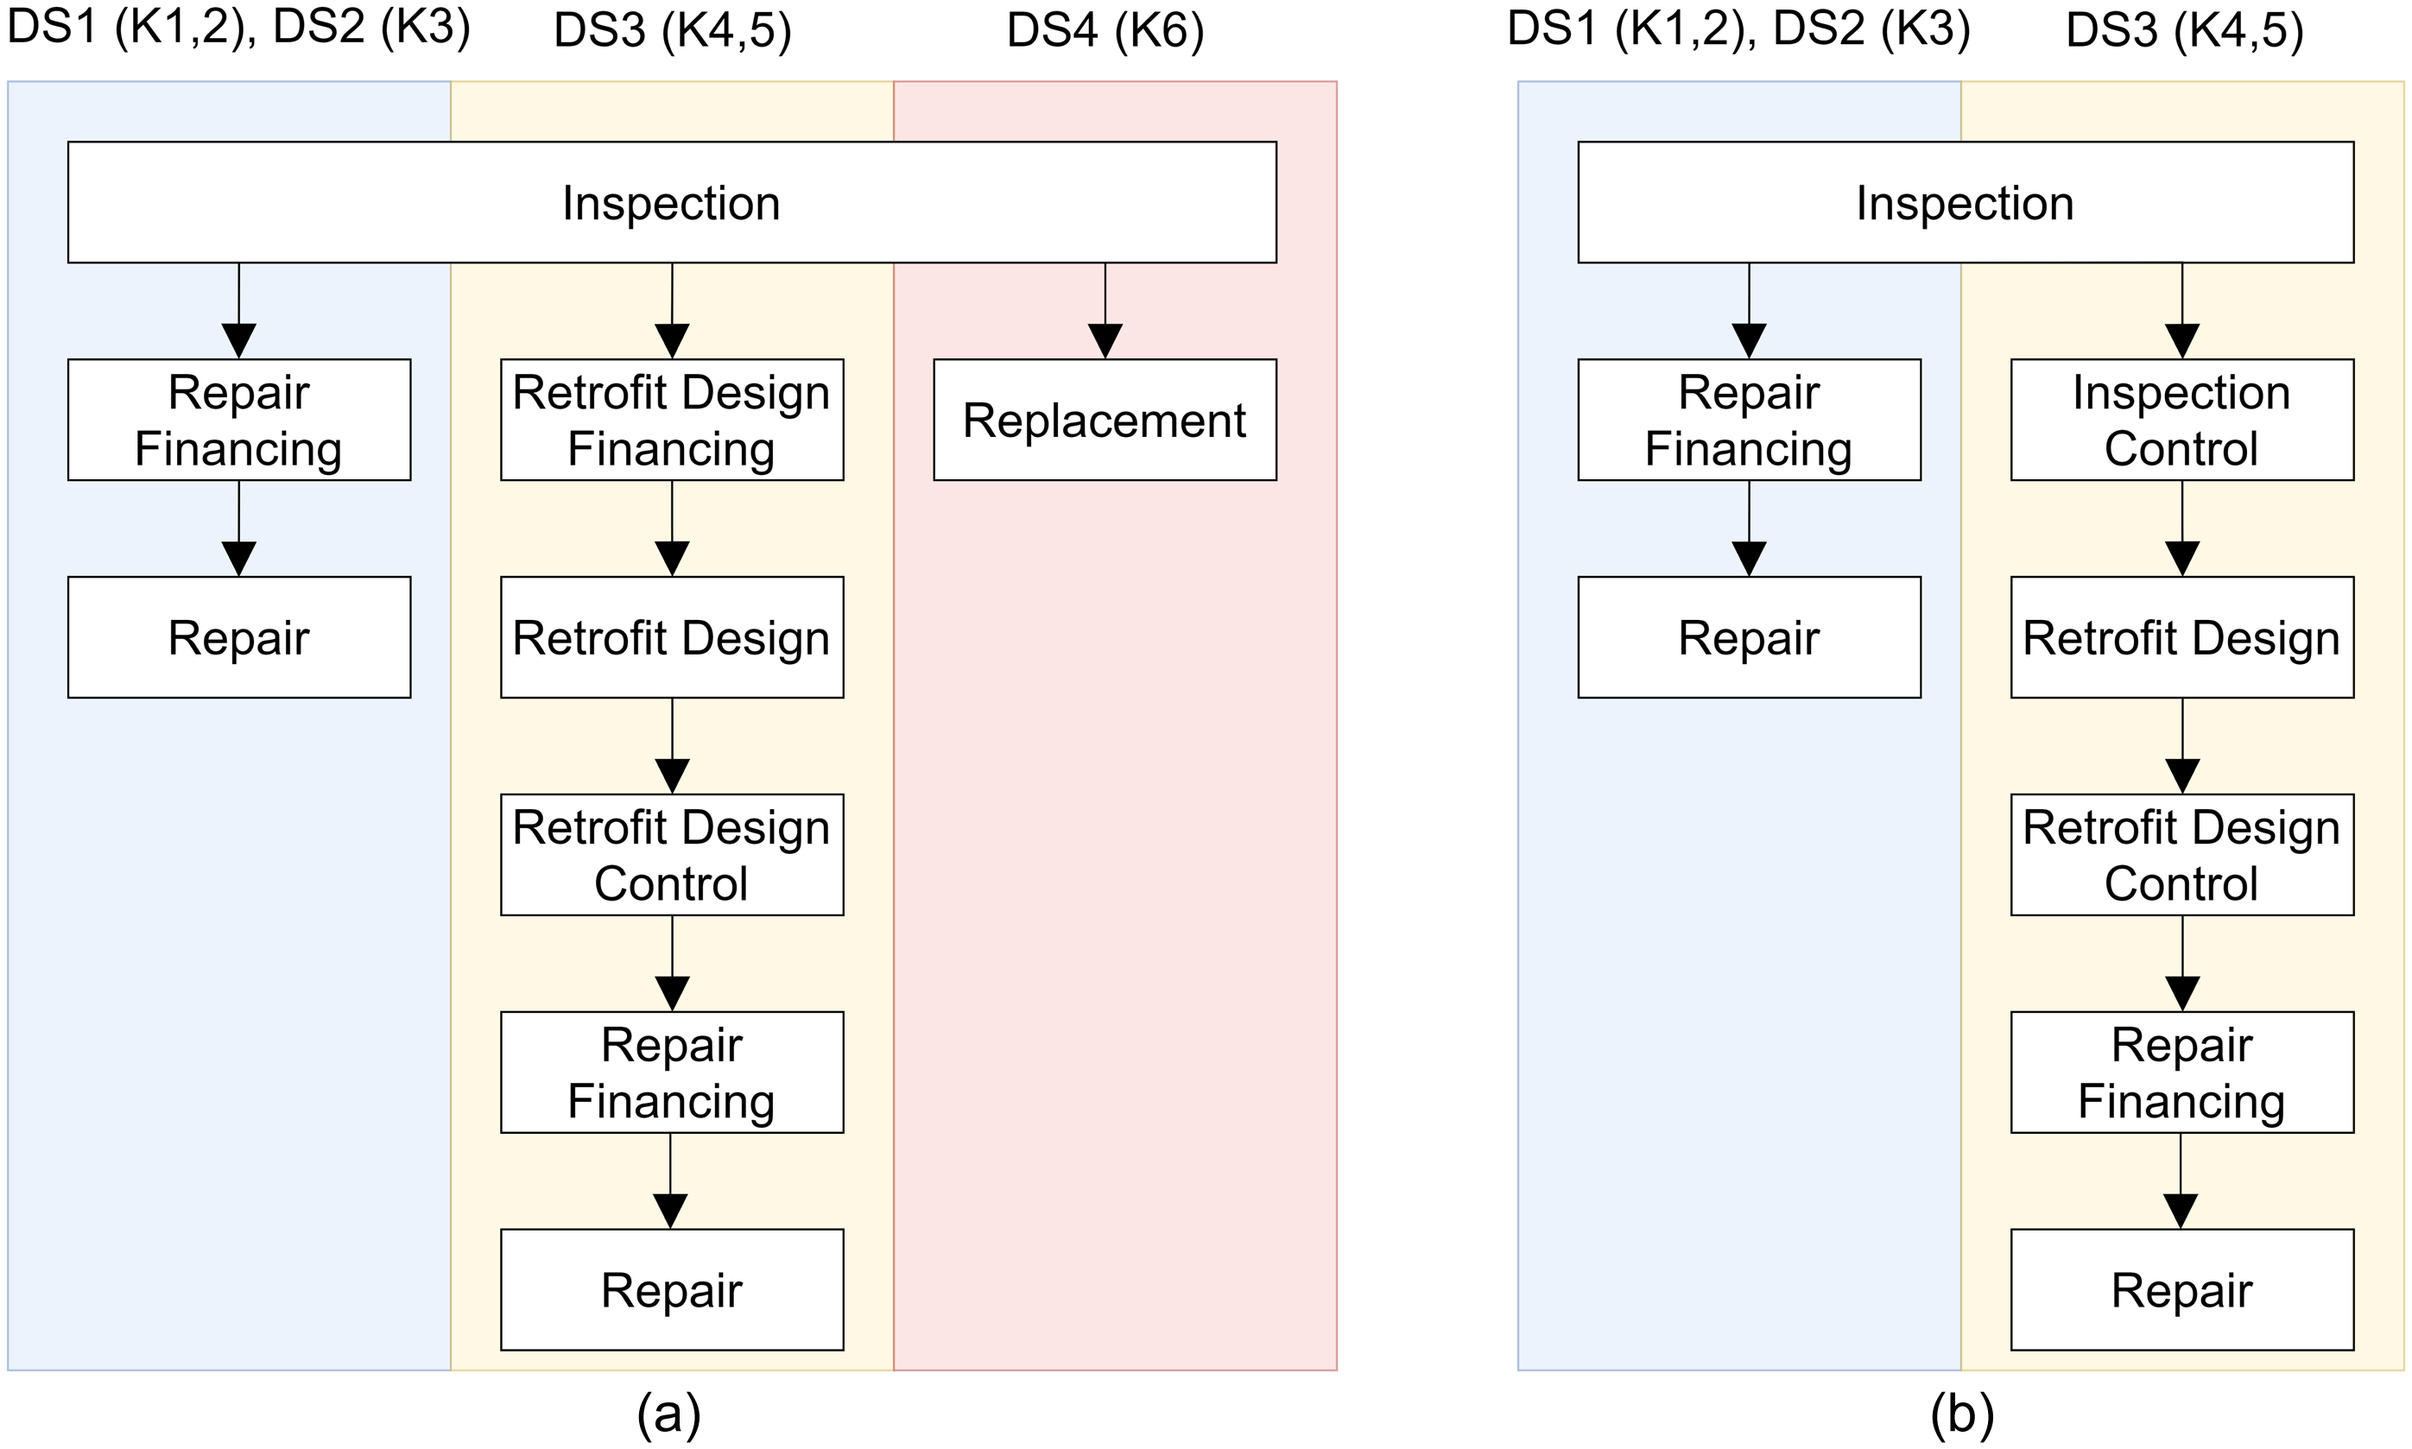
Immediately after the earthquake, local civil engineers and architects started a rapid damage inspection with the goal to assess the life safety of buildings (Marinković et al. 2018). Supported by the academic staff from Serbian universities, official building damage assessment documents were developed and the damage estimation process was initiated about 10 days following the event. The damage estimation reports specified the building damage category, which served as the basis for subsequent recovery decisions and actions (Marinković et al. 2018; Manić and Bulajić 2012). Specifically, building damage was classified into six categories conditioned on the damage state of structural and nonstructural building components and the extent of the required repair activities: buildings in the first three categories (K1,2,3) experienced primarily nonstructural damage that did not require major repairs; buildings in categories K4 and K5 needed structural repairs; finally, buildings in category K6 required demolition and replacement. For the purpose of this study, this custom-developed damage scale (K1 to K6) was reduced to four damage categories (DS1 to DS4), following Stojadinović et al. (2021) and Blagojević et al. (2021b): K1 and K2 are combined into DS1, K3 is mapped to DS2, K4 and K5 are lumped into DS3, and K6 is mapped to DS4.
This case study focuses on the recovery of the residential buildings, which was organized by the municipal government. The supporting infrastructure (i.e., electric power, water, and communication systems) was not severely affected in this earthquake event and was not considered in this regional recovery model. The postearthquake habitability of the damaged buildings was addressed first: all DS4 buildings and a small percentage of DS3 buildings were evacuated. No multifamily residential buildings were identified as unsafe. Following inspections, recovery activities for damaged residential buildings continued, with the recovery activity sequence depending on the damage category and the ownership structure (single-family versus multifamily buildings). Repair financing procedures were established after the earthquake and were also conditioned on building’s damage category and ownership structure. Repair financing procedures for single-family buildings that experienced only nonstructural damage evolved over the first couple of months after the earthquake until the payment of a fixed amount, conditioned on building damage, was adopted. Owners of single-family buildings that experienced structural damage were first provided with the funds for repair design, which also resulted in a bill of quantities used as the basis for the second payment intended to fund the repair work. The local government prioritized and led the replacement of completely damaged (DS4) single-family buildings as well as the repair work for damaged multifamily buildings, fully funded by the state government. Owners of DS4 single-family buildings received prefabricated houses that were installed on the foundations built on the land they own. Erection of these prefabricated houses was often done before the demolition of the damaged houses, as some owners prevented the demolition teams from accessing their premises. Marinković et al. (2018) concluded that the delays due to financing prolonged the recovery process by a couple of months. An important recovery impeding factor was the winter weather: although the earthquake occurred in November 2010, the majority of recovery activities started only in spring 2011. These included mostly nonurgent nonstructural repairs, while structural repairs of buildings with impaired safety were performed as soon as possible.
Components of the regional housing recovery model and simulation for the 2010 Kraljevo earthquake are explained next. We start with exposure modeling and a brief description of the regional building stock. Then, we present the damage estimation model and the method used to update the postearthquake damage estimates using early-arriving damage inspection data. We continue with a detailed description of the regional housing recovery model and the data used for its validation. This section concludes with a comparison of the damage estimate and recovery model results to the observed data.
Exposure Modeling
The bottom-up exposure model builds upon official GIS data provided by the Kraljevo municipality (City of Kraljevo 2022). From this data, we extracted the following: the footprint polygons of 57,500 buildings in the Kraljevo region, which we reduced to their geo-coordinates (placed at the centroids of the polygons), shown in Fig. 1(a); the footprint area; and the building density (defined as the number of buildings within 1 km distance from the building). The latter served as a proxy to separate urban, suburban, and rural areas.
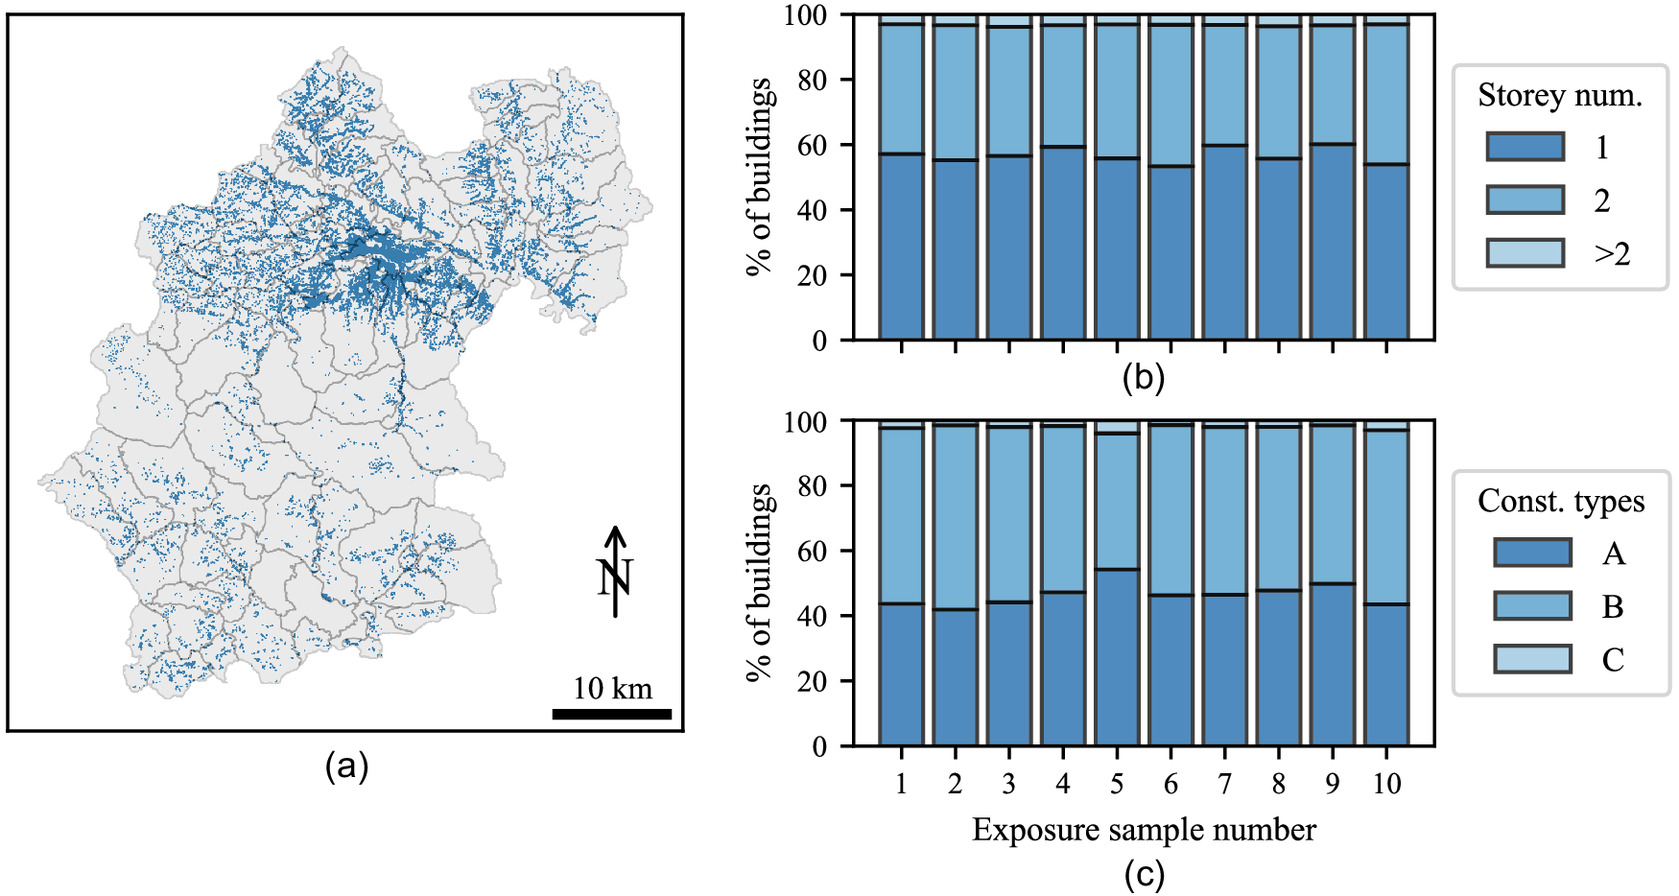
The regional housing recovery model requires the following additional building attributes: the number of stories, the construction type, and the occupancy type. We gathered this data using remote visual screening of about 1,600 buildings using Google Street View (Anguelov et al. 2010). Buildings were classified in three construction types: masonry buildings without and with vertical confinement (types A and B); and reinforced-concrete (RC) structures (type C). The simplified typology was adopted to limit subjectivity in attributing construction types based on visual inspection of the building exteriors. Refined construction type classifications for the Kraljevo building stock can be found in previous studies (Marinković et al. 2018; Manić and Bulajić 2013). The occupancy types were single-family and multifamily residential buildings and other buildings (such as schools and industrial and military facilities).
The required attributes (e.g., occupancy type) were linked to available attributes (e.g., floor area) via multiple sequential predictive models using the 1,600 screened buildings as training data. Each model comprises a latent function to which a GP prior is assigned with a constant mean. The covariance function of the GP prior includes a spatial term that assigns higher correlation for geographically close buildings and additive terms that measure similarity with respect to the remaining inputs, such as the floor area (Bodenmann et al. 2021). Conditional on the latent function, the attributes (e.g., the occupancy types) were assumed to be independent. Finally, the trained GP models were used in a conditional and sequential simulation workflow to sample missing attribute values for the entire building database. Specifically, the number of stories of a building was sampled, followed by conditional sampling of the construction and occupancy types.
Within the simulation workflow, we generated samples from the joint distribution of latent function variables for buildings with missing attributes. Fig. 1(b) shows the percentage of single-story, two-story, and multistory buildings for 10 sampled exposure sets, while Fig. 1(c) reports the percentages of predicted construction types. Although the lack of detailed and region-specific census data hinders a direct validation of the produced samples, the high percentage of single- and two-story buildings are in agreement with the 2011 Serbian census, where low-rise single-family buildings constituted 95% of the national residential building stock. Similarly, the prevalence of masonry construction, types A and B in Fig. 1(c), is a consequence of widespread use of this material for construction of low-rise buildings in this region (Blagojević et al. 2021b). In addition, the European Seismic Risk Model (ESRM20) (Crowley et al. 2021b) exposure model (Crowley et al. 2021a) contains over 98% of buildings with less than four floors and predicts 61% unreinforced and 23% confined masonry buildings.
Damage Estimation Model
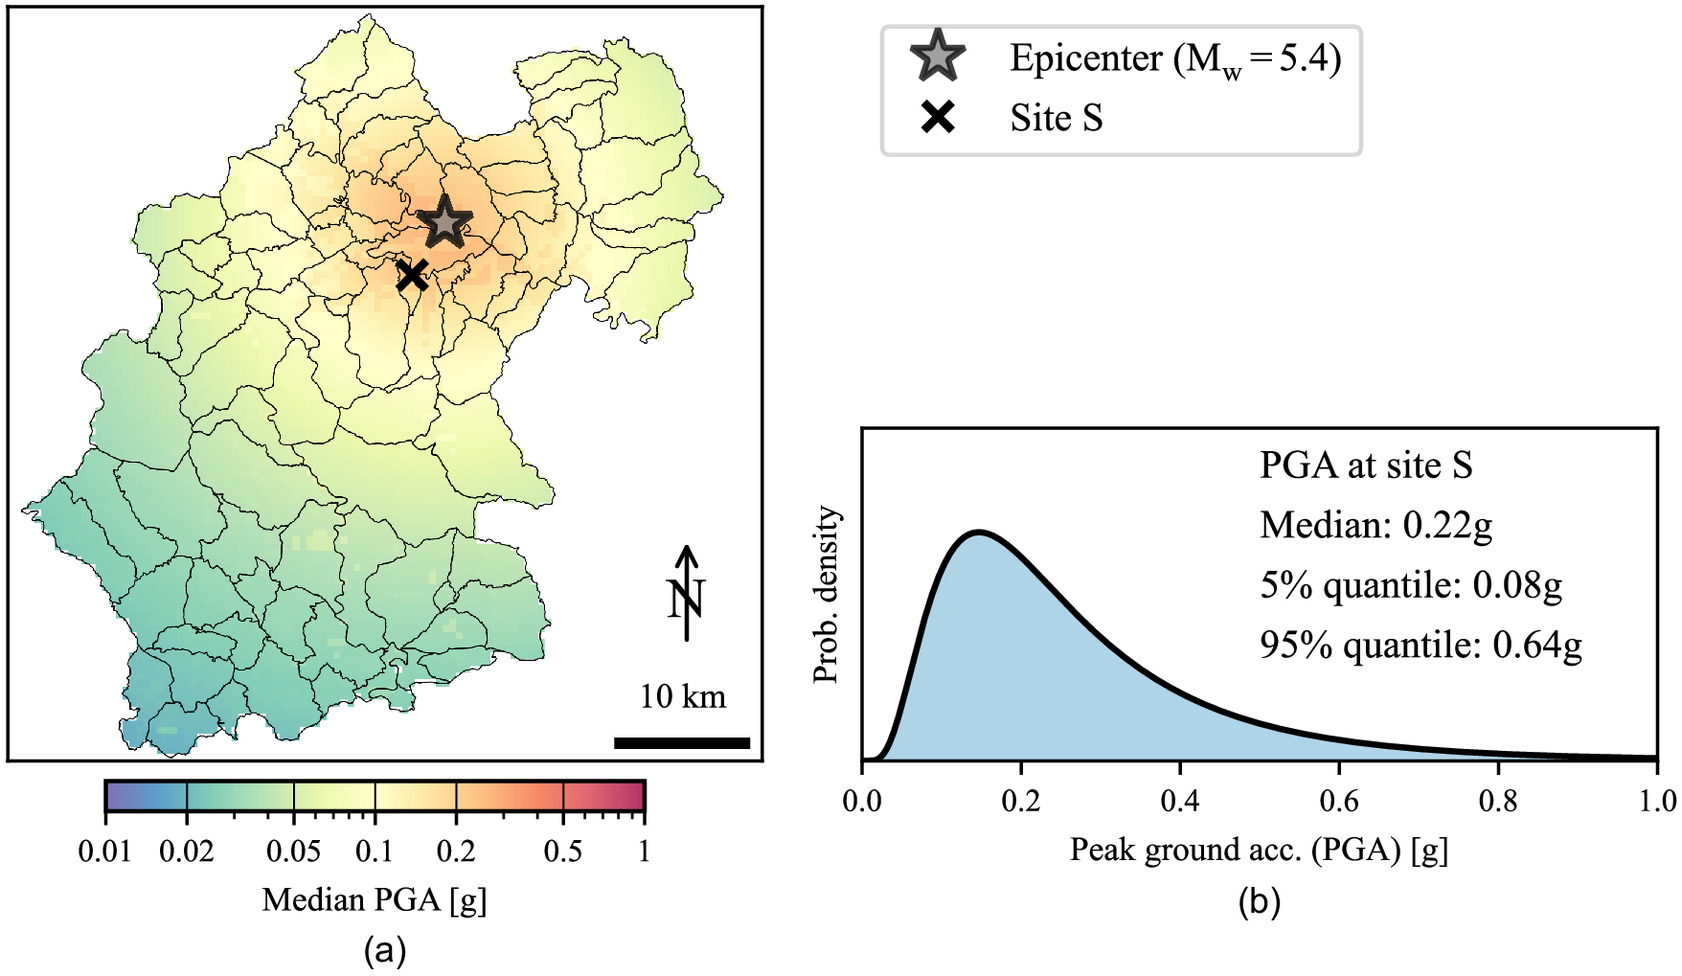
The spatial distributions of ground-motion IMs were obtained using an empirical GMM (Akkar et al. 2014) and a spatial correlation model (Esposito and Iervolino 2011). Based on Antonijević et al. (2013), who performed an in-depth seismotectonic study of the 2010 Kraljevo earthquake, the event characteristics, consisting of the location of the epicenter and the focal mechanism (strike-slip), were defined. We modeled a point source and used the epicentral distance as a source-to-site distance metric. Despite well-known limitations, the peak ground acceleration (PGA) served as the ground-motion IM. EuroCode8 soil classes were deduced from surface geology maps available for the Kraljevo municipality (City of Kraljevo 2022). For soil classes A, B, and C, we assigned values of 800, 525, and for the time-averaged shear-wave velocity to a depth of 30 m, , . Fig. 2 shows a map of the predicted median PGA and illustrates the marginal distribution of PGA at a single site. The range between the 5th and 95th percentiles, from 0.08 g to 0.64 g, highlights the considerable uncertainty associated with PGA. The lack of recordings from nearby seismic network stations hinders further uncertainty reduction.
Building damage states were sampled, conditional on PGA, using analytical fragility functions from ESRM20 (Romão et al. 2021). These fragility functions are defined for slight (DS1), moderate (DS2), extensive (DS3), and complete (DS4) damage. Masonry buildings without vertical confinement (type A) were mapped to unreinforced masonry buildings (MUR-LWAL-DNO), whereas those with vertical confinement (type B) are mapped to confined masonry buildings with low ductility (MCF-LWAL-DUL). Finally, RC buildings are mapped to RC buildings with a dual frame/shear wall lateral-load-resisting system and low ductility (CR-LDUAL-DUL).
Although the chosen fragility function mapping reflects discussions with local experts, fragility functions developed for applications on a continental scale lack a local calibration. Nevertheless, ESRM20 fragility functions were chosen in this case study because region-specific fragility functions are not available yet.
Updating Postearthquake Damage Estimates
The original updating method, presented in Bodenmann et al. (2023), assumes that inspection data are available for a randomly chosen subset of the buildings and that the likelihood of the data conditional on GP function values is identical to the fragility functions. However, in this case study, the data set of georeferenced inspection results available to the authors is limited to damaged buildings (i.e., ), which means that the evidence of absence of damage is missing in the data set. To account for this sampling bias, we condition the likelihood on the event that . This conditional, or truncated, likelihood is used to infer the approximate posterior of PGA and to estimate fragility function parameters. To predict the damage states of not-yet inspected buildings, we employed the nontruncated version.
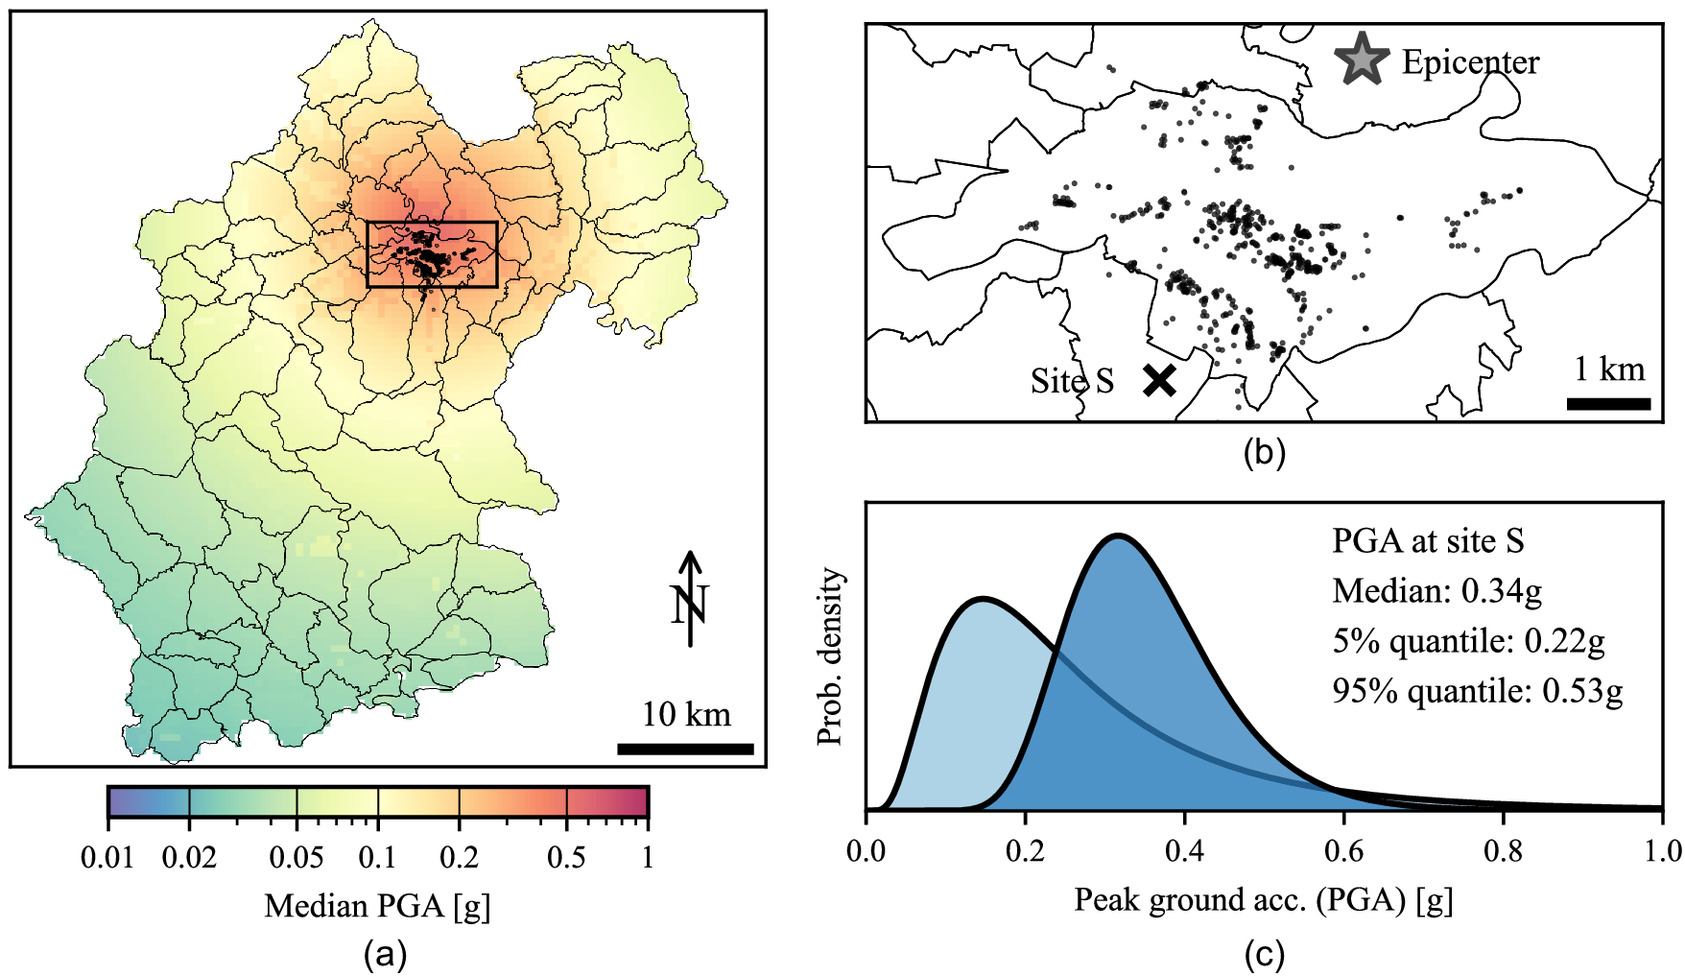
Geolocated inspection results are available for about 600 damaged buildings, mostly located in the Kraljevo city district, as shown in Fig. 3(b). This database was assembled and made publicly available by Stojadinović et al. (2021). It mapped the custom-developed damage scale of Kraljevo (K1 to K6) to four damage categories (DS1 to DS4), as explained earlier in this section. The map in Fig. 3(a) shows the median of the posterior predictive PGA, whereas panel Fig. 3(c) shows the uncertainty reduction in the marginal distribution of PGA at site S.
iRe-CoDeS Regional Housing Recovery Model
Recovery of the Kraljevo region following the 2010 earthquake was simulated using a model developed within the iRe-CoDeS framework (Blagojević et al. 2021a; Blagojević and Stojadinović 2022). In this case study, spatial bounds of the model are defined as the bounds of the Kraljevo region. The components are the 57,500 residential buildings contained in the exposure model. Considered resources in the iRe-CoDeS model are shelter and recovery resources, such as inspectors (Insp.); control engineers (CE); finances; engineering design teams for single-family (ETSF) and for multifamily buildings (ETMF); workers to perform minor, mostly nonstructural, repairs () on buildings in DS1 and DS2; and workers for major, mostly structural, repairs () on buildings in DS3. Residential buildings supply shelter services and require recovery resources to regain their functionality.
Activities required to recover a damaged building following the earthquake, as well as duration and the recovery resources required for the progress of these activities, are defined based on interviews with experts involved in the recovery of Kraljevo after the 2010 earthquake and the available literature. The consulted experts were experienced local engineers from private and public institutions, who either organized or participated in the recovery effort and were willing to share their experience. The interviews consisted of in-person discussions and written questionnaires created by the authors. The activities considered in the recovery model are not exhaustive; rather, they represent the subset of activities that are considered most important for recovery of residential buildings. For example, inspection of buildings involved two rounds: life-safety and damage assessment. However, for some buildings both inspections were done in a single visit, while others were visited twice. In the recovery model, both activities are treated as a single activity labeled Inspection. The deterministic recovery activity sequences shown in Fig. 4 were recreated based on interviews with the consulted experts.
The recovery resource demands for each recovery activity are presented in Tables 1 and 2 for single-family and multifamily buildings, respectively. A recovery activity progresses in a time step of recovery simulation (i.e., a day) if its recovery demands are met. The duration of recovery activities, representing the time needed to perform the activities once the required resources are allocated to the building, is presented in Tables 3 and 4. These values are time intervals, obtained from interviews with the experts, and are considered as bounds of uniform distributions used to sample the duration of these activities when simulating the recovery process using the iRe-CoDeS regional housing recovery model.
| Activity | Demand | |||
|---|---|---|---|---|
| DS1 | DS2 | DS3 | DS4 | |
| Inspection () | [0.2, 0.4] | |||
| Repair financing () | [191, 285] | [360, 400] | [4,400; 4,600] | — |
| Retrofit design financing () | — | — | [200, 400] | — |
| Retrofit design () | — | — | 1 | — |
| Retrofit design control () | — | — | 1 | — |
| Repair (, ) | [1, 2] | [2, 3] | [3, 6] | — |
| Replacement | — | — | — | — |
Note: — = not applicable or not considered.
| Activity | Demand | |||
|---|---|---|---|---|
| DS0 | DS1 | DS2 | DS3 | |
| Inspection () | 3 | |||
| Inspection control () | — | — | — | 4 |
| Repair financing () | — | [200, 500] | [200, 500] | — |
| Retrofit design financing () | — | — | — | [200, 400] |
| Retrofit design () | — | — | — | 1 |
| Retrofit design control () | — | — | — | 1 |
| Repair (, ) | — | [5, 7] | [5, 10] | — |
Note: — = not applicable or not considered.
| Activity | Duration (days) | |||
|---|---|---|---|---|
| DS1 | DS2 | DS3 | DS4 | |
| Inspection | 1 | |||
| Repair financing | [1, 2] | [1, 2] | [7, 14] | — |
| Retrofit design financing | — | — | [1, 3] | — |
| Retrofit design | — | — | [7, 15] | — |
| Retrofit design control | — | — | 2 | — |
| Repair | [4, 5] | [5, 7] | [7, 15] | — |
| Replacement | — | — | — | [15, 30] |
Note: — = not applicable or not considered.
| Activity | Duration (days) | |||
|---|---|---|---|---|
| DS0 | DS1 | DS2 | DS3 | |
| Inspection | 3 | |||
| Inspection control | — | — | — | 1 |
| Repair financing | — | [1, 2] | [1, 2] | 7 |
| Retrofit design | — | — | — | [30, 60] |
| Retrofit design control | — | — | — | [4, 5] |
| Repair | — | [7, 10] | [7, 10] | [30, 45] |
Note: — = not applicable or not considered.
The supply capacity of the considered recovery resources (i.e., Inspectors, Engineers, and Workers) available to the Kraljevo region after the 2010 earthquake was challenging to estimate. Based on the information gathered from the experts, the supply of some resources is assumed as deterministic and constant, while for others a range of values is obtained and used to define uniform distributions, sampled in different realizations of the iRe-CoDeS regional housing recovery model.
The supply of Inspectors fluctuated during the recovery period (Manić and Bulajić 2012). Following interviews with experts involved in the recovery of Kraljevo, the daily supply of Inspectors was assumed to be between 50 and 100 in the first 60 days following the event and 10 to 20 afterwards (Table 5). CEs were senior local engineers that were responsible for inspection control and retrofit design control. While the number of CEs increased as the recovery progressed, evaluating the number of ETSFs involved in retrofit design of single-family buildings is challenging; thus, their supply capacity is assumed as unconstrained. Similarly, this study assumes that financing was readily available; thus, financing duration is related only to the administrative procedures required to obtain the funds (Tables 3 and 4). More details regarding repair financing are available in Stojadinović et al. (2017). The retrofit design for multifamily buildings was performed by several universities and one publicly- owned design office: the supply capacity of these institutions for ETMF is estimated to be between 16 and . The supply of workers repairing minor, nonstructural damage, , increased over time, as the weather conditions improved and workers from surrounding cities joined the recovery effort. Furthermore, it was common that owners of single-family buildings with mostly nonstructural damage (buildings in DS1 and DS2) did the repair work themselves with the help of their neighbors. The exact percentage of cases in which this happened is unknown; hence, for the purpose of this case study, a percentage of 70% was assumed following expert opinion, illustrating a high level of social cohesion. Thus, these buildings do not have a demand for . The supply capacity of workers needed to repair major, structural damage, , is assumed to be between 75 and . In addition, the recovery demand of DS4 single-family houses, apart from inspection, was not considered: due to well-organized recovery efforts, the replacement of such buildings with prefabricated houses was not reported to have been significantly delayed due to resource constraints. The supply and demand for building materials was not considered. The distribution of resources is simulated using the utility distribution method presented in Blagojević et al. (2022f). Based on the expert interviews, the prioritization for allocation of scarce resources considered in this regional recovery model, such as workers repairing structural damage, , was not clearly defined after the event. It seems that the allocation was on a first-come, first-served basis. Thus, building priorities were randomly assigned for each regional recovery simulation. No significant effect on the regional recovery results was identified as a consequence.
| Recovery resource | Supply capacity (per day) | |
|---|---|---|
| Inspectors (Insp.) | First 60 days | After |
| [50, 100] | [10, 20] | |
| Control engineers (CE) | First 60 days | After |
| 4 | [10, 12] | |
| Financing | — | — |
| Workers for minor repairs () | First 120 days | After |
| [50, 60] | [100, 120] | |
| Workers for major repairs () | [75, 100] | [75, 100] |
| Engineering team for single-family buildings (ETSF) | — | — |
| Engineering team for multifamily buildings (ETMF) | [16, 17] | [16, 17] |
Note: — = not applicable or not considered.
Case Study Recovery Validation Data
The data needed to validate the proposed regional housing recovery model were obtained from the publications on the 2010 Kraljevo earthquake and the information gathered from the engineers involved in the recovery process. Specifically, Marinković et al. (2018) analyzed the recovery of a subset (1,193 out of about 16,000) of damaged single-family residential buildings in all DSs. It is also important to note that this data set contains a reporting delay: thus, the reported recovery time for single-family buildings does not represent the actual recovery time, only its upper bound. The replacement process of DS4 single-family buildings was reported in several publications (IFRC 2010; UN 2011). This information is used to validate the building recovery rate in the iRe-CoDeS model. Manić and Bulajić (2012) documented the building inspection process, reported to have lasted about 6 months (Marinković et al. 2018). This information is used to validate the housing inspection rate. Finally, several sources reported the progress in recovering the housing shelter capacities: these data were compared with the shelter recovery process simulated using the iRe-CoDeS regional housing recovery model (Blagojević et al. 2022b).
It should be pointed out that the model validation performed in this case study is not a blind prediction, since a number of model parameters are calibrated a posteriori, based on expert interviews and reports. Furthermore, the recovery activities sequence (Fig. 4) was not planned before the earthquake, but was created ad hoc as the community was recovering. Yet, this sequence is used in this case study. The current state of research in community disaster resilience does not provide a viable alternative: there are no established methods or tools to predict the recovery sequence, the recovery rates for individual buildings or building types, the recovery resource demand of the buildings involved, and the community supply capacity for the recovery resources. If such data exist, they are specific to a region (e.g., FEMA 2020) and difficult to transfer to other regions.
Damage Estimation Results
Fig. 5 compares the predicted number of single-family residential buildings in the four DSs (i.e., ) obtained from the prior (initial) damage model to the predictions from the updated model, which uses the data from inspection of a subset of 600 damaged buildings (see Fig. 3). The reported 2010 Kraljevo postearthquake damage survey contains roughly 10,000 slightly, 2,800 moderately, 2,000 extensively, and 500 completely damaged single-family residential buildings. This comparison reveals that the prior damage model systematically underestimates the number of buildings in all four DSs. Updating it using limited inspection data increases the precision and accuracy of the damage estimates for all four DSs.
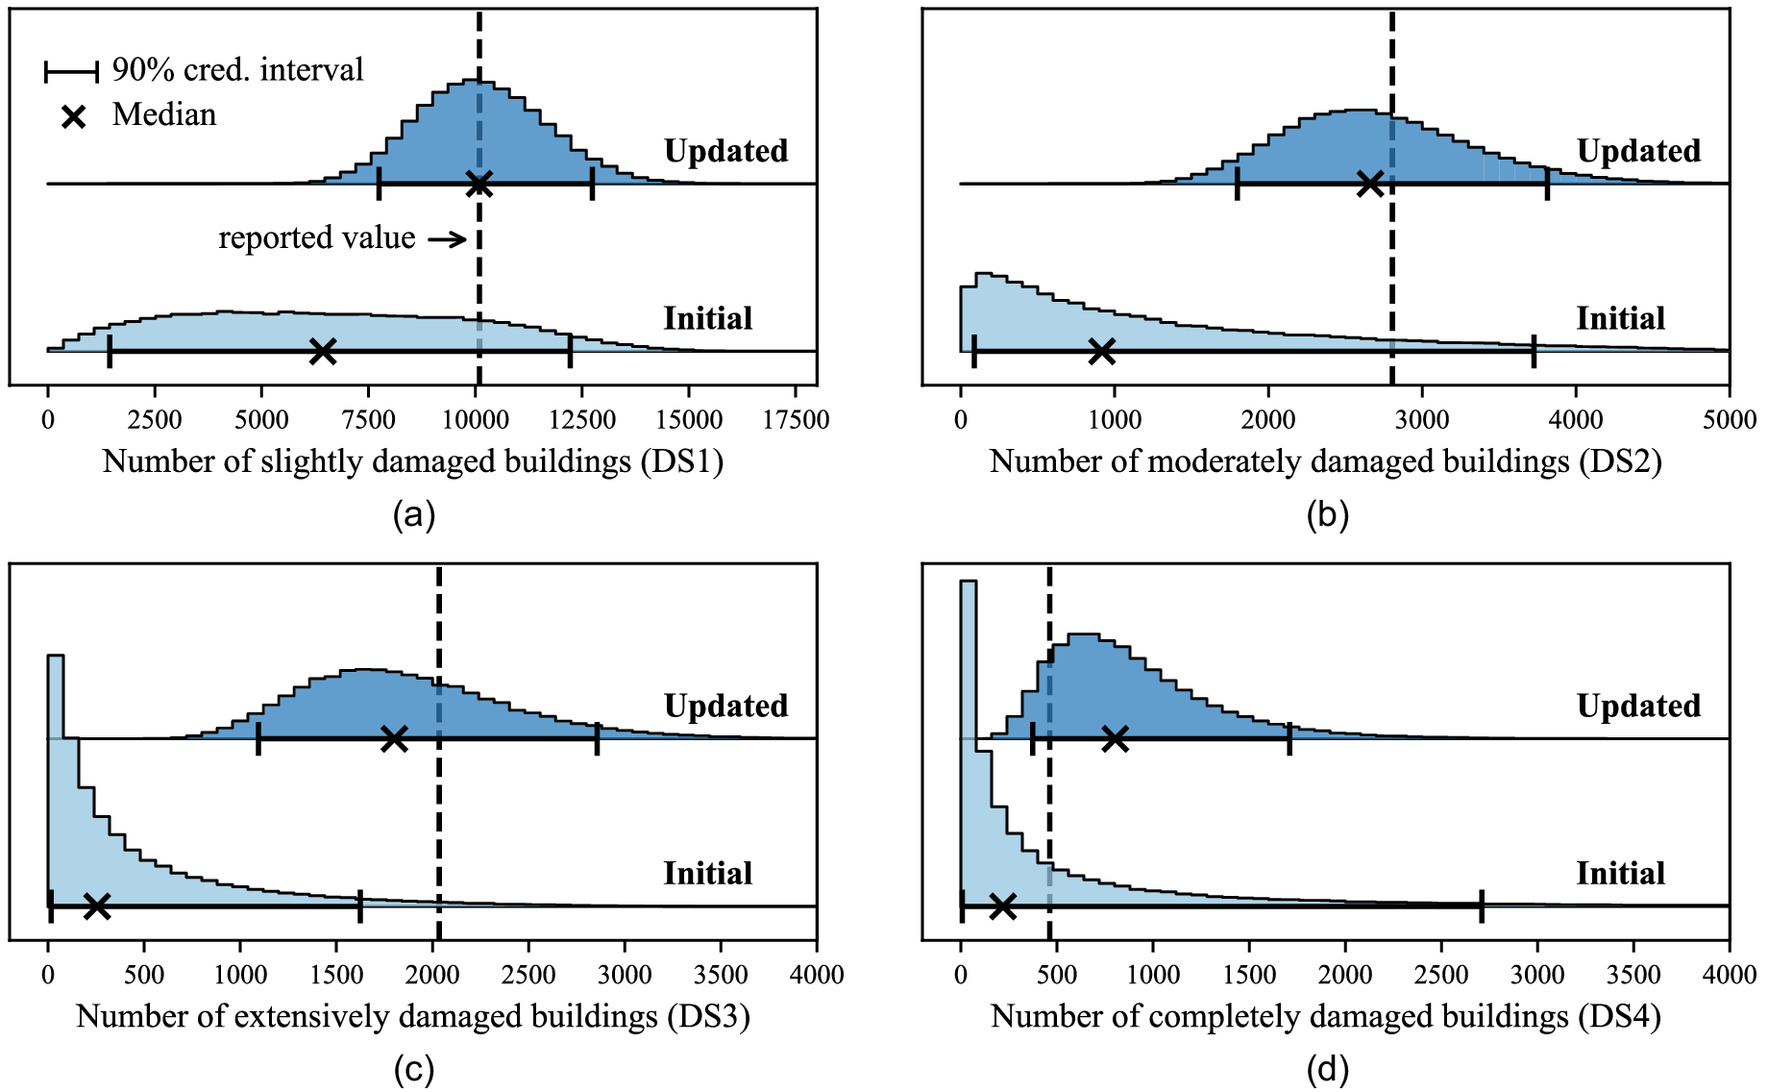
The results highlight the importance of updating the initial damage estimates using early-arriving inspection data. The accuracy of the initial model predictions may further improve if multiple ground-motion models are employed in a logic tree structure or if more efficient and sufficient IMs than PGA are used to estimate building damage for midrise and high-rise buildings. Furthermore, model accuracy could be improved if a more dense seismic instrumentation network is implemented, as well as if sufficient historic damage data are available to calibrate or validate region-specific building fragility functions.
iRe-CoDeS Regional Housing Recovery Model Results
Three damage estimation models are compared to illustrate the effect of conducting recovery simulations using the building damage obtained before, during, and after damage data collection. The reported damage (RD) model simply assigns building DSs such that the DSs ratios reported after the earthquake are preserved on the regional scale. The initial damage (ID) model assigns building DSs using the ground-motion IMs at the location of the building and the ESRM2020 fragility functions corresponding to the building type. The updated damage (UD) model starts with the ID model but profits from damage prediction updating using the early-arriving inspection data from 600 building (Fig. 5).
A total of 100 Monte Carlo simulations were conducted to compute the recovery trajectories for each of the three damage estimation models. These are compared to the available observed recovery trajectory data. In Figs. 6–9, the thin solid lines represent the results of 100 recovery simulations starting from the occurrence of the earthquake, while the thick solid lines represent the median and the thick dashed line, the 90% credible interval of the simulation data. The 100 simulations were run in parallel on the ETH Euler high-performance-computing cluster. Each simulation ran on a single-core 2.3-3.2GhZ CPU, required about 6 GB of memory, and took about 30 min.
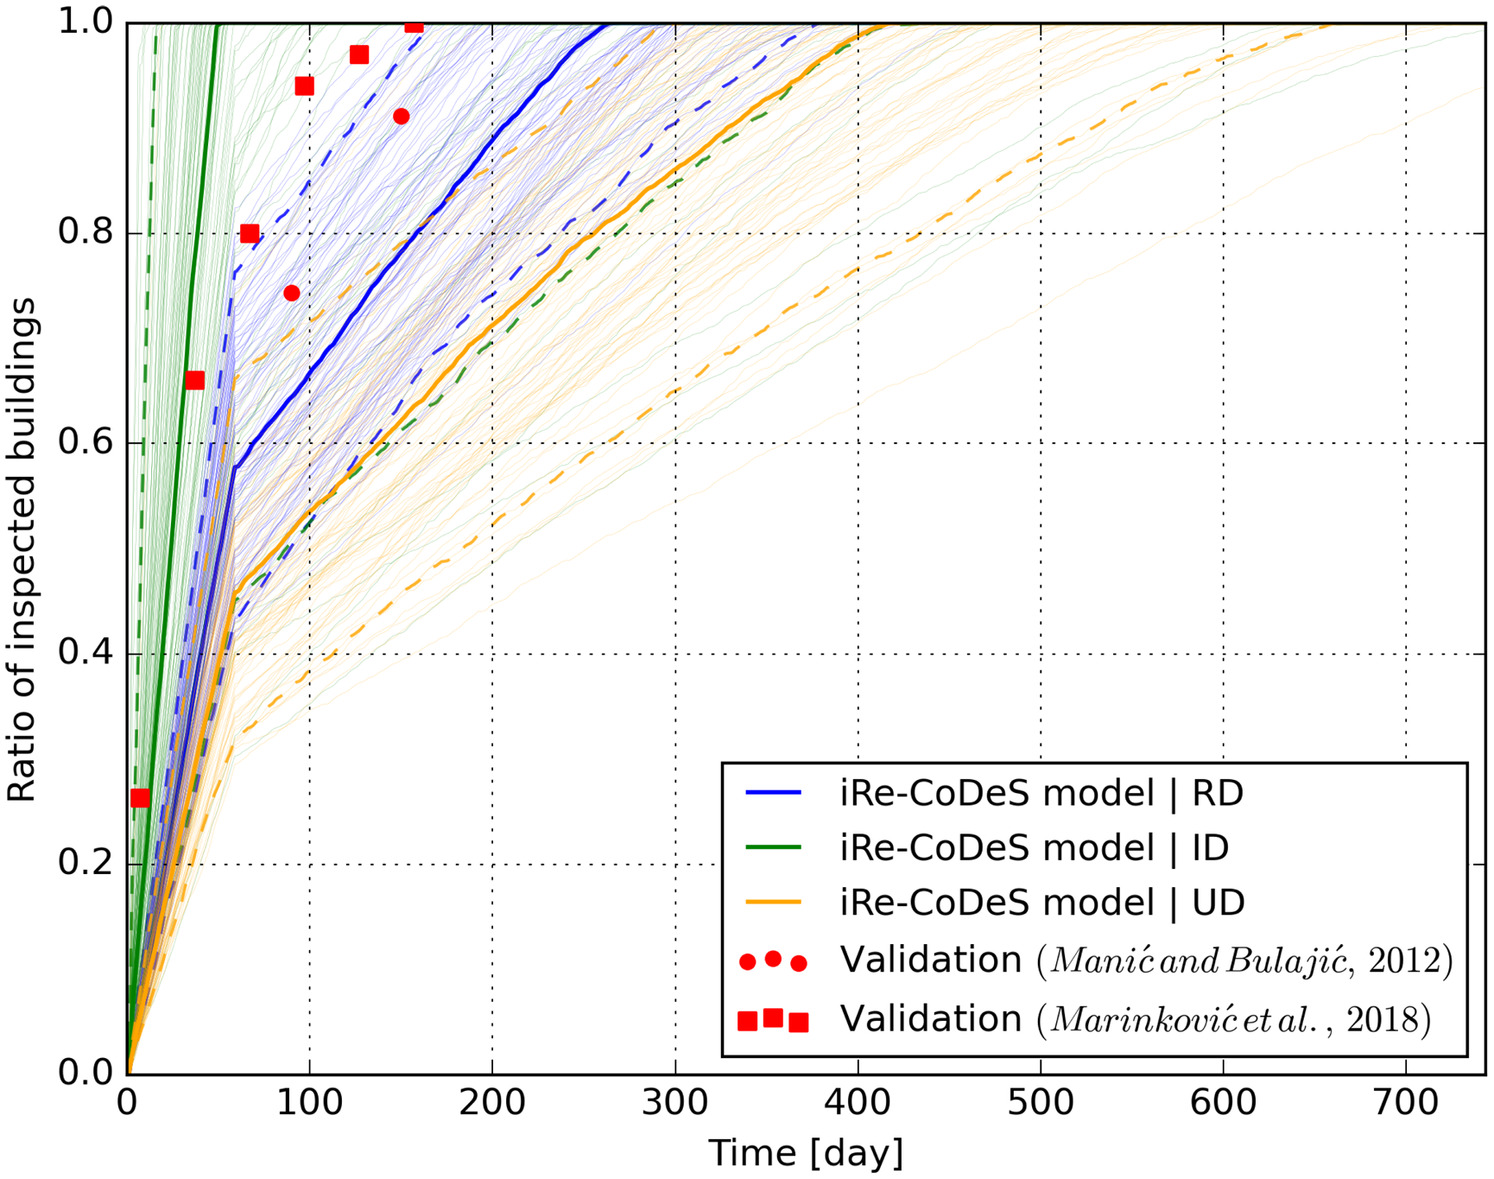
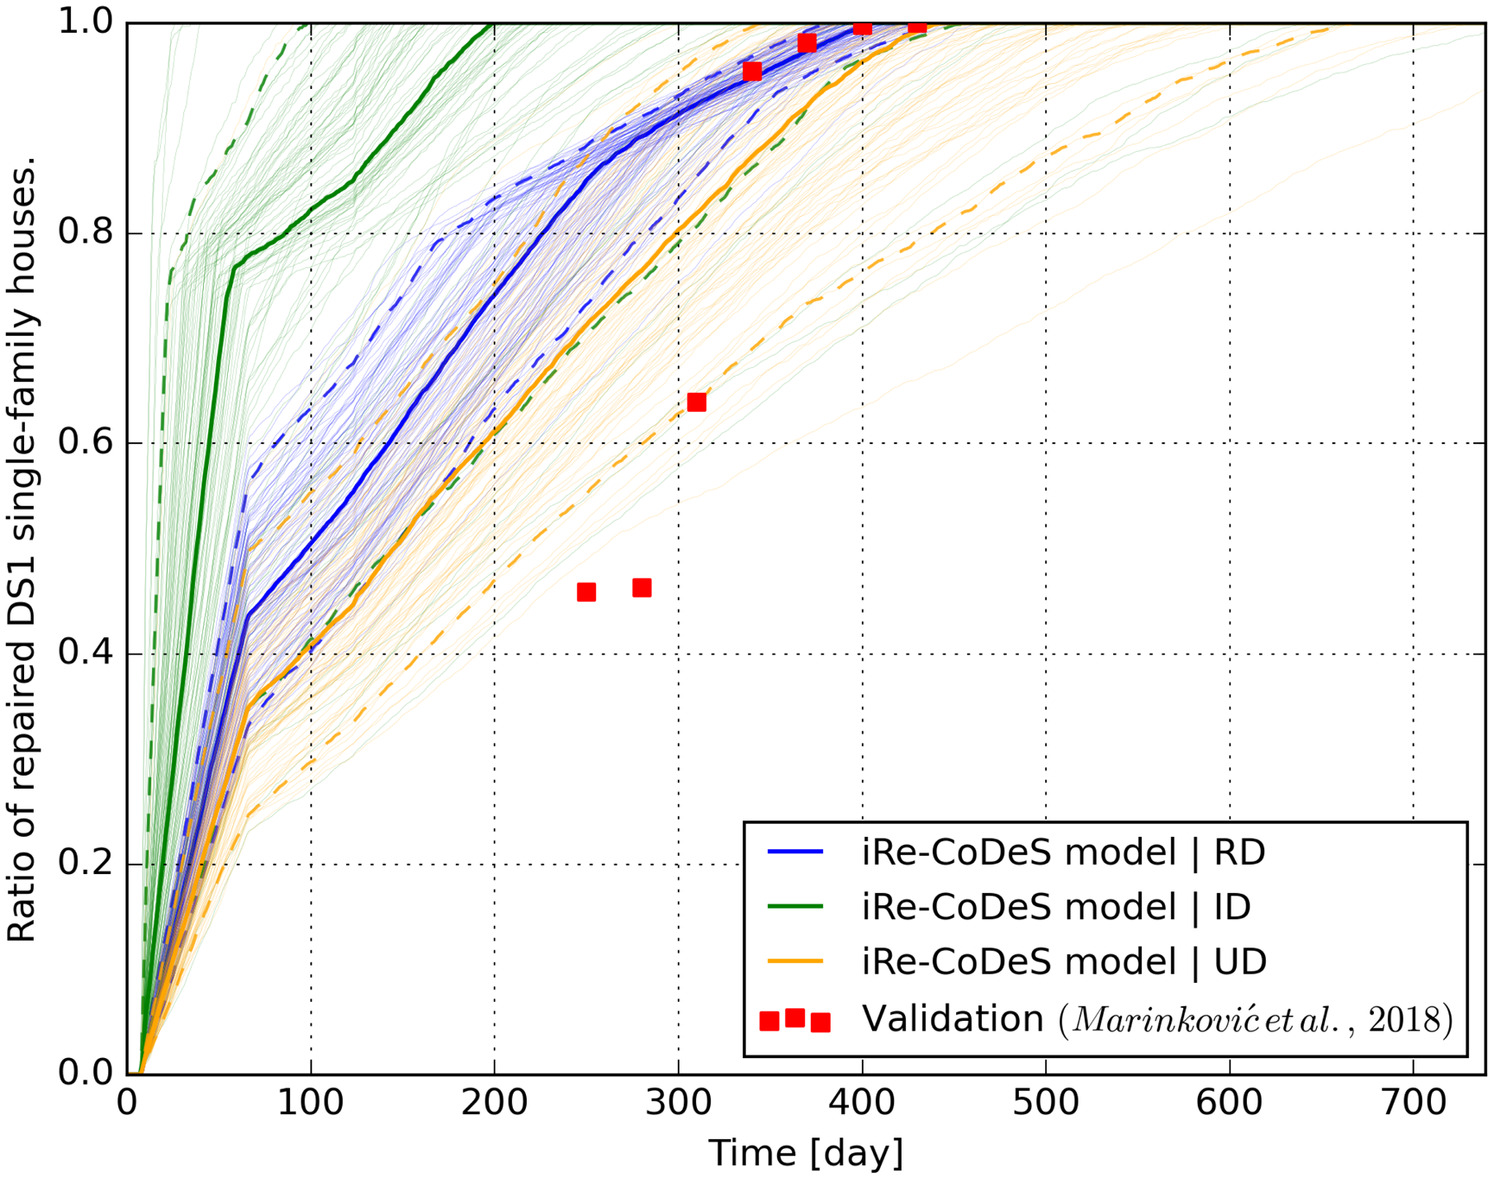
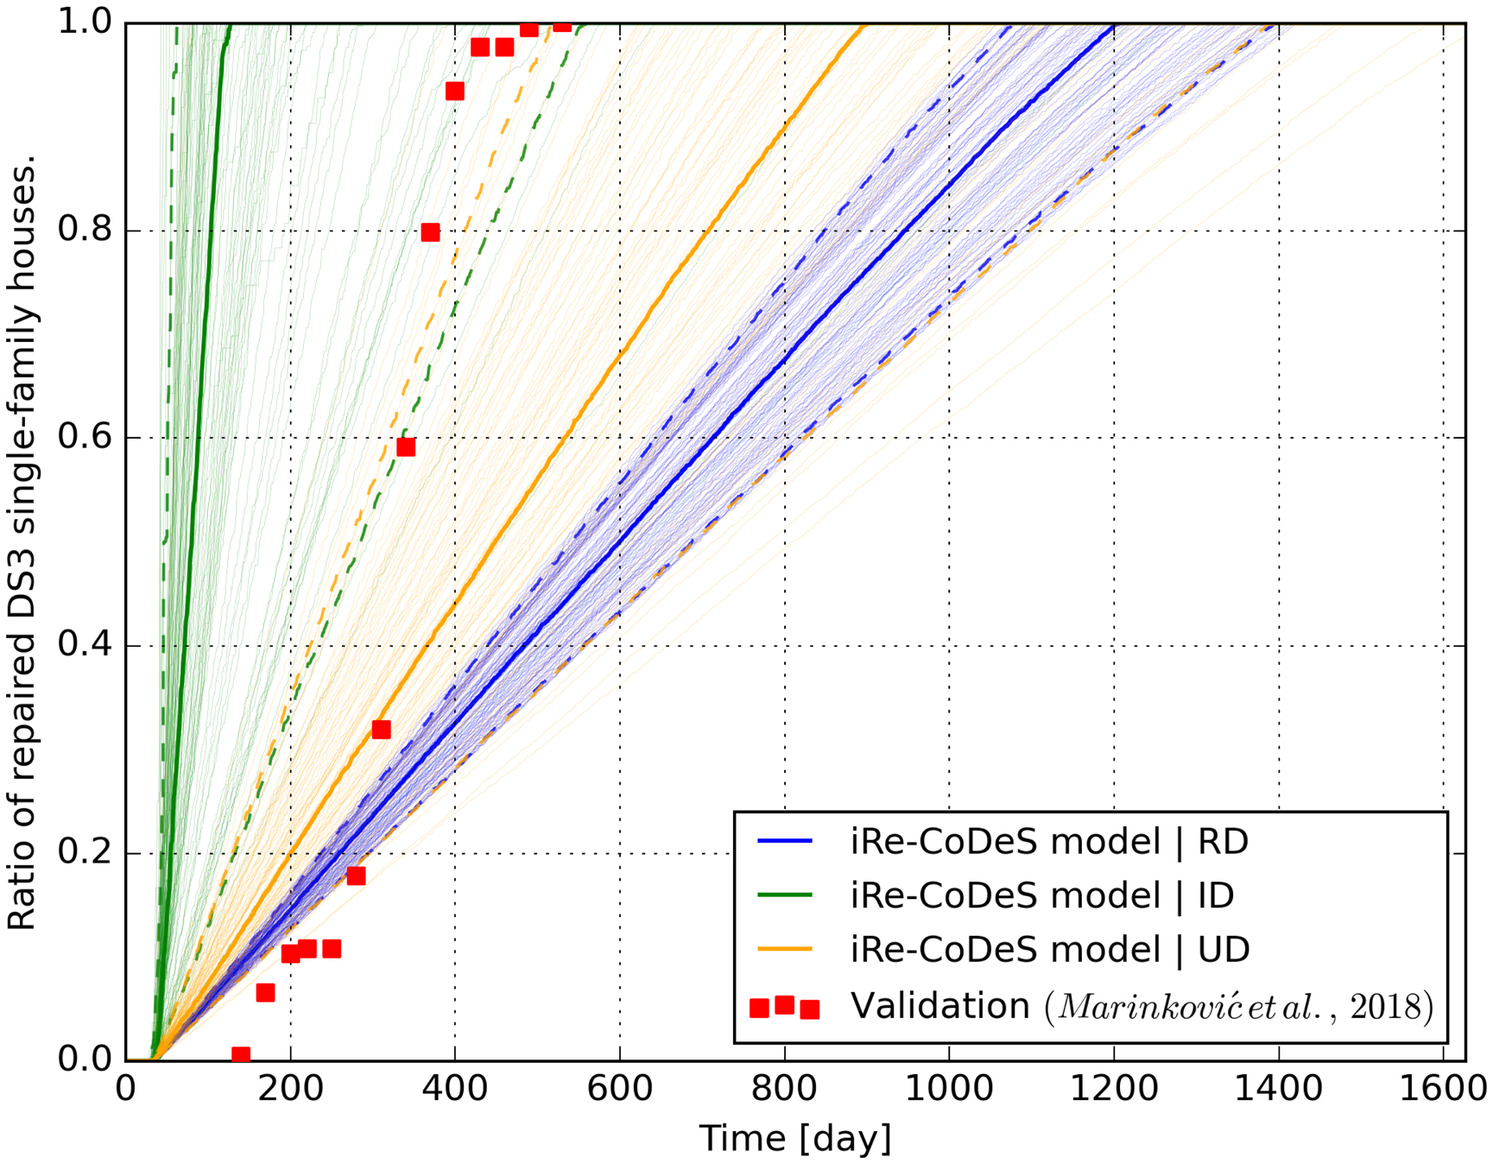
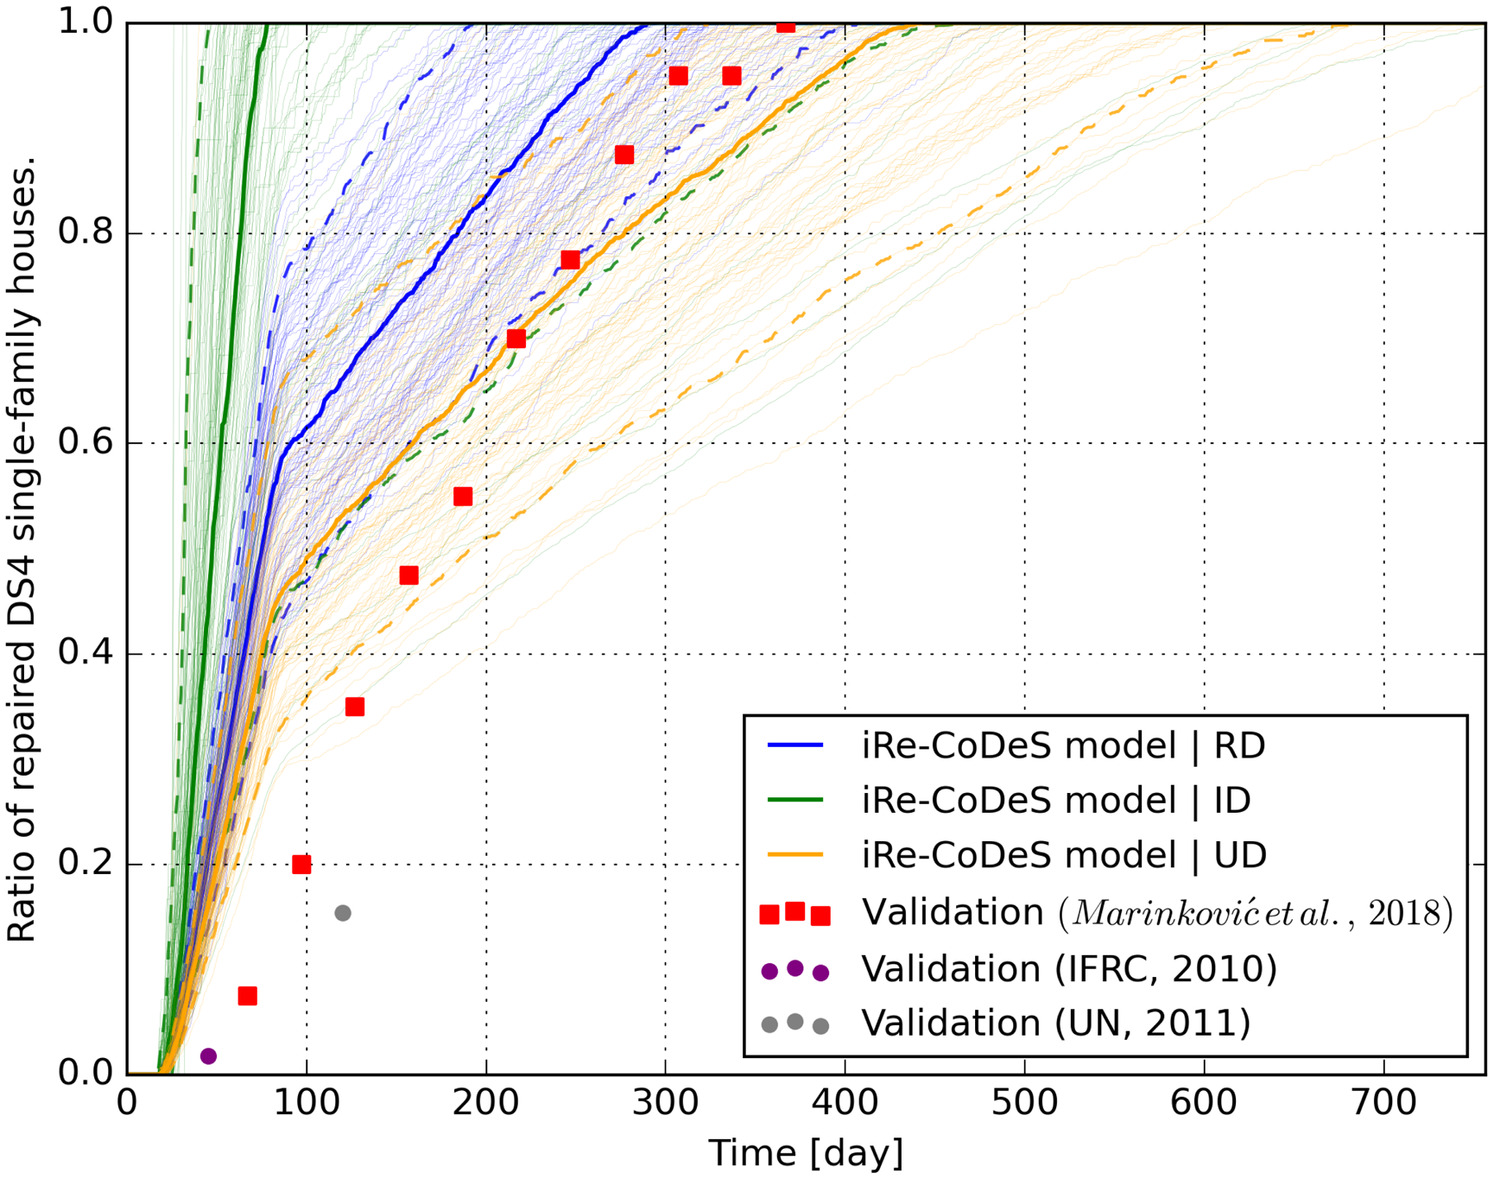
Fig. 6 presents the inspection trajectories for all damaged single-family buildings. The majority of the inspections were completed approximately 180 days after the earthquake (Marinković et al. 2018; Manić and Bulajić 2012). However, the median prediction of the inspection completion time obtained from the RD recovery model is about 250 days, with the 90% credible interval spanning from 180 to 380 days. The UD recovery model predicts an even longer inspection completion time. Such overestimates are likely due to the underestimate of the supply capacity of Inspectors and/or the overestimate of building inspection demand (Tables 1 and 2). The ID recovery model, however, predicts a substantially shorter median duration of inspections due to the underestimation of the number of damaged buildings (Fig. 5). Importantly, the change in the rate of inspection 60 days after the earthquake, due to the assumed decrease in the regional supply capacity for inspectors, is clearly visible in all models.
Fig. 7 presents the recovery of DS1 single-family buildings. The validation data comprise 737 out of a total of 10,100 single-family buildings in DS1 (Marinković et al. 2018). The ID recovery model underestimates the time needed to repair all DS1 single-family buildings and has a large uncertainty that spans from 100 to 400 days. However, the median recovery times for both RD and UD models match the validation data. The change in the recovery rate is due to the assumed change in the supply capacity of Inspectors 60 days after the earthquake.
All three regional housing recovery models assume unimpeded progress of recovery activities as soon as the demand for recovery resources of a building is met. However, since most of the repairs of single-family buildings in DS1 and DS2 were not urgent, they were performed once the weather conditions improved, in spring, summer, and fall of 2011 (Marinković et al. 2018), and not immediately after the earthquake, as was done for buildings in DS3 and DS4. Such weather-related delays are not included in the models.
Recovery trajectories of DS3 single-family buildings are presented in Fig. 8. The validation data comprise 213 out of a total of 2,035 single-family buildings in DS3 (Marinković et al. 2018). Both RD and UD models overestimate the recovery time obtained from the validation data, while the ID model underestimates it. The assumed regional supply capacity of workers repairing major, structural damage, (Table 5), is the most likely explanation for such inaccurate prediction. Furthermore, experts reported that the repair work on DS3 single-family buildings was parallelized, with the same repair crews working on several damaged buildings at the same time. This was not captured by the iRe-CoDeS regional housing recovery model but could be simulated using building component level repair models (Terzić et al. 2021; Blagojević et al. 2023b). In addition, the simulated recovery of DS3 single-family buildings has a constant recovery rate. This is due to a large number of recovery activities preceding the actual building repair, compared to buildings in DS1 and DS2 (Fig. 4). The supply capacity for resources needed for these additional activities was assumed to be fairly constant over the recovery period (Table 5); thus, the variation of the recovery rates caused by the uneven supply capacity of Inspectors is small.
The RD and UD recovery models predicted the recovery time of DS4 single-family buildings (Fig. 9) with good accuracy, while the ID model is, again, optimistic. The validation data comprise 40 out of a total of 462 single-family buildings in DS4 (Marinković et al. 2018). The two distinct recovery rates are the consequence of the uneven inspection rate.
Apart from validating the damage inspection rate and recovery rate of buildings in different damage states, the presented damage estimation models and the regional housing recovery model are validated by comparing the simulated postearthquake housing recovery with the reported data on the recovery of shelter (Blagojević et al. 2022b) and the community’s ability to mobilize recovery resources (Blagojević et al. 2022a).
A summary of relevant simulated and observed recovery parameters is presented in Table 6. The outputs obtained using the regional housing recovery models that employ the RD, ID, and UD damage estimation models (i.e., the RD, ID, and UD recovery models) are compared. The differences in the simulated and observed recovery parameters result from the inaccuracies of the damage estimation models, exposure information, or the simulation of the recovery process. As the exposure information is the same in all three recovery models (the RD, ID, and UD recovery models), its effect on the simulated recovery trajectories could not be examined. However, the accuracy of the recovery process simulation is examined by comparing the outputs of the RD recovery model with the observed recovery parameters. Since the RD recovery model uses the reported damage, the differences between its outputs and the observed parameters are due to the inaccuracies related to the recovery process simulation (e.g., inaccurate estimate of recovery resource supply capacities or recovery model shortcomings), not due to the differences in estimated and observed damage. Apart from the recovery process simulation, the inaccuracies of the ID recovery model are further caused by the differences in the estimated and observed damage (Fig. 5). The UD recovery model increases the precision of damage estimation and thus leads to less uncertain recovery parameters.
| Recovery parameters | Model results [median days after the event (5%–95% quantile range)] | Recovery validation data | |||
|---|---|---|---|---|---|
| RD | ID | UD | Observed (days) | Source | |
| Building damage inspection finished | 268 (170–386) | 53 (19–470) | 424 (312–676) | 180 | Marinković et al. (2018) |
| Repair of DS1 single-family buildings finished | 407 (382–444) | 200 (99–485) | 446 (347–672) | 430 | Data on 737 out of total 10,100 DS1 single-family buildings |
| Repair of DS2 single-family buildings finished | 410 (385–446) | 206 (100–441) | 449 (349–672) | 460 | Data on 203 out of total 2,806 DS2 single-family buildings |
| Repair of DS3 single-family buildings finished | 1,208 (1,080–1,405) | 127 (62–577) | 902 (521–1,479) | 530 | Data on 213 out of total 2,035 DS3 single-family buildings |
| Repair of DS4 single-family buildings finished | 290 (193–408) | 78 (46–492) | 443 (324–688) | 367 | Data on 40 out of total 462 DS4 single-family buildings |
| No people housed in temporary shelter | 1,204 (1,071–1,396) | 146 (57–634) | 896 (521–1,412) | 730 | News articles (RTS 2012) |
Overall, the RD recovery model simulated the recovery of DS1, DS2, and DS4 buildings, as well as the damage inspection progress, with acceptable accuracy: the difference in the observed and simulated median recovery prediction values varies from 5% to 33%, which the authors consider to be within an acceptable range for regional seismic risk and consequence assessment models. The RD recovery model underestimated the recovery time of the shelter capacity by 39%: the model predicted that no people would be housed in temporary shelter 1,204 days after the earthquake, while the information obtained from news articles states that it took 2 years (i.e., 730 days) after the event for people to return to their permanent homes (Blagojević et al. 2022b). The most likely reason for such an overestimate is the underestimation of the recovery rate for DS3 single-family buildings due to the underestimated supply of workers repairing major, structural damage, (Table 5). The accuracy of the ID recovery model was significantly lower due to the difference between the observed and the initially predicted damage (Fig. 5). The accuracy of the ID model could be increased if more appropriate building fragility functions would be used, developed specifically for the local building stock. The efforts in that direction are ongoing (Blagojević et al. 2023a). Another improvement could be reducing the uncertainty of the ground-motion model outputs. The UD model was less uncertain and more accurate than the ID model, showing the benefit of dynamically including the stream of early-arriving damage inspection data in regional housing recovery prediction.
Conclusion
Making disaster resilience planning and implementation actionable from the engineering standpoint necessitates tools to model and analyze the disaster damage and postdisaster recovery process. While seismic risk modeling and analysis is well established in engineering research and practice, frameworks to model and quantify postdisaster recovery are in the nascent development stage. An important step toward the use of such frameworks for decision making consists in illustrating their practical applicability, building trust in the recovery predictions through validation studies, and identifying their main shortcomings.
In this study, we applied the iRe-CoDeS framework to simulate the regional housing recovery following the 2010 Kraljevo, Serbia, earthquake. The aim was to show how such a framework for regional recovery modeling can be applied in a realistic context by profiting from existing data and expert opinion. Furthermore, we show how the outputs of the recovery model can be updated using early damage inspection data to reduce uncertainty and increase the accuracy of recovery predictions. Importantly, we used the data collected after the 2010 Kraljevo earthquake to model the postearthquake housing recovery and validate the simulation outcomes against the reported data.
Despite the challenges posed by the available data quality, numerous modeling assumptions, and the current limitations of the iRe-CoDeS framework, the outputs of the recovery model using the reported building damage data and concerning the recovery of DS1, DS2, and DS4 buildings and the regional shelter capacity aligned with the reported data reasonably well: the difference in the observed and simulated median recovery metrics spanned from 5% to 39%. However, the accuracy of recovery models utilizing pre-event building damage estimates obtained using ground-motion models and fragility functions was found to be less accurate. Based on the comparison of the two recovery models, it is evident that improving the damage estimation models should be the first priority to increase the accuracy of future regional recovery simulations. This can be achieved through the development of region-specific damage estimation models. Additionally, we showcased the benefits of using early inspection data to update recovery projections and thus increase their accuracy. Apart from identifying the effect of different building damage estimation models on recovery model outputs, we identified certain limitations of the iRe-CoDeS framework. The simplified assumption that buildings recover as soon as the recovery resources are available was shown not to be correct: weather conditions can also delay the start of repairs, particularly when the damage does not significantly impair building safety and functionality. This delay was not captured in this study but will be considered in future work. Furthermore, we need better methods to estimate community’s ability to supply recovery resources, such as repair workers, and the evolution of this ability over time, as the effect of resource constraints on regional housing recovery needs to be modeled and evaluated better to reduce uncertainty. The uncertainties in damage and recovery model outputs are also affected by the magnitude and severity of the considered event. While this case study tackled a moderate-magnitude event, large-magnitude events are likely to result in higher uncertainties. Such events are less frequent, which implicitly limits the data availability for model development and validation purposes. More severe events may also cause secondary effects, such as landslides and ground rupture, producing cascading effects (e.g., preventing access to repair) further complicating the recovery process, and thus, requiring the consideration of additional recovery activities that introduce extra uncertainty. However, the added iRe-CoDeS capability to dynamically update the damage estimates using a stream of early-arriving damage inspection data was shown to improve the recovery process predictions by reducing the uncertainties associated with pre-event damage and recovery models. Importantly, the dynamic updating capabilities of the iRe-CoDeS framework can be applied to the incoming recovery process data, making the iRe-CoDeS framework suitable for better planning and execution of the postdisaster recovery process.
The iRe-CoDeS bottom-up demand/supply framework was shown to be a good basis for developing regional recovery models capable of simulating a preplanned disaster recovery process of modern communities, given the necessary hazard, exposure, and vulnerability data. The simulations can be used in what-if studies to estimate the duration of the recovery effort in total, as well as the duration of individual recovery activities and the recovery resource demands they impose on the community. The iRe-CoDeS regional recovery models can be refined by integrating advanced building repair/recovery models, allowing a more in-depth consideration of building repair and the required resources. Additionally, integrating the postdisaster performance of interdependent infrastructure systems and their effect on buildings’ functional recovery in future studies will allow for a more comprehensive resilience quantification using the iRe-CoDeS framework. Finally, iRe-CoDeS-based regional recovery models can be improved by conducting similar validation case studies involving higher-magnitude events in different regions, as well as by updating and recalibrating recovery model parameters based on the observed recovery processes and sequences to prepare for the next disaster.
It is clear that recovery data collection efforts, through longitudinal postdisaster data collection projects or similar studies, are needed to establish a validation database for regional recovery models. Such studies will eventually enable recovery models capable of reliably predicting the recovery trajectories of communities after future disasters. It is important to note that constructing a regional recovery model involves discussing various elements of community disaster resilience with the stakeholders and outlining recovery plans prior to future disasters. Thus, the sole process of constructing a regional recovery model is already a step toward community disaster preparedness and contributes to community resilience. Studies, such as the one presented herein, are a necessary first step toward developing reliable regional recovery models. Such studies outline the data collection process, identify the main sources of uncertainty and point to important shortcomings of current recovery models that need to be addressed in the future.
Data Availability Statement
Some or all data, models, or code used during the study were provided by a third party. Direct requests for these materials may be made to the provider as indicated in the Acknowledgments.
Acknowledgments
The case study presented in this paper would not be possible without the information provided by experts involved in the Kraljevo 2010 earthquake recovery; thus, the authors would like to thank Dragan Milivojević, Aleksandar Avramović, Zdravko Maksimović, Dejan Karapandžić, and Predrag Blagojević. Furthermore, the authors would like to thank the City of Kraljevo for sharing the GIS data. The work presented in this paper was financially supported by the Real-time Earthquake Risk Reduction for a Resilient Europe “RISE” project, financed under the European Union’s Horizon 2020 research and innovation program, under grant agreement No 821115, the ETH Risk Center project “DynaRisk,” financed under grant agreement ETH-11 18-1, and the ETH Chair of Structural Dynamics and Earthquake Engineering.
References
Aghababaei, M., M. Koliou, S. Pilkington, H. Mahmoud, J. W. van de Lindt, A. Curtis, S. Smith, J. Ajayakumar, and M. Watson. 2020. “Validation of time-dependent repair recovery of the building stock following the 2011 Joplin Tornado.” Nat. Hazard. Rev. 21 (4): 04020038. https://doi.org/10.1061/(ASCE)NH.1527-6996.0000408.
Akkar, S., M. Sandıkkaya, and J. J. Bommer. 2014. “Empirical ground-motion models for point- and extended-source crustal earthquake scenarios in Europe and the Middle East.” Bull. Earthquake Eng. 12 (1): 359–387. https://doi.org/10.1007/s10518-013-9461-4.
Alisjahbana, I., and A. Kiremidjian. 2020. “Modeling housing recovery after the 2018 Lombok earthquakes using a stochastic queuing model.” Earthquake Spectra 37 (7): 587–611. https://doi.org/10.1177/8755293020970972.
Almufti, I., and M. Willford. 2013. Resilience-based earthquake design (REDi) rating system, version 1.0. London: Arup Group.
Anguelov, D., C. Dulong, D. Filip, C. Frueh, S. Lafon, R. Lyon, A. Ogale, L. Vincent, and J. Weaver. 2010. “Google Street View: Capturing the world at street level.” Computer 43 (6): 32–38. https://doi.org/10.1109/MC.2010.170.
Antonijević, S. K., P. Arroucau, and G. Vlahović. 2013. “Seismotectonic model of the Kraljevo 3 November 2010 Mw 5.4 earthquake sequence.” Seismol. Res. Lett. 84 (4): 600–610. https://doi.org/10.1785/0220120158.
Blagojević, N., L. Bodenmann, Y. Reuland, and B. Stojadinović. 2022a. “Improving community disaster resilience by providing adequate supply of recovery resources and services.” In Proc., 3rd European Conf. on Earthquake Engineering and Seismology, 3ECEES. Bucharest, Romania: Editura Conspress.
Blagojević, N., L. Bodenmann, Y. Reuland, and B. Stojadinović. 2022b. “Validating a resilience quantification framework: The case of 2010 Kraljevo Earthquake.” In Proc., 3rd European Conf. on Earthquake Engineering and Seismology, 3ECEES. Bucharest, Romania: Editura Conspress.
Blagojević, N., S. Brzev, M. Petrović, J. Borozan, B. Bulajić, M. Marinković, M. Hadzima-Nyarko, V. Koković, and B. Stojadinović. 2023a. “Residential building stock in Serbia: Classification and vulnerability for seismic risk studies.” In Bulletin of earthquake engineering, 169. Berlin: Springer.
Blagojević, N., M. Didier, and B. Stojadinović. 2021a. “Simulating the role of transportation infrastructure for community disaster recovery.” In Proc., Institution of Civil Engineers: Bridge Engineering. London: ICE Publishing.
Blagojević, N., M. Didier, and B. Stojadinović. 2022c. “Evaluating NIST community disaster resilience goals using the iRe-CoDeS resilience quantification framework.” In Proc., 12 National Conf. on Earthquake Engineering. Oakland, CA: Earthquake Engineering Research Institute.
Blagojević, N., M. Didier, and B. Stojadinović. 2022d. “Risk-informed resilience assessment of communities using lack of resilience surfaces.” In Proc., 13th Int. Conf. on Structural Safety and Reliability (ICOSSAR 2021). Oakland, CA: Tongji Univ.
Blagojević, N., M. Didier, and B. Stojadinović. 2022e. “Quantifying component importance for disaster resilience of communities with interdependent civil infrastructure systems.” Reliab. Eng. Syst. Saf. 228 (Dec): 108747. https://doi.org/10.1016/j.ress.2022.108747.
Blagojević, N., F. Hefti, J. Henken, M. Didier, and B. Stojadinović. 2022f. “Quantifying disaster resilience of communities with interdependent civil infrastructure systems.” Struct. Infrastruct. Eng. 19 (12): 1696–1710. https://doi.org/10.1080/15732479.2022.2052912.
Blagojević, N., N. Lauber, M. Didier, and B. Stojadinović. 2022g. “Evaluating the importance of interdependent civil infrastructure system components for disaster resilience of community housing.” In Proc., ASCE Lifelines 2022, 927–937.
Blagojević, N., and B. Stojadinović. 2022. “A demand-supply framework for evaluating the effect of resource and service constraints on community disaster resilience.” Resilient Cities Struct. 1 (1): 13–32. https://doi.org/10.1016/j.rcns.2022.03.001.
Blagojević, N., V. Terzić, and B. Stojadinović. 2023b. “F-RecN+ iRe-CoDeS: Computational framework for regional recovery simulation using advanced building recovery models.” Eng. Struct. 288 (Aug): 116156. https://doi.org/10.1016/j.engstruct.2023.116156.
Blagojević, P., S. Brzev, and R. Cvetković. 2021b. “Simplified seismic assessment of unreinforced masonry residential buildings in the Balkans: The case of Serbia.” Buildings 11 (9): 392. https://doi.org/10.3390/buildings11090392.
Bodenmann, L., Y. Reuland, and B. Stojadinovic. 2021. “Dynamic updating of building loss predictions using regional risk models and conventional post-earthquake data sources.” In Proc., 31st European Safety and Reliability Conf., Singapore: Research Publishing.
Bodenmann, L., Y. Reuland, and B. Stojadinović. 2023. “Dynamic post-earthquake updating of regional damage estimates using Gaussian processes.” Reliab. Eng. Syst. Saf. 234 (Jun): 109201. https://doi.org/10.1016/j.ress.2023.109201.
Burton, C. G., M. Toquica, K. M. B. Asad, and M. Musori. 2022. “Validation and development of composite indices for measuring vulnerability to earthquakes using a socio-economic perspective.” Nat. Hazards 111 (2): 1301–1334. https://doi.org/10.1007/s11069-021-05095-9.
Burton, H. V., G. Deierlein, D. Lallemant, and T. Lin. 2016. “Framework for incorporating probabilistic building performance in the assessment of community seismic resilience.” J. Struct. Eng. 142 (8): C4015007. https://doi.org/10.1061/(ASCE)ST.1943-541X.0001321.
City of Kraljevo. 2022. “GIS data for the City of Kraljevo.” Accessed September 14, 2021. http://www.kraljevogis.rs/.
Comerio, M. C., and H. E. Blecher. 2010. “Estimating downtime from data on residential buildings after the Northridge and Loma Prieta Earthquakes.” Earthquake Spectra 26 (4): 951–965. https://doi.org/10.1193/1.3477993.
Costa, R., T. Haukaas, and S. E. Chang. 2021. “Agent-based model for post-earthquake housing recovery.” Earthquake Spectra 37 (1): 46–72. https://doi.org/10.1177/8755293020944175.
Cremen, G., E. Seville, and J. W. Baker. 2020. “Modeling post-earthquake business recovery time: An analytical framework.” Int. J. Disaster Risk Reduct. 42 (Jan): 101328. https://doi.org/10.1016/j.ijdrr.2019.101328.
Crowley, H., et al. 2020. “Exposure model for European seismic risk assessment.” Earthquake Spectra 36 (May): 252–273. https://doi.org/10.1177/8755293020919429.
Crowley, H., J. Dabbeek, L. Danciu, P. Kalakonas, E. Riga, V. Silva, E. Veliu, and G. Weatherill. 2021a. “Earthquake scenario loss testing repository (version 1.0).” Zenodo. Accessed December 11, 2021. https://zenodo.org/records/5774113.
Crowley, H., J. Dabbeek, V. Despotaki, D. Rodrigues, L. Martins, V. Silva, X. Romao, N. Pereira, G. Weatherill, and L. Danciu. 2021b. European Seismic Risk Model (ESRM20).
Diana, L., J. Thiriot, Y. Reuland, and P. Lestuzzi. 2019. “Application of association rules to determine building typological classes for seismic damage predictions at regional scale: The case study of Basel.” Front. Built Environ. 5 (Apr): 51. hthttps://doi.org/10.3389/fbuil.2019.00051.
Didier, M., M. Broccardo, S. Esposito, and B. Stojadinović. 2018. “A compositional demand/supply framework to quantify the resilience of civil infrastructure systems (Re-CoDeS).” Sustainable Resilient Infrastruct. 3 (2): 86–102. https://doi.org/10.1080/23789689.2017.1364560.
Di Ludovico, M., A. Prota, C. Moroni, G. Manfredi, and M. Dolce. 2017a. “Reconstruction process of damaged residential buildings outside historical centres after the L’Aquila earthquake: Part I—‘Light damage’ reconstruction.” Bull. Earthquake Eng. 15 (2): 667–692. https://doi.org/10.1007/s10518-016-9877-8.
Di Ludovico, M., A. Prota, C. Moroni, G. Manfredi, and M. Dolce. 2017b. “Reconstruction process of damaged residential buildings outside historical centres after the L’Aquila earthquake: Part II—‘Heavy damage’ reconstruction.” Bull. Earthquake Eng. 15 (2): 693–729. https://doi.org/10.1007/s10518-016-9979-3.
EERI (Earthquake Engineering Research Institute). 2016. “Creating Earthquake-resilient communities: EERI policy white paper.” In White paper. Oakland, CA: EERI.
Esposito, S., and I. Iervolino. 2011. “PGA and PGV spatial correlation models based on European multievent datasets.” Bull. Seismol. Soc. Am. 101 (5): 2532–2541. https://doi.org/10.1785/0120110117.
FEMA. 2018. Seismic performance assessment of buildings. Volume 1–Methodology. Washington, DC: FEMA.
FEMA. 2020. HAZUS earthquake model 4.2 technical manual. Washington, DC: FEMA.
Fu, Z., R. Gao, and Y. Li. 2021. “Measuring seismic resilience of building portfolios based on innovative damage ratio assessment model.” Structures 30 (Mar): 1109–1126. https://doi.org/10.1016/j.istruc.2021.01.041.
IFRC (International Federation of Red Cross and Red Crescent). 2010. Operations update, Serbia: Earthquake. Geneva: IFRC.
Jayaram, N., and J. W. Baker. 2008. “Statistical tests of the joint distribution of spectral acceleration values.” Bull. Seismol. Soc. Am. 98 (5): 2231–2243. https://doi.org/10.1785/0120070208.
Longman, M., and S. B. Miles. 2019. “Using discrete event simulation to build a housing recovery simulation model for the 2015 Nepal earthquake.” Int. J. Disaster Risk Reduct. 35 (Sep): 101075. https://doi.org/10.1016/j.ijdrr.2019.101075.
Manić, M., and B. Bulajić. 2012. “Why damage estimation on civil engineering structures in Kraljevo region has not been completed even a year after the November 3, 2010 Earthquake?” [In Serbian.] Izgradnja 66 (5): 269–308.
Manić, M., and B. Bulajić. 2013. “Behaviour of masonry buildings during the November 03, 2010 Kraljevo earthquake–Experiences and lessons.” Izgradnja [In Serbian.] 67 (5): 235–246.
Marinković, D., Z. Stojadinović, M. Kovačević, and B. Stojadinović. 2018. “2010 Kraljevo earthquake recovery process metrics.” In Proc., 16th European Conf. on Earthquake Engineering. New York: Springer.
Miles, S. B., H. V. Burton, and H. Kang. 2019. “Community of practice for modeling disaster recovery.” Nat. Hazard Rev. 20 (1): 04018023. https://doi.org/10.1061/(ASCE)NH.1527-6996.0000313.
Molina Hutt, C., T. Vahanvaty, and P. Kourehpaz. 2022. “An analytical framework to assess earthquake-induced downtime and model recovery of buildings.” Earthquake Spectra 38 (2): 1283–1320. https://doi.org/10.1177/87552930211060856.
Nasrazadani, H., and M. Mahsuli. 2020. “Probabilistic framework for evaluating community resilience: Integration of risk models and agent-based simulation.” J. Struct. Eng. 146 (11): 04020250. https://doi.org/10.1061/(ASCE)ST.1943-541X.0002810.
Nejat, A., R. J. Javid, S. Ghosh, and S. Moradi. 2020. “A spatially explicit model of postdisaster housing recovery.” Comput.-Aided Civ. Infrastruct. Eng. 35 (2): 150–161. https://doi.org/10.1111/mice.12487.
Pittore, M., M. Haas, and K. G. Megalooikonomou. 2018. “Risk-oriented, bottom-up modeling of building portfolios with faceted taxonomies.” Front. Built Environ. 4 (Oct): 1–14. https://doi.org/10.3389/fbuil.2018.00041.
Potter, S. H., J. S. Becker, D. M. Johnston, and K. P. Rossiter. 2015. “An overview of the impacts of the 2010-2011 Canterbury earthquakes.” Int. J. Disaster Risk Reduct. 14 (Dec): 6–14. https://doi.org/10.1016/j.ijdrr.2015.01.014.
Rasmussen, C., and K. Williams. 2006. Gaussian processes for machine learning. Cambridge, MA: MIT Press.
Romão, X., N. Pereira, J. Castro, H. Crowley, V. Silva, L. Martins, and F. De Maio. 2021 “European building vulnerability data repository (v2.1).” Accessed November 1, 2021. https://gitlab.seismo.ethz.ch/efehr/esrm20_vulnerability.
RTS (Radio Television of Serbia). 2011. “Kraljevo, one year after.” [In Serbian.] RTS. Accessed October 27, 2023. https://www.rts.rs/page/stories/ci/story/124/drustvo/983820/kraljevo-godinu-dana-posle.html.
RTS (Radio Televison Serbia). 2012. Two years after the Kraljevo earthquake. [In Serbian.] Belgrade, Serbia: RTS.
Stojadinović, Z., M. Kovačević, D. Marinković, and B. Stojadinović. 2017. “Data-driven housing damage and repair cost prediction framework based on the 2010 Kraljevo earthquake data.” In Proc., 16th World Conf. on Earthquake Engineering. New York: Springer.
Stojadinović, Z., M. Kovačević, D. Marinković, and B. Stojadinović. 2021. “Rapid earthquake loss assessment based on machine learning and representative sampling.” Earthquake Spectra 38 (1): 152–177.https://doi.org/10.1177/87552930211042393.
Sutley, E. J., and S. Hamideh. 2018. “An interdisciplinary system dynamics model for post-disaster housing recovery.” Sustainable Resilient Infrastruct. 3 (3): 109–127. https://doi.org/10.1080/23789689.2017.1364561.
Terzić, V., P. K. Villanueva, D. Saldana, and D. Y. Yoo. 2021. “Framework for modelling post-earthquake functional recovery of buildings.” Eng. Struct. 246 (Nov): 113074. https://doi.org/10.1016/j.engstruct.2021.113074.
Tomar, A., H. V. Burton, and A. Mosleh. 2022. “Dynamic updating of post-earthquake damage and functional restoration forecasts of water distribution systems using Bayesian inferencing.” Earthquake Spectra 38 (1): 109–127. https://doi.org/10.1177/87552930211038016.
UN (United Nations). 2011. “Serbia Kraljevo earthquake, situation report date: March 3rd, 2011.”. New York: UN.
Wang, W. L., and J. W. van de Lindt. 2021. “Quantitative modeling of residential building disaster recovery and effects of pre- and post-event policies.” Int. J. Disaster Risk Reduct. 59 (Jun): 102259. https://doi.org/10.1016/j.ijdrr.2021.102259.
You, T., W. Wang, and Y. Chen. 2021. “A framework to link community long-term resilience goals to seismic performance of individual buildings using network-based recovery modeling method.” Soil Dyn. Earthquake Eng. 147 (Aug): 106788. https://doi.org/10.1016/j.soildyn.2021.106788.
Information & Authors
Information
Published In

Journal of Structural Engineering
Volume 150 • Issue 2 • February 2024
Copyright
This work is made available under the terms of the Creative Commons Attribution 4.0 International license, https://creativecommons.org/licenses/by/4.0/.
History
Received: Dec 16, 2022
Accepted: Sep 5, 2023
Published online: Nov 20, 2023
Published in print: Feb 1, 2024
Discussion open until: Apr 20, 2024
Authors
Metrics & Citations
Metrics
Citations
Download citation
If you have the appropriate software installed, you can download article citation data to the citation manager of your choice. Simply select your manager software from the list below and click Download.