Experimental Behavior of L-Shaped and T-Shaped Cross-Laminated Timber to Evaluate Shear Walls with Openings
Publication: Journal of Structural Engineering
Volume 149, Issue 5
Abstract
There is increasing interest in using cross-laminated timber (CLT) in buildings because of its high strength and stiffness. In Japan, structural design guidelines for CLT buildings were established in 2016 and construction of mid-rise buildings is increasing. Wide-panel walls can exceed widths of 10 m and integrate cut-outs for window and door openings. However, under lateral loads, corner cracks at the openings have been the most prevalent failure mechanism. To investigate the initiation and propagation of corner cracks, a series of bendings are undertaken on L- and T-shape specimens extracted from the CLT panels. In addition, three-point bending and shear tests are also carried out on beam sections extracted from the CLT panels. Three types of brittle failure were observed: bending failure of the beam or column, and rolling shear failure.
Introduction
Using cross-laminated timber (CLT), a mass timber product, a number of mid- and high-rise buildings have been constructed (van de Lindt et al. 2019; Izzi et al. 2018; Sustersic et al. 2016). The Japanese “Act on Promotion of Use of Wood in Public Buildings,” instituted in 2010, promoted use of wood in public buildings (Isoda et al. 2021). The Japanese Agricultural Standard (JAS) product specification for CLT was established in 2013 (Ministry of Agriculture, Forestry and Fishery 2013). Subsequently, the “Design and Construction Manual for CLT buildings” (JHWTC 2016), henceforth referred to as CLT manual, was published.
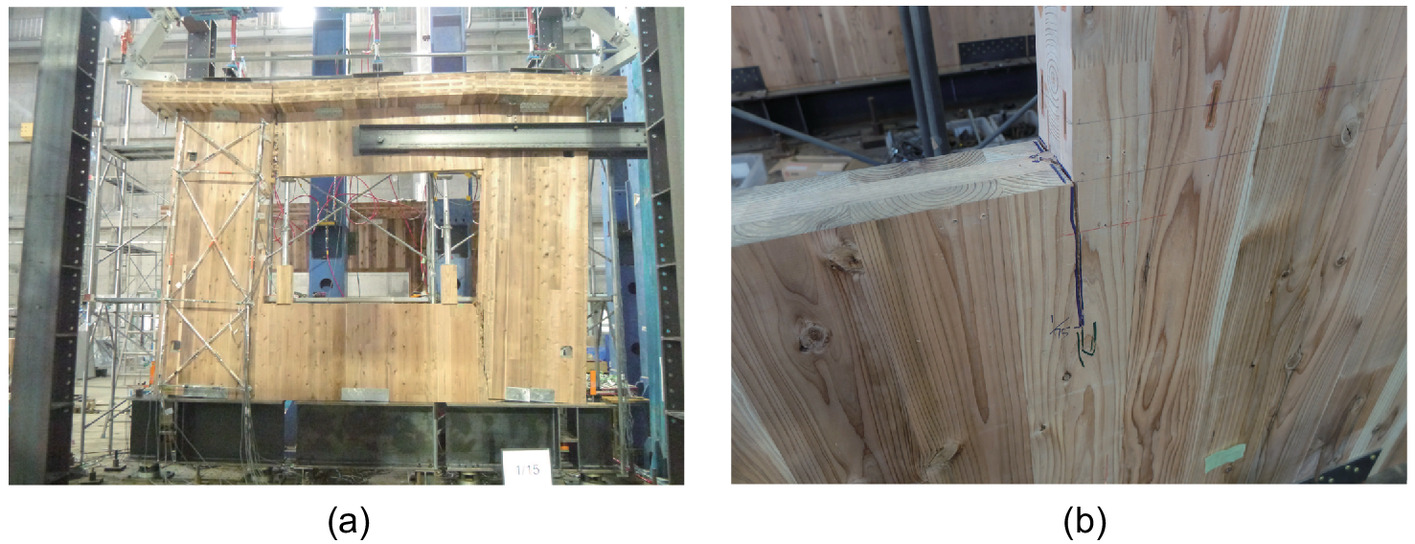
Two construction methods are prevalent in the Japanese CLT manual: narrow- and wide-panel CLT walls. Narrow-panel walls, with 1 to 2 m width panels and without openings, have higher ductility (Sato et al. 2019). The narrow-panel walls integrate window and door openings through lintel and parapet beams (e.g., Casagrande et al. 2021a; Zhang et al. 2021; Yasumura et al. 2016). Wide-panel walls can exceed a width of 10 m and integrate cut-outs for window and door openings (Zhang et al. 2021; Sato et al. 2019). Under lateral loads, however, the wide-panel CLT walls are prone to cracks at the corners of the opening (Fig. 1). According to the Japanese CLT manual, the strength limit state of the wide-panel CLT walls is defined as the initiation of cracks at the opening’s corners (Yasumura et al. 2016).
Shahnewaz et al. (2017) and Dujic et al. (2008) carried out a parametric study on the aspect ratios of the opening and wall and developed analytical models to estimate the stiffness and strength. Mestar et al. (2021) experimentally quantified the effect of CLT shearwalls with openings on the base shear and hold-down tensile load. Pai et al. (2017) carried out a numerical study on the force transmission around the openings. Araki et al. (2018) analyzed the strength of CLT walls with openings and proposed a method that accounts for the dimensions of the opening. Casagrande et al. (2021b) investigated the distribution of internal forces in single-story symmetric CLT shearwalls with openings. Casagrande et al. (2021a) analytically and numerically investigated behavior CLT walls with openings. Khajehpour et al. (2022) extended this study to numerically investigate the effect of lintels and parapets on the mechanical performance of small CLT walls. Popovski and Gavric (2016) conducted a static load test on a 2-story large CLT panel building with opening. From the test results, brittle local failure occurred in the corners of the wall panel with a large opening.
Aljuhmani et al. (2022) carried out in-plane shear strength and stiffness experimental tests on 24 CLT panels with different sizes and orientations of openings. The loads were applied at 45-degree angles for shear-only principal loads. The experimental tests showed the location of the initiation and propagation of the cracks. With increasing size of the openings, as expected, the stiffness and shear strength capacity of the CLT panels were reduced. To investigate the elastic design principle, Yasumura et al. (2016) conducted a full-scale test and finite element model (FEM) analysis on a two-story CLT structure. Two structures, with narrow (three CLT wall panels connected by lintels) and wide (6,000-mm-long and 2,700-mm-high panels with two openings in the first and second stories) CLT panels were considered. This FEM was useful in predicting the mechanical properties of the CLT building, but the elastic calculation overestimated the stress.
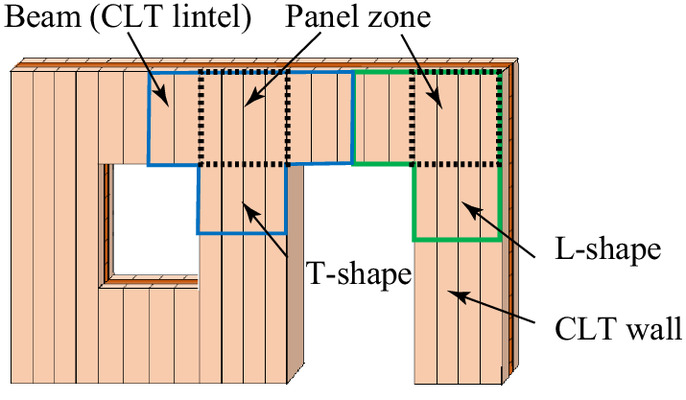
In previous studies, the authors of this paper tested CLT shear walls with and without openings to evaluate the Japanese design and construction practices. With wide CLT panels incorporating openings, the main problem that was identified is crack initiation and failure at the opening’s corners (Fig. 1). For a CLT of wide panels with openings, the objectives of this paper are to: investigate the initiation and propagation of cracks; quantify shear stiffness and bearing capacity; determine the dominant failure mechanism of the panel zone (i.e., bending or shear); and develop simplified analytical models to understand the capacity of the CLT panels under these loads. A series of tests are carried out by varying the number of layers (3 or 5), shape (L-shape or T-shape, Fig. 2), and web thickness (240, 360, or 480 mm). Additional three-point bending and shear tests were carried out to obtain mechanical properties of the CLT panels. The next two sections present the specimen design and experimental setup. This is followed by a results and discussion section of the bending and shear tests. This is followed by results on the details of each member, the strain around the corner, and stiffness. Finally, conclusions and future directions are given.
Specimen Design
In this study, 3- and 5-layer CLT panels with properties (JAS), composed of M60B and M30B Japanese Cedar laminae (Fig. 3), were selected. The laminae were visually selected to minimize the effect of knots and finger joints. An aqueous polymer isocyanate-based adhesive was used for the adhesion of the laminated surface and finger joints. Edge glue was not used in this study. The average, lower, and upper bending Young’s modulus values of the laminae are summarized in Table 1. For the 3- and 5-layer specimens, average elastic modulus, obtained through experimental testing, were 7.02 and , respectively.

| Layers in CLT | Lamina grade | Bending Young’s modulus () | ||
|---|---|---|---|---|
| Average | Lower limit | Upper limit | ||
| Outer-layer | M60B | 6.0 | 5.0 | 9.0 |
| Inner-layer | M30B | 3.0 | 2.5 | 6.0 |
Source: Data from Design and Construction Manual for CLT buildings (Committee of CLT Manual 2016).
For all specimens, depth of beam () and width of column () have been selected by equating effective section moduli of the beam and column [Eqs. (1) and (2)]. For L-shape elementswhere t is the thickness of the single layer and n is the number of layers within the CLT panel. For T-shape elements having two beams
(1a)
(1b)
(2a)
(2b)
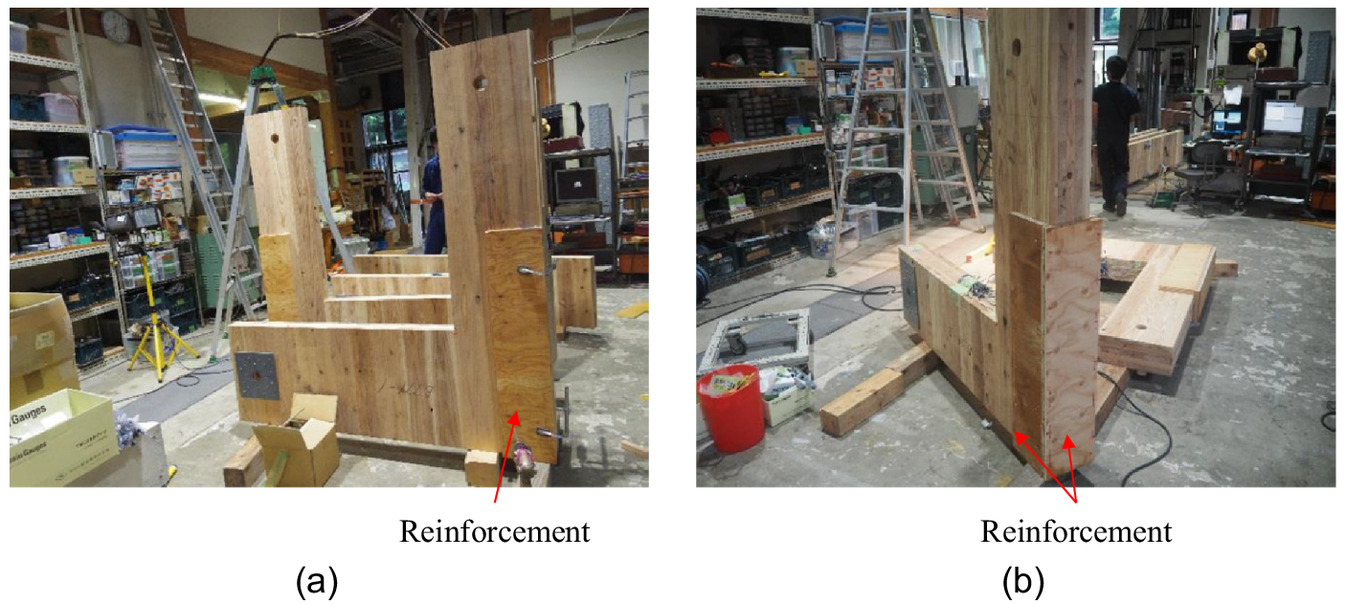
From the preliminary test, bending failure of the L-shaped column was observed. As the intention of this study is to investigate initiation of cracks at the corners and shear failure in the panel zone, the sides of the 3-layer columns were reinforced with plywood [28 mm thickness, 200 mm width, and 900 mm height, Fig. 4(a)]. The 5-layer specimens were reinforced both on the side and back layers of the column [Fig. 4(b)].
The shear stress In the panel zone (), in terms of bending stress () and section modulus (), is defined as
(3a)
(3b)
Considering total cross section (Nihon System Sekkei Architects & Engineers 2013), the shear strength ranges of the 3- and 5-layer specimens are and , respectively. If the shear strength of the cross section and panel zone is considered to be equal, bending failure occurs prior to shear failure. The mean bending and shear strength values were determined to be and , respectively. A rolling shear strength of is assuming, based on work by Okabe et al. (2014). The rolling shear has two planes, but considering the stress concentration in torsion, it is reduced by half.
Experimental Setup
Test Specimens and Setup
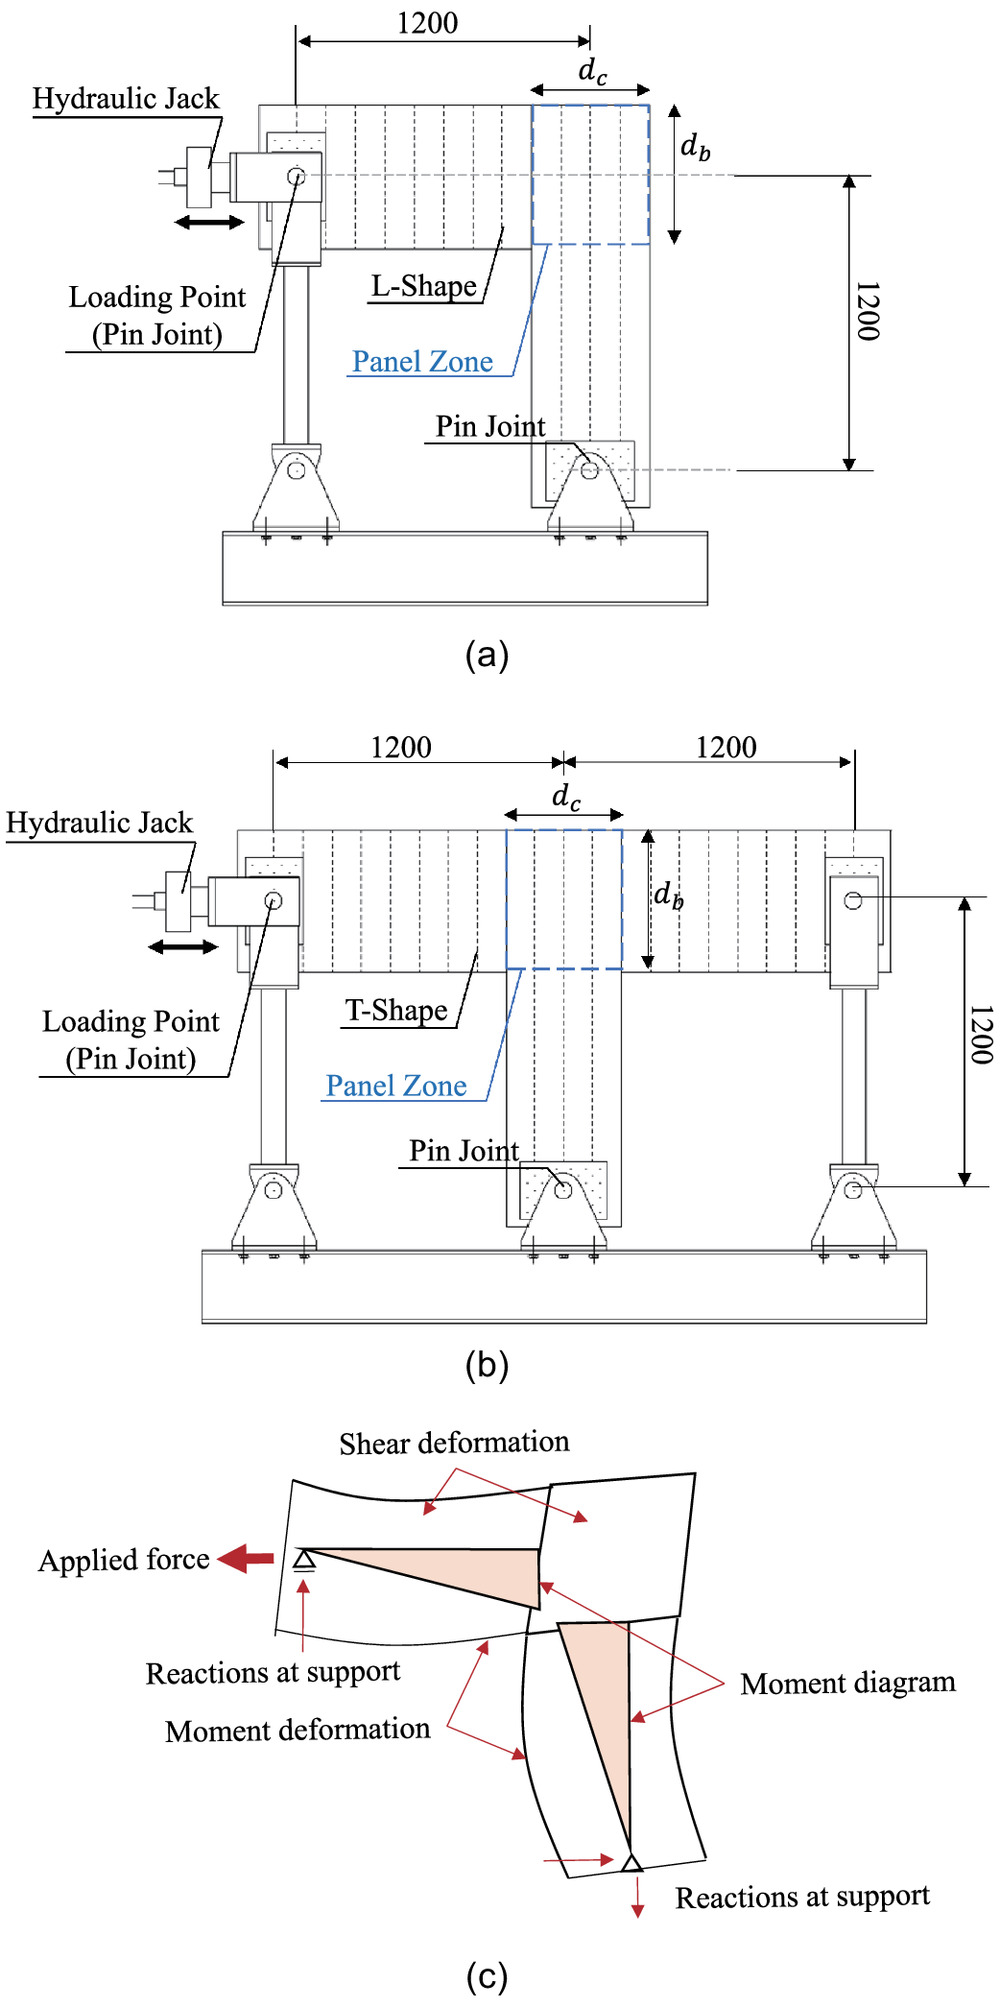
Different dimensions of L-shaped [Fig. 5(a)] and T-shaped [Fig. 5(b)] specimens were tested under monotonic and cyclic displacement-controlled loads. The loadings considered were “push” (force directed rightward), “pull” (force directed leftward), and “cyclic”. The specimens were supported by pin joints at the beam and column supports. Fig. 5(c) shows the moment distribution of the L-shaped specimen under the pull load (left side). The number of specimens tested for each configuration is summarized in Table 2. The first two labels represent the number of layers (3 or 5), shape (L-shape or T-shape), and web thickness (240, 360 or 480 mm). A 30-mm thick laminate was used for all specimens. The total number of specimens tested was 135.
| Name | (mm) | (mm) | Number of specimens | Total | ||
|---|---|---|---|---|---|---|
| Push | Pull | Cyclic | ||||
| 3L240 | 240 | 340 | 6 | 6 | 6 | 18 |
| 3L360 | 360 | 510 | 6 | 6 | 6 | 18 |
| 3L480 | 480 | 680 | 6 | 6 | 6 | 18 |
| 5L240 | 240 | 294 | 1 | 1 | 1 | 3 |
| 5L360 | 360 | 440 | 11 | 11 | 11 | 33 |
| 5L480 | 480 | 588 | 1 | 1 | 1 | 3 |
| 3T240 | 240 | 240 | — | — | 6 | 6 |
| 3T360 | 360 | 360 | — | — | 6 | 6 |
| 3T480 | 480 | 480 | — | — | 6 | 6 |
| 5T240 | 240 | 208 | 1 | 1 | 1 | 3 |
| 5T360 | 360 | 312 | 6 | 6 | 6 | 18 |
| 5T480 | 480 | 416 | 1 | 1 | 1 | 3 |
For the 3-layer L-shaped specimens, contributions of the dimensions and loading condition on the structural properties were assessed using six specimens. For the 5-layer L-shaped specimens, a single test was carried out for and 480 mm to compare the results with the 3-layer specimens. For the specimen with , however, eleven specimens were tested to evaluate the variation in strength. For T-shaped specimen, the 5-layer specimens were tested under the three load conditions first. As the loading condition showed no appreciable difference in the results, the only cyclic load test was performed for the 3-layer T-shaped specimens.
In addition, three-point load (bending) and shear tests were carried out to obtain mechanical properties of the specimens extracted from the same CLT panel as shown in Fig. 6. These tests were conducted only for the 5-layer specimen.

Test Protocol and Instrumentation
The monotonic and cyclic displacement-controlled loads were applied horizontally at the edge of the beam for the L-shaped and T-shaped specimens. The cyclic testing protocol, such as target displacement and number of cycles, is defined in documentation from the Japan Housing and Wood Technology Center (JHWTC 2016). The target displacements, with three cycles per displacement, were controlled by considering deformation angles of , , , , , , and . After , on the pull side, the tests were monotonically continued to obtain the maximum load. The deformation angle was computed by dividing the column deformation by the column height. The displacement was controlled using the sensor set between the loading point and the column’s base pin support.
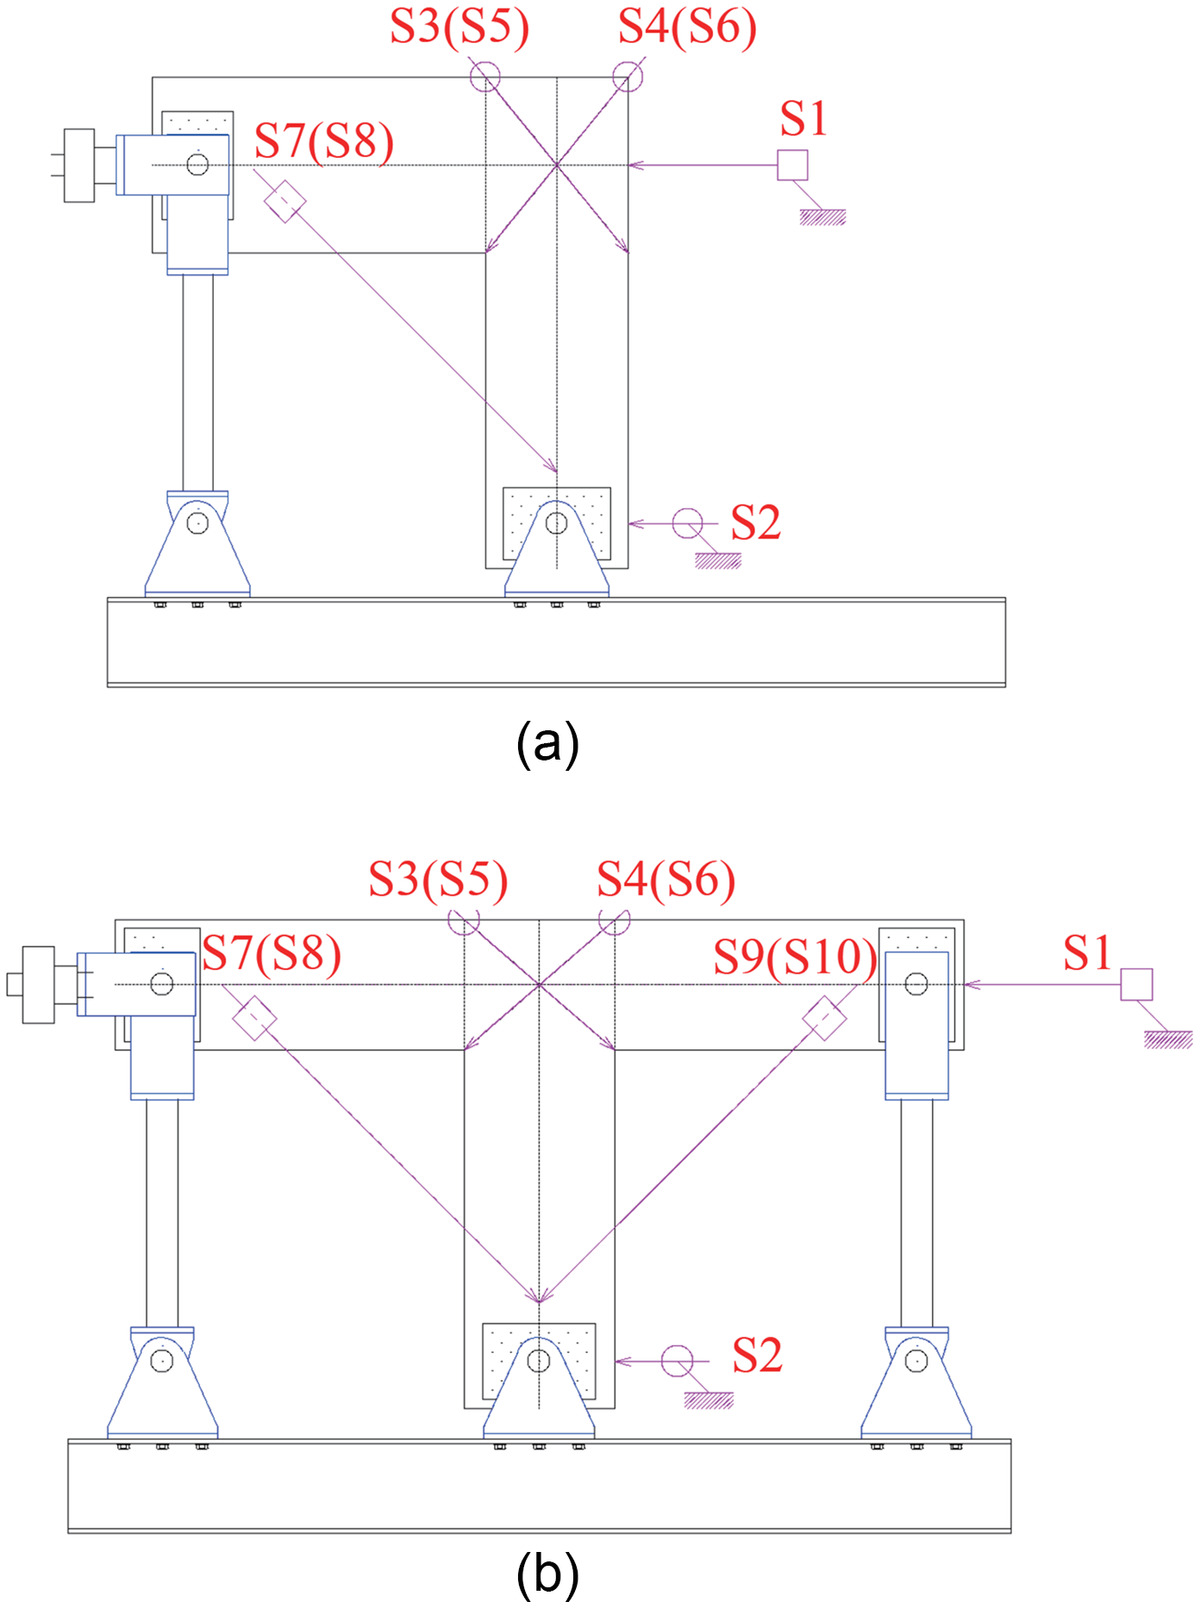
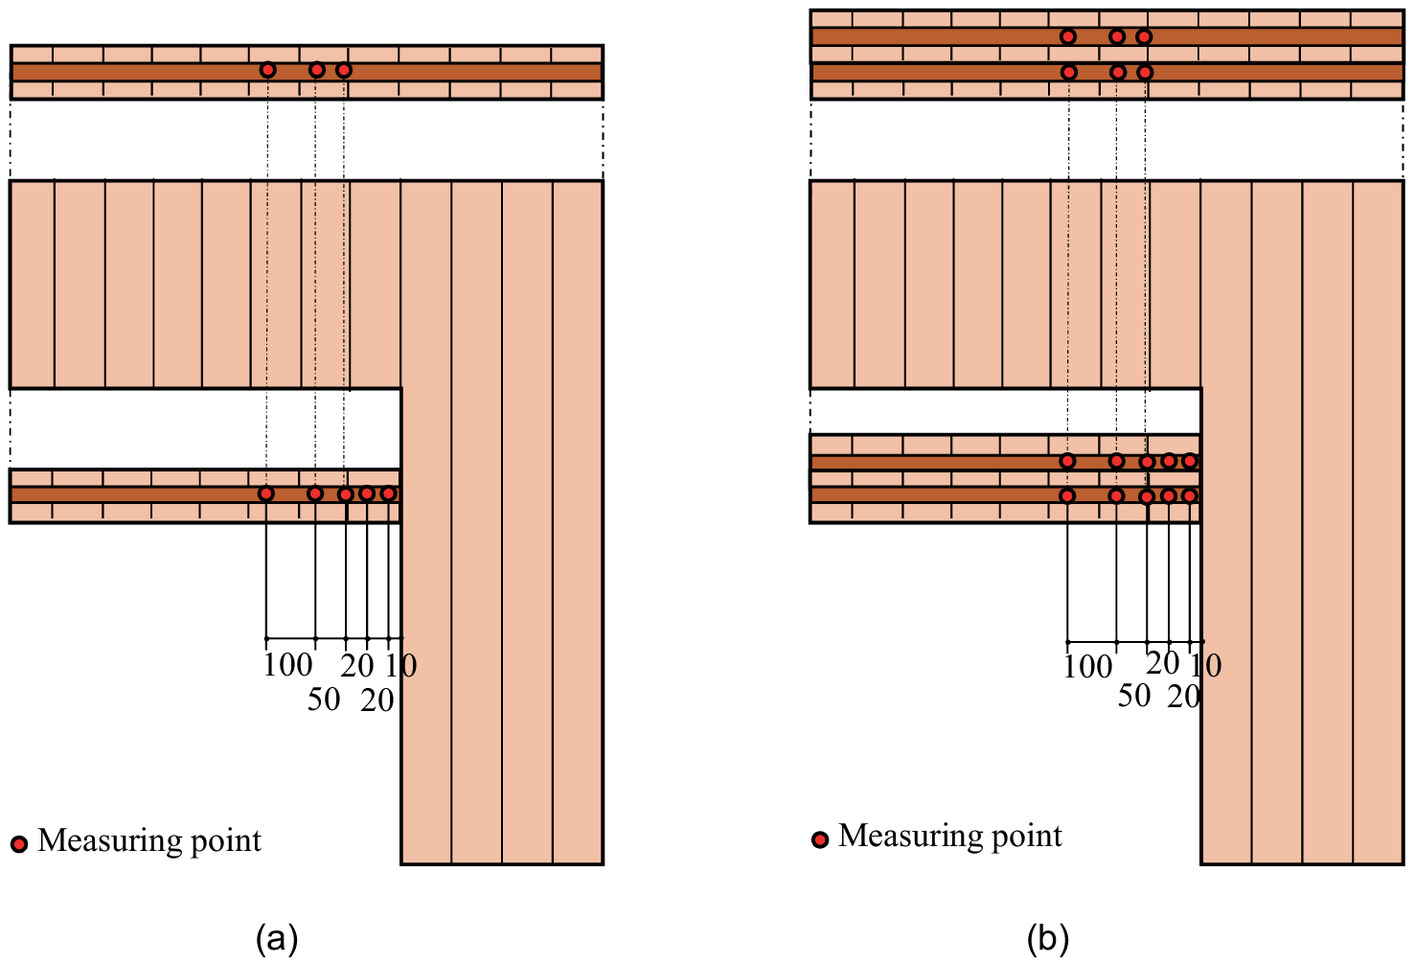
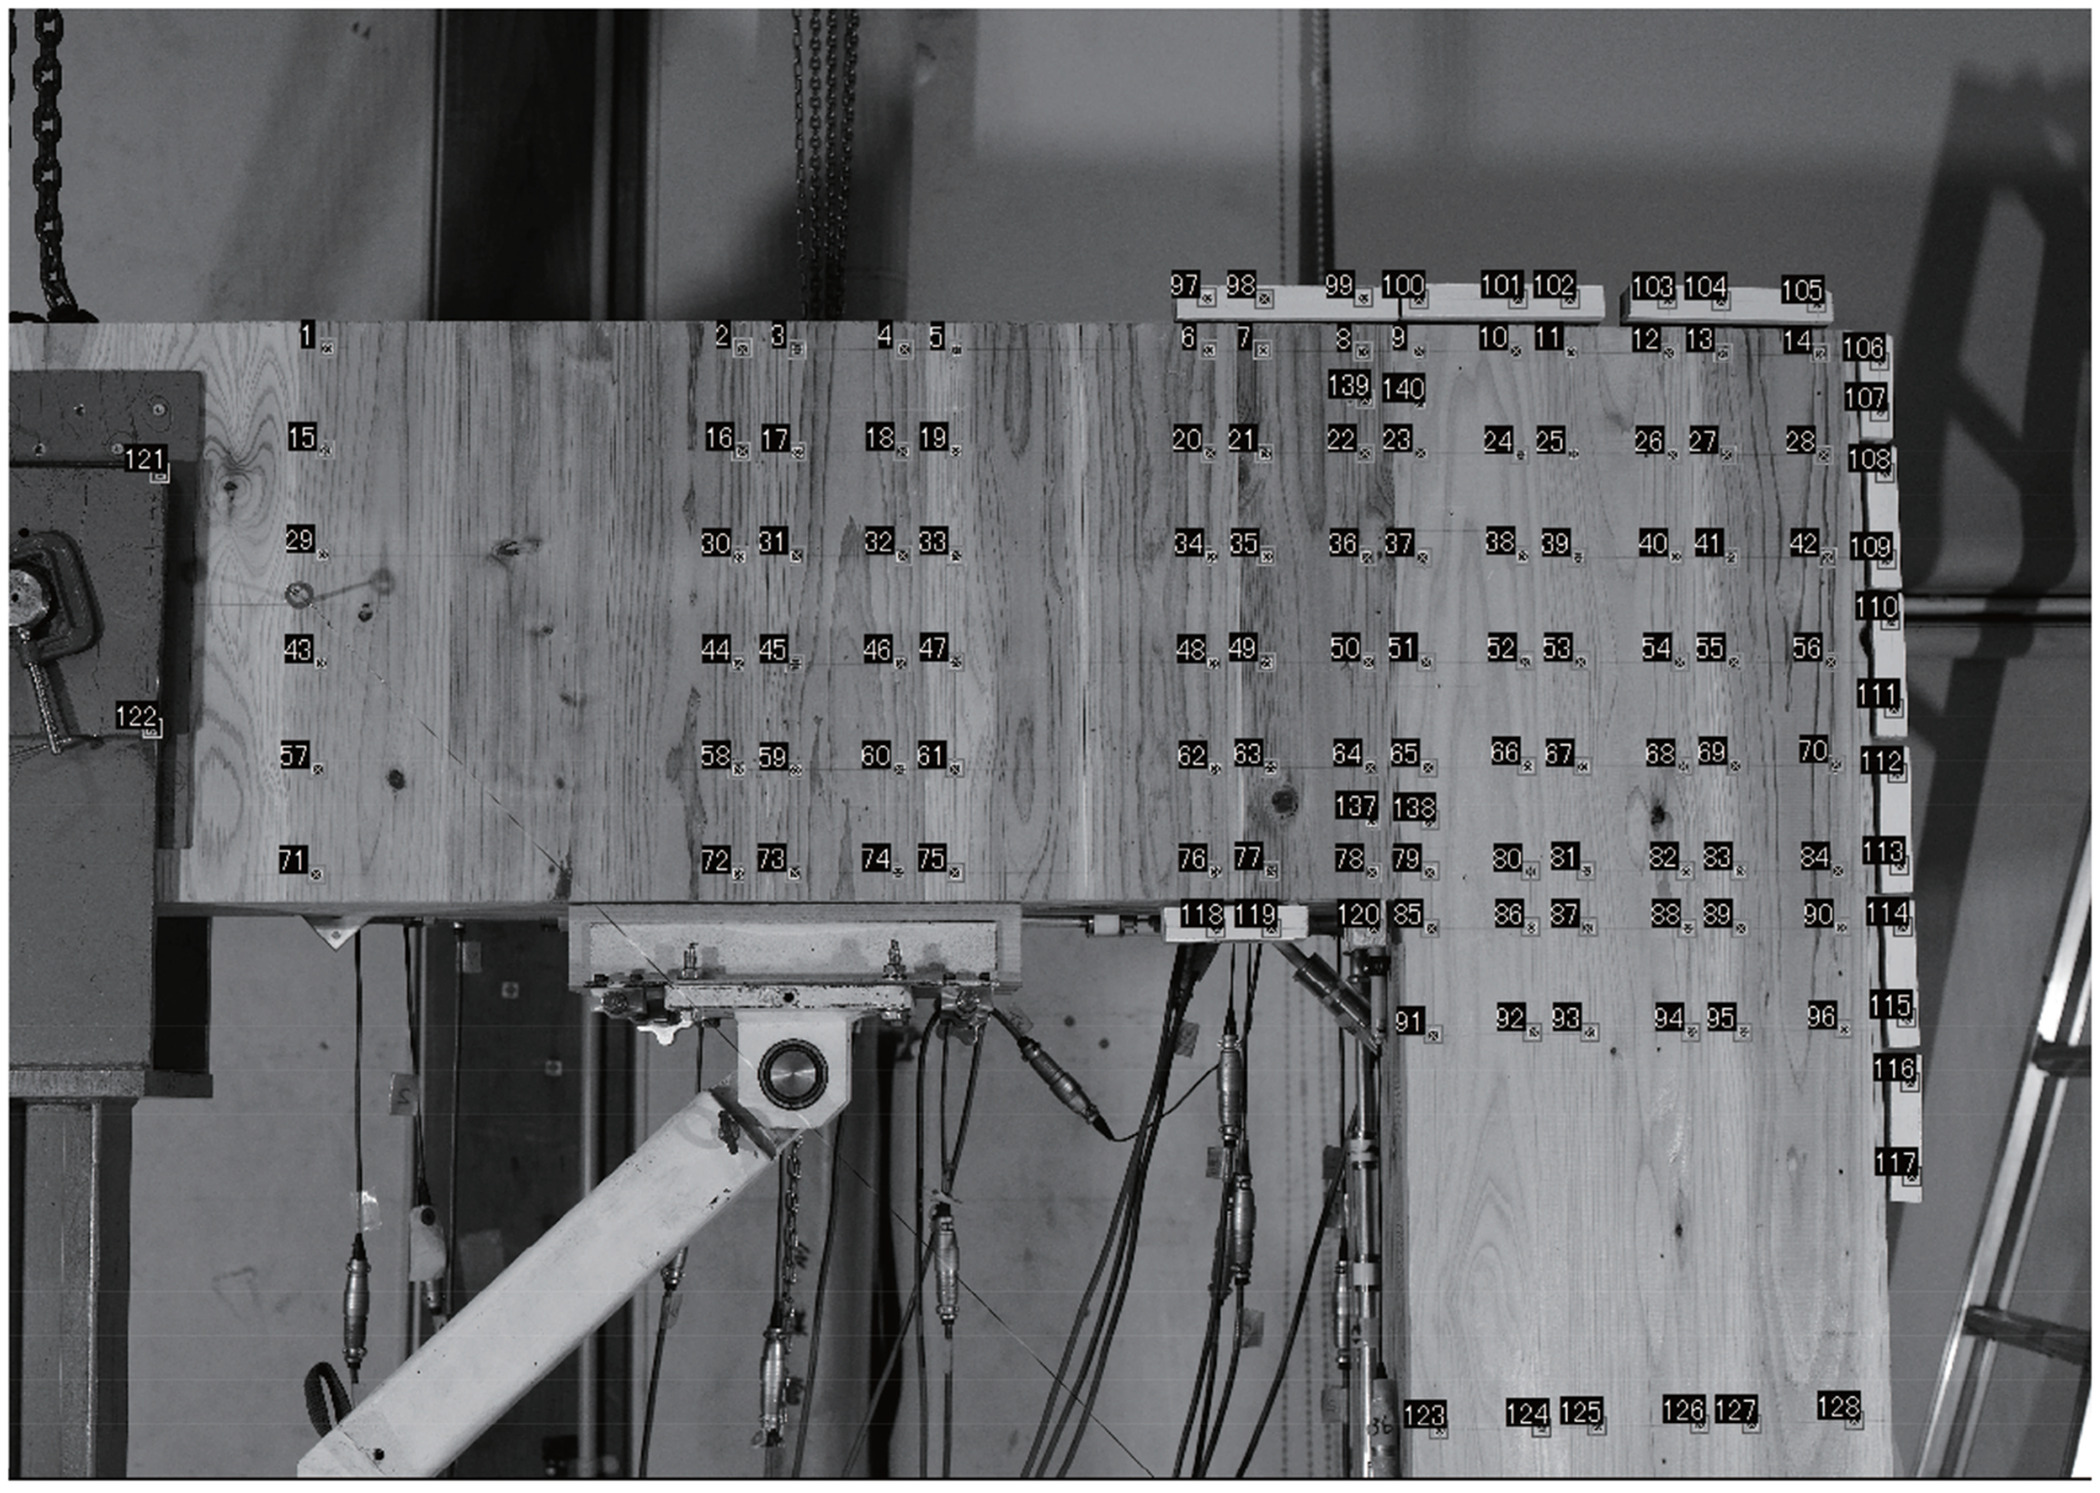
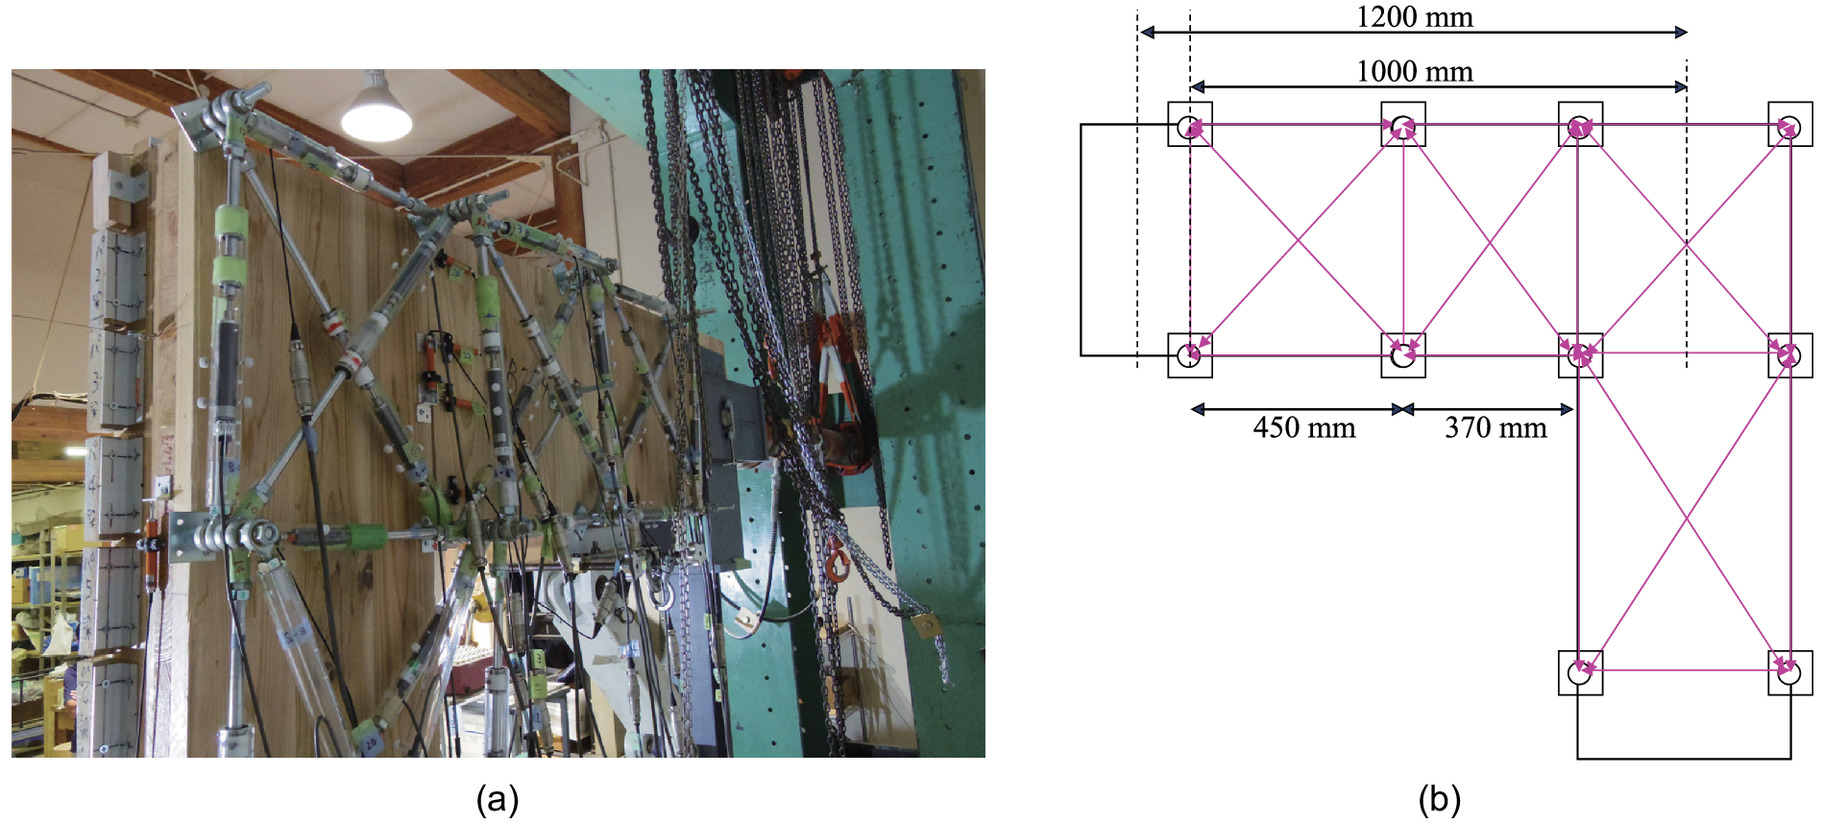
Fig. 7 shows the displacement sensors (denoted as S1, S2, etc.) used for all tests. For some specimens, to evaluate the strain distribution at the corners, strain gauges were attached at the upper and lower exposed laminae of the effective layers of the beam element (Fig. 8). Photogrammetric targets (Fig. 9) were used for image measurement to obtain the strain between adjacent surface laminae. Fig. 10 shows instrumentation attached to the specimens to track the shear deformation of four rectangular areas.
The specimens for the three-point bending and shear tests are summarized in Table 3. It was assumed that only layer(s) orthogonal to the loading direction could resist the bending load (effective layer). The letters 2M and 3M were used to indicate the number of effective layers of 2 and 3, respectively. This was followed by a number that indicated the height (d) of the specimen. The characters A, B, and C were added as the suffix to specify span/depth ratio (2.4, 5.4, and 2.7, respectively) in the bending test. The character S was added as a suffix for the shear-tested specimens. The area of the steel plate was enlarged to allow for the CLT element to resist the compressive force at the point of contact. The values for the shear and rolling shear are obtained for the gross section following the Japanese building standard law and government notice.
| Name | Span, (mm) | Height, (mm) | Thickness (mm) (effective layers) | Number |
|---|---|---|---|---|
| 3M240A | 580 | 240 | 90 | 8 |
| 3M240B | 1,300 | 240 | 8 | |
| 3M480A | 1,160 | 480 | 6 | |
| 2M240A | 580 | 240 | 60 | 8 |
| 2M240B | 1,300 | 240 | 8 | |
| 2M480C | 1,300 | 480 | 6 | |
| 3M240S | 720 | 240 | 90 | 8 |
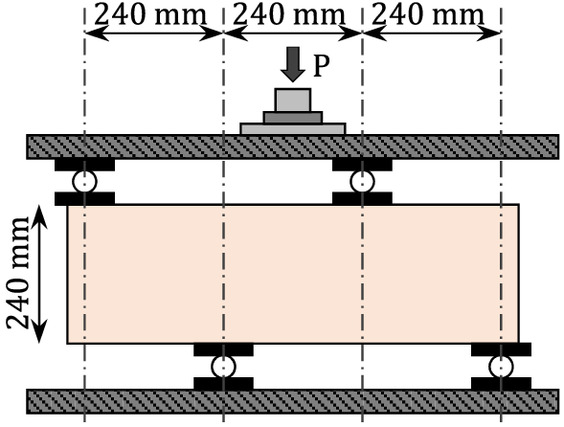
The three-point bending and shear tests were carried out to obtain mechanical properties of the CLT panels. The shear test was carried out following the set up reported in Arakawa and Ohno (1957) (Fig. 11).
Results and Discussion
Three-Point Bending and Shear Tests
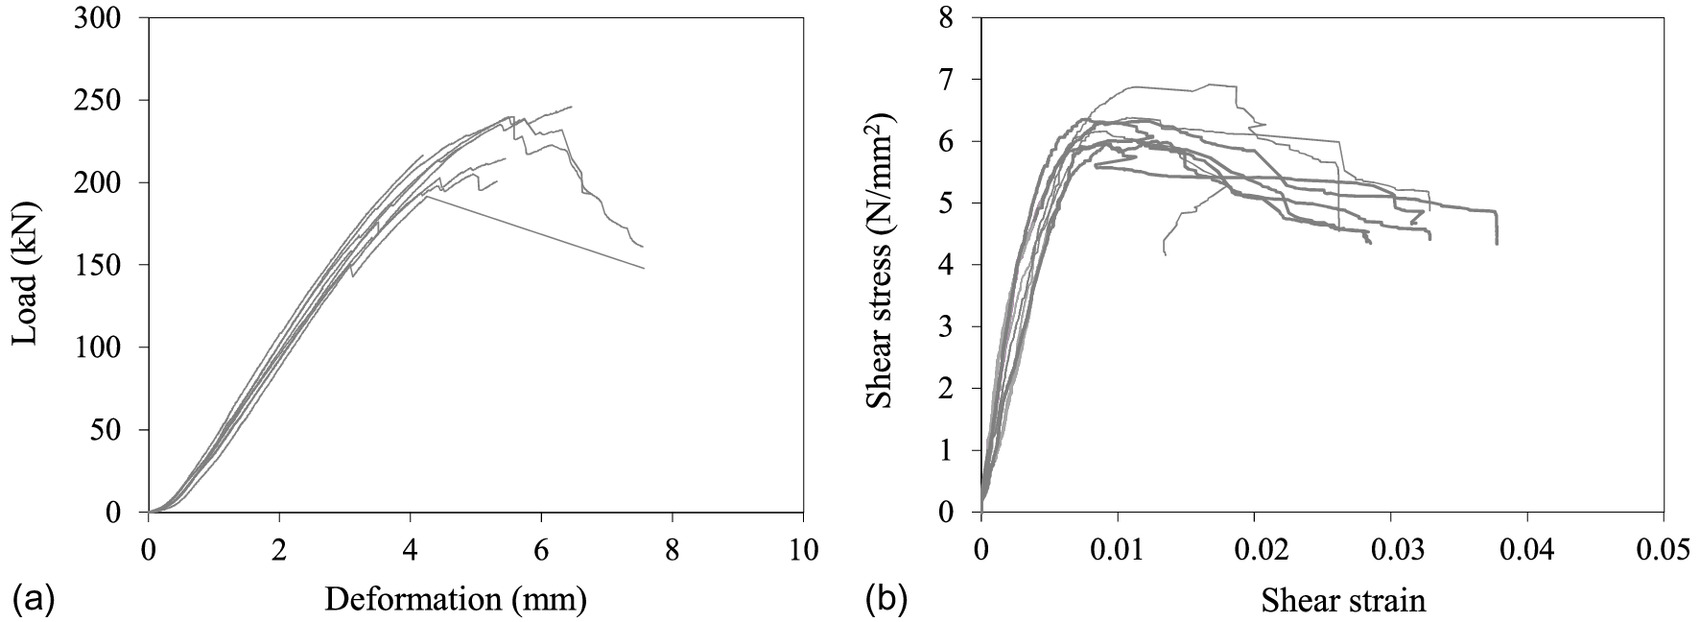
Figs. 12(a and b) shows load-deformation and shear stress-strain relationships from the three-point load and shear tests, respectively. The deformation was measured at the loading point. The shear stress was obtained by dividing the shear force by the cross section and multiplying by 1.5 to consider stress concentration. The strain was obtained by dividing the shear deformation measured with a displacement transducer by the height of specimen. In this calculation, a shape factor of 1.2 was considered. In the bending test, failure occurred right after the maximum load was achieved, i.e., brittle. In contrast, for the shear tests, a gradual decrease in load was observed after the maximum shear stress was obtained. This failure is defined when the load decreased to approximately 80% of the maximum shear stress.
The effective bending strength () of each specimen was calculated from the effective section modulus () and maximum moment (). Table 4 shows the elastic modulus results obtained from the slope of the line at and points of the load-displacement curves (see Isoda et al. 2021 for details). From the three-point load experiment, the mean value is . The elastic shear modulus of 3M240S is .
| Three-point load test | Bending strength, () | Young’s modulus, E () |
|---|---|---|
| 3M240A | 37.2 | 5,632 |
| 3M240B | 37.4 | 9,260 |
| 3M480A | 36.8 | 8,162 |
| 2M240A | 40.2 | 4,077 |
| 2M240B | 36.5 | 4,982 |
| 2M480A | 36.9 | 2,793 |
| Average | 37.6 | 5,818 |
Bending Test for L-Shape and T-Shape
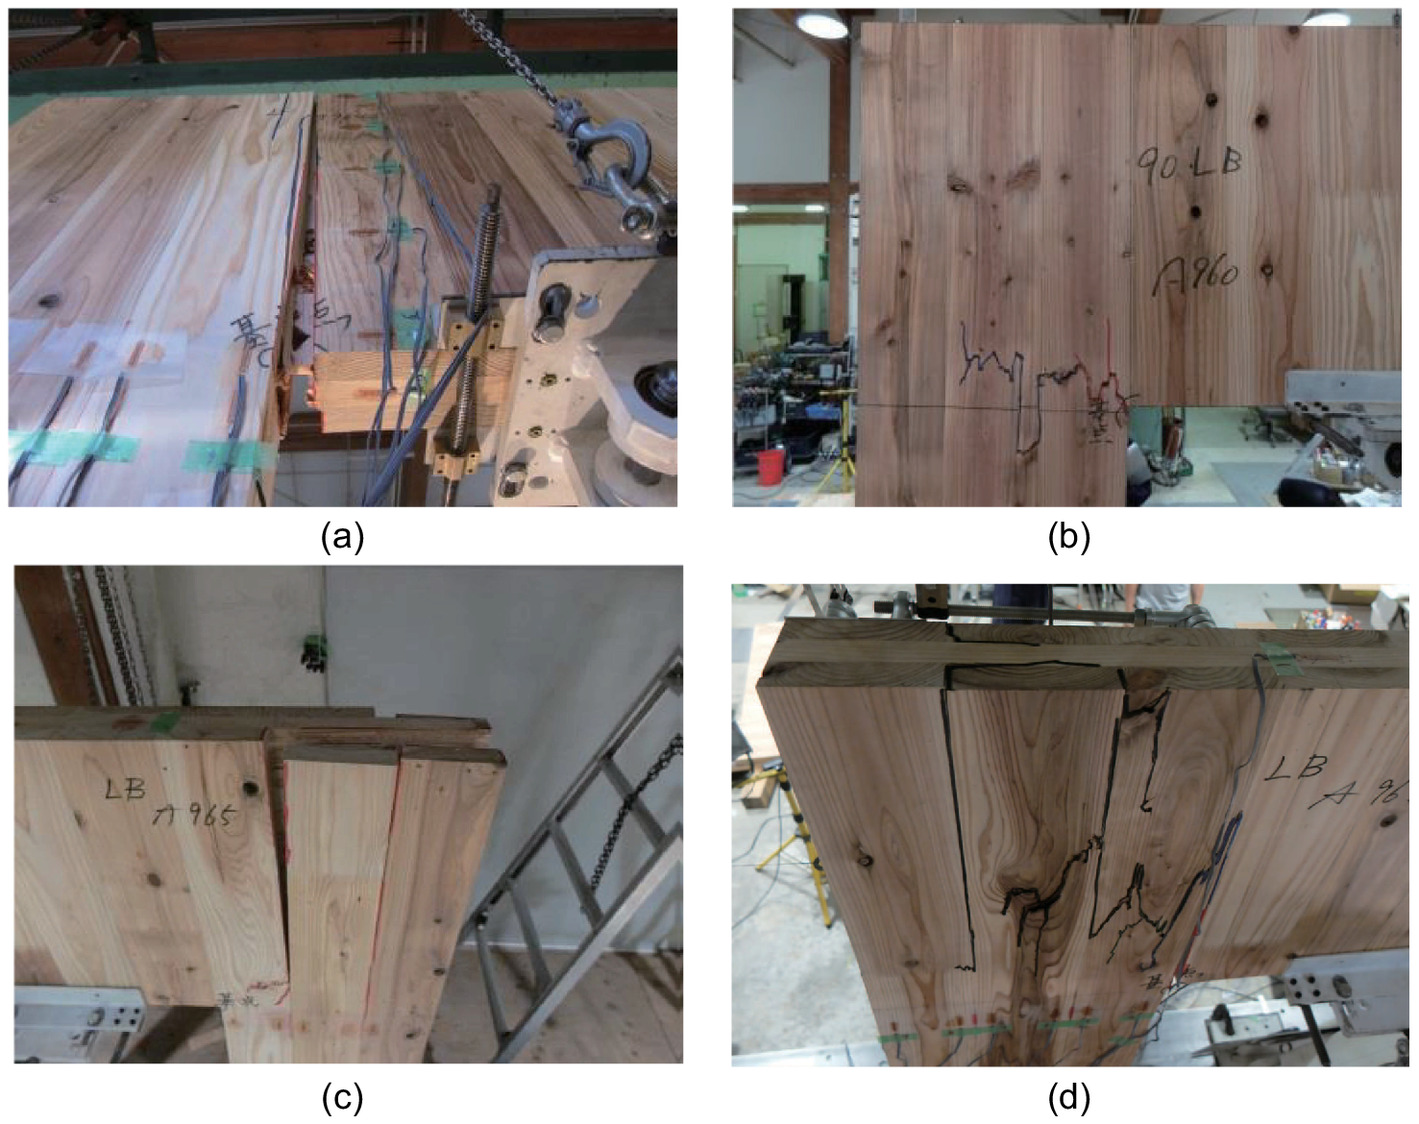
Fig. 13 shows examples of moment-deformation angle relationships. Both L- and T-shaped specimens had brittle failures. Once they reached peak load, bending failure of the beam or column with rolling shear (RS) failure mechanisms were observed (Fig. 14). For the L-shaped specimens, the distribution of failure categories is plotted in Fig. 15. When two failures occurred at the same time, they were both counted as failures. For example, when RS failure and bending failure of the beam occurred, they were classified into RS failure and bending failure of a beam. given the failure mode for the 5-layer specimens was a combination of bending and RS and for the 3-layer specimens was RS only, the RS resistance of 3-layer specimens may be proportionally lower than their bending resistance when compared to the 5-layer specimens.
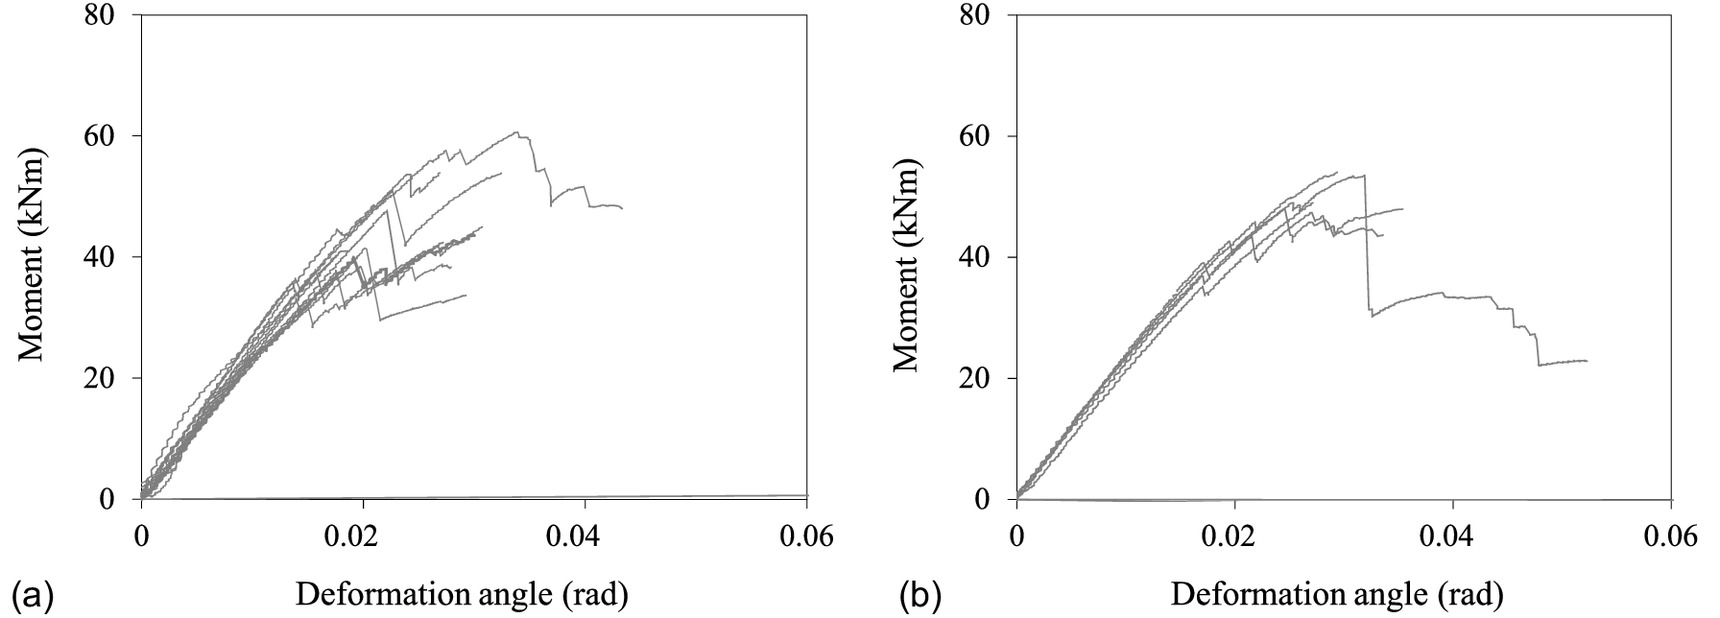
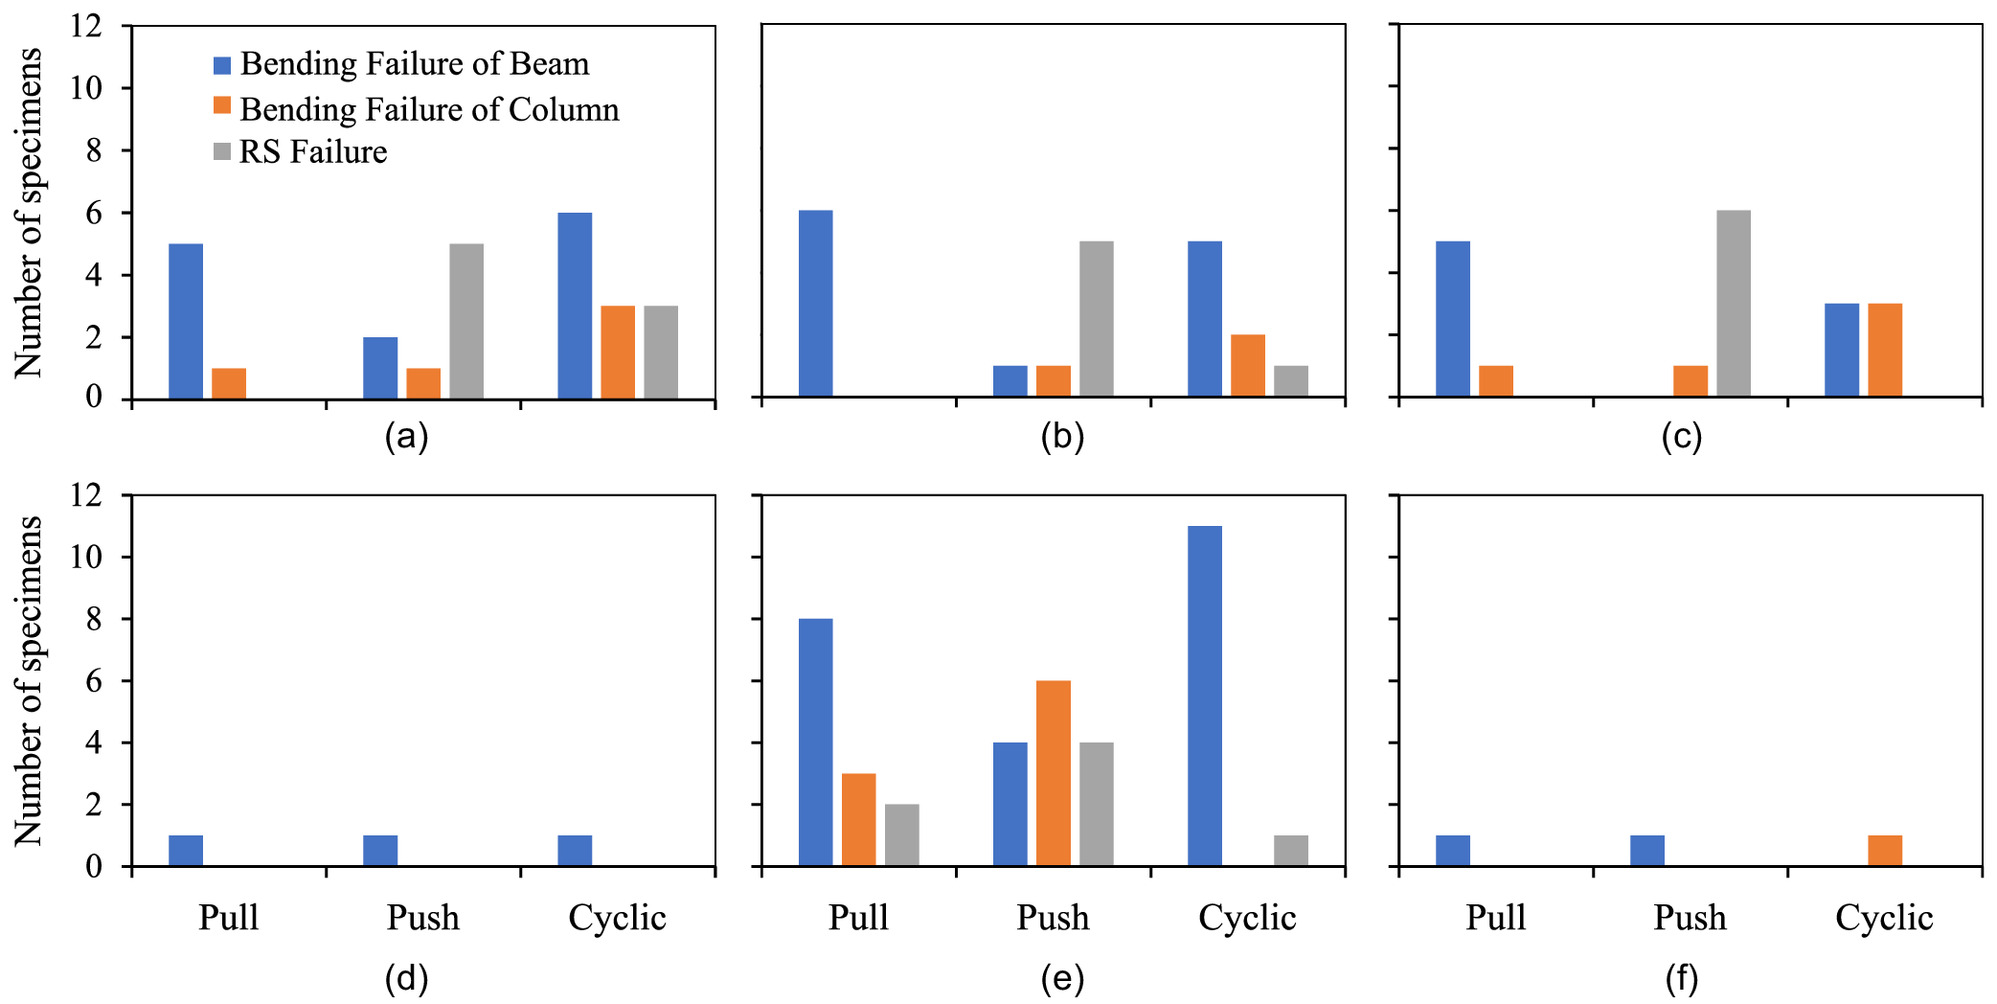
For the 5-layer T-shaped specimens, the bending and RS failures of the beam and column occurred at the same time. No significant difference in the shape of the specimens occurred in the 3-layer or 5-layer specimens. In many cases, the point at which the failure started was the entry corner of the specimen.
Bending Strength
Apparent bending strength is calculated by Eq. (4), where only the effective layer was considered in calculating the section moduluswhere A is the effective section area, P is the applied load, and is the moment generated in the corner of the panel zone.
(4)
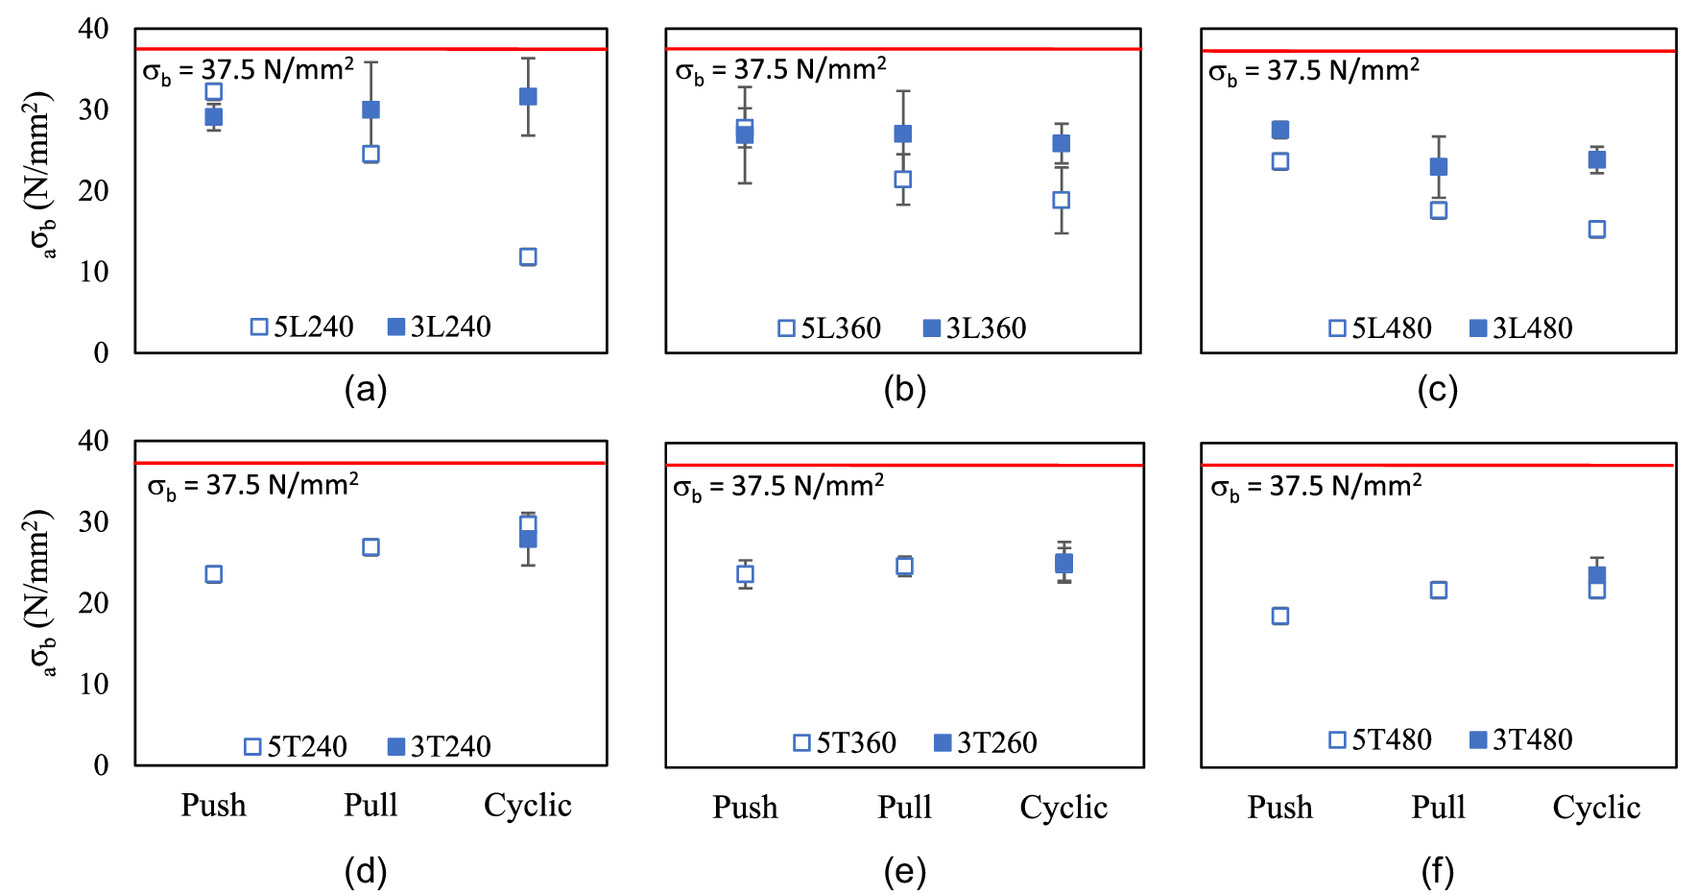
Fig. 16 shows the mean apparent bending strength values at the corners of the beam of the L- and T-shaped specimens and corresponding bending strength obtained by the three-point load test (red solid line). As a three-point load test was not conducted for the 3-layer specimen, results of the 5-layer specimens were used as a reference. For the L-shaped specimen, the strength decreased during the push, pull, and cyclic tests. Furthermore, the strength obtained in the push test was larger than that the pull test. No obvious trend is observed for the T-shaped specimens. Table 5 compares the mean strength values from the bending and three-point moment test. For the L- or T-shaped specimen bending tests, the mean strengths were approximately 30%–40% lower than the three-point bending test.
| Response | Testing type | 3-layer | 5-layer | ||
|---|---|---|---|---|---|
| L | T | L | T | ||
| Bending strength () | Bending for L- or T-shape | 27.5 | 25.7 | 21.4 | 23.3 |
| Three-point load test | 37.6a | 37.6a | 37.6 | 37.6 | |
| Ratio | 0.73 | 0.68 | 0.57 | 0.62 | |
| Rigidity () | Bending for L- or T-shape | 2,612 | 2,216 | 2,830 | 2,563 |
| Numerical analysis | 3,540 | 2,925 | 4,808 | 3,980 | |
| Ratio | 0.74 | 0.76 | 0.59 | 0.64 | |
a
It was assumed that the bending stress of the 3-layer specimen is the same as that of the 5-layer specimen.
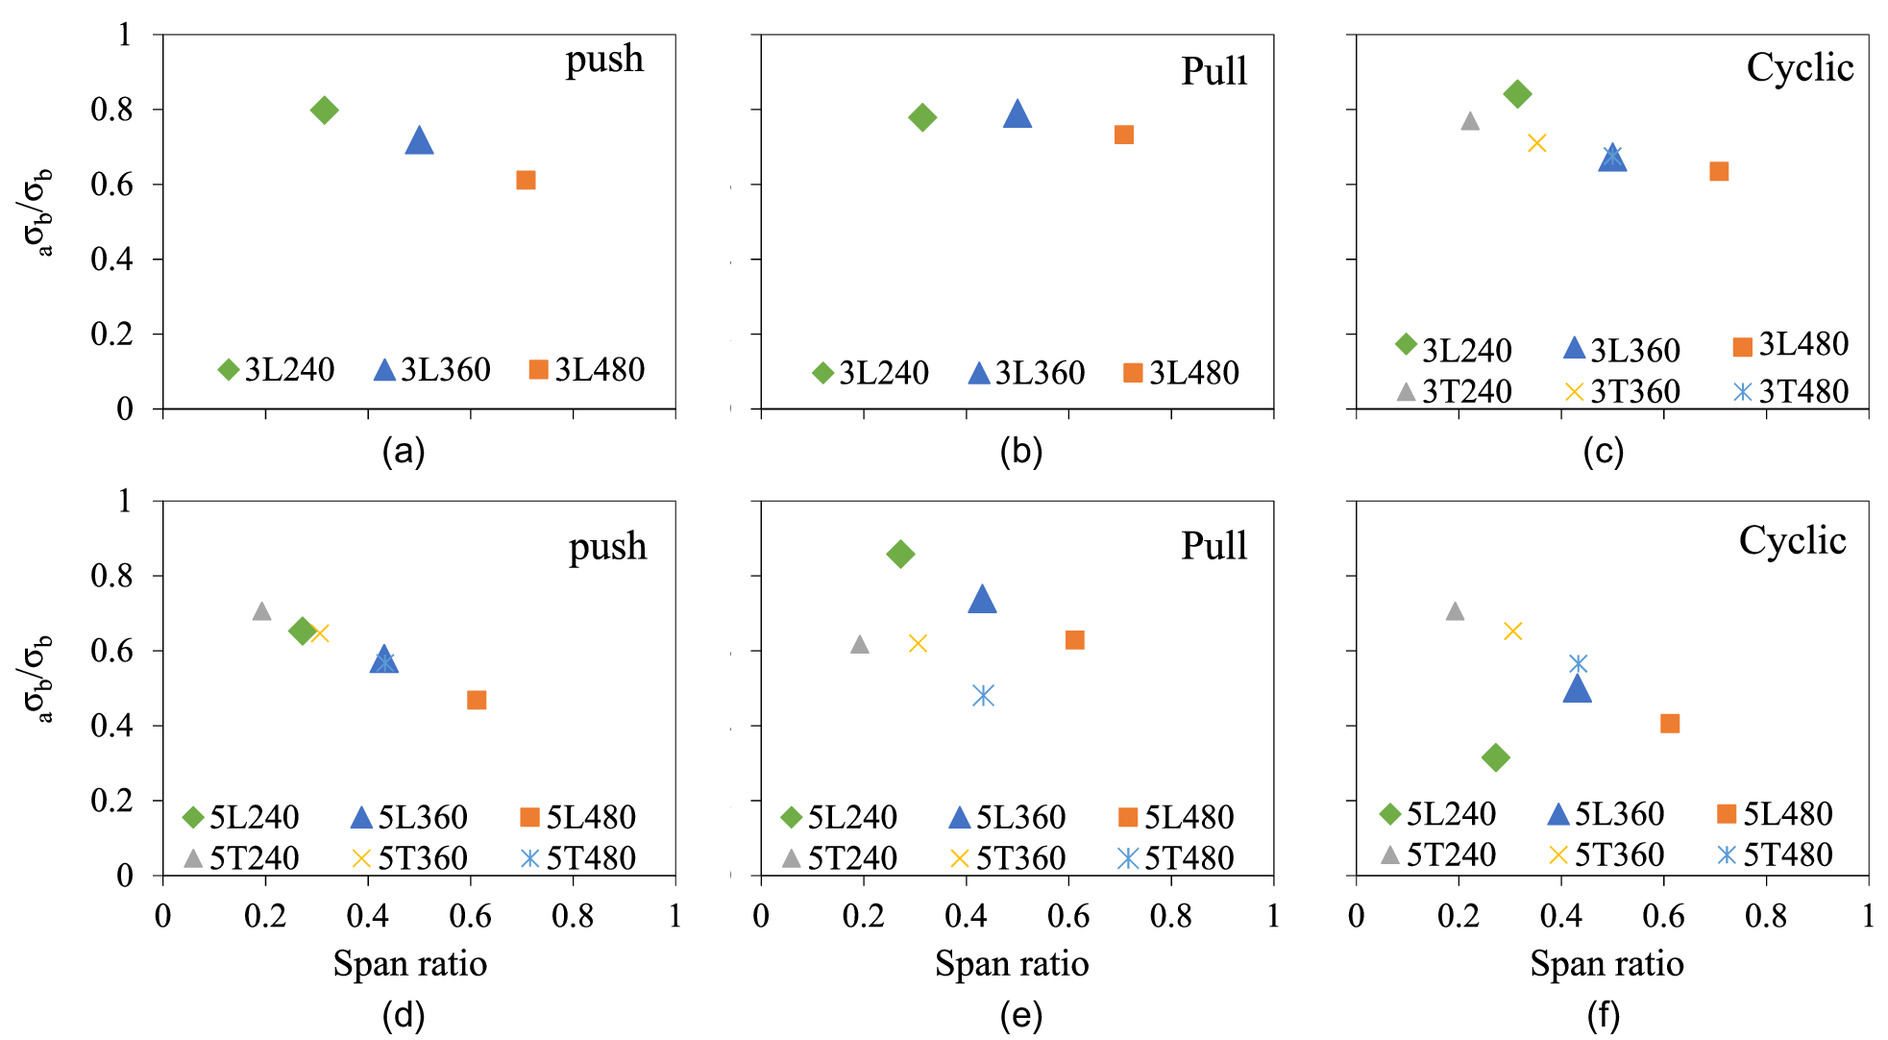
Fig. 17 shows the relationship between the reduction ratio and span ratio (defined as the depth of the dimension divided by the distance center of panel zone and pin joint of the beam). With increasing span ratios, there was a decrease in the reduction ratios. However, for the 3-layer L-shaped specimen under pulling, there was no apparent reduction. As shown in Fig. 16, it can be inferred that the main cause of failure under pull loading is bending failure of the beams; however, further study is needed to confirm this conclusion.
Strain of Beam and Column around the Corner
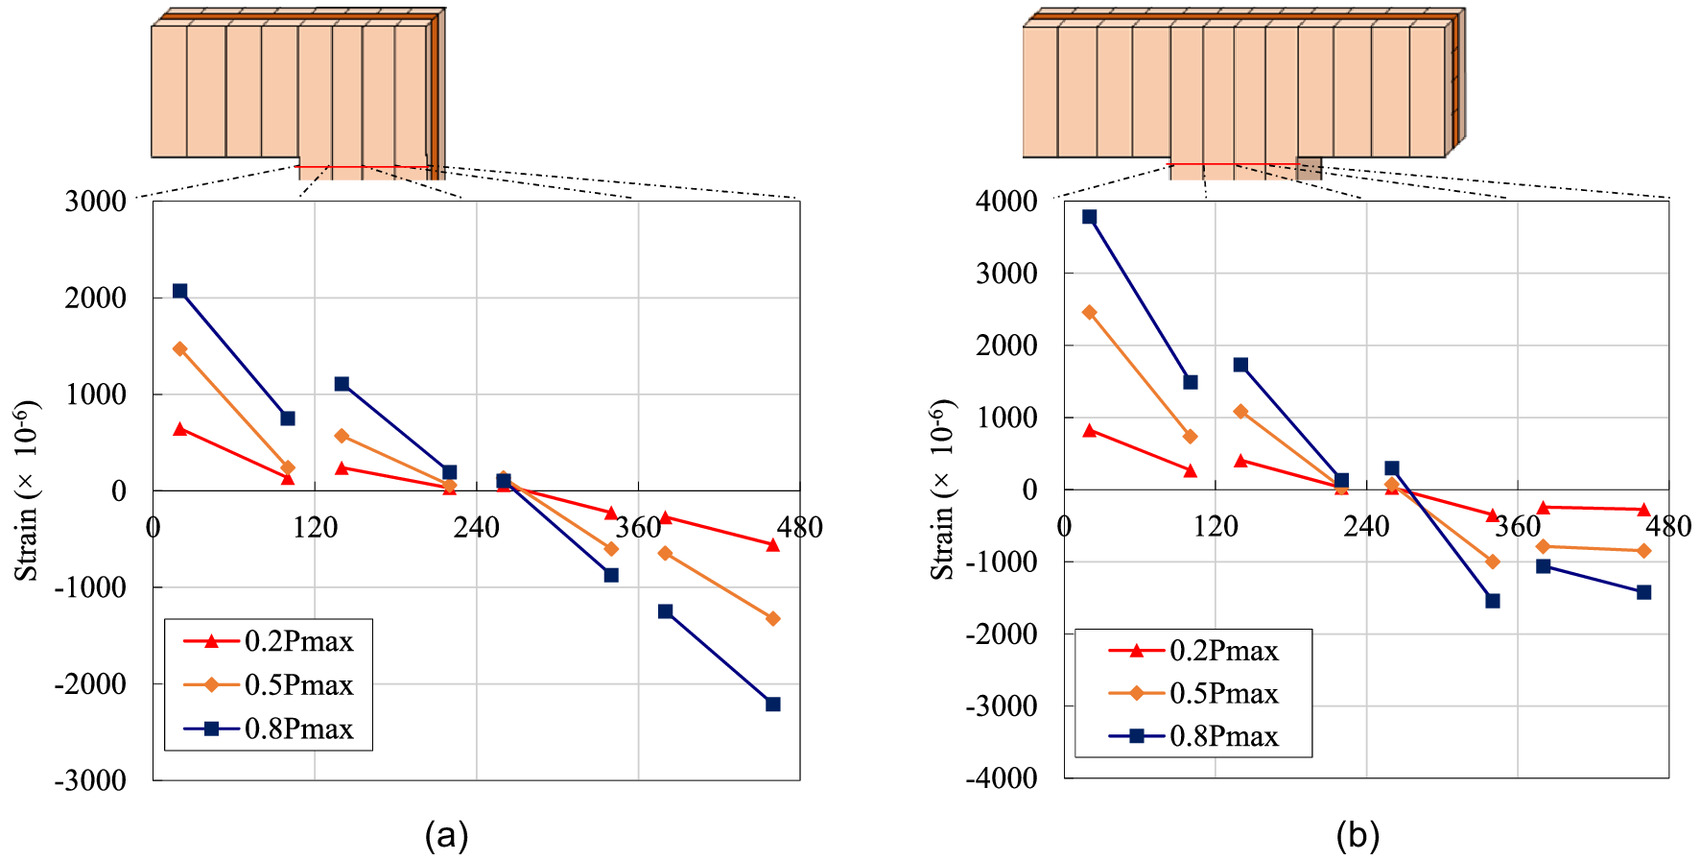
To examine the reduction in strength and stiffness, results of the strain gage values are presented in this section. Fig. 18 shows the strain distribution under different loads. The strain sharply increased at the corners, resulting in stress concentration. Fig. 19 shows the strain values obtained from the strain gauges attached to each lamina of the column near the opening in both the L-shape [Fig. 19(a)] and the T-shape [Fig. 19(b)]. Through numerical models, similar non-linear distributions of stress were reported in Casagrande et al. (2021a). The strain distribution is not linear, indicating that the Navier’s hypothesis, which assumes that plane strain sections remain plane, was not appropriate in reproducing the strain behavior. This phenomenon may reduce the rigidity and strength of the specimens, as similar results had been obtained by image measurement in the test; however, Watanabe et al. (2019) studied the compatibility of the Navier’s hypothesis with the CLT wall and achieved good results. As a result, this phenomenon should be investigated further.

Bending Stiffness
The stiffness of specimens was estimated by conducting numerical analysis using MIDAS iGen Ver.881R2. The models are shown in Fig. 20. These models were developed in accordance with the CLT manual as beam-column elements. The elastic moduli of these elements was calculated to include the shear behavior of CLT panels from the three-point load tests. The panel zone deforms primarily in shear due to the opposing moments in the beam and column. To capture these deformations, the model uses rigid elements around the perimeter of the panel zone. Each element is connected to a node of a beam or column and pin joints at the four corners. The rigidity of the springs, , is estimated by Eq. (5) following the CLT manual. Shear stiffness measured from experiments is adopted to these analytical models and the value is divided by 1.2 (coefficient of sectional form) to properly simulate the shear behavior of the panel zonewhere G is the shear modulus, T is the thickness of the CLT Panel, and is the angle between the spring and rigid element.
(5)
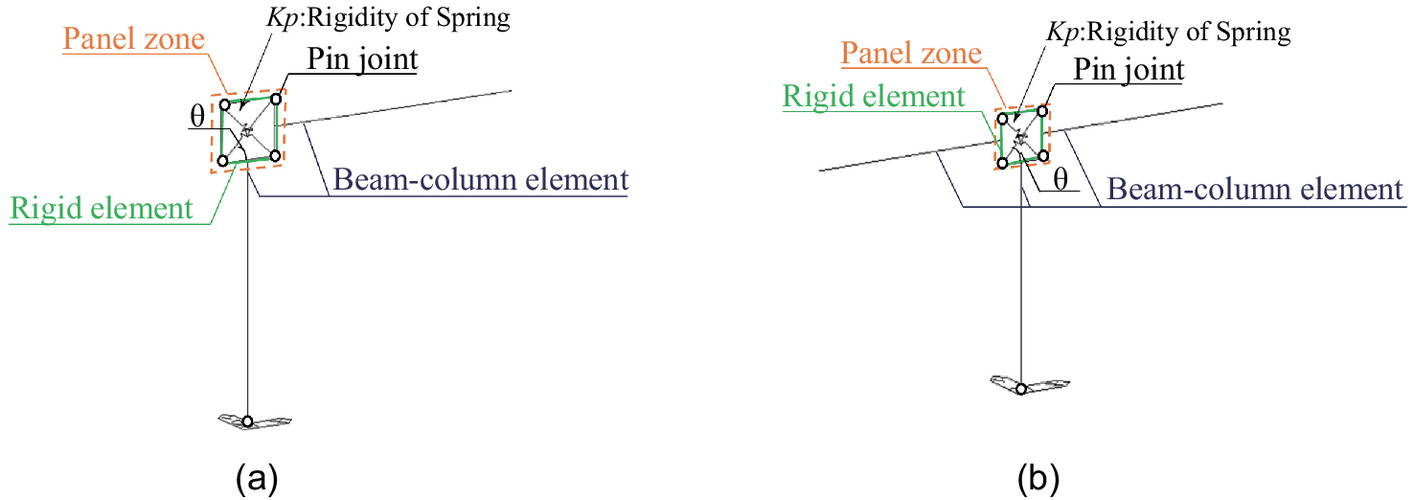
Fig. 21 shows a comparison of the numerical analysis and experiments of the L- and T-shaped specimens. The stiffness obtained from the measurements of the experiments was lower than that calculated with the numerical analysis. From Table 5, stiffness values of L- and T-shape specimens were obtained from the bending test and numerical analysis (shown in the next section). The rigidity was reduced to approximately 70% of that in the three-point bending test.

The estimated deformation of the panel zone generally agrees with the analysis. Similar results were obtained for other specimens, probably because of the stress concentration around the corner and the non-linear strain distribution in the beam and column. In order to replicate the flexibility of the CLT wall with openings (L- or T-shaped specimens) through an equivalent frame model (EFM), the modeling can be enhanced using the procedure outlined in Magenes and Della (1998). This modeling strategy was successfully used to replicate a CLT wall with openings by Casagrande et al. (2021a). In this paper, however, this extension is left for future work.
Conclusions
In this study, from CLT walls with cut-out openings, L- and T-shaped specimens were extracted and their strength and failure properties were analyzed. The findings are summarized as follows:
1.
Three types of failure, which is bending failure of a beam or column, and rolling shear failure, occurred in the experiments and were all brittle in nature because the critical point of bending failure is the tension side and rolling shear failure occurs at the glue layer, such as tension failure of timber. According to simple calculations of the failure mode, bending failure and rolling shear were estimated before shear failure. When a pulling side force was applied, the bending failure of the beam was the failure type that most frequently occurred. However, rolling shear failure occurred first in the pushover test for the 3-layer specimens. There was no significant difference in the bending strength among the T-shaped specimens for the pull-over, pushover, and cyclic tests.
2.
When compared with the bending strength obtained from the three-point bending test and L- and T-shape specimen, the bending strength of L- and T-shape specimen was lower than the three-point tests. This tendency of reduction was observed with increasing span ratios.
3.
The relationship between the strength and the span ratio, obtained by dividing the distance from the loading point of the specimen to its corner by the height of the beam, indicated that the strength of the component decreased with the span ratio. Furthermore, the increase in span ratio may have influenced the shear stress in the beam and column.
4.
According to the obtained strain, the Bernoulli-Euler theory is not followed.
5.
The strain was obtained from strain gauges, an image measurement, and a displacement gauge attached to each part of the specimen. As a result, the strain rapidly increases around the corner in the beam and the adjacent laminae moved in column. In conjunction, these factors may influence the strength of a CLT wall with a cut-out opening.
The experimental results describe the force transfer around the cut-out opening. Furthermore, a quantitative evaluation of the strength of CLT shear walls with a cut-out opening will be evaluated in the future through analytical studies. Moreover, strength and stiffness reduction factors that can be used for design will be proposed. Analysis of the glued surface of the panel zone using the Cohesive Zone Model will be conducted to investigate the stress conditions in the panel zone.
Data Availability Statement
Some or all data, models, or code generated or used during the study are available from the first author by request. Experimental data is available from the first author by request.
Acknowledgments
This study was based on the building standards development promotion project promoted by the ministry of land, infrastructure, transport and tourism “S7: Study on Design Method of Wooden Structures Using CLT (2013)” and the housing market development promotion project “Sophistication of Wooden Building Standards Using CLT (2014).” We would also like to thank all people and institutes involved, including Mami Wada who was a former student of RISH and the Hideyuki Nasu’s Laboratory of Nippon Institute of Technology, which cooperated in the experiment.
References
Aljuhmani, A. G., H. Alwashali, A. Ogasawara, E. Atsuzawa, M. Maeda, and M. Seki. 2022. “Experimental investigation on the effect of openings on the in-plane shear strength and stiffness of cross-laminated timber panels.” Eng. Struct. 254 (Mar): 113786. https://doi.org/10.1016/j.engstruct.2021.113786.
Arakawa, T., and K. Ohno. 1957. “Shear tests of reinforced concrete beams by a special type of loading (Structure).” Trans. Archit. Inst. Jpn. 57 (1): 581–584. https://doi.org/10.3130/aijsaxx.57.1.0_581.
Araki, Y., S. Nakashima, S. Nakajima, and Y. Yamaguchi. 2018. “Study on the opening reduction coefficient of CLT panel with opening.” [In Japanese.] AIJ J. Technol. Des. 24 (56): 147–152. https://doi.org/10.3130/aijt.24.147.
Casagrande, D., R. Fanti, G. Doudak, and A. Polastrci. 2021a. “Experimental and numerical study on the mechanical behaviour of CLT shearwalls with openings.” Constr. Build. Mater. 298 (6): 123858. https://doi.org/10.1016/j.conbuildmat.2021.123858.
Casagrande, D., R. Fanti, M. Greco, I. Gavric, and A. Polastri. 2021b. “On the distribution of internal forces in single-story CLT symmetric shearwalls with openings.” Structures 33 (Oct): 4718–4742. https://doi.org/10.1016/j.istruc.2021.06.084.
Committee of CLT Manual. 2016. Design and construction manual for CLT buildings. [In Japanese.] Tokyo: Japan Housing and Wood Technology Center.
Dujic, B., S. Klobcar, and R. Zarnic. 2008. “Shear capacity of cross laminated wooden walls.” In Proc., Wood Conf. on Timber Engineering (WCTE2008). Miyazaki, Japan: World Conference on Timber Engineering.
Isoda, H., M. Matsuda, S. Tesfamariam, and S. Tamori. 2021. “Shake table test of full-size wooden houses versus wall test result: Comparison of load-deformation relationship.” J. Perform. Constr. Facil. 35 (5): 04021043. https://doi.org/10.1061/(ASCE)CF.1943-5509.0001609.
Izzi, M., D. Casagrande, S. Bezzi, D. Pasca, M. Follesa, and R. Tomasi. 2018. “Seismic behaviour of cross-laminated timber structures: A state-of-the-art review.” Eng. Struct. 170 (Sep): 42–52. https://doi.org/10.1016/j.engstruct.2018.05.060.
JHWTC (Japan Housing and Wood Technology Center). 2016. Design and construction manual for CLT buildings. Tokyo: JHWTC.
Khajehpour, M., D. Casagrande, and G. Doudak. 2022. “The role of lintels and parapets on the mechanical performance of multi-story cross laminated timber shearwalls with openings.” Eng. Struct. 255 (Mar): 113912. https://doi.org/10.1016/j.engstruct.2022.113912.
Magenes, G., and F. A. Della. 1998. “Simplified non-linear seismic analysis of masonry buildings.” In Vol. 8 of Proc., 5th Int. Masonry Conf. 190–195. London: British Masonry Society.
Mestar, M., G. Doudak, A. Polastri, and D. Casagrande. 2021. “Investigating the kinematic modes of CLT shear-walls with openings.” Eng. Struct. 228 (Feb): 111475. https://doi.org/10.1016/j.engstruct.2020.111475.
Ministry of Agriculture, Forestry and Fishery. 2013. Japan agricultural standard—Notification 336 No. 3079. [In Japanese.] Tokyo: Japan Agricultural Standard Association.
Nihon System Sekkei Architects & Engineers. 2013. (Building Maintenance promotion project) survey report on structural performance and design method of CLT panel construction. [In Japanese.] Tokyo: Nihon System Sekkei Architects & Engineers.
Okabe, M., M. Yasumura, and K. Kobayashi. 2014. “Prediction of internal shear capacity of sugi CLT panels.” J. Wood Sci. 60 (3): 169–176. https://doi.org/10.2488/jwrs.60.169.
Pai, S. G. S., F. Lam, and T. Haukaas. 2017. “Force transfer around openings in cross-laminated timber shear walls.” J. Struct. Eng. 143 (4): 04016215. https://doi.org/10.1061/(ASCE)ST.1943-541X.0001674.
Popovski, M., and I. Gavric. 2016. “Performance of a 2-story CLT house subjected to lateral loads.” J. Struct. Eng. 142 (4): E4015006. https://doi.org/10.1061/(ASCE)ST.1943-541X.0001315.
Sato, M., H. Isoda, Y. Araki, T. Nakagawa, N. Kawai, and T. Miyake. 2019. “A seismic behavior and numerical model of narrow paneled cross-laminated timber building.” Eng. Struct. 179 (Jan): 9–22. https://doi.org/10.1016/j.engstruct.2018.09.054.
Shahnewaz, M., T. Tannert, M. Shahria Alam, and M. Popovski. 2017. “In-plane stiffness of Cross-laminated timber panels with openings.” Struct. Eng. Int. 27 (2): 217–223. https://doi.org/10.2749/101686617X14881932436131.
Sustersic, I., M. Fragiacomo, B. Dujic, and I. Gavric. 2016. “Seismic analysis of cross-laminated multistory timber buildings using code-prescribed methods: Influence of panel size, connection ductility, and schematization.” J. Struct. Eng. 142 (4): E4015012. https://doi.org/10.1061/(ASCE)ST.1943-541X.0001344.
van de Lindt, J. W., J. Furley, M. O. Amini, S. Pei, G. Tamagnone, A. R. Barbosa, D. Rammer, P. Line, M. Fragiacomo, and M. Popovski. 2019. “Experimental seismic behavior of a two-story CLT platform building.” Eng. Struct. 183 (Mar): 408–422. https://doi.org/10.1016/j.engstruct.2018.12.079.
Watanabe, H., T. Tsuchimoto, S. Nakashima, T. Miyake, K. Matsumoto, and Y. Azumi. 2019. “A study on expansion and improvement of the structural design method for CLT panel construction. Part 4: Verification on Bernoulli-Euler hypothesis at the end of CLT panel.” In Proc., Architecture Institute of Japan. [In Japanese.] Tokyo: Architectural Institute of Japan.
Yasumura, M., K. Kobayashi, M. Okabe, T. Miyake, and K. Matsumoto. 2016. “Full-scale tests and numerical analysis of low-rise CLT structures under lateral loading.” J. Struct. Eng. 142 (4): E4015007. https://doi.org/10.1061/(ASCE)ST.1943-541X.0001348.
Zhang, X., H. Isoda, K. Sumida, Y. Araki, S. Nakashima, T. Nakagawa, and N. Akiyama. 2021. “Seismic performance of three-story cross-laminated timber structures in Japan.” J. Struct. Eng. 147 (2): 04020319. https://doi.org/10.1061/(ASCE)ST.1943-541X.0002897.
Information & Authors
Information
Published In

Journal of Structural Engineering
Volume 149 • Issue 5 • May 2023
Copyright
This work is made available under the terms of the Creative Commons Attribution 4.0 International license, https://creativecommons.org/licenses/by/4.0/.
History
Received: Mar 5, 2022
Accepted: Oct 28, 2022
Published online: Feb 26, 2023
Published in print: May 1, 2023
Discussion open until: Jul 26, 2023
Authors
Metrics & Citations
Metrics
Citations
Download citation
If you have the appropriate software installed, you can download article citation data to the citation manager of your choice. Simply select your manager software from the list below and click Download.
Cited by
- Thusiyanthan Ponnampalam, Satheeskumar Navaratnam, Julian Thamboo, Guomin Zhang, Influence of Cross-Laminated Timber Floors and Their Connections on the Robustness of Mass-Timber Building: A Case Study on a Midrise Building, Journal of Performance of Constructed Facilities, 10.1061/JPCFEV.CFENG-4589, 37, 6, (2023).