Social Equity of Bridge Management
Publication: Journal of Management in Engineering
Volume 39, Issue 5
Abstract
Data-driven social equity assessments of infrastructure performance are essential for reducing inequity and for institutionalizing community stakeholder considerations in infrastructure asset management programs. We expand upon literature at the intersection of engineering management and social impact, which has focused on the engineering workforce or the stakeholders of individual projects, to inform equity assessments of overarching programs and their outcomes. We conducted a social equity assessment of the National Bridge Inventory (NBI) component condition ratings by comparing the contribution of established bridge deterioration modeling variables to community demographics surrounding the bridge. To do this, we extend existing ordered probit regression modeling approaches of bridge component condition ratings to a national dataset that spatially matches NBI bridge coordinate data to US Census Bureau tracts to append indicators for income, race, ethnicity, and disadvantaged communities. We found that bridges located in lower-income tracts, tracts identified as disadvantaged communities by the Climate and Economic Screening Tool (CEJST), and tracts with a majority of Black or African American individuals are more likely to be in poor condition. At least on an associative basis, we find that bridge condition is not equitably distributed across communities in the United States, even when controlling for differences in deterioration due to age, traffic type, traffic volume, bridge materials, waterways, and climate. This study suggests that racial equity should be an added component (beyond economic measures of inequity) that informs bridge maintenance program funding and project prioritization to ensure greater equity in our bridge system.
Introduction
Transportation infrastructure can enable prosperity, but also disproportionately burden underserved and vulnerable communities. Analyses that inform equitable management of our transportation system are imperative and needed by decision-makers (Levitt 2007; Jones and Armanios 2020). The need for equity analysis is so critical that the White House issued Executive Orders (E.O.) 13985 and “Further Advancing Racial Equity and Support for Underserved Communities Through The Federal Government” (2023) implemented the Justice40 Initiative to allocate 40% of federal spending in clean transportation to benefit overburdened and underserved communities (Young et al. 2021), and launched the Climate and Economic Screening Tool (CEJST) to identify and address inequities in the application of infrastructure spending in the United States (Council on Environmental Quality 2020). Concurrently, the DOT issued a request for information on transportation equity data which received 316 submissions from over 350 entities (US DOT 2021; Armanios et al. 2021; US DOT 2022a) and is now developing its own equity assessment tool (US DOT 2023). To institutionalize this centering of equity, the DOT has chartered an Advisory Committee on Transportation Equity to continue to guide the implementation of their Equity Action Plan and Strategic Plan (US DOT 2022a).
These plans are essential to the equitable implementation of the Bipartisan Infrastructure Law that appropriated $27.5 billion for the Bridge Replacement, Rehabilitation, Preservation, Protection, and Construction Program (also known as the Bridge Formula Program) for fiscal years 2022 through 2026 (Federal Highway Administration 2022). Thus, in addition to the provisions of the Bridge Formula Program, state and local authorities are recommended to integrate multistakeholder social equity considerations into their risk-based asset management approach for prioritizing program funding. A critical step for this is to develop data-driven methods and approaches that explicitly incorporate community demography into maintenance planning and performance evaluation (US DOT 2022b). To answer these calls for methods that help correct historical inequities in public infrastructure investment (Kalla 2022), our study seeks to develop and apply social equity-driven methods toward bridge management.
Literature Review
The prevailing diversity, equity, and inclusion (DEI) studies in engineering management are predominately focused on an organization’s internal engineering workforce (Jafari et al. 2020; Karakhan et al. 2021), and studies of external stakeholder equity and inclusion have been limited to infrastructure siting and design decisions (Brinkman and Lin 2022; Desai and Armanios 2018; Dutta et al. 2021; Jones and Armanios 2020; Mohl 2008), the impacts of individual construction projects (Khan et al. 2021; Wu et al. 2021), or the social costs of failures and disruptions on users (Coleman et al. 2020; Yang and Frangopol 2020). A notable exception is the integration of social equity into roadway pavement maintenance planning in Texas over a four-year period (France-Mensah et al. 2019). However, to our knowledge, prior studies have not performed a nationwide, systematic, and large-scale methodological approach for correlating differences in bridge condition to differences in the community stakeholders that are near to said bridges but may not regularly use them (let alone for other programs that oversee other critical infrastructure). Thus, we propose a national and programmatic approach that compares the performance of 587,700 bridges inventoried over a 31-year period (1990–2020) by the socioeconomic disadvantage, race, and ethnicity of the community next to each bridge.
During bridge planning, siting and design factors such as underclearance restrictions can reinforce historical city planning decisions that allow inequity to persist (Desai and Armanios 2018; Jones and Armanios 2020). To disentangle selection effects (demographic drivers of infrastructure decisions) and treatment effects (infrastructure drivers of community changes), Jones and Armanios (2020) compared the socioeconomic characteristics of a community ten years prior to a bridge being built in that community (indicative of selection) and found that new bridges with restrictive underclearances were more associated with racial and ethnic minority communities. When testing for treatment effects, they did not find a significant association between the construction of a restrictive bridge and subsequent community characteristics. Our aim is to extend these important correlations identified in the Jones and Armanios (2020) study from restrictive bridge siting in Pennsylvania to bridge condition (the result of both initial design and downstream maintenance decisions) across all fifty states and the District of Columbia.
As a seminal example of the importance of siting and design decisions, the “freeway revolts” in response to the initial planning of the US Interstate Highway System highlighted the inequitable impacts of siting highway bridges in urban communities and the importance of political capital in affecting planning outcomes (Brinkman and Lin 2022; Mohl 2008). Thus, equity assessments and multistakeholder engagement are essential for new projects (Khan et al. 2021; Litman 2021; Wu et al. 2021), as evidenced by the Title VI complaint on the proposed recapitalization of the Harbor Bay Bridge in Corpus Christi, Texas. This drove the Texas Department of Transportation (TxDOT) to provide resettlement assistance to individuals who were displaced as a result of the reconstruction (Lado 2017; Rico 2017). More recently, the TxDOT received a Title VI complaint from Harris County regarding the proposed siting of Interstate 45 in North Houston (Segarra and Utley 2021).
In addition to planning and construction decisions that impact long-term performance and equity, life-cycle, and reliability assessments reveal that near-term maintenance decisions can impact the safety (Tao et al. 2021), accessibility (Chen and Wang 2020; Coleman et al. 2020), and future maintenance costs (Howe et al. 2016) of existing transportation infrastructure. Local communities that rely on bridges for efficient and safe travel suffer when bridges are suddenly closed due to unforeseen failures (Palagi and Javernick-Will 2020; Yang and Frangopol 2020). For example, severe deterioration forced the closure of the South Park bridge in Seattle, Washington in 2010, separating the community from critical amenities, resources, and freight until the bridge could be reconstructed with federal funding in 2014 (Federal Highway Administration 2017). Bridges in poor condition present financial liabilities because rehabilitation costs often increase sharply as bridges deteriorate, and they will require extensive maintenance and additional inspections to stay in service (Howe et al. 2016). To illustrate this point, prior to the collapse and $25.3 million reconstruction of the Fern Hollow bridge in Pittsburgh, Pennsylvania (Blazina 2022), the total cost of the Fern Hollow bridge rehabilitation was estimated at $1.5 million in 1997 (Federal Highway Administration 2021).
Further, social metrics used to prioritize bridge investments are typically limited to the impacts on highway users such as average daily traffic (ADT) and detour length in the event the bridge is closed (Miller and Gransberg 2015; Desai and Armanios 2018). However, pollution, excess traffic, and aesthetic impacts from deteriorating or underperforming bridges affect the safety and livability of neighboring communities in addition to the users of the bridge (Litman 2021). In particular, the demography, resources, and resilience of the neighboring communities are typically omitted from data-based decision making (Coleman et al. 2020; Ahmed and Garvin 2022). Thus, in practice, the impacts of the bridge on the local community, who may not necessarily use the bridge, are not adequately captured in decision making. In fact, the key complaint in the Title VI filings in response to highway planning efforts in Corpus Christi and Houston, Texas was that community input was not appropriately considered in the planning process (Rico 2017; Segarra and Utley 2021). To understand equity implications associated with bridges, we assessed trends in bridge condition based on the demography of the census tracts spatially coincident with bridges, above and beyond user data such as ADT and detour length.
Theory and Hypotheses
There are numerous possible philosophical perspectives to inform infrastructure provision. These can range from pure utility maximization (utilitarianism) to equality for all (egalitarianism) (Lewis et al. 2021). Of those possibilities, we use a conception based on the principles of equity as founded in Rawlsian philosophy, whereby “the principles of justice are agreed to in [a hypothetical] initial situation that is fair (Rawls 1971, p. 13).” Moreover, the just institution operates behind a “veil of ignorance” with regard to the social or political position of its benefactors (Rawls 1971). Conceptually, this approach assumes equality for all (horizontal equity) until characteristics of disadvantage necessitate special consideration (vertical equity) (El-Geneidy et al. 2016; Jones and Armanios 2020; Litman 2021). Given that Rawlsian approaches are an oft-used approach in transportation infrastructure (Lewis et al. 2021), this additionally allows us to base our work more directly upon prevailing philosophical foundations in prior work.
To operationalize this approach, we use Jones and Armanios’ (2020, p. 1) definition of social equity as the “even distribution of the benefits and costs of infrastructure assets (horizontal equity), unless factors, which the authors seek to identify here, undermine this distribution in ways that especially impact more marginalized groups (vertical equity).” This working definition of equity is essential to our hypotheses and findings in light of the implementation of the Federal-Aid Highway Act of 1956, particularly the siting of interstate highway infrastructure, which was found in prior work to create historic and structural inequities that were asymmetrically felt by certain marginalized groups (Barajas 2021; Brinkman and Lin 2022; Desai and Armanios 2018; Mohl 2008). Therefore, our inclusion of demographic groups is to test whether the bridge condition is indeed equitably managed.
Consistent with prior work (Winner 1980; Desai and Armanios 2018; Jones and Armanios 2020; Brinkman and Lin 2022; Barajas 2021; Mohl 2008; Karner et al. 2020), our overall proposition is that bridge condition management is inequitable and therefore bridge maintenance is more greatly associated with wealthier and less marginalized communities. As shown in Table 1, this leads to several specific hypotheses where we posit that each bridge component rating will have a positive correlation with the affluence of the coincident census tracts and a negative correlation to those coincident census tracts with a high proportion of racial or ethnic minorities. Further, we hypothesize that coincident census tracts identified as disadvantaged communities in the CEJST will be associated with lower bridge component conditions. Consistent with a Rawlsian conception of equity, our null hypothesis is bridge condition ratings should be no different whether located in census tracts with a majority of racial or ethnic minorities or with a high or low median household income (Rawls 1971).
| Variables | Deck | Superstructure | Substructure |
|---|---|---|---|
| Increasing Median Household Income | Positive | Positive | Positive |
| Minority (Non-White and/or Hispanic or Latino) | Negative | Negative | Negative |
| Black or African American, not Hispanic or Latino | Negative | Negative | Negative |
| Hispanic or Latino of any race | Negative | Negative | Negative |
| Disadvantaged Community (CEJST) | Negative | Negative | Negative |
National Bridge Inventory Data
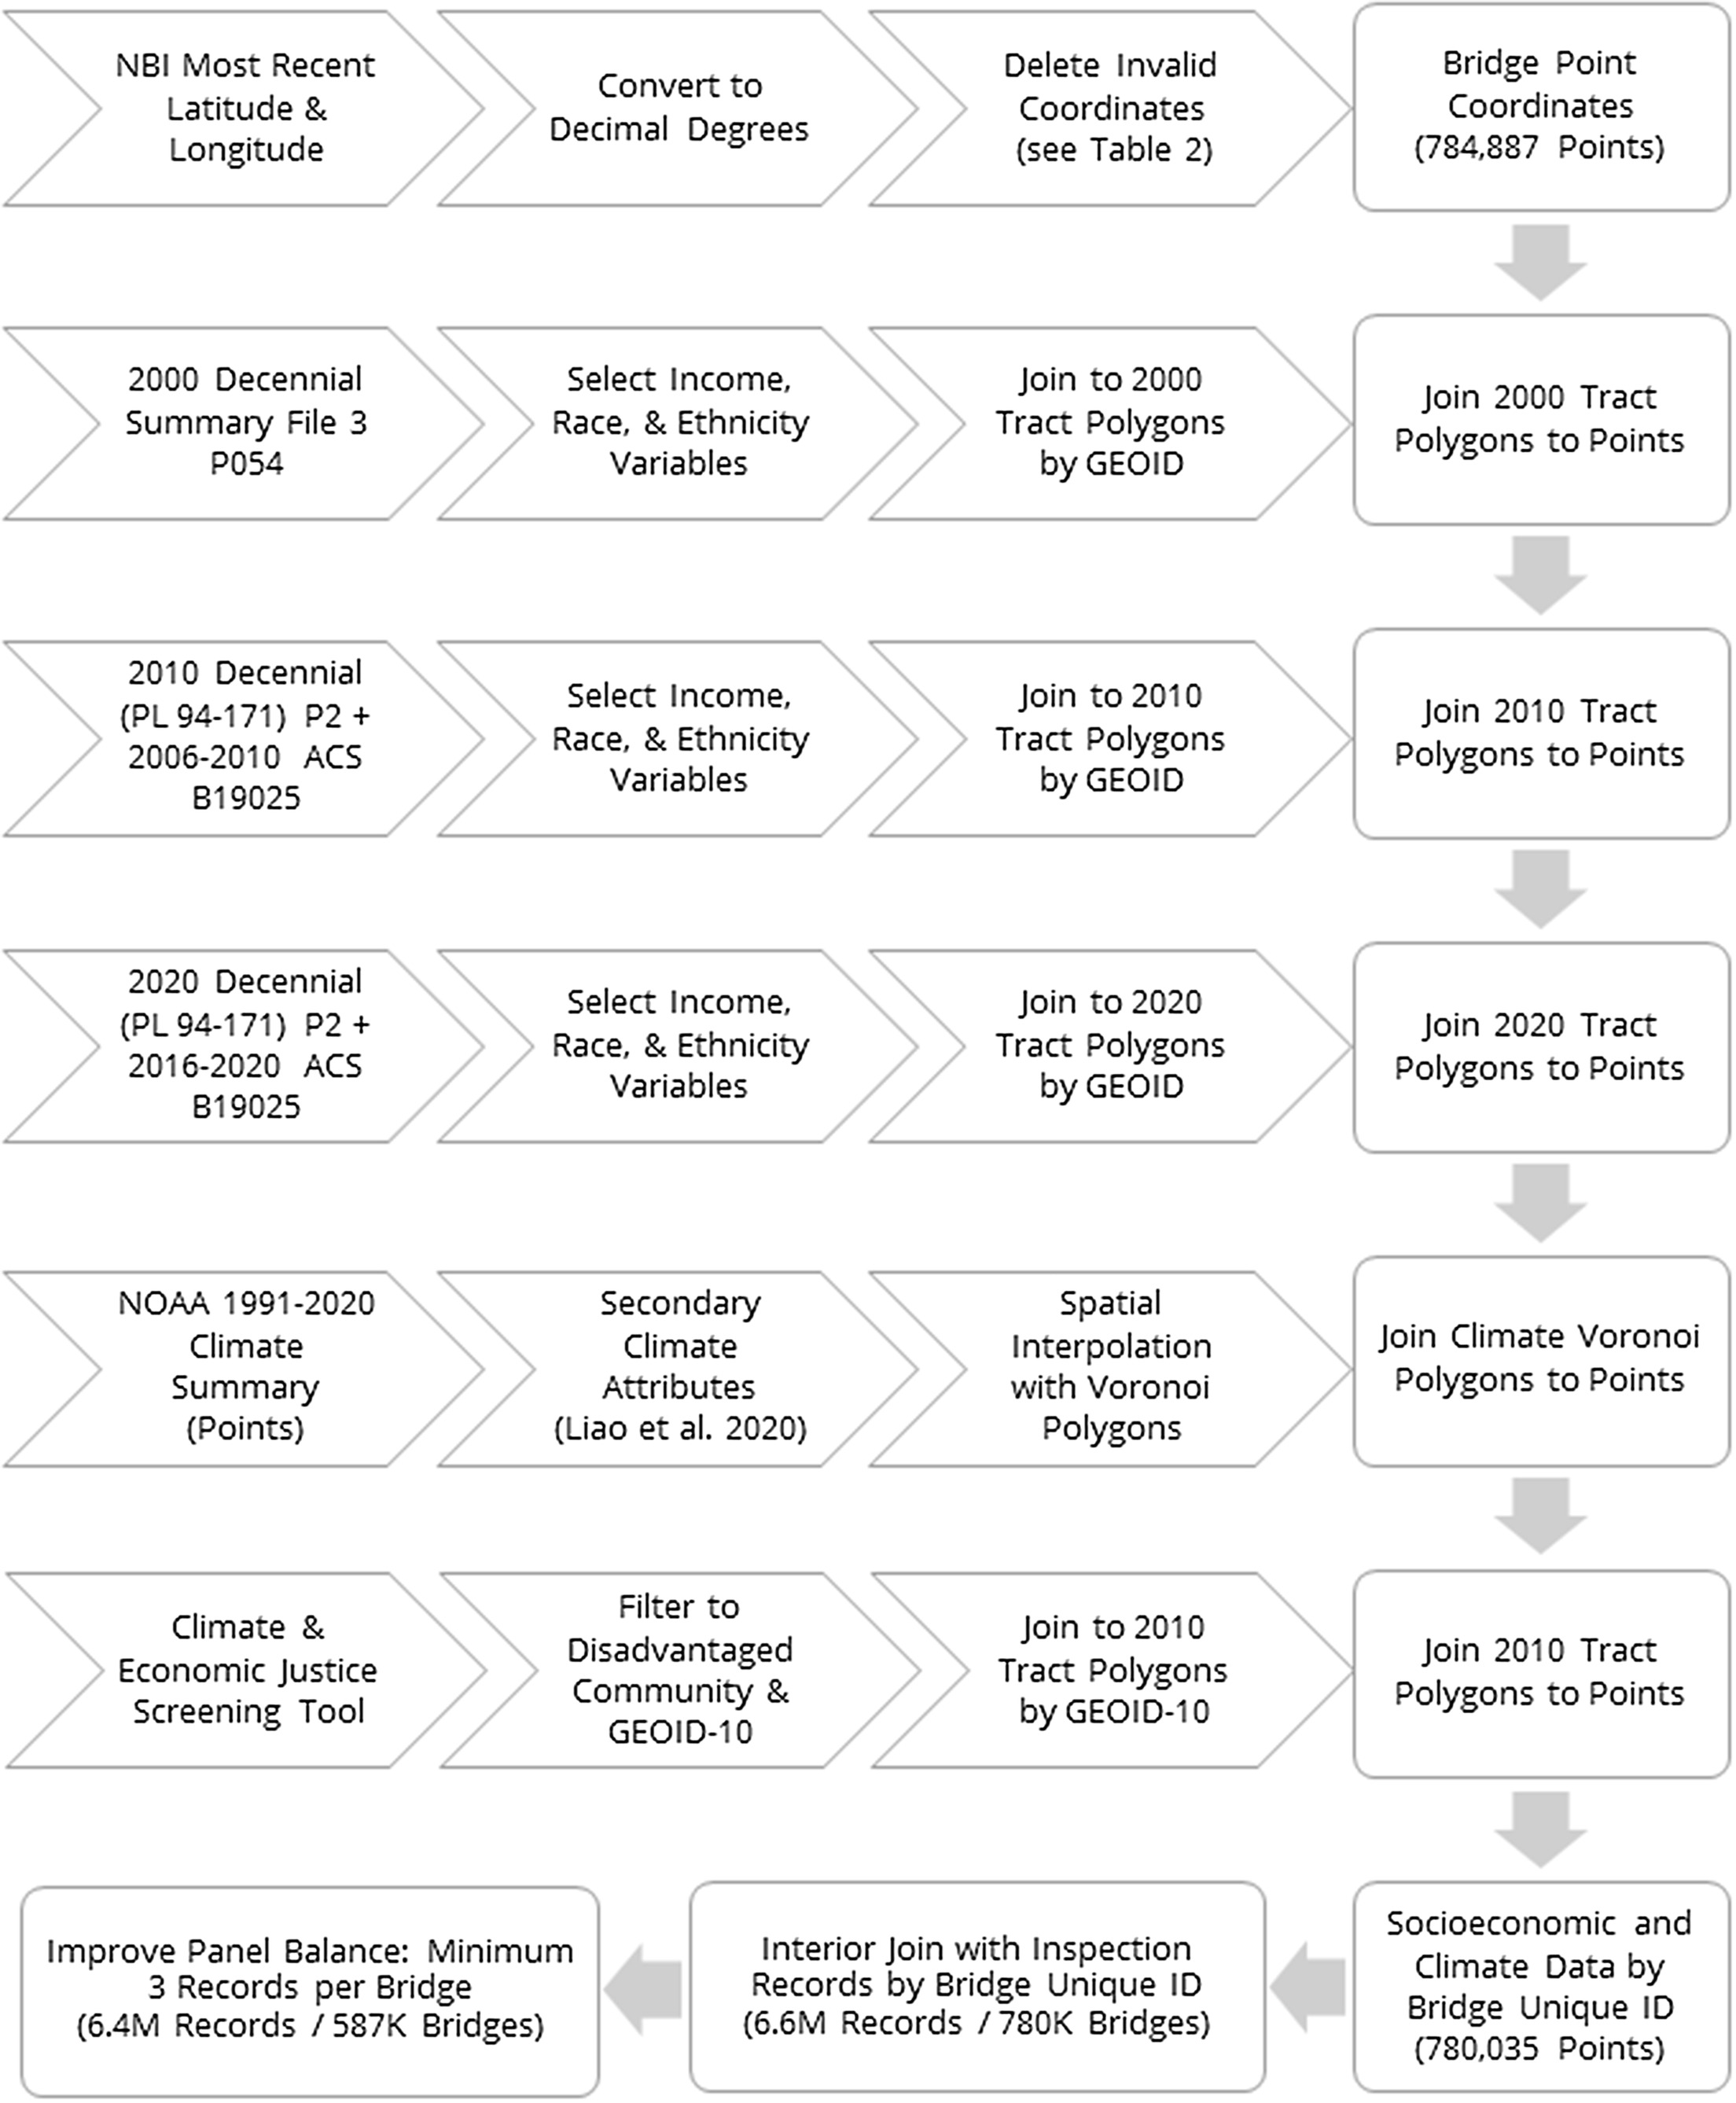
Fig. 1 presents a flow diagram that summarizes how we integrated and merged the bridge, census tract, and climate station data. We constructed a time-series panel of bridge inspections using the NBI delimited ASCII files published from 1992 through 2020 containing inspection data collected from 1990 through 2020 (Federal Highway Administration 2021). Table 2 lists each step in the data censoring process from the original 20 million records from over 1.3 million unique structures (including culverts, on-ramps, and bridge sections) to the final 6.4 million records and how many records were lost at each step. The final panel had 15%–57% of the original records from each of the fifty states and the District of Columbia. When comparing the mean of the variables from the initial panel to the records retained, we found that the differences were not structurally meaningful and statistically significant differences were largely due to the size of the data (Gandy et al. 2023).
| Reason | Records | Bridges |
|---|---|---|
| Initial | 20,032,098 | 1,309,311 |
| Remove records without a construction date | 19,994,053 | 1,297,502 |
| Remove records for bridges over 100 years old | 19,864,094 | 1,292,383 |
| Remove records without condition data | 13,495,005 | 866,509 |
| Remove records without service-related data | 13,422,601 | 860,885 |
| Remove records without coordinates | 11,867,071 | 806,220 |
| Retain one record per inspection | 6,801,487 | 806,220 |
| Remove coordinates in the wrong state | 6,759,872 | 801,394 |
| Remove coordinates in the wrong county | 6,663,944 | 784,887 |
| Coordinates not within a populated tract | 6,621,581 | 780,035 |
| All records joined to climate data | 6,621,581 | 780,035 |
| Minimum three records per bridge | 6,396,168 | 587,700 |
Socioeconomic and Demographic Data
Tract income, race, and ethnicity data were downloaded from the US Census Bureau Application Programming Interface (API) using the tidycensus package in R and then joined to the previously downloaded tract boundaries by GEOID (Walker et al. 2022). Census data for 2000, 2010, and 2020 was matched with each bridge based on the coincident tract GEOID for each of those years. That is, the 2000 tract boundary spatial join was used to join the 2000 census data to the entire panel, the 2010 tract boundaries were used to join the 2010 census data, and the 2020 tract boundaries were used to join the 2020 census data. The CEJST “disadvantaged community” indicators were based on 2010 tract boundaries, so 2010 GEOID values were used to join them with bridges (Council on Environmental Quality 2020). Fig. 1 provides further details on the datasets used in this process.
Climate Data
We included climate data summarized for transportation infrastructure management from the National Oceanic and Atmospheric Administration (NOAA) 1991–2020 climate normals (Liao et al. 2020). Following the methodology of Liao et al. (2020), the summary data from each climate station point coordinate was interpolated using Voronoi polygons, which were then spatially joined to the bridge point coordinates in the panel using sp and deldir packages for R (Liao et al. 2020; Pebesma et al. 2021; Turner 2021; Farmer 2009). As shown in Table 2, all bridge point coordinates intersected with an interpolated Voronoi polygon and its associated climate data.
Variables
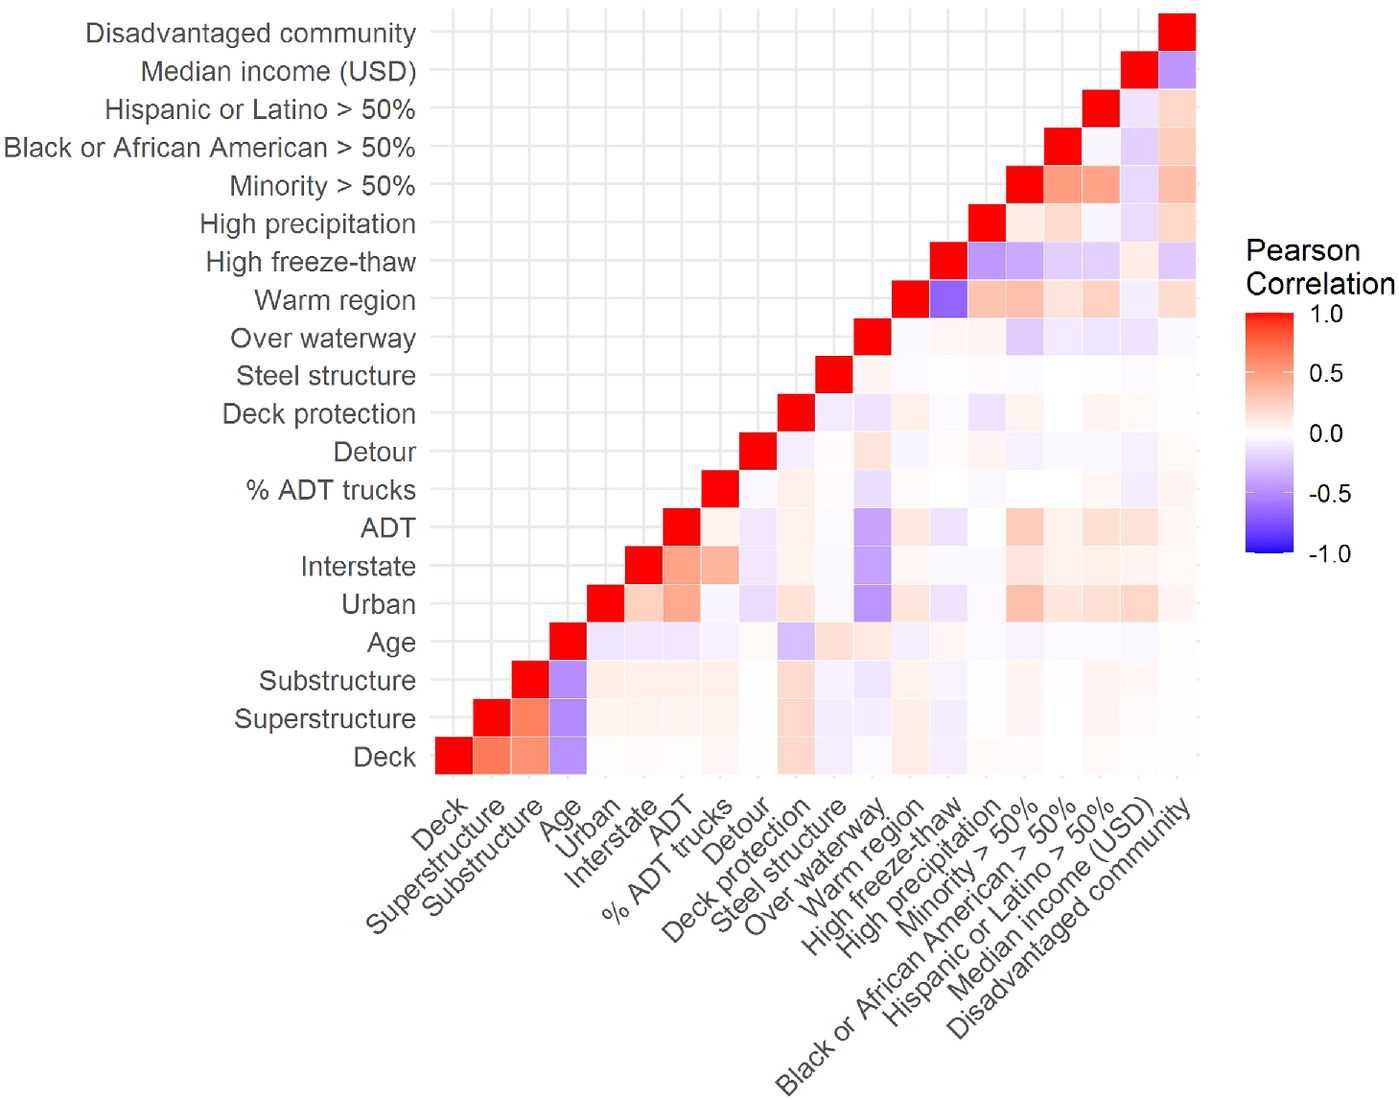
In an effort to compare our results to the ordered probit regression with random effects conducted by Saeed et al. (2017), we conducted the same transformation of the outcome variables from the ten NBI condition ratings to their four condition states. State one, the poorest condition state, encompasses condition ratings from failed to fair (0–5). State two represents a condition rating of satisfactory (6) and state three encompasses condition ratings of good (7) and very good (8). The best state, state four, represents excellent or “like new” condition ratings (9). In addition to allowing us to compare our regression estimates to previously published work (Saeed et al. 2017), reducing the number of ordered categories is an oft-used way to ensure model evaluation is less computationally intensive (Washington et al. 2011). Fig. 2 summarizes the correlation between our dependent variables (deck, superstructure, and substructure component condition states) and our main analysis variables.
To determine the extent to which bridge improvements are equitably distributed, we must control for variables that would drive investment decisions irrespective of equity, such as bridge characteristics and life-cycle management factors. Our selection of bridge-specific (age, urban area, interstate route, traffic, truck traffic, presence of deck protection, and structure material) and environmental-specific variables (waterway bridge, temperature, freeze-thaw cycles, and precipitation) were informed by a recent literature review of factors that significantly influence bridge condition in various deterioration models (Kale et al. 2021). We selected the warm region threshold temperature of 18°C (64° F) and the precipitation threshold of 127 cm (50 in.) based on the national analysis performed by Liao et al. (2020) and Köppen–Geiger Climate Subdivisions (National Weather Service 2006). The threshold value of 60 freeze-thaw cycles is identical to previous work by Saeed et al. (2017). We also include a variable for detour length in the event the bridge was closed to traffic as a measure of the relative importance of the bridge in the highway system.
The race or ethnicity variables used in the main analysis were tract population over 50% racial or ethnic minorities (non-White and/or Hispanic or Latino), over 50% Black or African American, and over 50% Hispanic or Latino from the 2020 Decennial Census. In some of the models (Tables 3 and 4) the economic variable is the logarithm of median household income from the 2016–2020 American Community Survey (ACS). Median household income was selected as a parsimonious measure of socioeconomic differences. As an alternate model specification (Table 5), we used the disadvantaged community indicator from the CEJST (Council on Environmental Quality 2020) as this metric is currently being used by Justice40 initiative programs. In fact, this is so timely policy-wise that the DOT wants to know the applications and limitations of this particular metric to inform the implementation of their upcoming Equitable Transportation Community Explorer (US DOT 2023). Given tract median household income is an input into the CEJST metric, including both of them in the same model is inappropriate as they can potentially add multicollinearity that would lead to misleading and biased results. Therefore, these indicators were modeled separately.
| Estimated parameters | Deck | Superstructure | Substructure |
|---|---|---|---|
| Variables | |||
| Intercept | 1.398 (0.046)*** | 1.287 (0.044)*** | 0.879 (0.053)*** |
| Age, years | ()*** | ()*** | ()*** |
| Urban indicator | (0.003)*** | (0.003)*** | 0.008 (0.004) |
| Interstate indicator | (0.005)*** | (0.005)*** | (0.007)*** |
| Average daily traffic (ADT) | () | ()*** | ()*** |
| % ADT trucks | 0.015 ()*** | 0.026 ()*** | 0.021 ()*** |
| Detour length, kilometers | ()*** | ()*** | 0.001 ()*** |
| Deck protection indicator | 0.210 (0.003)*** | — | — |
| Steel structure indicator | — | 0.018 (0.005)*** | 0.102 (0.005)*** |
| Bridge over waterway indicator | — | (0.004)*** | (0.005)*** |
| Average temperature > 18°C | 0.147 (0.004)*** | 0.114 (0.004)*** | 0.064 (0.005)*** |
| Annual freeze-thaw cycles > 60 | (0.004)*** | (0.004)*** | (0.005)*** |
| Annual precipitation > 127 cm | (0.003) | (0.003)*** | (0.004)*** |
| Logarithm of median income | 0.075 (0.004)*** | 0.120 (0.004)*** | 0.126 (0.005)*** |
| Minority > 50% | (0.004)*** | 0.042 (0.004)*** | 0.035 (0.005)*** |
| Thresholds | |||
| 0.837 (0.001)*** | 0.801 (0.001)*** | 0.793 (0.001)*** | |
| 3.209 (0.001)*** | 3.199 (0.001)*** | 3.110 (0.001)*** | |
| 1.276 (0.001)*** | 1.311 (0.001)*** | 1.350 (0.001)*** | |
| Summary statistics | |||
| Log likelihood | |||
| AIC | 10,097,176 | 9,562,943 | 9,799,471 |
Note: ***; **; and * (two-tailed tests).
| Estimated parameters | Deck | Superstructure | Substructure |
|---|---|---|---|
| Variables | |||
| Intercept | 1.336 (0.043)*** | 1.330 (0.043)*** | 0.966 (0.046)*** |
| Age, years | ()*** | ()*** | ()*** |
| Urban indicator | (0.003)*** | (0.003)*** | 0.015 (0.003)*** |
| Interstate indicator | (0.005)*** | (0.005)*** | (0.005)*** |
| Average daily traffic (ADT) | ()*** | ()*** | ()*** |
| % ADT trucks | ()*** | ()*** | ()*** |
| Detour length, kilometers | ()*** | ()*** | ()*** |
| Deck protection indicator | 0.215 (0.002)*** | — | — |
| Steel structure indicator | — | 0.018 (0.004)*** | 0.101 (0.004)*** |
| Bridge over waterway indicator | — | (0.004)*** | (0.004)*** |
| Average temperature > 18°C | 0.137 (0.004)*** | 0.102 (0.004)*** | 0.049 (0.004)*** |
| Annual freeze-thaw cycles > 60 | (0.004)*** | (0.004)*** | (0.004)*** |
| Annual precipitation > 127 cm | 0.006 (0.003) | (0.003)*** | (0.003)*** |
| Logarithm of median income | 0.130 (0.004)*** | 0.160 (0.004)*** | 0.175 (0.004)*** |
| Black or African American > 50% | (0.007)*** | (0.006)*** | (0.007)*** |
| Hispanic or Latino > 50% | 0.076 (0.007)*** | 0.171 (0.007)*** | 0.197 (0.008)*** |
| Thresholds | |||
| 0.897 (0.001)*** | 0.863 (0.001)*** | 0.921 (0.001)*** | |
| 3.297 (0.001)*** | 3.305 (0.001)*** | 3.303 (0.001)*** | |
| 1.256 (0.001)*** | 1.293 (0.001)*** | 1.309 (0.001)*** | |
| Summary statistics | |||
| Log likelihood | |||
| AIC | 9,987,868 | 9,420,193 | 9,512,948 |
Note: ***; **; and * (two-tailed tests).
| Estimated parameters | Deck | Superstructure | Substructure |
|---|---|---|---|
| Variables | |||
| Intercept | 1.994 (0.004)*** | 2.241 (0.005)*** | 2.061 (0.005)*** |
| Age, years | ()*** | ()*** | ()*** |
| Urban indicator | (0.003)*** | (0.003)*** | 0.020 (0.003)*** |
| Interstate indicator | (0.004)*** | (0.005)*** | (0.004)*** |
| Average daily traffic (ADT) | ()*** | ()*** | () |
| % ADT trucks | 0.013 ()*** | ()*** | ()*** |
| Detour length, kilometers | 0.001 ()*** | ()*** | 0.001 ()*** |
| Deck protection indicator | 0.180 (0.002)*** | — | — |
| Steel structure indicator | — | 0.018 (0.004)*** | 0.102 (0.004)*** |
| Bridge over waterway indicator | — | (0.003)*** | (0.003)*** |
| Average temperature > 18°C | 0.127 (0.003)*** | 0.098 (0.004)*** | 0.046 (0.004)*** |
| Annual freeze-thaw cycles > 60 | (0.003)*** | (0.003)*** | (0.003)*** |
| Annual precipitation > 127 cm | 0.004 (0.003) | (0.003)*** | (0.003)*** |
| Disadvantaged community | (0.002)*** | (0.002)*** | (0.002)*** |
| Black or African American > 50% | (0.005)*** | (0.005)*** | (0.005)*** |
| Hispanic or Latino > 50% | 0.083 (0.005)*** | 0.175 (0.006)*** | 0.193 (0.005)*** |
| Thresholds | |||
| 1.075 (0.001)*** | 0.843 (0.001)*** | 0.817 (0.001)*** | |
| 3.547 (0.002)*** | 3.265 (0.001)*** | 3.142 (0.001)*** | |
| 1.176 (0.001)*** | 1.297 (0.001)*** | 1.343 (0.001)*** | |
| Summary statistics | |||
| Log likelihood | |||
| AIC | 9,754,318 | 9,754,284 | 9,753,855 |
Note: ***; **; and * (two-tailed tests).
Statistical Methods and Models
Our methodology is based on the bridge deterioration modeling literature and common practice. AASHTOWare BMS, the bridge management system most commonly deployed across North America and considered to be the state-of-the-art in bridge management, employs a semi-Markov process that incorporates Weibull survival functions to estimate the true duration in each condition state based on discrete observation intervals (Santamaria et al. 2019). Instead of introducing time dependence into a Markov process with a survival function or by segmenting the panel data by bridge age, we pursued a generalized linear model that does not assume time independence. Expanding upon prior studies (Saeed et al. 2017), we assessed the NBI across all states and the District of Columbia with an ordered probit model with random effects. An ordered model is appropriate because of the discrete, ordinal nature of bridge component condition ratings. The random effects specification is necessary for assessing bridge conditions across inspection years while controlling for time-invariant bridge attributes (Washington et al. 2011). We implemented this method using the pglm package for R (Croissant 2021). Regression tables (Tables 3–5) were prepared using the texreg package for R (Leifeld 2013) and summary graphics (Figs. 2 and 3) were prepared using the ggplot2 package for R (Wickham 2016)
The dependent variable of the ordered probit regression is the probability of being in one of four condition states (Saeed et al. 2017). Similar to a binomial model, the probability that the latent variable (the linear combination of the variables and random effects) is associated with state two, versus state one, is based on a threshold value of zero (Croissant and Millo 2018). The model estimates the threshold for state three () and the threshold for state four () jointly with the regression coefficients () using maximum likelihood estimation (Washington et al. 2011). Thus, the interpretation of the ordered probit model is that positive coefficient estimates indicate that the variable increases the likelihood that the bridge component is in excellent condition (state four), and negative coefficient estimates indicate that the variable increases the likelihood that the bridge component condition is in poor condition (state one). The direction of the estimates between interior categories is not directly observed because the interior thresholds ( and ) are parameters used to improve the maximum log-likelihood of the model (Washington et al. 2011). Given our inquiry into the equity of bridge management, we are interested in the likelihood of there being appreciable performance differences for the bridge users and neighboring communities. Therefore, estimating the probability of being in the worst or best condition states provides greater clarity as to whether coefficient values have equity implications.
Results
Prior to conducting our main analysis, we reviewed summary statistics for the main analysis variables and replicated the ordered probit regressions conducted by Saeed et al. (2017). The final panel had an average condition of “satisfactory” (6–7) for the deck, superstructure, and substructure components, and the component condition ratings were highly correlated as shown in previous literature (Lavrenz et al. 2020). Consistent with our expectation, component condition is negatively correlated with age, and ADT is positively correlated with urban and interstate indicators (see Fig. 2). We began by replicating the most similar study to our approach, which analyzed bridges in Indiana (Saeed et al. 2017). When we limited our data and variables to a similar subset, we found that most of the estimated coefficients for our controls were of similar magnitude and direction to that study, with the exception of the urban indicator and the (excluded) high freeze-thaw cycle indicator (Gandy et al. 2023). This gave us confidence that our study’s subsequent extension to the rest of the country was properly grounded in the prior approaches undertaken.
The estimated coefficients for 2020 Decennial Census minority tracts, tracts with less than or equal to 50% of White (not Hispanic or Latino) individuals of one race, were negative in models for deck condition state and positive in models for superstructure and substructure condition state (see Table 3). This could be because maintenance strategies likely vary in scope and scale for different bridge components. Theorizing these differences in bridge component condition ratings from an equity perspective requires a dedicated effort that is beyond the scope of this work yet a fruitful avenue for future work. The estimated coefficients for tracts with over 50% Black or African American individuals in 2020 were negative, of a consistent magnitude, and significant at the 99.9% level across all component models (see Table 4). Counter to our hypotheses, the estimated coefficient for tracts with over 50% Hispanic or Latino individuals in 2020 was positive and significant at the 99.9% level across all component models. We also note the relatively large magnitude of the coefficients for Hispanic or Latino majority community indicators compared to the other binary variables for the superstructure and substructure models (see Fig. 3).
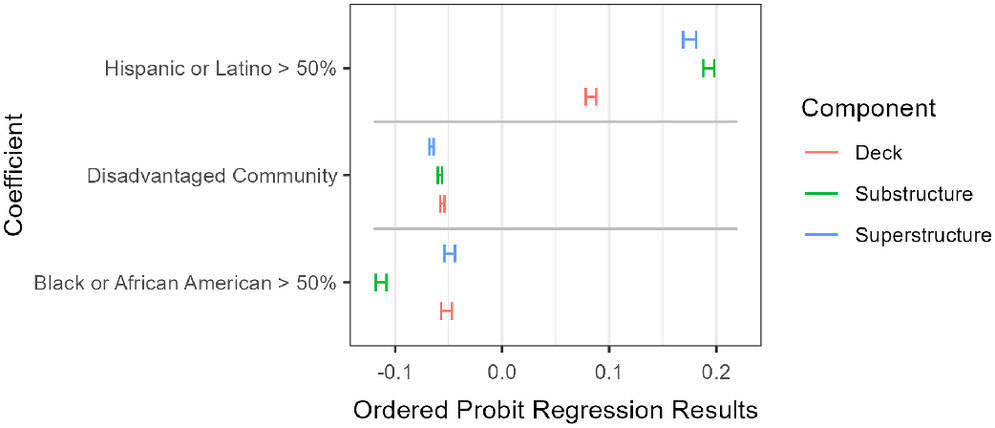
For the logarithm of the 2016–2020 ACS median household income data, bridges in higher income tracts were more likely associated with a bridge in the best condition state across all models (Tables 3 and 4). Disadvantaged tracts were more likely associated with bridges in the worst condition state and the estimated coefficients were of a similar magnitude across all components (Table 5). Further, when we used tracts designated as disadvantaged communities as the economic indicator instead of the logarithm of median household income, we achieved consistent, in magnitude and direction, and statistically significant coefficient estimates for all race and ethnicity variables (Table 5 and Fig. 3).
Given the diversity of demography, climate, engineering, and construction practices across the United States, we segmented the panel and repeated our analysis for each of the four census regions as defined by the US Census (US Census Bureau 2010). The results are summarized for the demographic variables in Table 6. The Northeast, South, and Midwest regions’ bridges were modeled with the same variables as the national model shown in Table 4. The only exception is that the warm region indicator was excluded from the Northeast and Midwest models because no bridge coordinates had an average temperature greater than 18°C (64° F) in those regions (Liao et al. 2020). Consistent with the results for the national panel, the coefficients for the logarithm of median income were positive and Black or African American majority tracts were negative across all component models for the Northeast, South, and Midwest regions. The coefficients for Hispanic or Latino majority communities were negative across all component models in the Northeast and Midwest, counter to national trends. The logarithm of median household income and Black or African American majority tracts could not be included in the Western region models because there was not sufficient variability in those variables for convergence to be achieved when they were included. The resulting coefficients for Hispanic or Latino majority tracts were positive for the deck model and negative for the superstructure and substructure models.
| Variables | Northeast | South | Midwest | West |
|---|---|---|---|---|
| Logarithm of median household income | All positive | All positive | All positive | N/A |
| Black or African American > 50% | All negative | All negative | All negative | N/A |
| Hispanic or Latino > 50% | All negative | All positive | All negative | Mixed |
Source: Data from US Census Bureau (2010).
Robustness Checks
For transparency, our Supplemental Materials contain robustness checks of the ordered probit with random effects model for alternate decennial census years, alternate thresholds for determining tract majority characteristics, replacement of the disadvantaged community indicator (Council on Environmental Quality 2020) with the social vulnerability index (Centers for Disease Control 2020), and a replication of a previous study of Indiana bridges (Saeed et al. 2017) that is tailored to our data availability. Analyses that used alternate census years (2000 or 2010) or alternate threshold values (national average or 60%) yielded coefficient estimates with the same direction (positive or negative), a similar magnitude, and the same significance levels of the main analysis presented in Table 4. We found that replacing the CEJST’s disadvantaged community indicator with the Centers for Disease Control’s socioeconomic vulnerability “flag” yielded coefficients of the same sign and a similar magnitude to the results in Table 5. Further, we evaluated our modeling assumptions by conducting the same analysis with ordinary least squares with random effects, binomial probit with random effects, ordered probit with two-way random effects, and ordered probit without random effects. Each of the alternate models produced statistically significant estimates consistent in direction and order of magnitude with the findings presented herein (Gandy et al. 2023).
Discussion and Conclusion
Our study evaluates whether the outcomes of nationwide bridge management programs are equitable. This expands upon literature at the intersection of engineering management and social impact that has thus far included equity assessments of human resource management (Jafari et al. 2020; Karakhan et al. 2021), construction project management (Ahmed and Garvin 2022; Wu et al. 2021), and risk management (Palagi and Javernick-Will 2020; Yang and Frangopol 2020). In short, we develop and analyze a nationwide, programmatic, and community-based approach to infrastructure condition monitoring that has not yet been adequately conducted in prior studies. Beyond contributing a novel methodology to this body of knowledge, our findings contextualize recent policy trends (Young et al. 2021; US DOT 2022b; US DOE 2021) and support the implementation of social equity metrics in bridge management in alignment with these policy aims. While effective life-cycle management has the potential to reduce bias in future infrastructure investment decisions (Feunekes et al. 2011), it may fail to address historical artifacts that have resulted in the inequitable performance of existing infrastructure systems (Winner 1980; France-Mensah et al. 2019). This study implements novel techniques that advance and integrate bridge condition degradation modeling (Saeed et al. 2017) with social equity assessments (Jones and Armanios 2020) to identify associative trends between community demography and bridge condition (Federal Highway Administration 2017). We expanded the implementation of both methodologies (Saeed et al. 2017; Jones and Armanios 2020), which were originally conducted for single states, to the entire United States. Moreover, we employ a longer time series of inspection years (1990–2020). Overall, our study goes beyond the prior work to explore the equity implications of bridge infrastructure asset management across the entire country (rather than one state) and of bridge maintenance over time (rather than just on the initial bridge siting and design choices).
When we compared the distribution of bridge component conditions across the United States, controlling for factors based solely on physical and environmental conditions, we find consistent and significant correlation with tract median household income (positive), tracts with a majority of Black or African American individuals (negative), and tracts identified as disadvantaged communities in the CEJST (negative) (Council on Environmental Quality 2020). Counter to our expectations, tracts with a majority of Hispanic or Latino individuals were positively associated with bridge component condition ratings at the national level. However, at the regional level, the coefficient estimates for these tracts were negative when the model was run for only bridges in the Northeast or Midwest of the United States (Table 6). Further, the sign of the coefficient estimates for tracts with over 50% racial or ethnic minorities (non-White and/or Hispanic or Latino) was not consistent across components (see Table 3). While we leave causal inference to future work, inconsistent results for these very broad racial and ethnic indicators suggest that demographic variable selection should be more specific and nuanced based on the history of development, demography, and community relations in a given area.
Further, we find the CEJST disadvantaged community indicator is a useful indicator, but largely accounts for inequity due to economic disadvantage. The estimated coefficients for the Black or African American majority census tract indicator are associated with greater probabilities that a bridge component is in poor condition, and these results are significant even when including the CEJST disadvantaged community indicator in the model. Thus, in the case of bridge condition, neither correlation with median household income nor the CEJST disadvantaged community indicator completely captures the disadvantages associated with being in a majority Black or African American population tract (Council on Environmental Quality 2020). In terms of broader transportation infrastructure policy and equity action planning, we note that previous work also finds that communities of color have poorer highway infrastructure and that highway and public transportation funding has been systematically siphoned away from communities of color, even after these communities were displaced to build the highway system (Archer 2021). While income and demographics are somewhat correlated and operate along a similar direction, our results suggest that neither is a perfect substitute for the other. Both are needed for a holistic picture of the equity implications of bridge management programs (Litman 2021; Qian and Jaller 2020).
Given that our indicators of economic disadvantage are consistently correlated with bridge components that are likely in poor condition, future work should consider ways in which resources for bridge maintenance, repair, and rehabilitation could be more equitably allocated across the United States, in line with Executive Orders (The White House 2023) and recent policy trends (Young et al. 2021; US DOE 2021). Future work can also assess if for Federal Highway Administration bridges, equitable performance in bridge maintenance by state and local stakeholders could be considered as an evaluation factor for future federal infrastructure capital investments. In addition to federal funding for major projects in socioeconomically disadvantaged communities, this study suggests that racial equity should be an added component (beyond income) that informs maintenance strategies and bridge project prioritization of local transportation authorities to ensure greater equity in our bridge system. In short, this study provides a framework that helps better center equity considerations across a bridge’s life cycle that we feel could be generalized to other infrastructure such as dams, utility systems, and public facilities.
Notation
The following symbols are used in this paper:
- regression coefficients;
- bridge-specific random effects;
- interior threshold parameters which are estimated for the overall model; and
- standard deviation of normally distributed bridge-specific random effects .
Supplemental Materials
File (supplemental materials_jmenea.meeng-5265_gandy.pdf)
- Download
- 329.49 KB
Data Availability Statement
Some or all data, models, or code generated or used during the study are available in a repository online (https://doi.org/10.1184/R1/20643327) in accordance with funder data retention policies. Some or all data, models, or code used during the study were provided by a third party. Direct requests for these materials may be made to the provider as indicated in the Acknowledgments.
Acknowledgments
The authors acknowledge methodological guidance and support from Alex Davis, Edson Severnini, Nicholas Muller, and Destenie Nock. Additionally, the authors express gratitude to Tao Liao, Indraneel Kumar, and Dr. Samuel Labi for providing their climate data for transportation infrastructure management and advising us on their geospatial interpolation methodology. We express gratitude to our colleagues Xu Kang and Nicola Ritsch for their contributions to improving the data quality and geospatial accuracy of the National Bridge Inventory data. This project was funded in part by the Chief of Staff of the Air Force Captains’ Prestigious Ph.D. Program.
Disclaimer
This research was initiated while C.S. was affiliated with Carnegie Mellon University. The views expressed in this paper are those of the authors and do not reflect the official policy or position of the US Government or any other organization.
References
Ahmed, M., and M. Garvin. 2022. “Review of critical success factors and key performance indicators in performance assessment of P3 transportation projects.” J. Manage. Eng. 38 (5): 04022045. https://doi.org/10.1061/(ASCE)ME.1943-5479.0001070.
Archer, D. N. 2021. “Transportation policy and the underdevelopment of black communities.” Iowa Law Rev. 106 (5): 2125–2151.
Armanios, D. E., J. D. Desai, S. Jones, N. Ritsch, and S. Dutta. 2021. “Comment on DOT’s request for information on transportation equity.” Accessed May 7, 2023. https://www.regulations.gov/comment/DOT-OST-2021-0056-0091.
Barajas, J. M. 2021. “The roots of racialized travel behavior.” In Vol. 8 of Social issues in transportation (advances in transport planning and policy), edited by R. H. M. Pereira and G. Boisjoly. Cambridge, MA: Academic Press.
Blazina, E. D. 2022. U.S. Department of Transportation commits $25.3 million to replace Fern Hollow Bridge (2). Pittsburgh: Pittsburgh Post-Gazette.
Brinkman, J., and J. Lin. 2022. “Freeway revolts! The quality of life effects of highways.” In Review of Economics and Statistics, 1–45. Cambridge, MA: Massachusetts Institute of Technology. https://doi.org/10.1162/rest_a_01244.
Centers for Disease Control. 2020. “CDC/ATSDR Social Vulnerability Index (SVI).” Accessed May 7, 2023. https://www.atsdr.cdc.gov/placeandhealth/svi/.
Chen, N., and C.-H. Wang. 2020. “Does green transportation promote accessibility for equity in medium-size US cities?” Transp. Res. Part D Transp. Environ. 84 (7): 102365. https://doi.org/10.1016/j.trd.2020.102365.
Coleman, N., A. Esmalian, and A. Mostafavi. 2020. “Equitable resilience in infrastructure systems: Empirical assessment of disparities in hardship experiences of vulnerable populations during service disruptions.” Nat. Hazard. Rev. 21 (4): 04020034. https://doi.org/10.1061/(ASCE)NH.1527-6996.0000401.
Council on Environmental Quality. 2020. “Climate & economic justice screening tool.” Accessed May 7, 2023. https://screeningtool.geoplatform.gov/en/.
Croissant, Y. 2021. “Package ‘pglm’.” Accessed May 7, 2023. https://cran.r-project.org/package=pglm.
Croissant, Y., and G. Millo. 2018. Panel data econometrics with R. Hoboken, NJ: Wiley.
Desai, J. D., and D. E. Armanios. 2018. “What cannot be cured must be endured: Understanding bridge systems as institutional relics.” J. Infrastruct. Syst. 24 (4): 04018032. https://doi.org/10.1061/(ASCE)IS.1943-555X.0000451.
Dutta, S., D. E. Armanios, and J. D. Desai. 2021. “Beyond spatial proximity: The impact of enhanced spatial connectedness from new bridges on entrepreneurship.” Organ. Sci. 33 (4): 1620–1644. https://doi.org/10.1287/orsc.2021.1504.
El-Geneidy, A., R. Buliung, E. Diab, D. van Lierop, M. Langlois, and A. Legrain. 2016. “Non-stop equity: Assessing daily intersections between transit accessibility and social disparity across the Greater Toronto and Hamilton Area (GTHA).” Environ. Plann. B: Urban Anal. City Sci. 43 (3): 540–560. https://doi.org/10.1177/0265813515617659.
Farmer, C. 2009. “Voronoi polygons with R.” Accessed May 7, 2023. https://carsonfarmer.com/2009/09/voronoipolygons-with-r/.
Federal Highway Administration. 2017. “National performance management measures; assessing pavement condition for the national highway performance program and bridge condition for the national highway performance program.” Accessed May 7, 2023. https://www.govinfo.gov/content/pkg/FR-2017-01-18/pdf/2017-00550.pdf.
Federal Highway Administration. 2021. “National bridge inventory ASCII files.” Accessed May 7, 2023. https://www.fhwa.dot.gov/bridge/nbi/ascii.cfm.
Federal Highway Administration. 2022. “Apportionment of fiscal year (FY) 2022 highway infrastructure program funds for the bridge formula program pursuant to the infrastructure investment and jobs act.” Accessed May 7, 2023. https://www.fhwa.dot.gov/legsregs/directives/notices/n4510861.pdf.
Feunekes, U., S. Palmer, A. Feunekes, J. Macnaughton, J. Cunningham, and K. Mathisen. 2011. “Taking the politics out of paving: Achieving transportation asset management excellence through OR.” Interfaces 41 (1): 51–65. https://doi.org/10.1287/inte.1100.0520.
France-Mensah, J., C. Kothari, W. J. O’Brien, and J. Jiao. 2019. “Integrating social equity in highway maintenance and rehabilitation programming: A quantitative approach.” Sustainable Cities Soc. 48 (Jul): 101526. https://doi.org/10.1016/j.scs.2019.101526.
Gandy, C., D. Armanios, and C. Samaras. 2023. Panel data preparation and models for social equity of bridge management. Pittsburgh: Carnegie Mellon Univ. KiltHub. https://doi.org/10.1184/R1/20643327.
Howe, C., et al. 2016. “Paradoxical infrastructures: Ruins, retrofit, and risk.” Sci. Technol. Hum. Values 41 (3): 547–565. https://doi.org/10.1177/0162243915620017.
Jafari, A., B. Rouhanizadeh, S. Kermanshachi, and M. Murrieum. 2020. “Predictive analytics approach to evaluate wage inequality in engineering organizations.” J. Manage. Eng. 36 (6): 04020072. https://doi.org/10.1061/(ASCE)ME.1943-5479.0000841.
Jones, S. H., and D. E. Armanios. 2020. “Methodological framework and feasibility study to assess social equity impacts of the built environment.” J. Constr. Eng. Manage. 146 (11): 05020016. https://doi.org/10.1061/(ASCE)CO.1943-7862.0001914.
Kale, A., B. Ricks, and R. Gandhi. 2021. “New measure to understand and compare bridge conditions based on inspections time-series data.” J. Infrastruct. Syst. 27 (4): 04021037. https://doi.org/10.1061/(ASCE)IS.1943-555X.0000633.
Kalla, H. 2022. “Bridge formula program (BFP) implementation guidance.” Accessed May 7, 2023. https://www.fhwa.dot.gov/bridge/20220114.cfm.
Karakhan, A. A., J. A. Gambatese, D. R. Simmons, and A. J. Al-Bayati. 2021. “Identifying pertinent indicators for assessing and fostering diversity, equity, and inclusion of the construction workforce.” J. Manage. Eng. 37 (2): 04020114. https://doi.org/10.1061/(ASCE)ME.1943-5479.0000885.
Karner, A., J. London, D. Rowangould, and K. Manaugh. 2020. “From transportation equity to transportation justice: Within, through, and beyond the state.” J. Plann. Lit. 35 (4): 440–459. https://doi.org/10.1177/0885412220927691.
Khan, A., M. Waris, S. Panigrahi, M. R. Sajid, and F. Rana. 2021. “Improving the performance of public sector infrastructure projects: Role of project governance and stakeholder management.” J. Manage. Eng. 37 (2): 04020112. https://doi.org/10.1061/(ASCE)ME.1943-5479.0000886.
Lado, M. E. 2017. “Toward civil rights enforcement in the environmental justice context: Step one: Acknowledging the problem.” Fordham Environ. Law Rev. 29 (1): 1–49.
Lavrenz, S. M., T. U. Saeed, J. Murillo-Hoyos, M. Volovski, and S. Labi. 2020. “Can interdependency considerations enhance forecasts of bridge infrastructure condition? Evidence using a multivariate regression approach.” Struct. Infrastruct. Eng. 16 (8): 1177–1185. https://doi.org/10.1080/15732479.2019.1693606.
Leifeld, P. 2013. “Texreg: Conversion of statistical model output in R to LATEX and HTML tables.” J. Stat. Software 55 (8): 1–24. https://doi.org/10.18637/jss.v055.i08.
Levitt, R. E. 2007. “CEM research for the Next 50 years: Maximizing economic, environmental, and societal value of the built environment.” J. Constr. Eng. Manage. 133 (9): 619–628. https://doi.org/10.1061/(ASCE)0733-9364(2007)133:9(619).
Lewis, E. O. C., D. MacKenzie, and J. Kaminsky. 2021. “Exploring equity: How equity norms have been applied implicitly and explicitly in transportation research and practice.” Transp. Res. Interdiscip. Perspect. 9 (Mar): 100332. https://doi.org/10.1016/j.trip.2021.100332.
Liao, T., P. Kepley, I. Kumar, and S. Labi. 2020. “Revisiting the secondary climate attributes for transportation infrastructure management: A Redux and Update for 2020.” Preprint, submitted February 25, 2022. http://arxiv.org/abs/2202.12480.
Litman, T. 2021. Evaluating transportation equity: Guidance for incorporating distributional impacts in transportation planning. Victoria, BC: Victoria Transport Policy Institute.
Miller, M. C., and D. D. Gransberg. 2015. “Integrating social impact to bridge’s asset management plans.” Infrastruct. Asset Manage. 2 (1): 3–14. https://doi.org/10.1680/iasma.14.00033.
Mohl, R. A. 2008. “The Interstates and the Cities: The U.S. Department of Transportation and the Freeway Revolt, 1966–1973.” J. Policy History 20 (2): 193–226. https://doi.org/10.1353/jph.0.0014.
National Weather Service. 2006. “JetStream max: Addition Köppen-Geiger climate subdivisions.” Accessed May 7, 2023. https://www.weather.gov/jetstream/climate_max.
Palagi, S., and A. Javernick-Will. 2020. “Discrepancies between postdisaster relocation policy and implementation in the Philippines.” J. Manage. Eng. 36 (4): 04020040. https://doi.org/10.1061/(ASCE)ME.1943-5479.0000790.
Pebesma, E., R. Bivand, B. Rowlingson, V. Gomez-Rubio, R. Hijmans, M. Sumner, D. Macqueen, F. Lindgren, J. O’Brien, and J. O’Rourke. 2021. “Package ‘sp’: Classes and methods for spatial data.” Accessed May 7, 2023. https://github.com/edzer/sp/ https://edzer.github.io/sp/.
Qian, X., and M. Jaller. 2020. “Bikesharing, equity, and disadvantaged communities: A case study in Chicago.” Transp. Res. Part A Policy Pract. 140 (2020): 354–371. https://doi.org/10.1016/j.tra.2020.07.004.
Rawls, J. 1971. A theory of justice. London: Belknap Press.
Rico, I. 2017. “Letter of Finding: Title VI Complaint DOT #2015-0124.” Accessed May 7, 2023. https://www.fhwa.dot.gov/civilrights/programs/docs/title_vi_compl_dec/2015-0124.pdf.
Saeed, T. U., Y. Qiao, S. Chen, K. Gkritza, and S. Labi. 2017. “Methodology for probabilistic modeling of highway bridge infrastructure condition: Accounting for improvement effectiveness and incorporating random effects.” J. Infrastruct. Syst. 23 (4): 04017030. https://doi.org/10.1061/(ASCE)IS.1943-555X.0000389.
Santamaria, M., J. Fernandes, and J. C. Matos. 2019. “Overview on performance predictive models—Application to bridge management systems.” In Proc., IABSE Symp. Guimaraes 2019: Towards a Resilient Built Environment Risk and Asset Management—Report, 1222–1229. Zurich, Switzerland: International Association for Bridge and Structural Engineering. https://doi.org/10.2749/guimaraes.2019.1222.
Segarra, I., and S. J. Utley. 2021. “Complaint against the texas department of Transportation Pursuant to Title VI of the Civil Rights Act of 1964.” Accessed May 7, 2023. https://i-45coalition.org/documents.
Tao, W., P. Lin, and N. Wang. 2021. “Optimum life-cycle maintenance strategies of deteriorating highway bridges subject to seismic hazard by a hybrid Markov decision process model.” Struct. Saf. 89 (10): 102042. https://doi.org/10.1016/j.strusafe.2020.102042.
The White House. 2023. “Executive order on further advancing racial equity and support for underserved communities through the federal government.” Accessed May 7, 2023. https://www.whitehouse.gov/briefing-room/presidential-actions/2023/02/16/executive-order-on-further-advancing-racial-equity-and-support-for-underserved-communities-through-the-federal-government.
Turner, R. 2021. “Package ‘deldir’: Delaunay triangulation and Dirichlet (Voronoi) tessellation.” Accessed May 7, 2023. https://cran.r-project.org/package=deldir.
US Census Bureau. 2010. “Census regions and divisions of the United States.” Accessed May 7, 2023. https://www2.census.gov/geo/pdfs/maps-data/maps/reference/us_regdiv.pdf.
US Census Bureau. 2020. “American community survey 5-year data.” Accessed March 9, 2022. https://www.census.gov/data/developers/data-sets/acs-5year.html.
US Census Bureau. 2021a. “2000, 2010, and 2020 decennial census.” Accessed March 9, 2022. https://www.census.gov/data/developers/data-sets/decennial-census.2020.html.
US Census Bureau. 2021b. “TIGER/line shapefiles.” Accessed March 9, 2022. https://www.census.gov/geographies/mapping-files/time-series/geo/tiger-line-file.2020.html.
US DOE. 2021. “Equity in energy: An energy economy for everyone.” Accessed May 7, 2023. https://www.energy.gov/diversity/equity-energytm.
US DOT. 2021. “Summary of public comments received on the department of transportation’s request for information on transportation equity data.” Accessed May 7, 2023. https://www.transportation.gov/priorities/summary-public-comments-received-dots-request-information-transportation-equity-data.
US DOT. 2022a. “Advisory committee on transportation equity charter.” Accessed May 7, 2023. https://www.transportation.gov/civil-rights/acte.
US DOT. 2022b. “Equity action plan.” Accessed May 7, 2023. https://www.transportation.gov/priorities/equity/actionplan.
US DOT. 2023. “Request for information on US DOT equitable transportation community explorer (ETCE) tool and index methodology.” Accessed May 7, 2023. http://federalregister.gov/d/2023-03396.
Walker, K., M. Herman, and K. Eberwein. 2022. “Package ‘tidycensus’: Load US Census boundary and attribute data.” Accessed May 7, 2023. https://walker-data.com/tidycensus/.
Washington, S. P., M. G. Karlaftis, and F. L. Mannering. 2011. Statistical and econometric methods for transportation data analysis. 2nd ed. Boca Raton, FL: CRC Press.
Wickham, H. 2016. ggplot2: Elegant graphics for data analysis. New York: Springer.
Winner, L. 1980. “Do artifacts have politics?” Daedalus 109 (1): 121–136.
Wu, K., D. M. Frangopol, and W. Jin. 2021. “Multi-stakeholder framework for assessing the life-cycle social cost of construction projects.” Struct. Infrastruct. Eng. 18 (1): 129–144. https://doi.org/10.1080/15732479.2021.1924795.
Yang, D. Y., and D. M. Frangopol. 2020. “Risk-based vulnerability analysis of deteriorating coastal bridges under hurricanes considering deep uncertainty of climatic and socioeconomic changes.” ASCE-ASME J. Risk Uncertainty Eng. Syst. Part A: Civ. Eng. 6 (3): 04020032. https://doi.org/10.1061/AJRUA6.0001075.
Young, S. D., B. Mallory, and G. McCarthy. 2021. “Interim implementation guidance for the Justice40 initiative.” Accessed May 7, 2023. https://www.whitehouse.gov/wp-content/uploads/2021/07/M-21-28.pdf.
Information & Authors
Information
Published In

Journal of Management in Engineering
Volume 39 • Issue 5 • September 2023
Copyright
This work is made available under the terms of the Creative Commons Attribution 4.0 International license, https://creativecommons.org/licenses/by/4.0/.
History
Received: Sep 6, 2022
Accepted: Mar 10, 2023
Published online: Jun 7, 2023
Published in print: Sep 1, 2023
Discussion open until: Nov 7, 2023
ASCE Technical Topics:
- Architectural engineering
- Bridge components
- Bridge engineering
- Bridge management
- Bridge tests
- Building management
- Business management
- Engineering fundamentals
- Field tests
- Infrastructure
- Maintenance and operation
- Management methods
- Practice and Profession
- Ratings
- Social factors
- Structural engineering
- Tests (by type)
Authors
Metrics & Citations
Metrics
Citations
Download citation
If you have the appropriate software installed, you can download article citation data to the citation manager of your choice. Simply select your manager software from the list below and click Download.
Cited by
- Xin Wan, Xinyi Luo, Pengcheng Su, Yi Zhang, Rubing Wang, Influence of Stakeholder Identities on Unfairness Perception of Local Residents toward Public Facilities: Neurocognition Evidence from the Case of Waste-to-Energy Projects in China, Journal of Management in Engineering, 10.1061/JMENEA.MEENG-5647, 40, 5, (2024).