Experimental Investigation on the Chloride Transport Characteristics from Soda Residue Foundation to Semiburied Concrete under Water Environmental Factors
Publication: Journal of Materials in Civil Engineering
Volume 35, Issue 12
Abstract
Use of soda residue as engineering backfill is the most practical and economical method for reusing soda residue. In the existing research on soda residue soil as engineering backfill, most scholars focus on the bearing capacity of a soda residue foundation, while ignoring the failure of reinforced concrete (RC) built on soda residue foundation caused by the residue’s high salinity and high water content. In this study, a semiburied concrete indoor natural exposure experiment in a soda residue soil environment was conducted to investigate chloride transport between the foundation and the concrete, considering the effects of water environmental factors, including groundwater level of the foundation, relative humidity (RH) above ground, saturation of the foundation, and precipitation. The results show that chloride concentration in the above-ground part of the concrete (enriched in a range from ground level to a height of 100 mm) is apparently higher than that in the below-ground part, while chloride concentration in the concrete below the groundwater level is slightly higher than that from groundwater level to ground level. In the above-ground part of the concrete, the chloride concentration decreases with RH above ground. In the below-ground part, the chloride concentration in the unsaturated soda residue soil environment is higher than that in the saturated soda residue soil environment. Precipitation can effectively reduce chloride in the concrete in a soda residue foundation, while the total invasion of chloride decreases from 9 to 3 g in 120 and 180 days compared with that in a nonprecipitation environment. The time-dependent prediction empirical model of concrete chloride concentration in a soda residue foundation environment was established by introducing water environmental parameters of groundwater level of the foundation, RH above ground, saturation of the foundation, and precipitation environment. The reference apparent chloride diffusion coefficient is , , and in groundwater, from groundwater level to ground level, and above-ground, respectively.
Introduction
Soda residue is a type of white solid by-product of sodium carbonate by the ammonia-soda process. More than 7.8 million tons of it is emitted annually in China (Wang and Xu 2007). It is one of the most economical ways to reuse soda residue as engineering foundation soil (Hou 2004; Fang and Xu 2006; Tao 2016), and has been used as yard and road subgrade in Tianjin Port (Tian and Li 2009). There are two key issues to be explored for the application of soda residue as engineering soil: the bearing capacity characteristics of a soda residue foundation and the durability of reinforced concrete (RC) structures built on a soda residue foundation.
Scholars (Yan 2008; Wang and Xu 2007; Chen 2019) have measured the physical and mechanical properties of undisturbed soda residue and found that it has the characteristics of high water content, high void ratio, high compressibility, and low compressive strength as listed in Table 1, and is similar to soft clay. Chen (2019) carried out a long-term deformation test of undisturbed soda residue from Tianjin Port, and obtained a one-dimensional long-term deformation prediction model suitable for it. Xie and Yuan (2020) carried out static and dynamic triaxial tests on undisturbed soda residue from Tianjin Port to explore the change in undrained strength of the undisturbed residue under complex stress conditions. In order to improve the mechanical properties of soda residue to meet engineering bearing requirements, scholars have carried out research and proposed three engineering treatment methods.
| Category | Index | Soda residue | Saline soil |
|---|---|---|---|
| Physical properties | (%) | 203.40 | 22.00 |
| () | 0.41 | 1.52 | |
| 4.46 | 0.75 | ||
| Mechanical properties | (%) | 73.70 | 17.10 |
| (%) | 90.30 | 36.66 | |
| 16.60 | 19.56 | ||
| (kPa) | 36.90 | 48.78 | |
| (°) | 9.8 | 24.58 | |
| Chemical composition | (%) | 8.640 | 0.952 |
| (%) | 0.226 | 1.021 | |
| (%) | 0.022 | 0.005 | |
| (%) | 0 | 0.007 | |
| (%) | 0.106 | 0.267 | |
| (%) | 4.707 | 0.351 | |
| (%) | 0.108 | 0.213 | |
| Salinity (%) | 13.810 | 2.816 | |
| pH | 9.2 | 7.0 |
One method combines the composite soda residue soil with mineral admixtures such as fly ash (calcified) and steel slag or natural soil such as soft clay to produce fully dried soda residue. Yan and Meng (2002) conducted physical and mechanical experiments to explore the optimal mix proportions of engineering soil composed of soda residue and other materials. The results showed that a composite of soda residue soil and fly ash could be used as backfill soil for building foundations and road subgrades with a specific mix. Wang and Xu (2007) studied the mechanical properties of composite soda residue soil mixed with fly ash and clay in different mix proportions, and proposed a reasonable test to explore the basic physical indexes of composite soda residue soil.
A second method combines the soda residue with specific water content adjusted by drying or vacuum prepressing. Lei (2010) and Guo (2005) studied the influence of water content on strength, compression, and other mechanical properties of soda residue and determined the rule of mechanical properties with saturation of soda residue under the optimal water content. Fang and Zhu (2008) carried out a soda residue vibration drainage consolidation test, analyzed the vibration drainage effect and vibration drainage consolidation characteristics of soda residue, and summarized the mechanism of vibration drainage of soda residue. Yan (2008) carried out a soda residue strength test, and explored the time-varying law of the strength of soda residue with water content and dry density and found that shear strength does not reach its peak at the optimal water content (about 50%) because the saturation is only 57%, while it reaches its peak at a water content of 90% and a saturation of 79%. The soda residue-water-electrolyte system provides higher cohesion and cementation for soda residue, making it possible for the residue to provide reliable bearing capacity for buildings.
The third method is directly mixing the soda residue with cementing materials such as cement. Chen (2016) found that cement can enhance the cementation force of soda residue and improve the bearing capacity and anti-erosion ability of the foundation. They recommended a mix ratio of soda residue cement soil.
Comparing the three engineering treatment methods, it can be found that for meeting the requirements of engineering foundation bearing capacity, the soda residue with a specific water content has the most practicability and development potential because of its convenience of use and transportation and because of its mature construction method.
Most scholars focus on the bearing capacity of a soda residue foundation, while ignoring the durability failure of RC structures built on such a foundation caused by its high salinity and high water content.
In terms of salinity, soda residue can be classified as perchloric saline soil (Hou 2004). Scholars (Su 2012; Wang 2021; Han 2012) have measured the physical and mechanical properties of saline soil as listed in Table 1 and have found that the physical and mechanical properties of soda residue are different from those of saline soil, which has the characteristics of low water content, low void ratio, collapsibility, and salt expandability. The chemical compositions of saline soil and soda residue are listed in Table 1. As shown, in a saline soil foundation environment, the main corrosive ions are , , , and (Ivushkin and Bartholomeus 2017; Wang 2021). The degradation of concrete by sulfate attack and other erosion factors such as freeze-thaw and carbonization lead to cracking of the concrete cover (Wang 2021), which greatly accelerates chloride ion transport from the surface of the concrete to the front of steel in concrete through wide channels and shortens the initial time of steel corrosion. In a soda residue foundation environment, the dominant caustic ions are , , and , which enter the concrete and catalyze the corrosion of steel while the concrete remains intact because it contains little and . Furthermore, saline soils are distributed in the natural arid or semiarid regions of Africa, Asia, and Latin America (Ivushkin and Bartholomeus 2017; Wang 2021), where there is less precipitation, low evaporation frequency, low groundwater level, and low soil water content. However, soda residue as an engineering soil is used in coastal areas, where there is more precipitation, high evaporation frequency, high groundwater level, and high soil water content. Thus, the water environment of chloride transport into concrete is more complex in a soda residue foundation than that in a saline soil foundation.
Above all, sulfate erosion is a nonnegligible erosion factor in the study of chloride transport in concrete in a saline soil environment, while complex water environmental factors are the key erosion factors in the study of chloride transport in concrete in a soda residue environment.
Additionally, most scholars simulate the soil erosion environment mainly using an indoor simulated salt solution (Han 2012; Su and Wang 2012, 2013; Su 2012; Zhang and Zhu 2015; Zhang 2020; Hu and Jia 2020; Lu and Wei 2021; Wang and Zhang 2021), while there is less research in an actual soil environment. Due to the porous structure of soda residue soil, there are three phases of solid, liquid, and gas at the contact interface between the soda residue soil and the concrete, where water and ions transfer among the three phases, rather than a simple solid-liquid interface (simulated solution) such as with structures in a submarine environment (Wang and Guo 2022). If water exchange is not active (saline soil environment), it is reasonable to replace the actual soil environment with a simulated solution and a stable contact interface between soil and concrete. However, if water exchange is active (soda residue soil environment), it is unreasonable to assume the contact interface as a simple solid-liquid interface because of the dynamic cycle of internal moisture by evaporation, supplemented, and precipitation. At the same time, field tests can better solve the above problems, but orthogonal experiments cannot be done accurately through control variables due to the complex environmental factors outside. Therefore, developing a foundation environment simulation device and controlling water environmental factors for indoor experimental research have become an important objective of further research.
In summary, there are two problems that need to be further studied. (1) In the existing research on soda residue as a foundation soil, the bearing capacity of soda residue soil has been widely explored, but the durability of RC structures built on it, which has been ignored previously, needs to be further investigated, (2) the chloride transport mechanisms in concrete in a soda residue soil environment and in a saline soil environment are different due to the different corrosive ions in them. The rule of chloride transport in concrete in a soda residue soil environment should be further explored, and (3) the indoor solution simulation method, where the concrete is semi-immersed/immersed in the simulated solution, cannot consider the effect of dry-wet caused by the porous structure of the foundation soil, which cannot simulate the chloride transport in the concrete in the foundation environment with its complex water environmental factors.
To sum up, the present work seeks to (1) conduct a concrete indoor natural exposure experiment in a soda residue soil environment using a foundation environment simulation device, (2) investigate the effects of water environmental factors—groundwater level of the foundation, saturation of the foundation, RH above ground, and precipitation—on chloride transport between foundation and concrete, and (3) by introducing water environmental parameters, establish a time-dependent prediction empirical model of concrete chloride concentration in a soda residue foundation environment.
This study is of significance for its use of soda residue as an engineering soil to determine if the rule of chloride transport between the soda residue foundation and the concrete can provide a theoretical basis for the durability protection of RC structures built on a soda residue foundation, and to determine if the time-dependent prediction empirical model of concrete chloride concentration in a soda residue foundation environment can provide a reference for predicting the rusting time of steel in concrete structures.
Experimental Program
Materials
A plain concrete with a mix proportion of cement:water:fine aggregate:coarse aggregate = was used for exposed specimens according to Standard JGJ 55-2011 (MCPRC 2011). An ordinary portland cement with a standard compressive strength of 42.5 MPa and a density of produced by the Tianjin Cement Plant (Beichen, Tianjin) was used. The fine aggregate was medium river sand with a fineness modulus of 2.7 and an apparent density of . The coarse aggregate was gravel with a maximum diameter of 22.5 mm and an apparent density of . A group of three concrete cubes was cast to determine the density and compressive strength of the concrete in the experiment. After standard curing for 28 days, the density and compressive strength of the plain concrete was and 35.12 MPa, respectively. To eliminate the error caused by chloride ions in the mixture material, the initial chloride concentration of the same batch of concrete but not subjected to the natural exposure experiment was measured to be 0.065%.
Environmental Factors
Foundation Environment Simulation Device
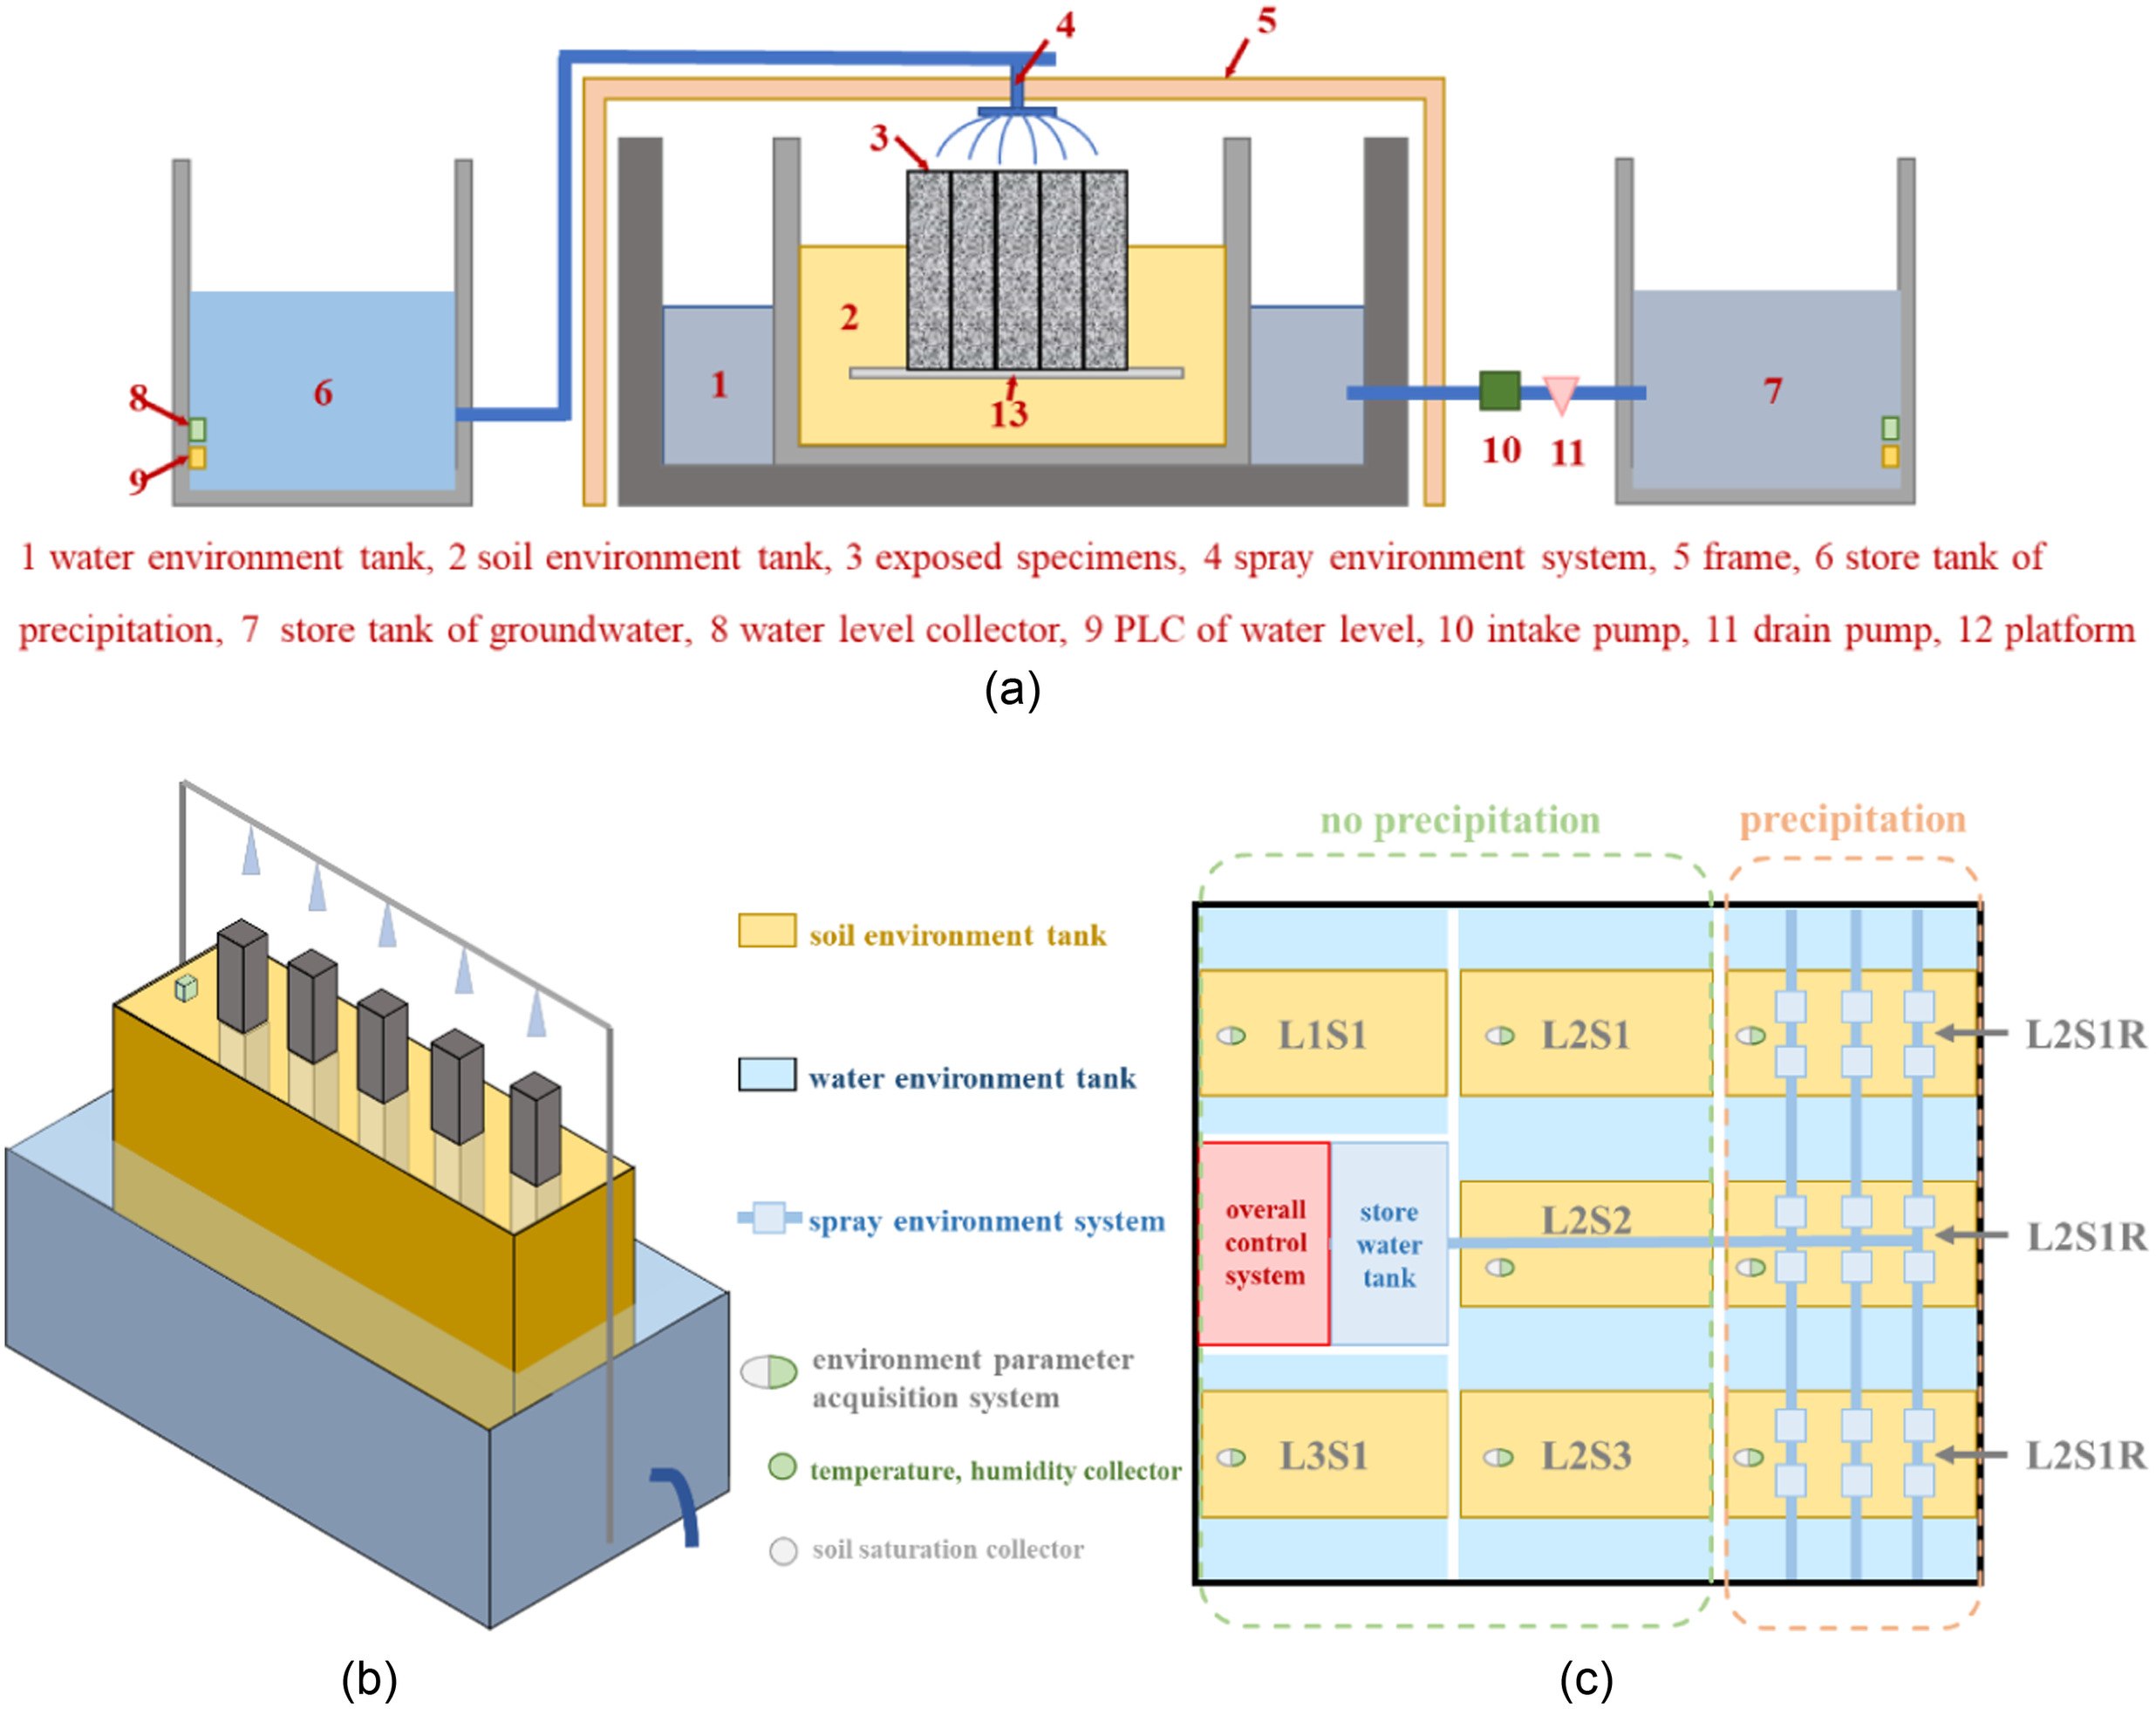
The foundation environment simulation device (FESD) independently developed in the laboratory was used to carry out the indoor natural exposure experiment. As shown in Fig. 1, the FESD is composed of five parts: the soil environment tank, the water environment tank, the spray environment system, the environmental parameter acquisition system, and the overall control system. The soil environment tank is placed in the water environment tank. To simulate the stable below-ground water environment, a semipermeable diaphragm (permeable and soil-retaining) for water and ion exchange is used on the outer wall of the soil environment tank; the overflow hole is also set on the outer wall of the water environment tank. The spray environment system is used to simulate precipitation. The environmental parameter acquisition system collects the temperature and relative air humidity of the ground surface, soil moisture content, saturation, and other environmental parameters. The overall control system sets parameters such as groundwater level, spraying flow, and spraying cycle through programmable logic controller (PLC). The FESD is an indoor simulation of a real foundation environment and can independently collect test parameters, providing the equipment basis for this test. Notice that the FESD in Fig. 1 has no fixed dimensions, which can be adjusted according to the environmental requirements and the scale of experiment.
Soda Residue Foundation
The soda residue soil from Tianjin Port, Northern Port, was used in this experiment. The chemical compositions of the undisturbed soil are listed in Table 1.
With the development of research on soda residue with a specific water content, it can be found that the soda residue has the most practicability and development potential, such as convenience of use and transportation and a mature construction method. In order to investigate the effect of soda residue soil saturation and water content on chloride ion transport from soda residue soil to concrete, the soda residue soil was dried for 0, 5, and 12 days, and the physical indexes of the soda residue soil after drying were measured and are listed in Table 2. The saturation of the soda residue filled soil was measured after each drying period, and the average is shown in Table 3.
| Index | (%) | () | (%) | (%) | ||
|---|---|---|---|---|---|---|
| S1 | 172.3 | 1.253 | 2.24 | 3.866 | 99.7 | 7.46 |
| S2 | 108.0 | 1.201 | 2.24 | 2.881 | 84.0 | 8.32 |
| S3 | 67.8 | 1.180 | 2.24 | 2.183 | 69.5 | 9.91 |
| Environmental condition | Groundwater level (m) | RH (%) | (%) | |
|---|---|---|---|---|
| L1S1 | 78.27 | 99.72 | 3.866 | |
| L2S1 | 58.13 | 99.72 | 3.866 | |
| L2S2 | 58.13 | 83.99 | 2.881 | |
| L2S3 | 58.13 | 69.51 | 2.183 | |
| L3S1 | 44.26 | 99.72 | 3.866 | |
| L2S1Ra | (58.13, 83.56) | (99.72, 99.91) | 3.866 | |
| L2S2Ra | (58.13, 83.56) | (83.99, 99.87) | 2.881 | |
| L2S3Ra | (58.13, 83.56) | (69.51, 99.63) | 2.183 |
a
RH and change with the precipitation environment, so they are not stable constants; their ranges are given in Table.
After drying, the soda residue soil with different saturations was layered into the different soil environment tanks, in which the filling depth of the soil was 1 m. Scholars (Liang 2016; Qiao and Xia 2010; Zhang and Zhu 2015) have proposed that ions may be enriched in the above-ground part of the concrete to serious erosion in the range of 300 mm from ground level in the foundation environment. The specimen was semiburied in the foundation, in which the height of the above-ground exposure area was 150 mm and the depth of the below-ground area was 350 mm after comprehensive consideration of specimen size, environmental parameters, and simulation conditions in this experiment.
Groundwater
The groundwater quality analysis results obtained from the survey report (Chen and Zhuang 2016) of the soda residue soil dump at Tianjin Port are listed in Table 4.
| Component | Content () |
|---|---|
| 25,000.42 | |
| 475.25 | |
| 68,337.50 | |
| 44.152 | |
| Mineralization | 167,688.0 |
| Aggressive | 0 |
| pH | 11.28 |
As shown in Table 4, the groundwater is Cl-Ca type weak alkaline-alkaline water and the main corrosive ions are , , , , in which and content is obviously higher than that of the others and , content is too low to calculate. Besides, corrosion of steel caused by chloride erosion is the most serious factor in durability failure of RC structures exposed to a soda residue soil foundation environment. Therefore, solution with a concentration of 7.5% was used to simulate the groundwater environment of a soda residue soil foundation in this study.
RH above Ground
For monsoon climate regions, there are seasonal changes in the groundwater level and RH, which decrease in autumn and winter, and increase in spring and summer. The average static groundwater level of the Tianjin Port soda residue soil dump is , and the annual variation range is (Chen and Zhuang 2016). The measured monthly RH changes in Tianjin are shown in Table 5. In order to simulate the seasonal periodic changes in groundwater level and RH, three groups of groundwater conditions of , , and were set in this experiment. The RH of each month was collected by the FESD environmental parameter acquisition system, and the average is shown in Table 5.
| Month | RH (%) |
|---|---|
| January | 40.2 |
| February | 60.1 |
| March | 45.3 |
| April | 37.4 |
| May | 41.5 |
| June | 43.6 |
| July | 62.8 |
| August | 74.2 |
| September | 68.4 |
| October | 51.3 |
| November | 53.7 |
| December | 45.6 |
Precipitation
According to the statistical characteristic value of precipitation in Tianjin provided by Li and Liu (2010), annual maximum precipitation occurs in July. Average daily precipitation and precipitation frequency in July are 13.45 mm and 12.4 days, respectively. In order to fully simulate the influence of precipitation on chloride transport in this experiment, the simulated daily precipitation of 13.45 mm and the precipitation frequency of 12.4 days were rounded up to 14 mm and 15 days, respectively.
Environmental Conditions and Specimen Design
Above all, there were eight mutually orthogonal environmental conditions in this experiment as shown in Table 3. A total of 40 exposed specimens with were designed for eight different and orthogonal environmental conditions. Each group of five specimens was exposed to an environmental condition for five exposure durations of 20, 60, 90, 120, and 180 days, separately. The designation refers to the specimen exposed to the environmental condition of for exposure duration of , where refers to different groundwater levels, refers to different saturations of soda radium soil, and refers to precipitation environment as shown in Table 3.
Specimen Casting, Curing, Exposure, and Chloride Measurement
Plain concrete specimens were cast in plastic molds, then compacted on a vibrating table. According to Standard JGJ 55-2011 (MCPRC 2011), after curing for 24 h at 20°C ± 3°C and RH above 90%, the specimens were moved to a solution saturated with for 28 days of curing as shown in Fig. 2(a)1. Then five sides of each specimen were sealed with epoxy resin and one side was exposed to make sure the chloride ions would transport only in one dimension as shown in Fig. 2(a)2. After curing and sealing, all specimen groups were semiburied in the foundation to begin exposed test according to soda residue foundation as shown in Fig. 2(a)3.
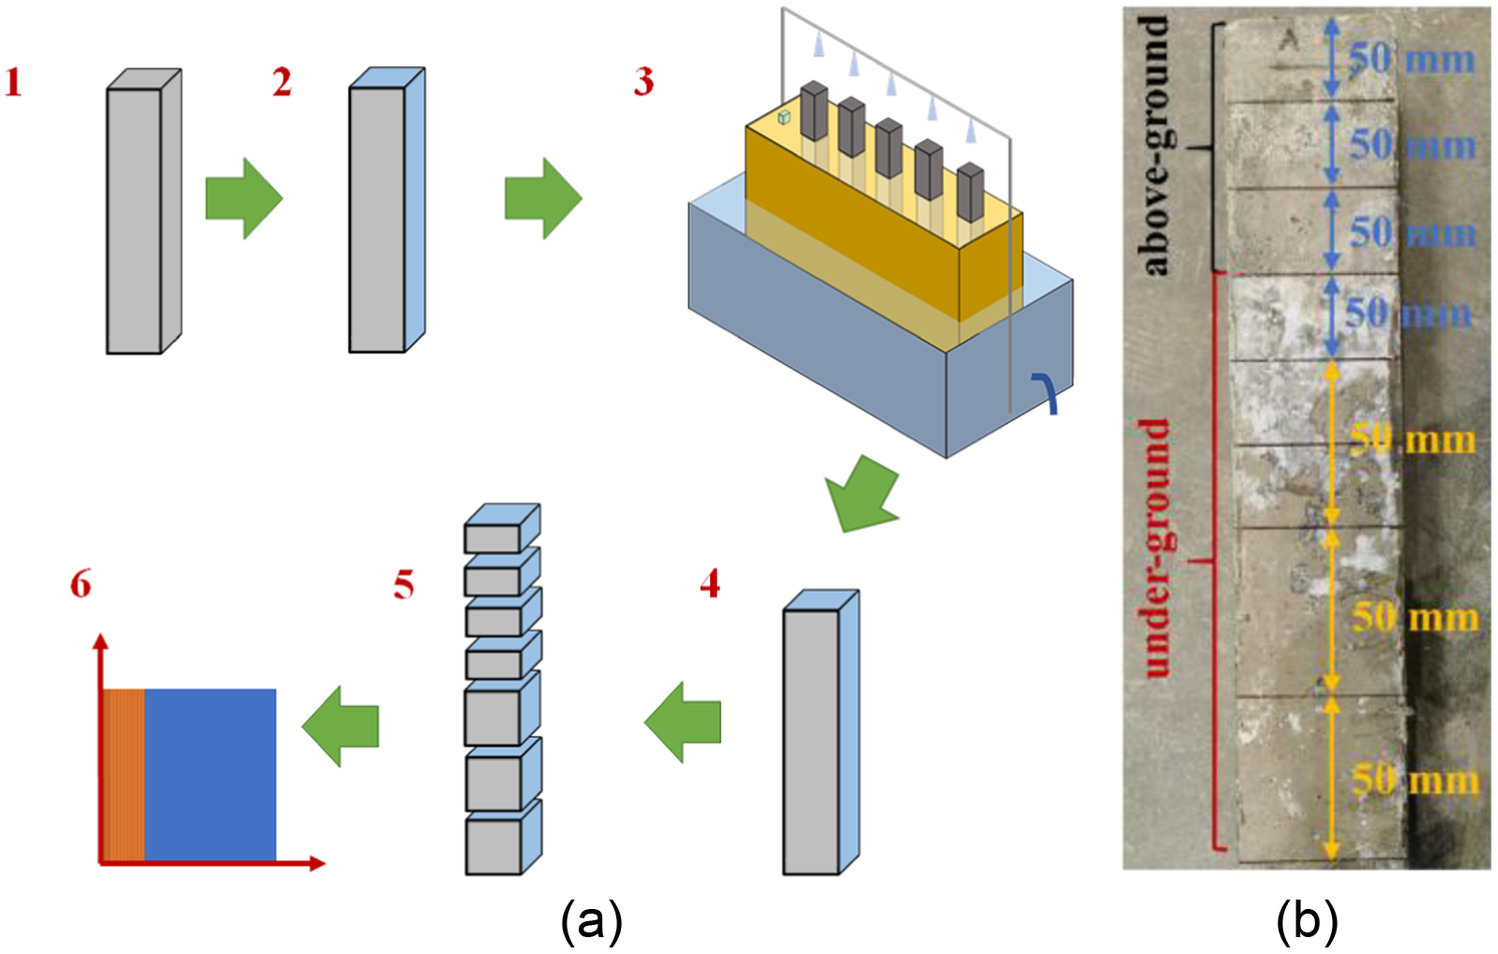
After the expected exposure durations, the specimens were taken out of the soil environment tank and divided into seven blocks from top to bottom as shown in Fig. 2(a)4 and 5. In order to explore the accurate location of chloride ion enrichment of the concrete in the above-ground area, each specimen was divided at 50-mm intervals, ranging from the top (150 mm above ground level) to 200 mm (50 mm below ground level), and it was divided at 100-mm intervals, ranging from 200 mm to the bottom (350 mm below ground level). In this way, there were three samples above ground and four samples below ground as shown in Fig. 2(b).
Each block was milled at 1-mm intervals, ranging from the surface to 5 mm, then at 2 mm intervals, ranging from 5 to 25 mm as shown in Fig. 2(a)6. A ZDJ-4B automatic potentiometric titrator (INESA Group, Shanghai, China) was used to measure the chloride concentration, which was composed of a chloride ion selective electrode, a reference, and 40-mL distilled water, successively added to an empty beaker. The mixture in this beaker was fully stirred to ensure that the chloride was dissolved in the distilled water. Then the supernatant of this well-stirred mixture was taken to determine the mean value of the chloride ion content, (% by weight of powder), in the specimen using the titrator. According to the differential idea, of the measured layered powder can be approximated according to the concentration of the center of every layer. Combined with the actual thickness of the layers mentioned above, the chloride concentration profile was drawn.
Test Results and Discussion
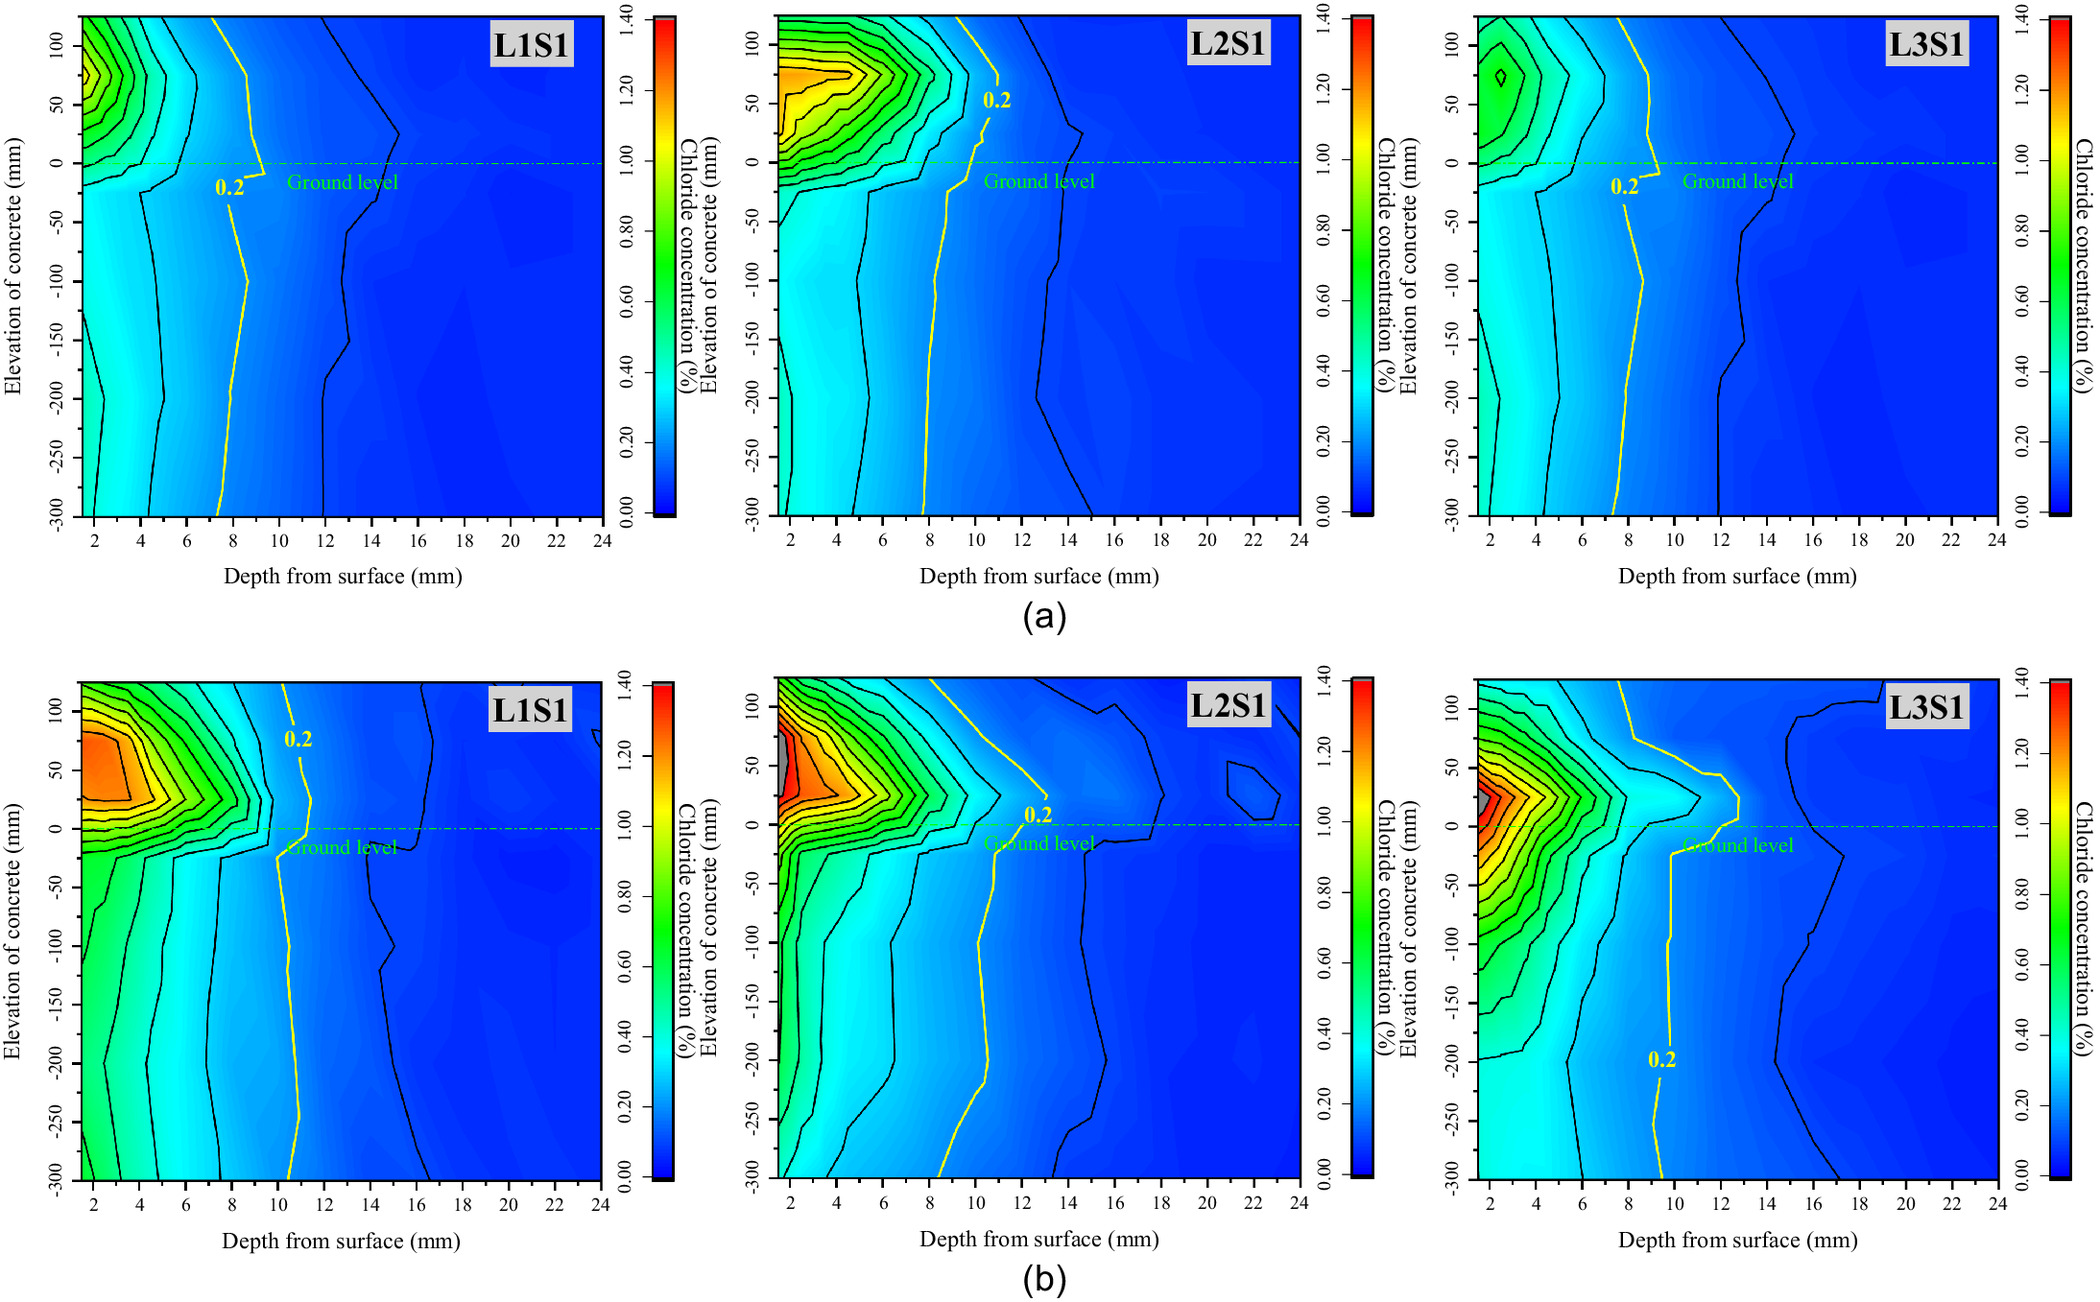
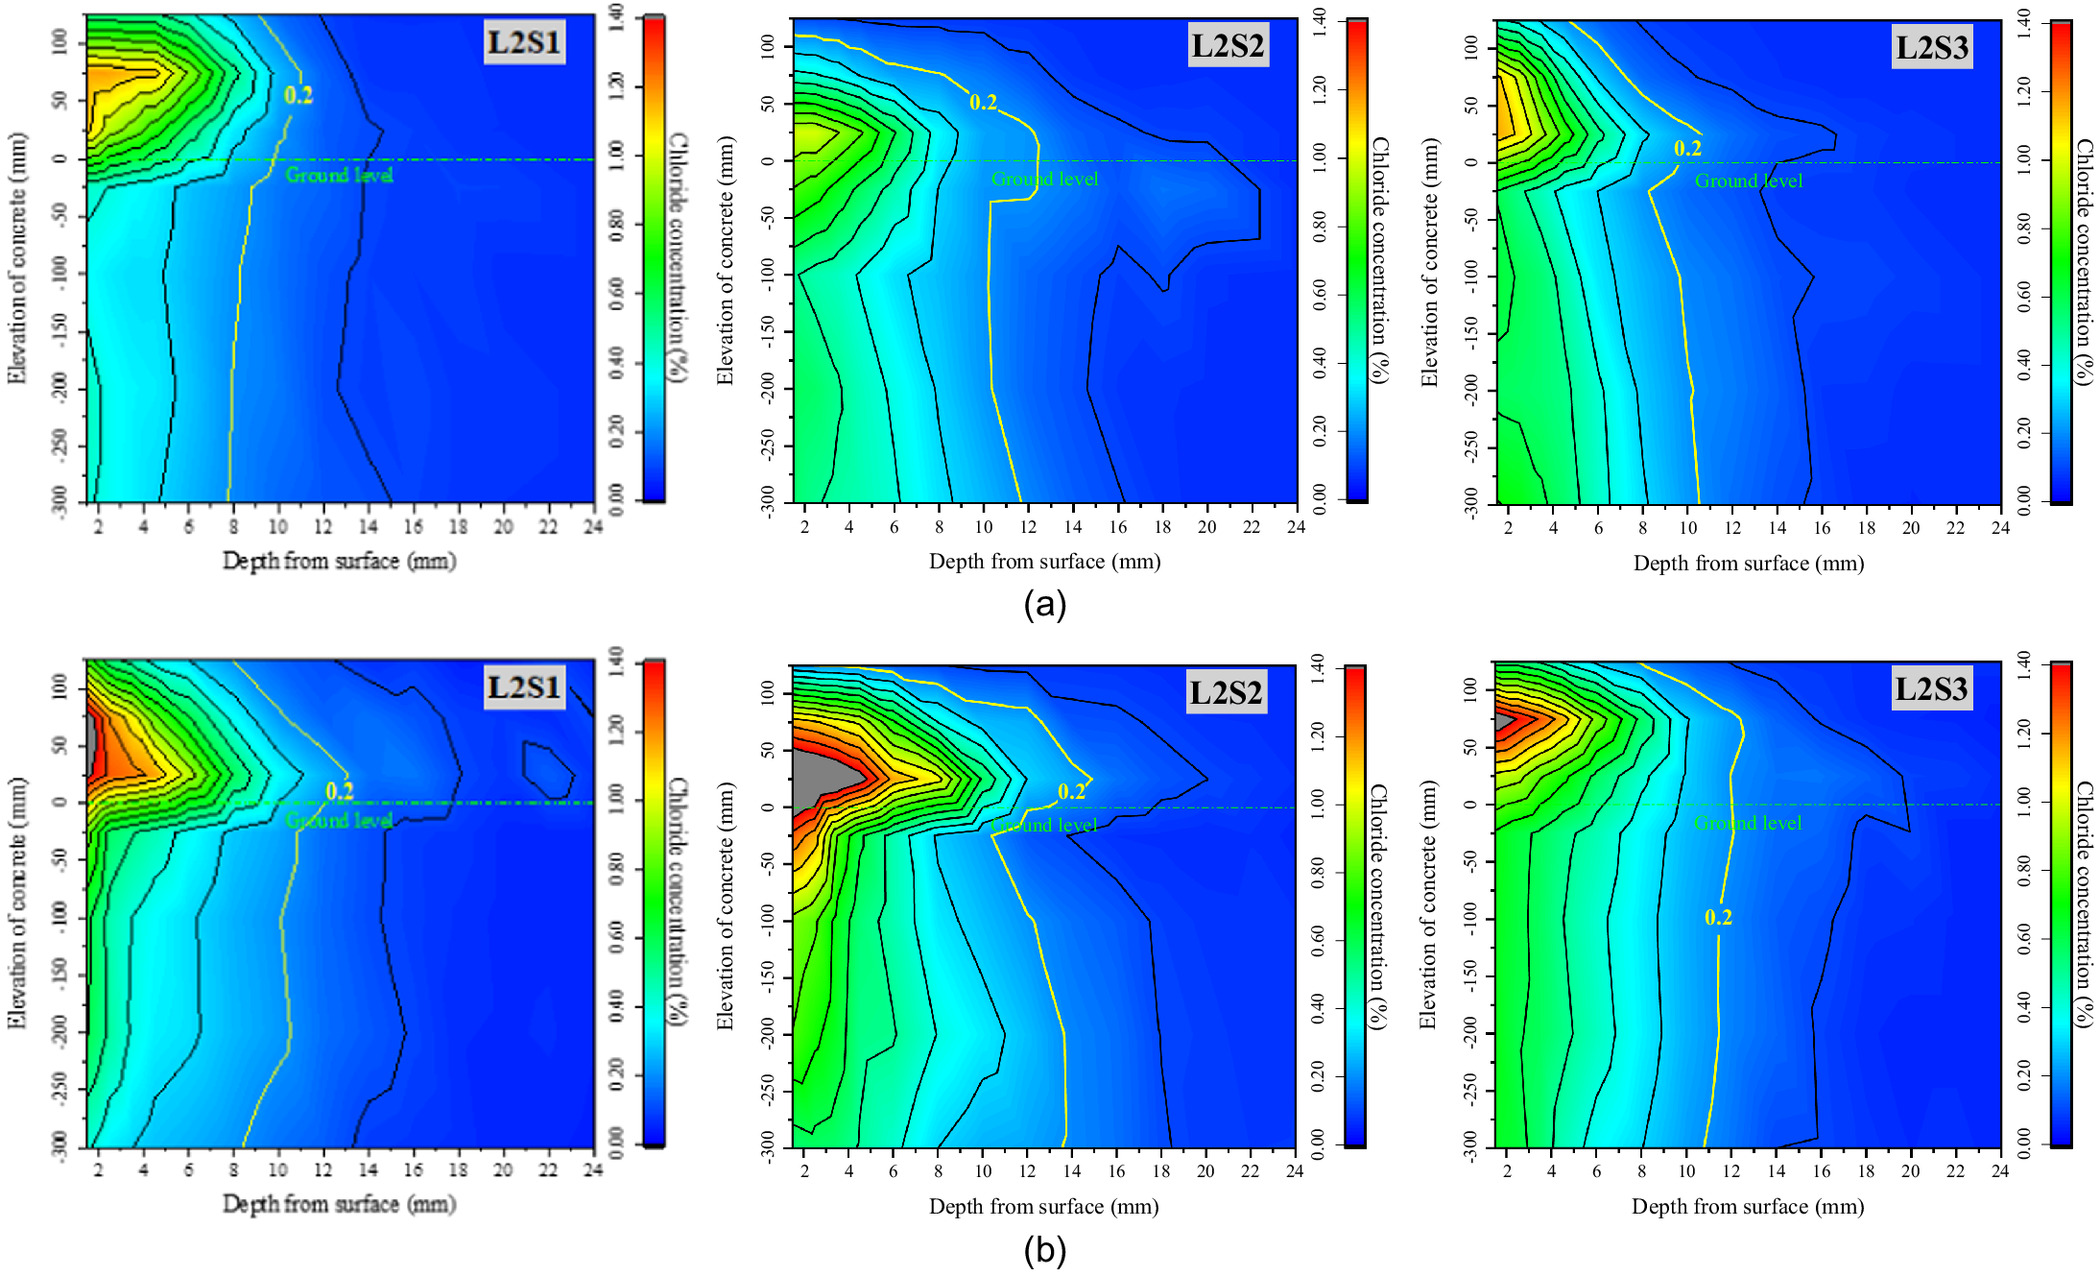
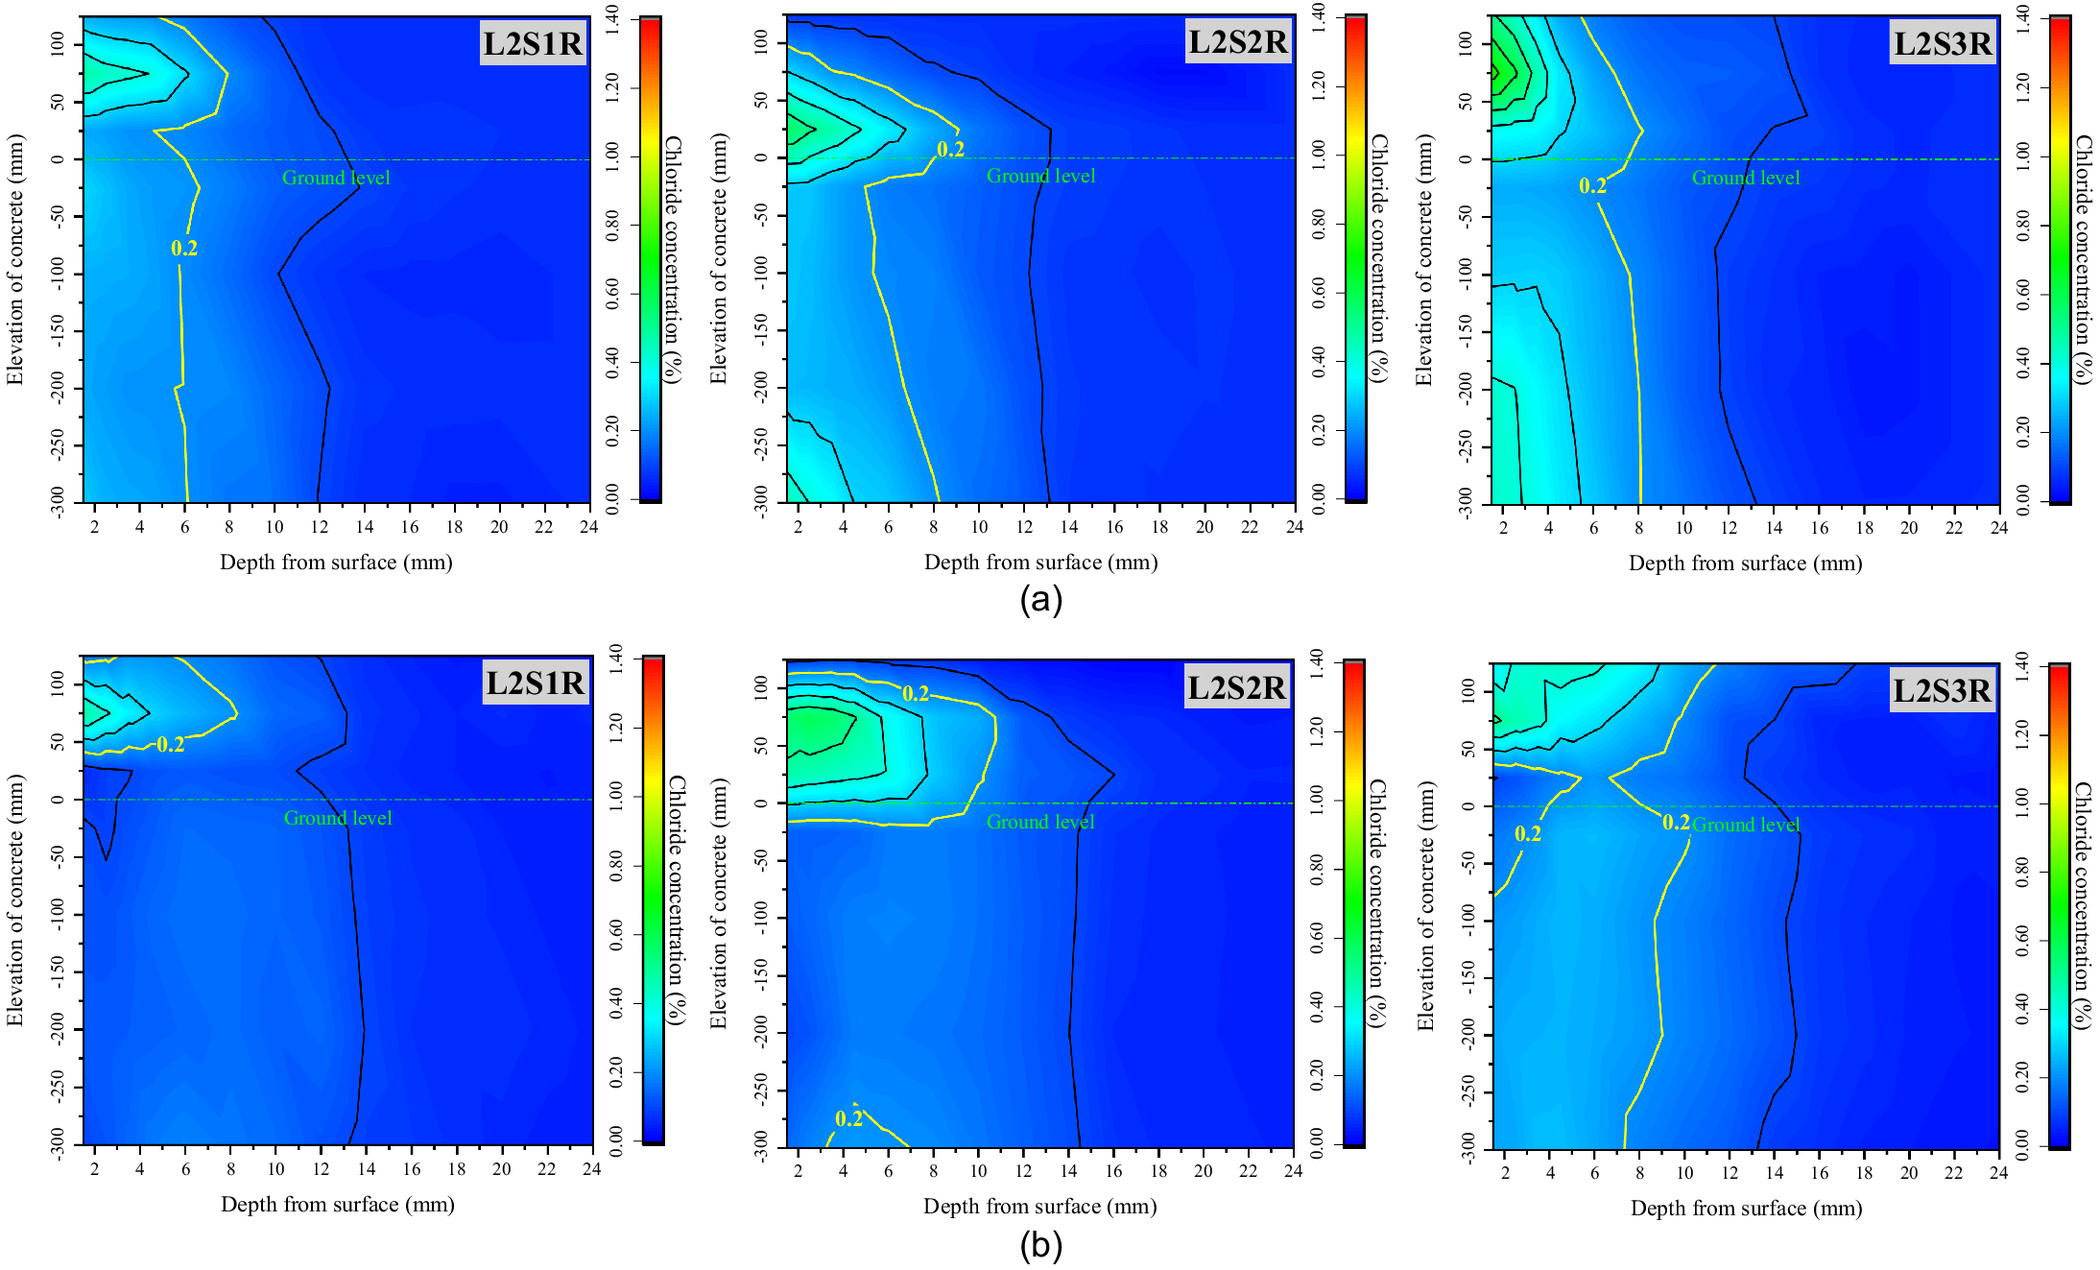
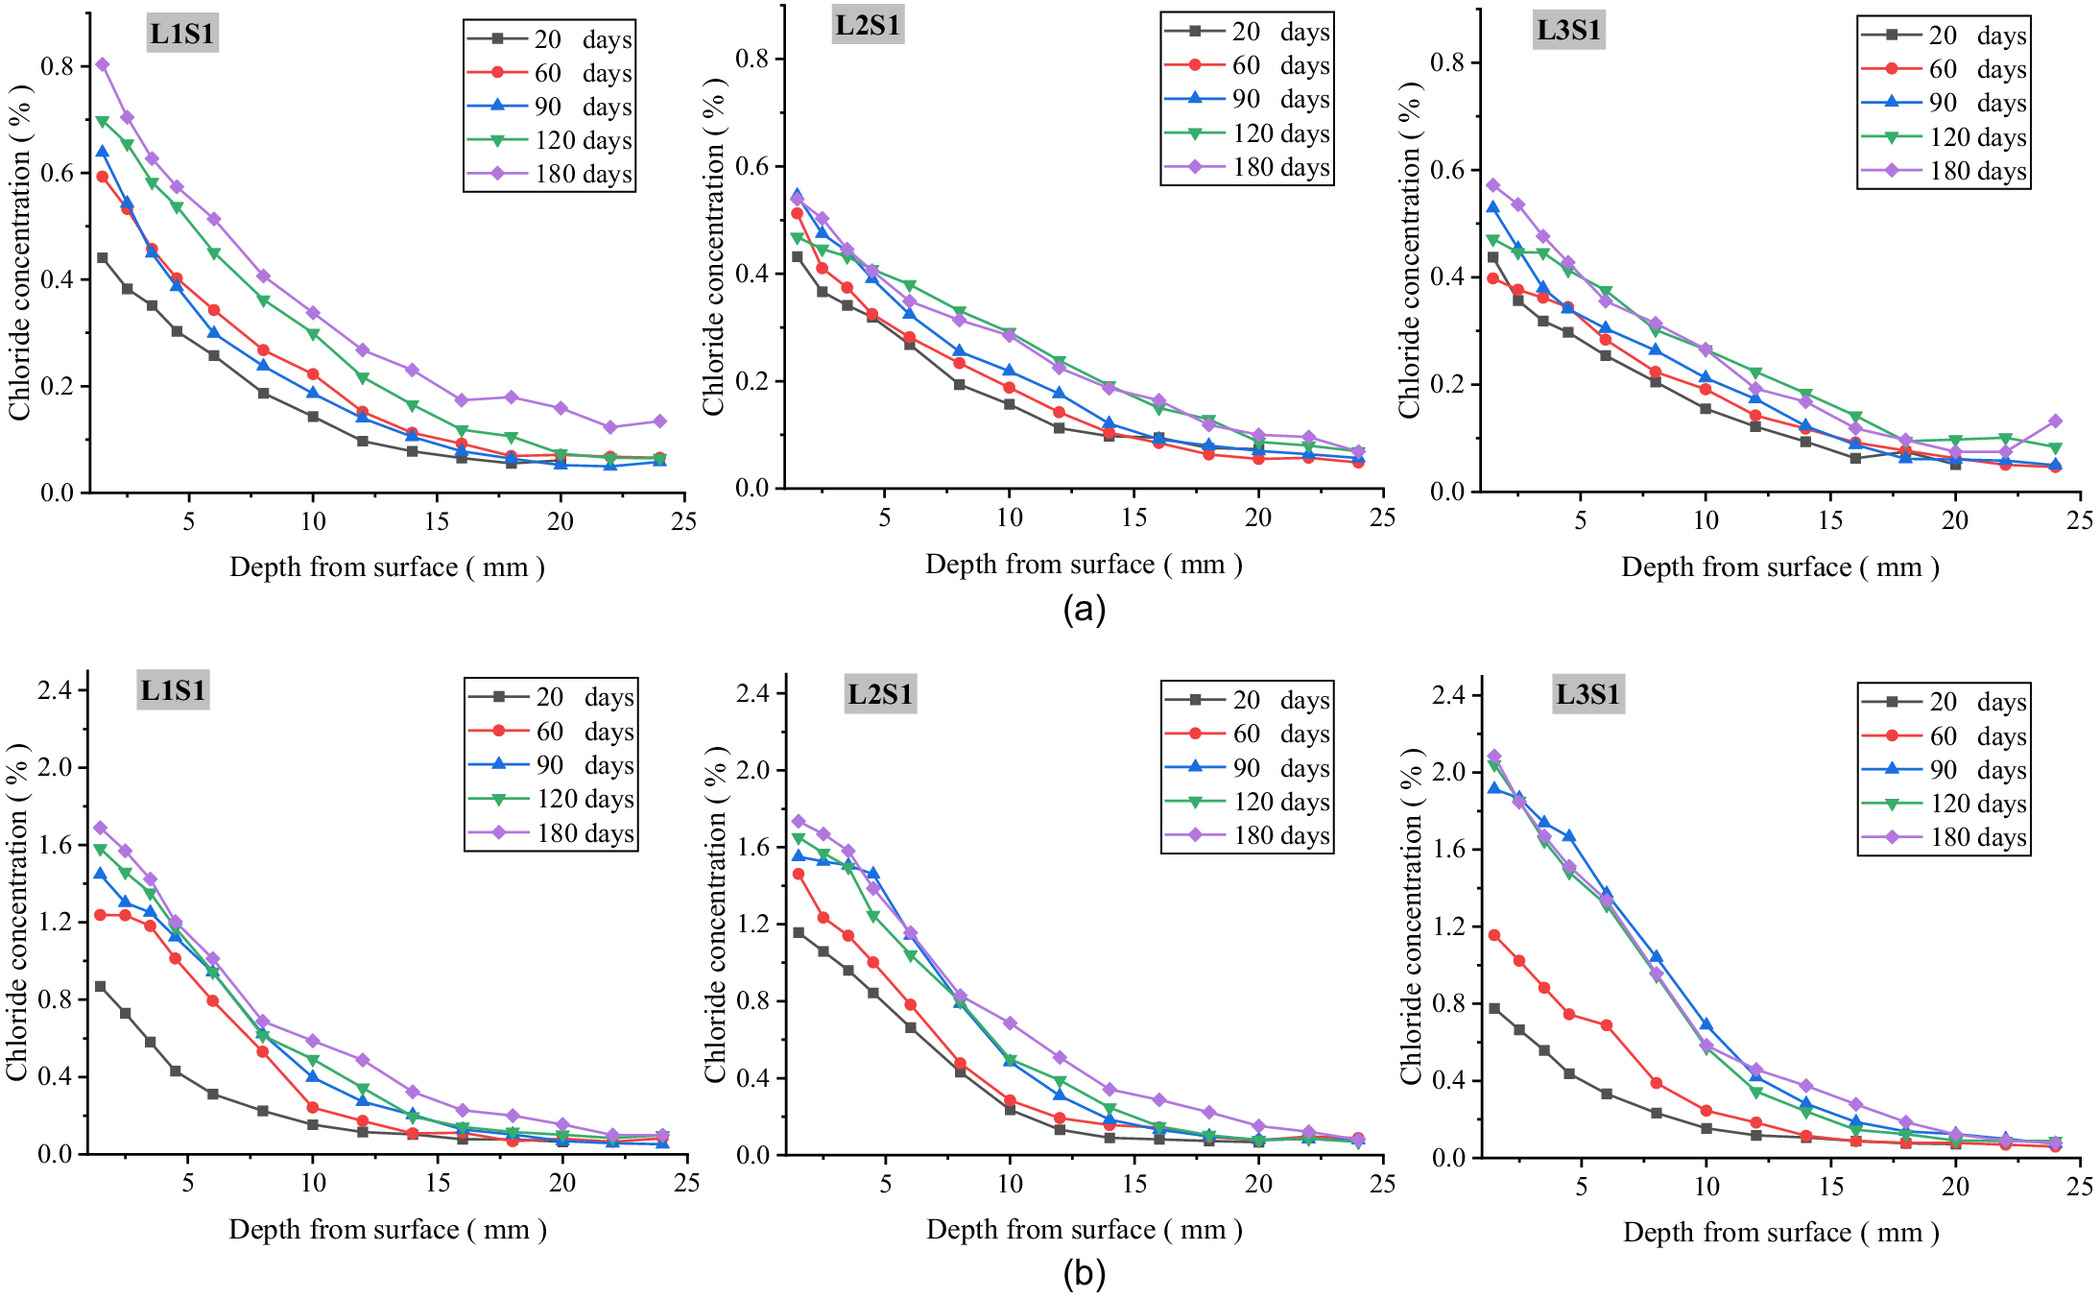
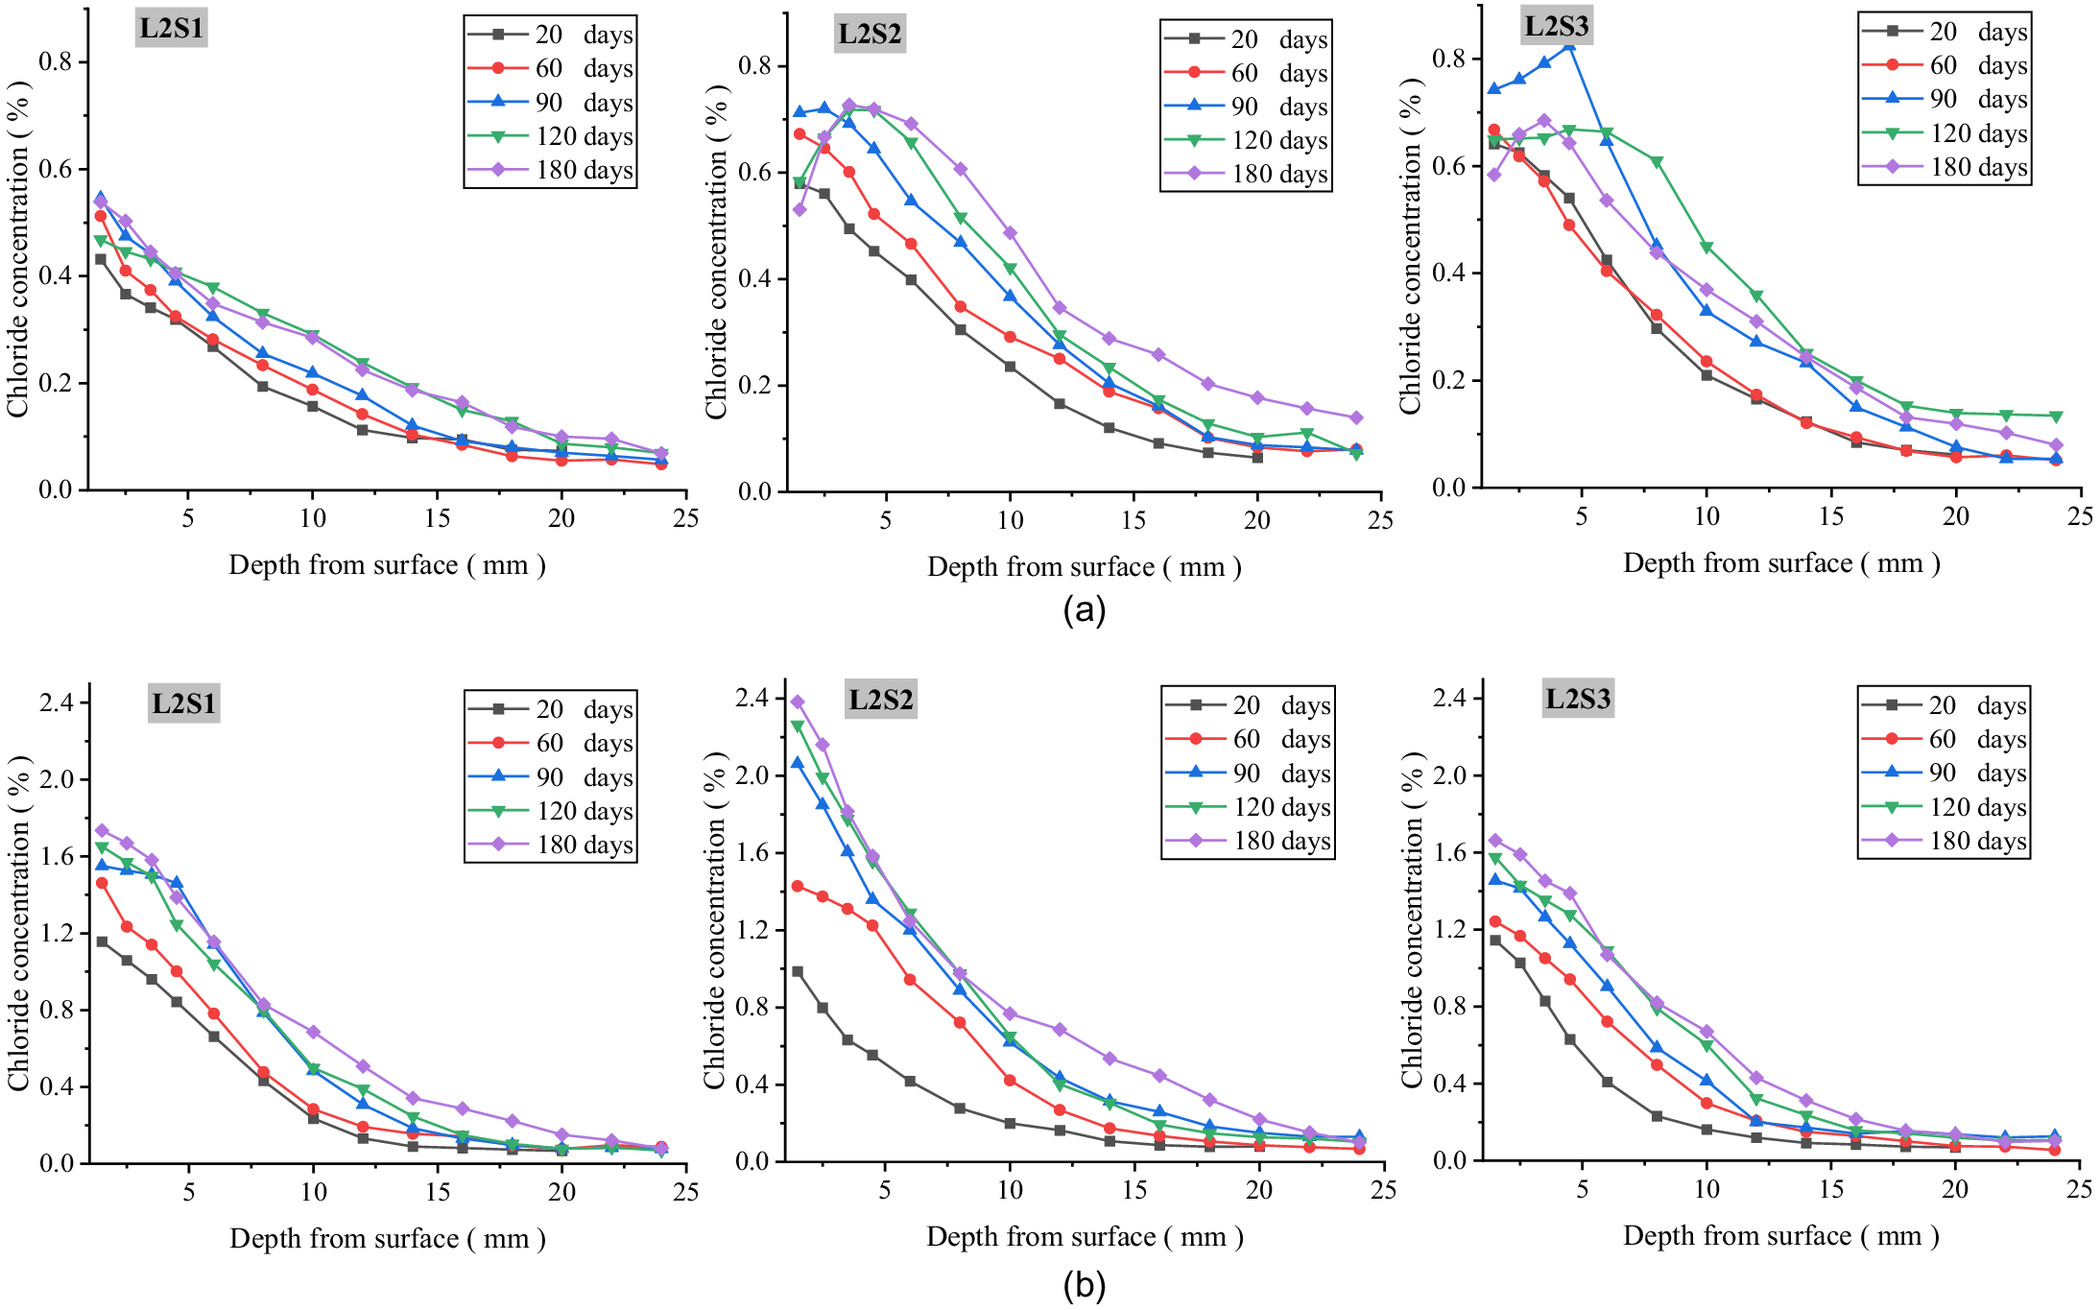
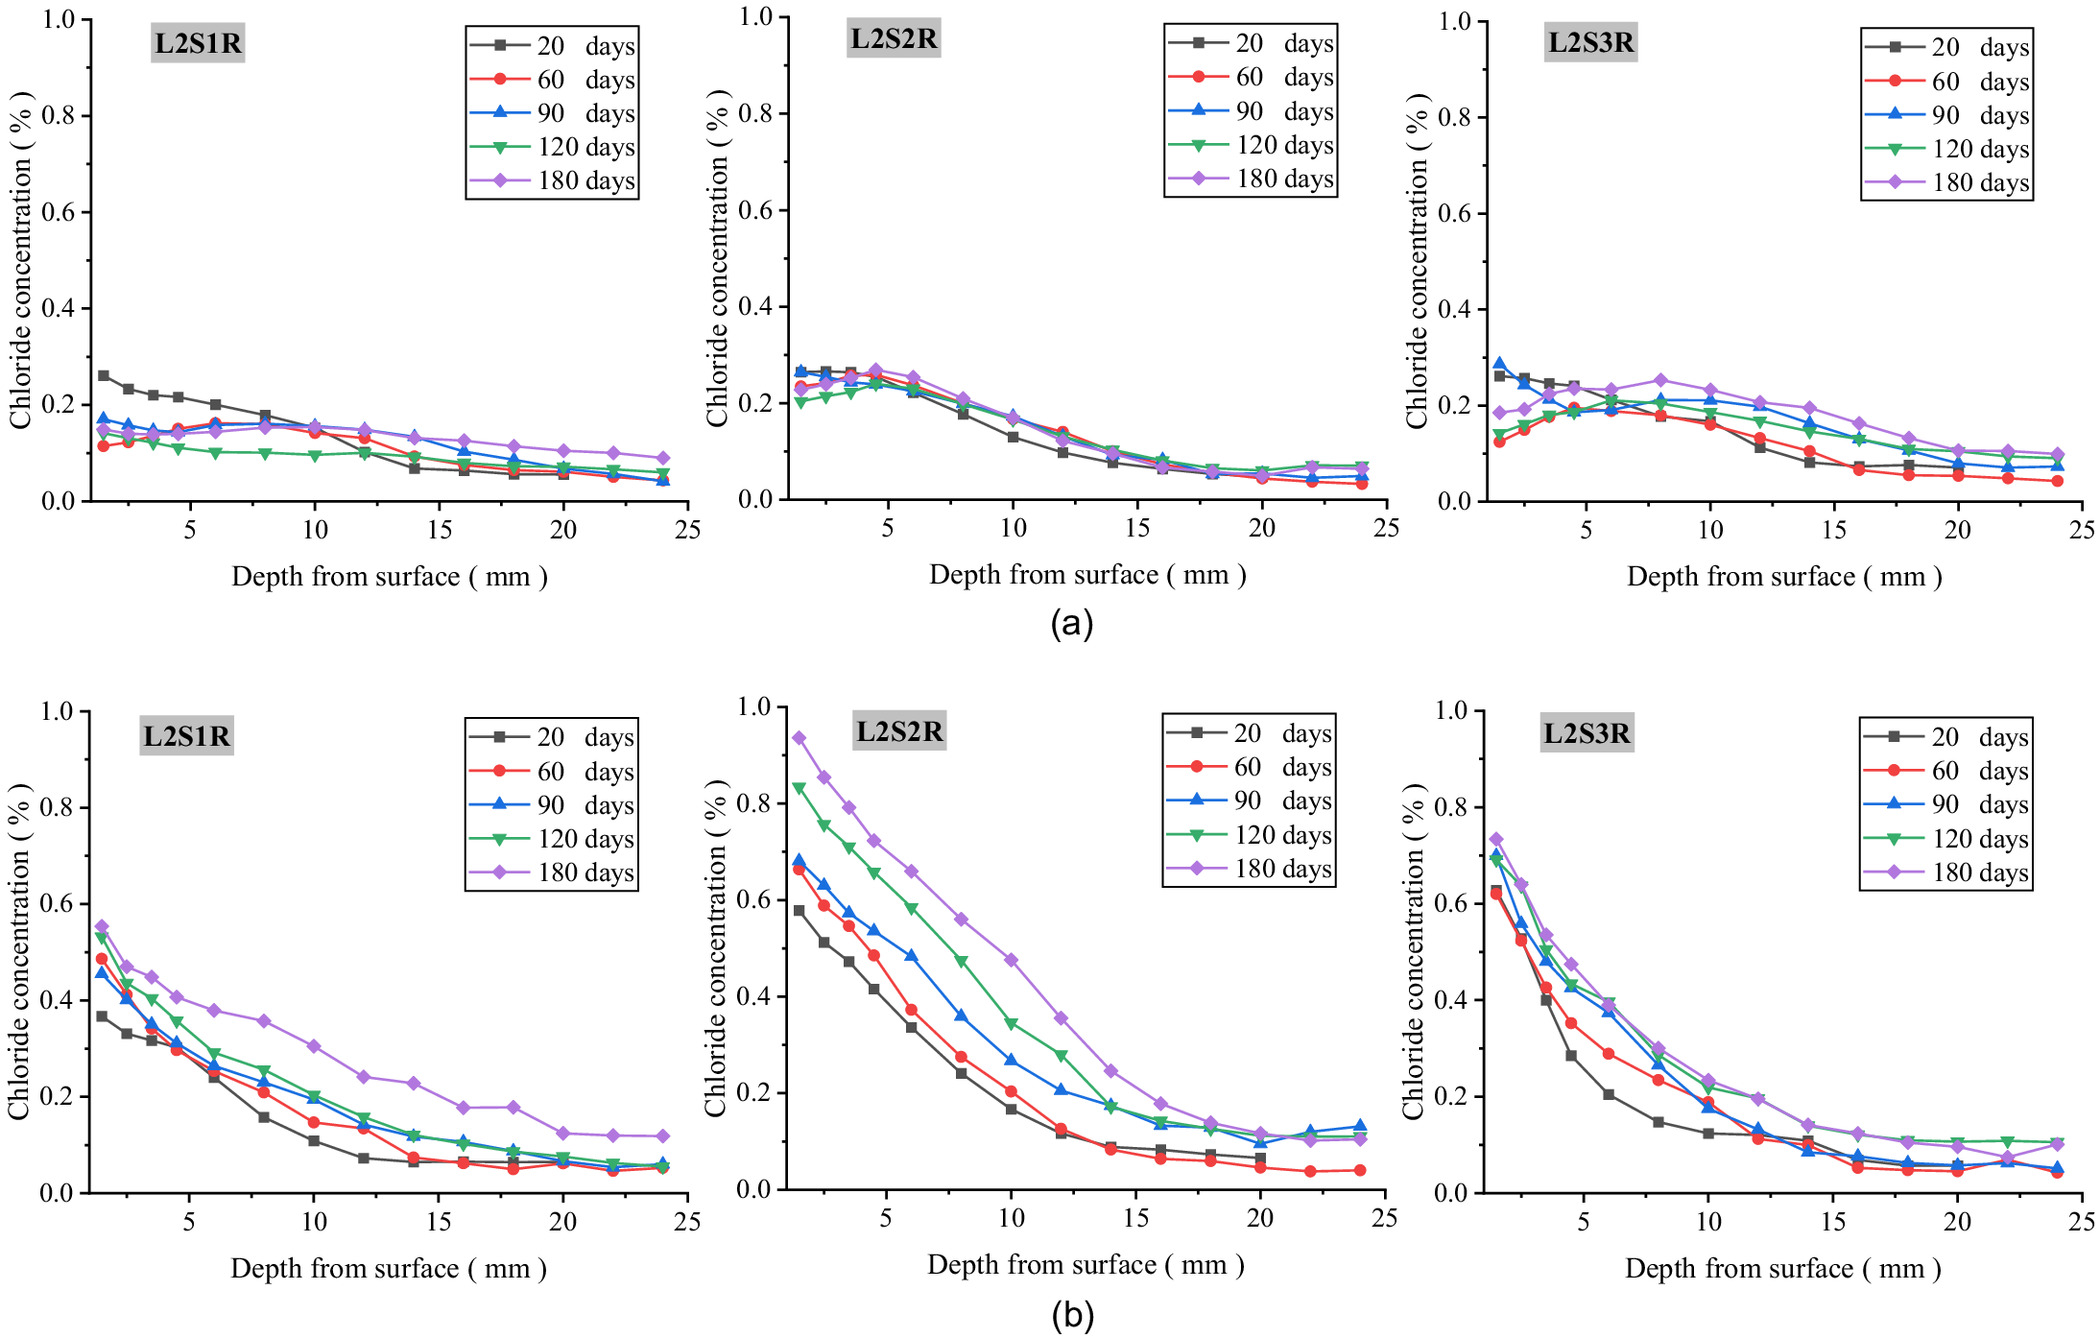
In order to explore the mechanism of chloride transport from foundation to concrete and to determine the location of serious chloride erosion in the concrete under various environmental conditions, all the blocks of every specimen were divided, powdered, and measured, and the iso concentration contours of the chloride in the concrete exposed for 20 and 60 days were drawn as shown Figs. 3–5. These figures show that the chloride ions in each specimen were enriched from ground level to a height of 100 mm in the above-ground part of the concrete, and were evenly distributed along the elevation in the below-ground part. Therefore, with the ground level as the origin at 0 cm, two blocks above ground (0, 5 cm) and (5, 10 cm) and two blocks below ground (, ) and (, ) were selected as the characteristic locations to further discuss the rule of chloride transport in concrete with exposure time. Figs. 6–8 show the chloride concentration profiles with exposure time in the above-ground part and the below-ground part of the concrete under different environmental conditions.
The chloride concentration distribution with three water environmental factors of groundwater level, saturation of soda residue soil, and precipitation are discussed next.
Chloride Concentration Distribution Contour
Figs. 3–5 show the iso concentration contours of chloride at different groundwater levels and different saturations of the soda residue soil, and in different precipitation environments, respectively. As they indicate, three conclusions can be proposed.
First, there is a significant difference in chloride concentration distribution along the elevation direction of the specimen. The chloride concentration in the above-ground part of the concrete is obviously higher than that in the below-ground part, and it drops sharply at ground level. Compared with the no-precipitation environment, the total amount of chloride ions transported from the soda residue soil into the concrete in the precipitation environment is significantly reduced, especially in the saturated soda residue foundation environment.
Second, the highest chloride concentration is located in the above-ground part, and its elevation has little correlation with groundwater level, RH, or soda residue soil saturation, which is in the range of (0, 50 cm). Compared with the no-precipitation environment, the elevation of the highest chloride concentration shows an upward trend, which moves from (0, 5 cm) for L2S1, L2S2, and L2S3 to (5, 10 cm) for L2S1R, L2S2R, L2S3R.
Third, the critical chloride ion concentration of steel corrosion in ordinary concrete was measured at about 0.2% by Al-alaily and Hassan (2018). According to the above research, the iso concentration contour line of the critical value is marked in Figs. 3–5. It can be seen from Fig. 4 that the critical concentration contour line of the below-ground part moves from about 8 mm in 20 days to about 9 mm in 60 days, while the critical concentration contour line of the above-ground part can reach about 13 mm at the deepest point (L2S1 and L3S1 in 60 days), resulting in faster migration compared with that in concrete in a marine environment. Compared with the saturated soda residue foundation, more chloride ions penetrate the concrete in the unsaturated soda residue foundation, and the critical concentration contour line also moves significantly from 8 to 11 mm in 20 days and from 10 to 14 mm in 60 days. The critical concentration contour line remains stable with exposure time, and it is significantly shallower than that in the no-precipitation environment.
Chloride Concentration Distribution at Different Exposure Durations
Figs. 6–8 show the experimental chloride profiles at different groundwater levels saturations, and in different precipitation environments, respectively. From these figures, four conclusions can be proposed.
First, the chloride concentration in the below-ground part of the concrete gradually decreases with transport depth and increases with exposure time, showing a typical diffusion property, which is consistent with Fick’s second law. Compared with the saturated soda residue foundation, the chloride concentration in below-ground part of the concrete in the unsaturated soda residue foundation first increases and then decreases with transport depth, resulting in an obvious convection zone. Second, the chloride concentration in the above-ground part of the concrete appears as a small convection zone similar to that in the dry-wet cycle environment in the shallow layer, while the chloride profile in the deep layer is consistent with Fick’s second law. Third, the chloride concentration in the below-ground part of L1S1 is significantly higher than that in the other two environments, while the chloride concentration in the above-ground part increases with groundwater level and RH above ground. Fourth, compared with the saturated soda residue foundation of L2S1, chloride concentration in the below-ground part of the concrete in the unsaturated soda residue soil of L2S2 and L2S3 is significantly higher, while in the above-ground part of the concrete it increases with saturations of the soda residue soil. Fifth, chloride concentration in the above-ground part of the concrete is similar to the no-precipitation environment, which is consistent with the diffusion characteristics. However, peak concentration and stable concentration decrease in the precipitation environment compared with the no-precipitation environment. Chloride concentration distribution in the below-ground part of the concrete has a relatively flat decreasing stage with transport depth. After 180 days, the highest chloride concentration is less than 0.3%.
Mechanism of Chloride Ion Transport between Foundation and Concrete
Below Ground
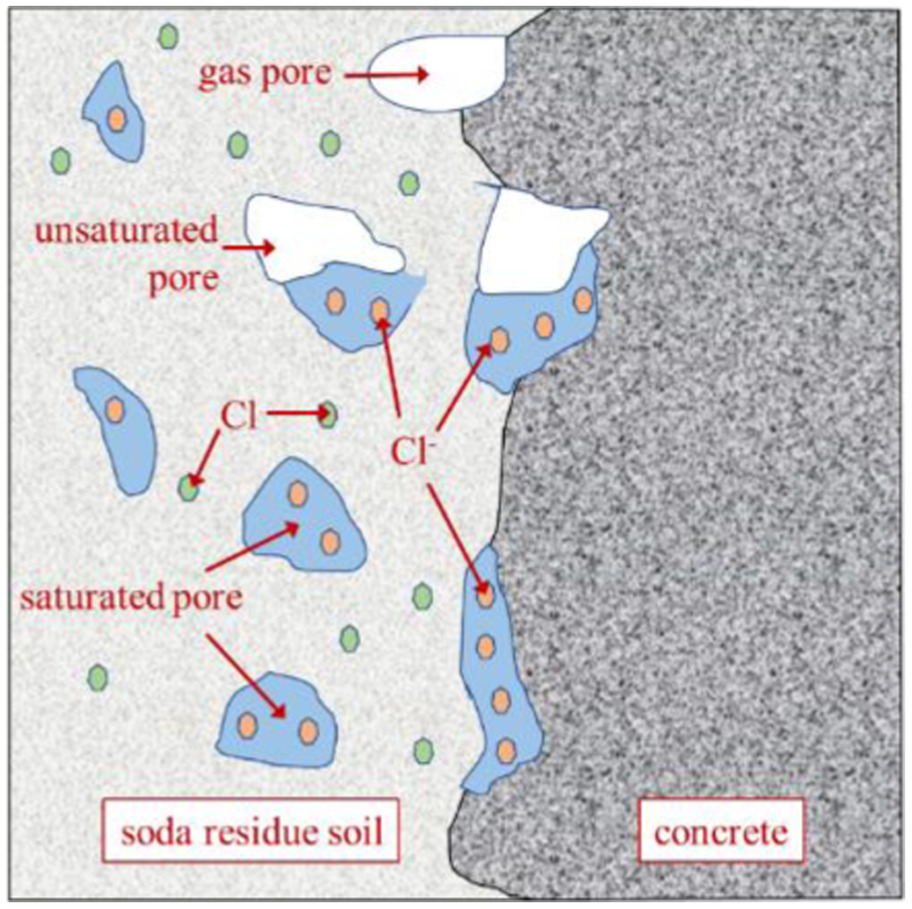
Fig. 9 shows the contact interface between the soda residue soil and the concrete. When using soda residue soil as an engineering backfill foundation soil, internal moisture and porosity cannot be ignored due to the high moisture content and large porosity of soda residue soil. As shown in Fig. 9, the structure of soda residue soil can be simplified into three parts: solid (soil skeleton), liquid (pore fluid), and gas (gas part in unsaturated pores). The chloride in the soil skeleton (Cl in Fig. 9) is dissolved in the pore fluid ( in Fig. 9) and then carried into the concrete through water transmission between the pore fluid and the concrete, which is the basis of chloride ion transport from the soda residue soil to the concrete. In summary, water is a necessary condition for chloride ion transport. As shown in Fig. 9, the below-ground part of the concrete is in direct contact with the soda residue soil, and the pore fluid is enriched at the solid-liquid interface, resulting in the infiltration phenomenon. The pore fluid, carrying chloride ions, enters the surface of the concrete, forming a concentration gradient of chloride ions between shallow and deep parts of the concrete, which is the power of diffusion action. The high saturation state of the concrete also provides a sufficient diffusion medium for chloride ion transport, thus forming a diffusion profile along the depth direction in the below-ground part of the concrete.
Above Ground
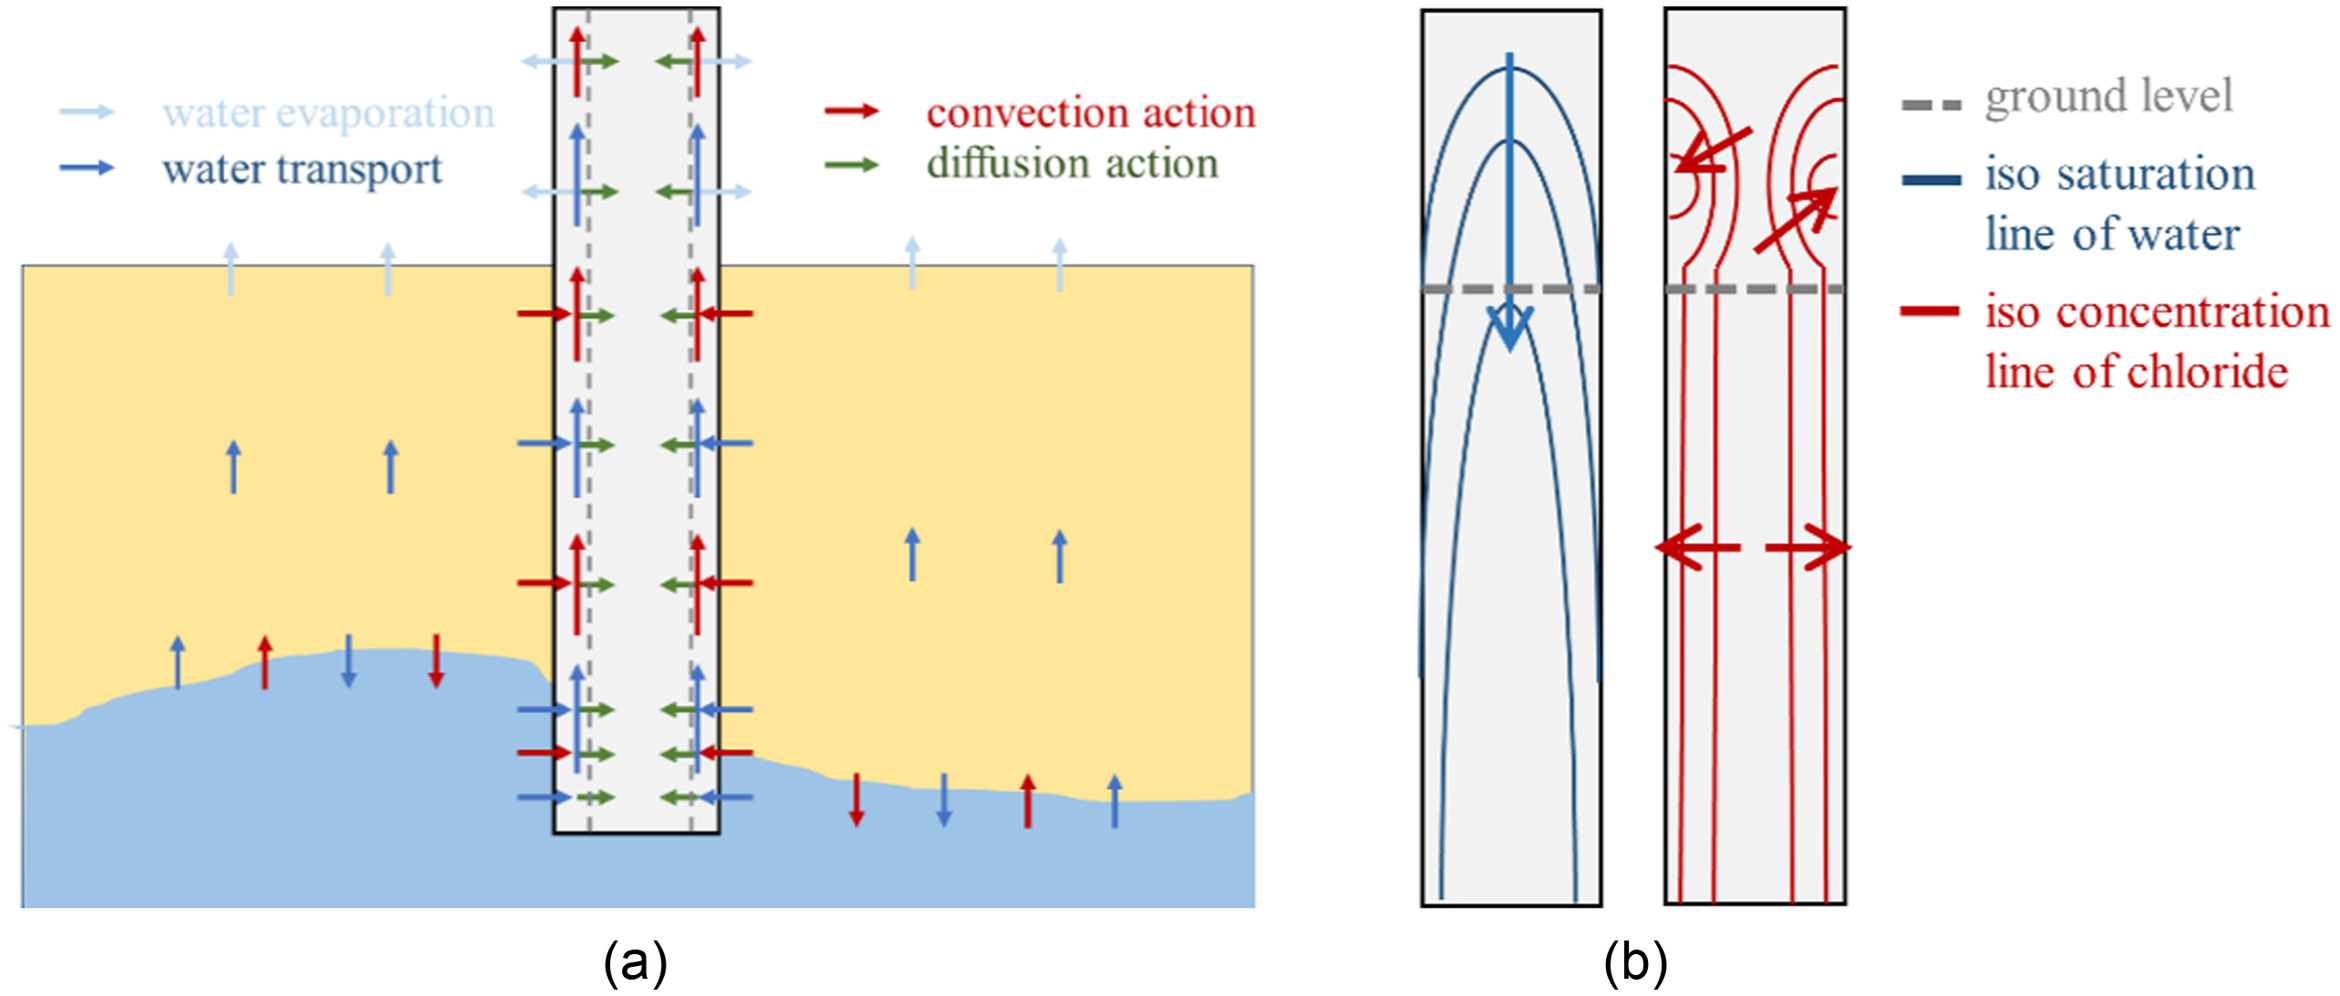
Fig. 10 shows the cause of chloride enrichment in the above-ground part of the concrete. As shown in Fig. 10, this part has no contact interface with the liquid water, so the chloride ions must come from the below-ground part. In fact, because of the high saturation state of the this part and the reduction in saturation of the shallow part of the concrete above ground due to water evaporation, the hydraulic gradient is formed between above ground and below ground in the shallow part of the concrete. The coupled action of hydraulic gradient and capillary suction leads to the rapid upward transmission of pore fluid carrying chloride ions from below ground to above ground in the shallow part. While chloride ions are transported to the above-ground part of the concrete, the pore fluid evaporates out of the concrete, resulting in the accumulation of chloride ions in the shallow part of the concrete above ground. With the increase in accumulation, there is a large concentration gradient between the deep and shallow parts above ground, which is the power of diffusion. At the same time, the deep part maintains a high saturation, as water evaporation occurs in the shallow part, which provides a transmission medium for diffusion. The diffusion profile along the depth direction is formed in the above ground part of the concrete. Above all is the mechanism of root breakage, and Fig. 10(a) shows the distribution of water and chloride in the concrete according to this mechanism, which is consistent with Figs. 6–8. The arrow in Fig. 10(b) refers to the incremental direction of water and chloride in the concrete.
Effect of Water Environmental Factors
For the below-ground part of the concrete at different groundwater levels, the solid-liquid interface could be divided into above groundwater level and below groundwater level. In the area below the groundwater level, the concrete directly contacts the groundwater, while in the area above the groundwater level, the concrete contacts the pore fluid of the soda residue soil. The contact area below the groundwater level is significantly larger than that above the groundwater level, resulting in more chloride transport into the concrete from a wide range of solid-liquid interface. It is reasonable that the chloride concentration distribution of the concrete below-ground in L1S1 is significantly higher than that in L2S1 and L3S1.
For the above-ground part of the concrete at different RH above ground, RH affects the evaporation capacity of the above-ground part of the concrete. With the decrease in RH, the evaporation effect of the concrete water increases, the evaporation depth and evaporation intensity increase, and the saturation of the concrete decreases, thus forming a larger hydraulic gradient with that below ground. More chloride ions are transported to the above-ground part of the concrete along the shallow part of the concrete with the pore fluid. It is reasonable that the chloride concentration distribution of the concrete above ground in L3S1 is the highest, followed by L2S1 and then L1S1.
Under the unsaturated soda residue foundation, for the below-ground part of the concrete the pores in the contact interface between soda residue soil and concrete are filled by gas and pore fluid. The water is in three states: pore fluid of the soda residue soil, pore fluid of the concrete, and pore water vapor. Therefore, the water in the contact interface can be regarded as a microscopic convection field. Chloride ions accelerate into the concrete by convection, forming a convection zone and raising the concentration distribution of the chloride ions. This part of the mechanism is similar to chloride ion transport under dry-wet cycles (Wang and Guo 2022). It is reasonable that the chloride concentration distribution of the concrete below ground in L2S1 is significantly lower than that in L2S2 and L2S3. For the above-ground part of the concrete, increased chloride concentration in the shallow part below ground leads to more chloride in the upwardly transported pore water, resulting in more chloride above ground. It is reasonable that the chloride concentration distribution of the concrete above ground in L2S1 is significantly lower than that in L2S2 and L2S3.
In the precipitation environment, the effect of precipitation on the foundation environment can be summarized into the following two categories: (1) improvement in RH above ground and in saturation of the soda residue foundation, thereby slowing down the convection; and (2) the leaching desalination effect of precipitation on chloride ions in the soda residue soil, which causes the chloride concentration in the soda residue soil to decrease sharply to 5.21% after exposure of 120 days according to the measurement. Because of more pores in the contact interface between soda residue soil and concrete, it is reasonable to speculate that the leaching desalination effect is more obvious for chloride in the contact interface between soda residue soil and concrete. Compared with the nonprecipitation environment, the chloride concentration in the precipitation environment decreases significantly.
Parameter Analysis and Model Establishment
In this section, based on the analytical solution of Fick’s second law, the water environmental parameters are introduced to establish time-dependent chloride transport prediction models of the concrete in three areas: from below ground to the groundwater level, from the groundwater level to the ground level, and above ground. A time-dependent chloride transport prediction model of the concrete is also established for the characteristic location of the precipitation environment.
Below Groundwater Level
Below the groundwater level, the concrete specimens are in saturated condition due to their immersion in the groundwater. Fick’s second law of diffusion (Wang et al. 2018a, b; Wang and Gong 2019) presents the best fit with the performance of a chloride unsteady diffusion profile, which is a significant characteristic of chloride diffusion in the concrete in a saturated water environment. It is given as Eq. (1)In the one-dimensional case, the boundary condition and initial condition are assumed to beand the analytical solution is given aswhere = chloride concentration at the diffusion depth of from the surface of the concrete specimen at exposure time (%); = surface chloride concentration (%); = initial chloride concentration of the concrete before exposure to the environment (%); = apparent chloride diffusion coefficient (); and erfc = inverse function of the error function. Note that serves as chloride concentration both at the initial time and at infinite depth from the surface of the concrete, where there is no diffusion action.
(1)
(2)
(3)
The chloride concentration scatters of L1S1 in Fig. 11(a) were brought into Eq. (3), and the and at different exposure times were fitted as shown in the figure.
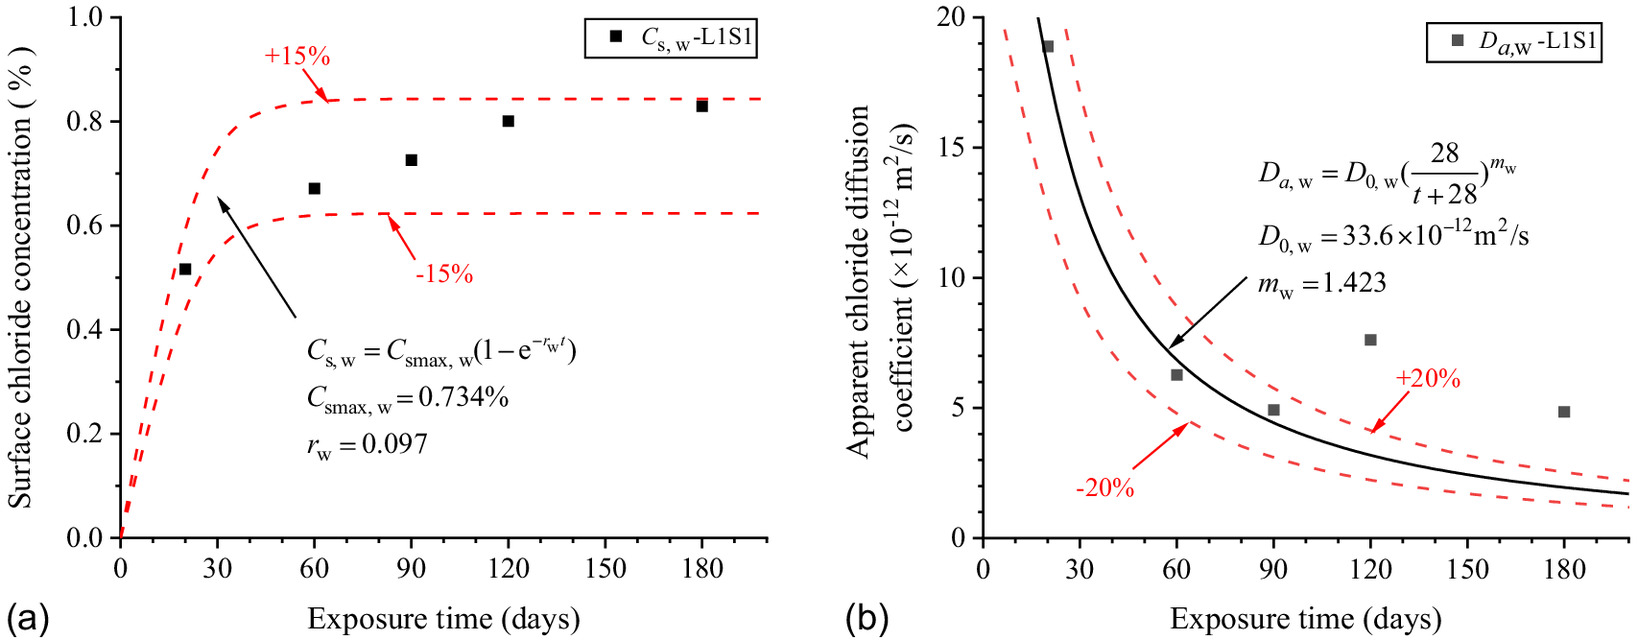
Fitted formulas of can be expressed as linear, square-root, power, exponent, and logarithmic functions (Costa and Appleton 1999; Kassir and Ghosn 2002; Song and Lee 2008). As the surface chloride concentration increases with exposure duration and then gradually tends to be stable, the exponent function is suitable to describe the scatters of in Fig. 11(a) as Eq. (4):where = surface chloride concentration (%) of the concrete specimens corresponding to exposure time (day); = ultimate surface chloride concentration (%); and = surface chloride concentration growth factor.
(4)
The model of surface chloride concentration with exposure time below ground to the groundwater level is shown in Eq. (5). The predicted results of Eq. (5) are in good correspondence with the fitted scatter of Eq. (3) as shown in Fig. 11(a), which proves that Eq. (5) is reasonable
(5)
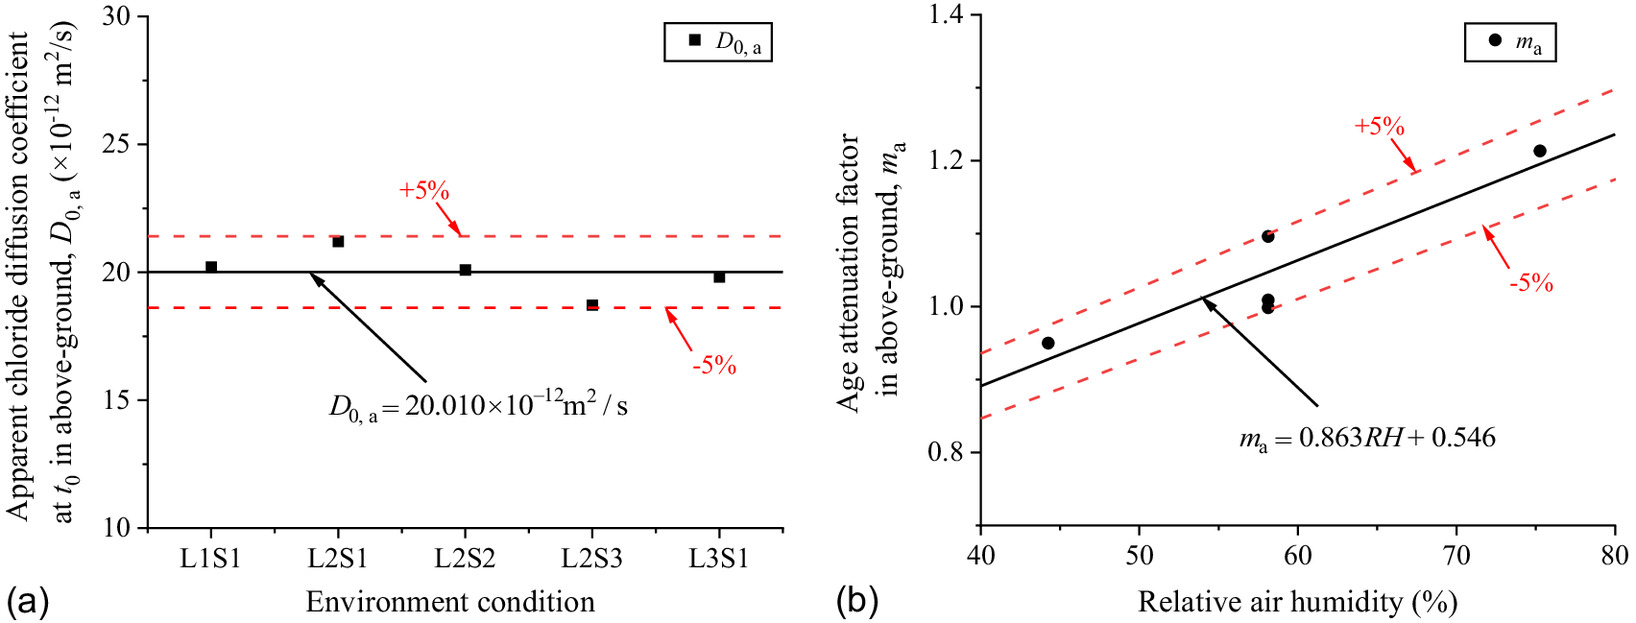
The time-dependent formula of was proposed by Thomas and Bamforth (1999) as Eq. (14)where = total time from molding to exposure here = sum of 28-day curing and exposure time, which can be set as ; = apparent chloride diffusion coefficient () at total time ; = reference apparent chloride diffusion coefficient () at 28-day curing; and = age attenuation factor of the concrete.
(6)
From Groundwater Level to Ground Level
From groundwater level to ground level, the concrete specimens are in stable saturation showing that using Fick’s second law of Eq. (3) provides the best fit with the chloride profiles in Figs. 6(a), 7(a), and 8(a). Fig. 12 shows the scatters of with exposure time in different saturations of the soda residue foundation.
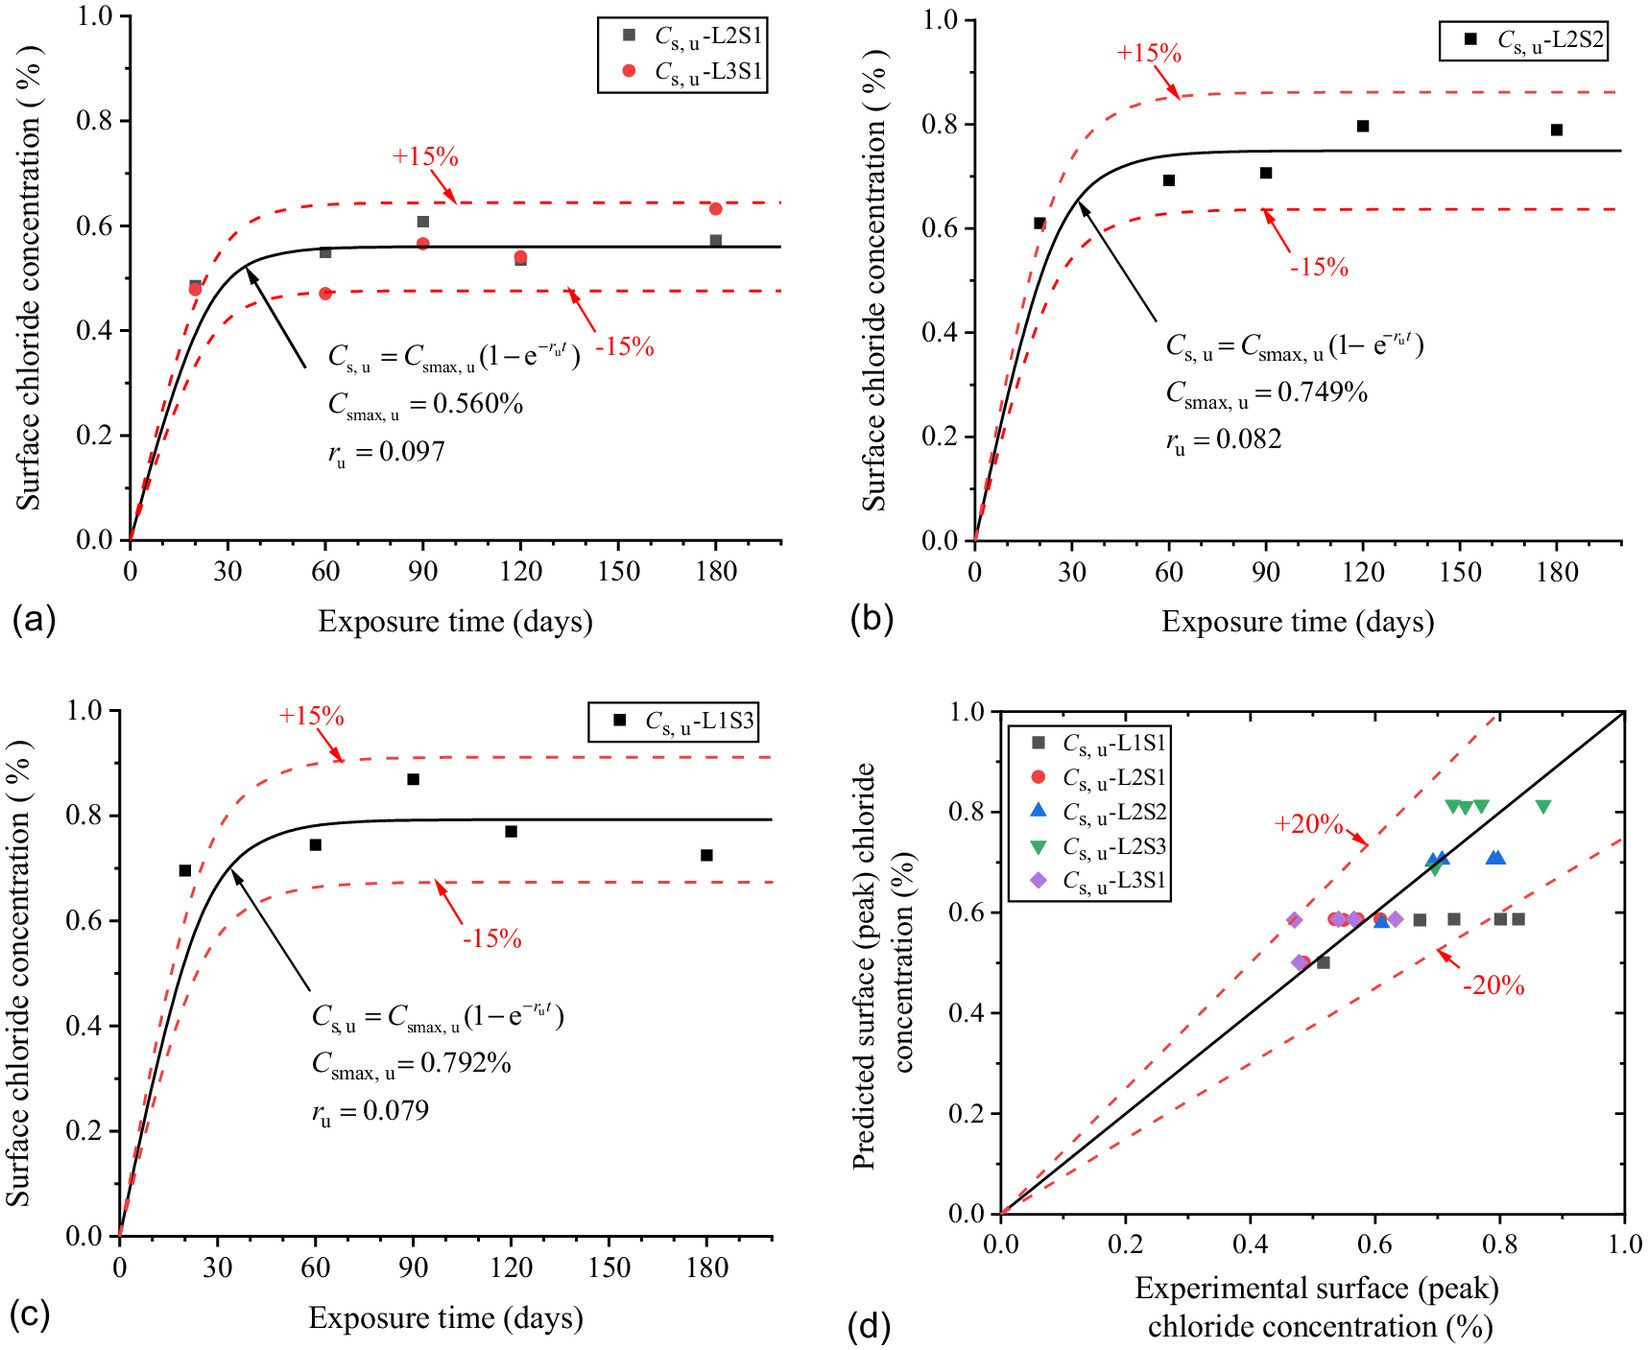
As shown in Fig. 12(a), the of the concrete above the groundwater has little correlation with that at the groundwater level. Thus, the parameters of of , and would be fitted with the saturations of the soda residue foundation. The scatters of were brought into Eq. (4), and and at different saturations of the soda residue soil were fitted. As shown in Fig. 13, and increase and decrease with these saturations, showing a distinct linear relationship. The linear function can better describe the change rule between and as Eq. (8). The predicted results of Eq. (8) are in good correspondence with the fitted scatter of Eq. (3) as shown in Fig. 12(d), which proves that Eq. (8) is reasonable
(8)
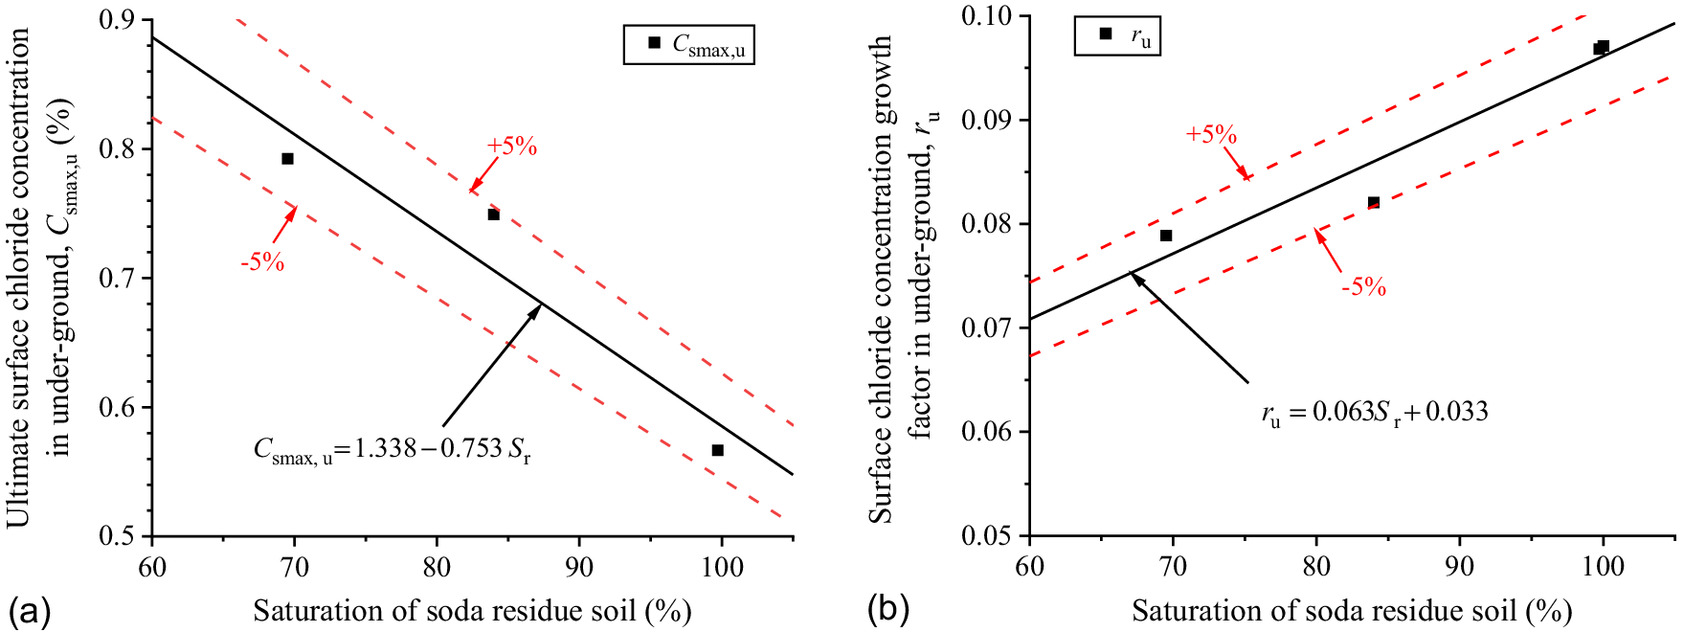
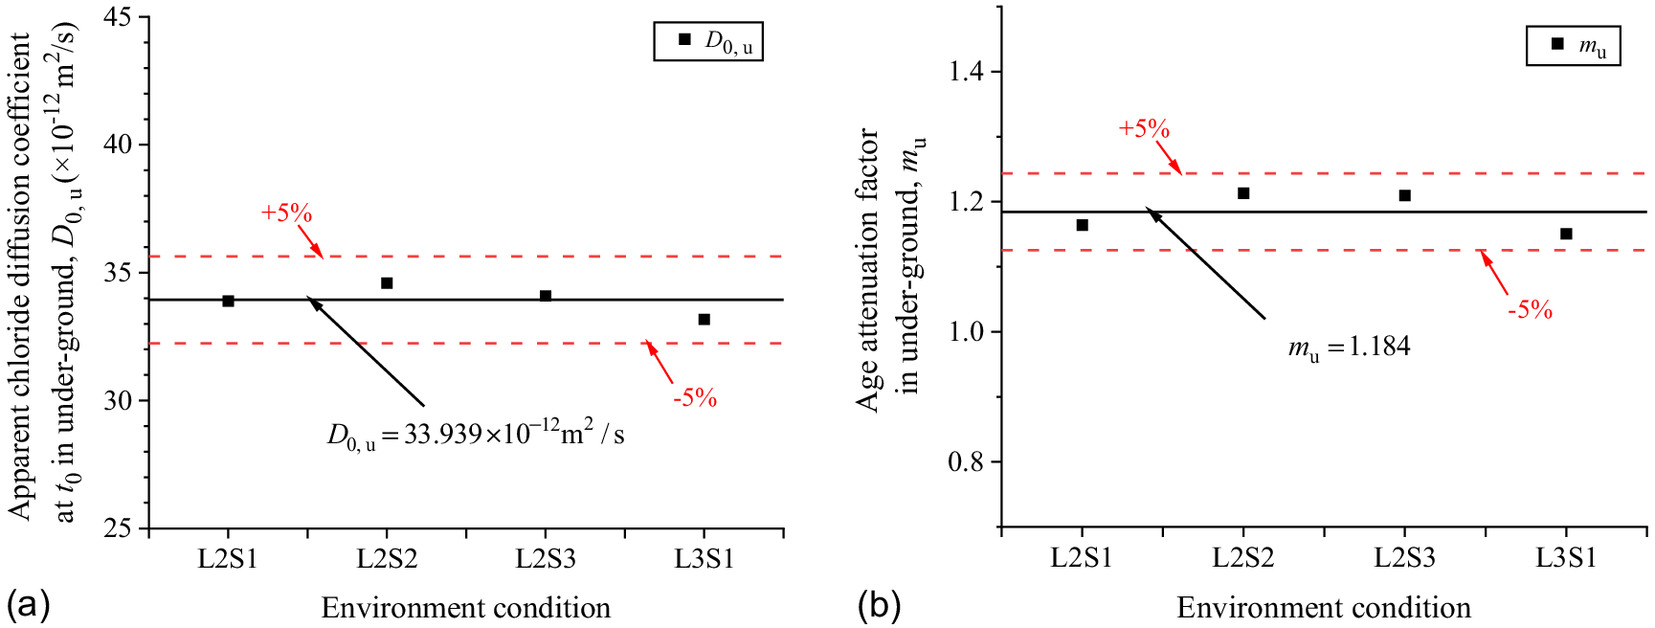
The chloride diffusion coefficient of the concrete is the nature of the concrete itself, which depends on pore distribution, saturation, and chloride binding capacity. The same batch of concrete prepared with the same mix proportions was used in the exposed specimens, so it can be considered that the concrete pore distribution and chloride ion binding capacity are consistent with each other. Additionally, the specimens are in a stable saturated state below ground, so it can be speculated that the diffusion coefficient of the concrete has nothing to do with saturation of the soda residue soil or the groundwater level.
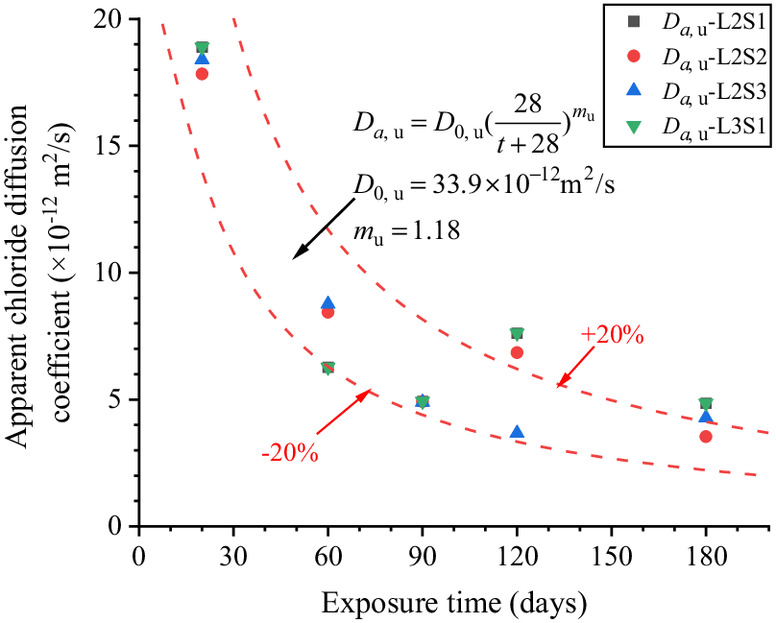
Fig. 14 shows the scatters of with exposure time in different the saturations of soda residue foundation. The scatters were brought into Eq. (6), and , , and at different saturations of soda residue soil were fitted as shown in Fig. 15. , , and are constants as the average value of and 1.184, respectively, which proves that the above speculation is reasonable. The predicted results of Eq. (9) are in good correspondence with the fitted scatter of Eq. (3) as shown in Fig. 14, which proves that Eq. (9) is reasonable
(9)
Above Ground
Although the above-ground part of the concrete is unsaturated due to the stability of RH in the above-ground environment, the concrete’s internal saturation tends to be stable after the evaporation and convection are balanced. The chloride transport in it can be approximately considered diffusion, and the effect of concrete saturation on diffusion can be shown in the decrease in the apparent chloride diffusion coefficient with the decrease in RH. The chloride concentration scatters of the specimens in Figs. 6(b) and 8(b) were brought into Eq. (3), and and at different exposure time were fitted as shown in Figs. 16(a) and 18(a–c).
As shown in Fig. 16, the of the concrete above ground has a correlation with RH above ground and the saturation of the soda residue soil. Thus, the new expression based on Eq. (4) is proposed as Eq. (10). The parameters of of and are fitted with RH above ground as shown in Figs. 17(a and b). The factors of and of and are fitted with saturation of the soda residue soil as shown in Figs. 17(c and d)where (RH) = ultimate surface chloride concentration (%) with RH above ground; (RH) = surface chloride concentration growth factor with RH above ground; = ultimate surface chloride concentration saturation factor with saturation of the soda residue soil, equal to 1 while the concrete is saturated; and = surface chloride concentration growth rate saturation effect factor with saturation of the soda residue soil, equal to 1 while the concrete is saturated.
(10)
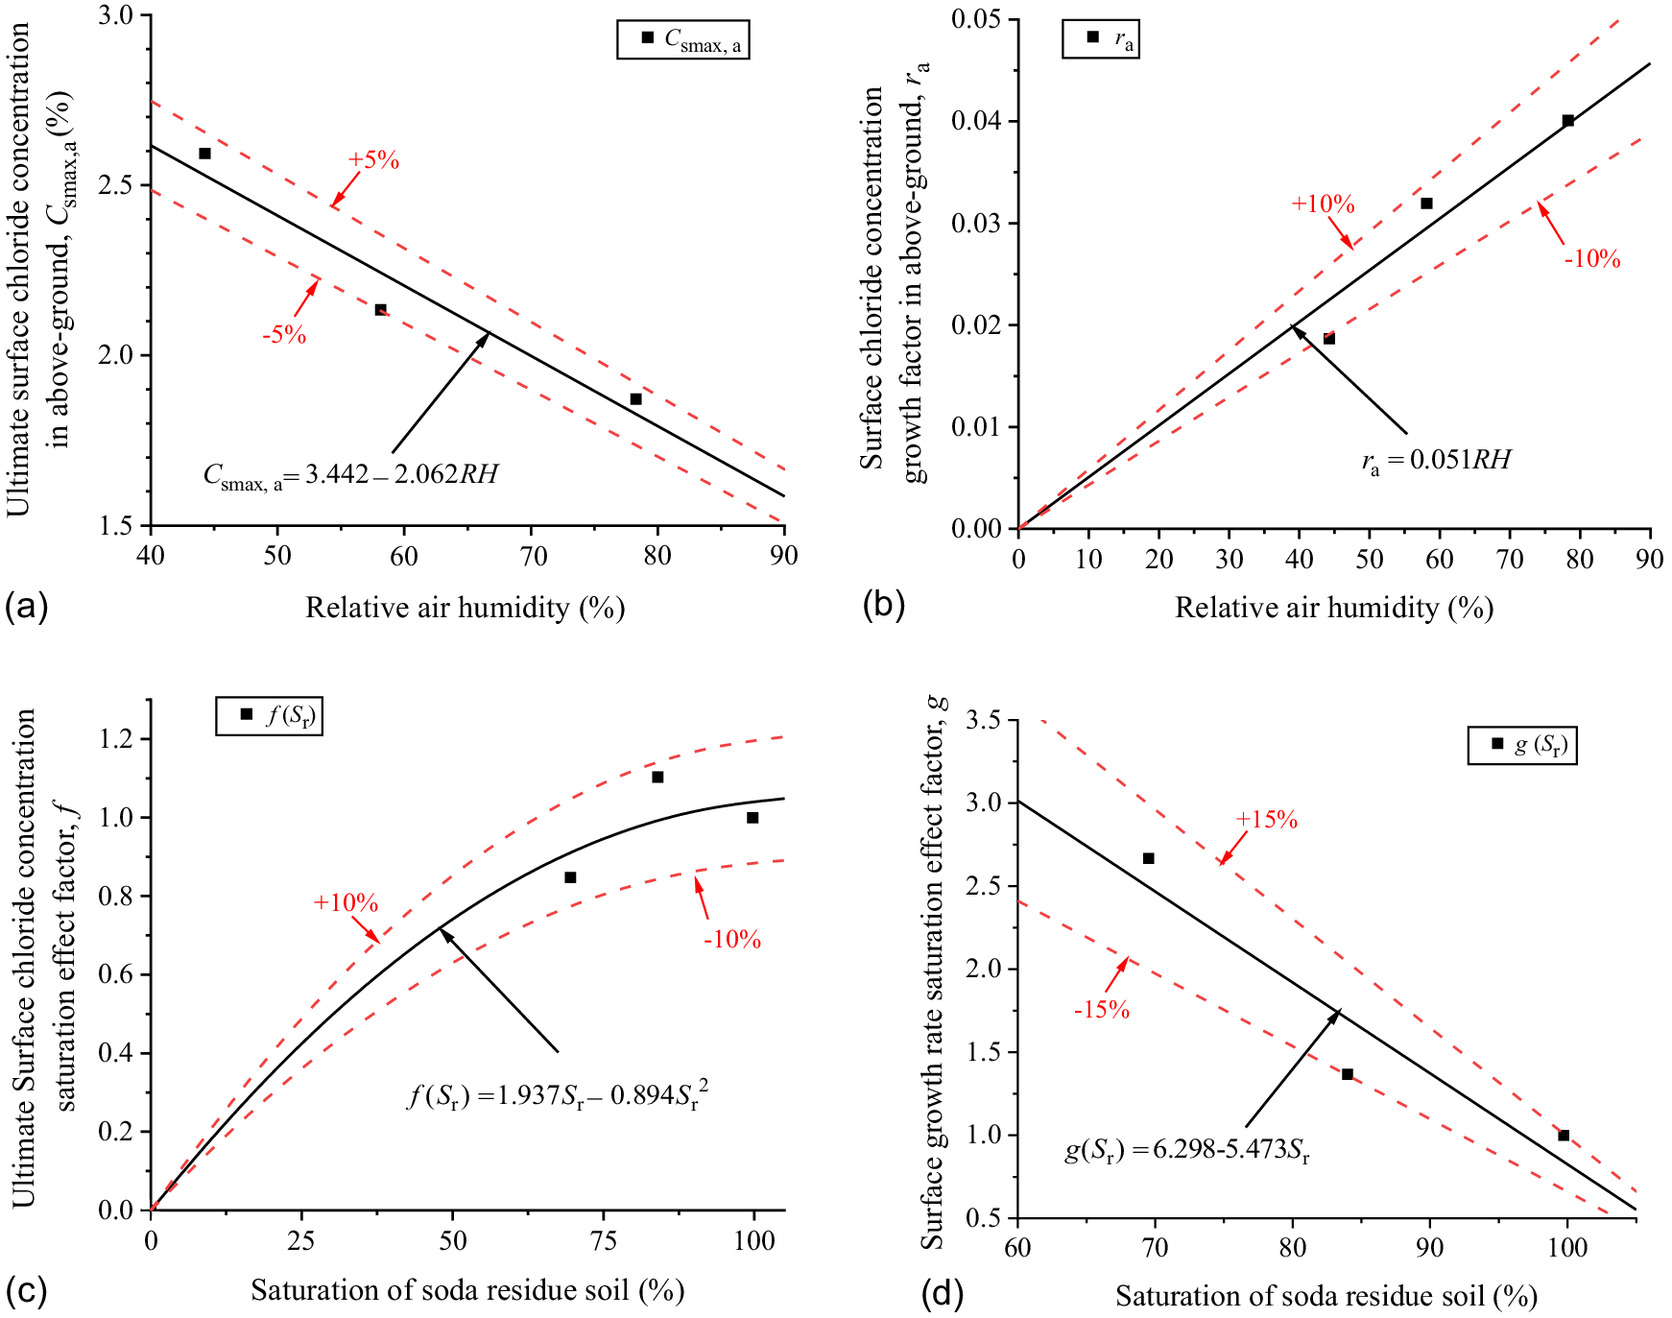

As shown in Fig. 17, and decrease and increase with RH above ground, respectively, showing a distinct linear relationship. The linear function can better describe the change rule between them as Eq. (11). Note that when RH = 0, which means that when RH = 0, the concrete is in an absolute dry state and cannot increase with time; increases with saturation of the soda residue soil by a quadratic function, so when saturation = 0, the soil has no water to act as the transmission medium from soil to concrete, , and the resulting ; decreases with saturation of the soda residue soil by a linear function. The predicted results of Eq. (11) are in good correspondence with the fitted scatter of Eq. (3) as shown in Fig. 16(b), which proves that Eq. (11) is reasonable
(11)
As shown in Fig. 18, the of the concrete above ground correlates with RH above ground. Thus, the new expression based on Eq. (6) is proposed as Eq. (12). The parameters , and are fitted with RH above ground as shown in Fig. 22where = age attenuation factor of the concrete with RH above ground.
(12)
As shown in Fig. 19, is a constant as the average value of ; increases with RH above ground, showing a distinct linear relationship. The linear function can better describe the change rule between them as Eq. (13). The predicted results of Eq. (13) are in good correspondence with the fitted scatter of Eq. (3) as shown in Fig. 21(d), which proves that Eq. (13) is reasonable
(13)
Precipitation Environment
In the precipitation environment, chloride concentration in the concrete below ground is low as shown in Figs. 7(a) and 8(a). Because of the drop in chloride concentration by precipitation and the uniform chloride distribution rule along the elevation of the specimen as shown in Fig. 10(b), it can be deduced that when the critical concentration contour line in the above-ground part of the concrete moves inward to the front of the steel bar, the critical concentration contour line in the below-ground part is still far from the front of the steel bar. Based on this, the chloride concentration in the above-ground part is focused and a time-varying prediction model is established in this study.
During the spraying process, saturation of the soda residue soil and RH above ground change with precipitation because they are not stable constants. However, the soda residue foundation still maintains a stable soil structure, which can be verified by the porosity in Table 3. Therefore, in order to unify the prediction model of precipitation and nonprecipitation, the saturation of the soda residue soil with the same foundation soil structure in the nonprecipitation environment could be used to fit parameters in the precipitation environment, so as to more easily and effectively reflect the influence of precipitation on chloride transport in the concrete.
The new expression based on Eqs. (10) and (12) are proposed as Eq. (14). The parameters , , , and are fitted with saturation of the soda residue soil as shown in Fig. 20where = precipitation effect factor of the ultimate surface chloride concentration (%) with saturation of the soda residue soil, equal to 1 while saturation of the soda residue soil = 0 reason from that the same as 0 in the precipitation and nonprecipitation environments while the soil has no water to carry the chloride into the concrete; and and = precipitation effect factor of the reference apparent chloride diffusion coefficient and the age attenuation factor, respectively.
(14)
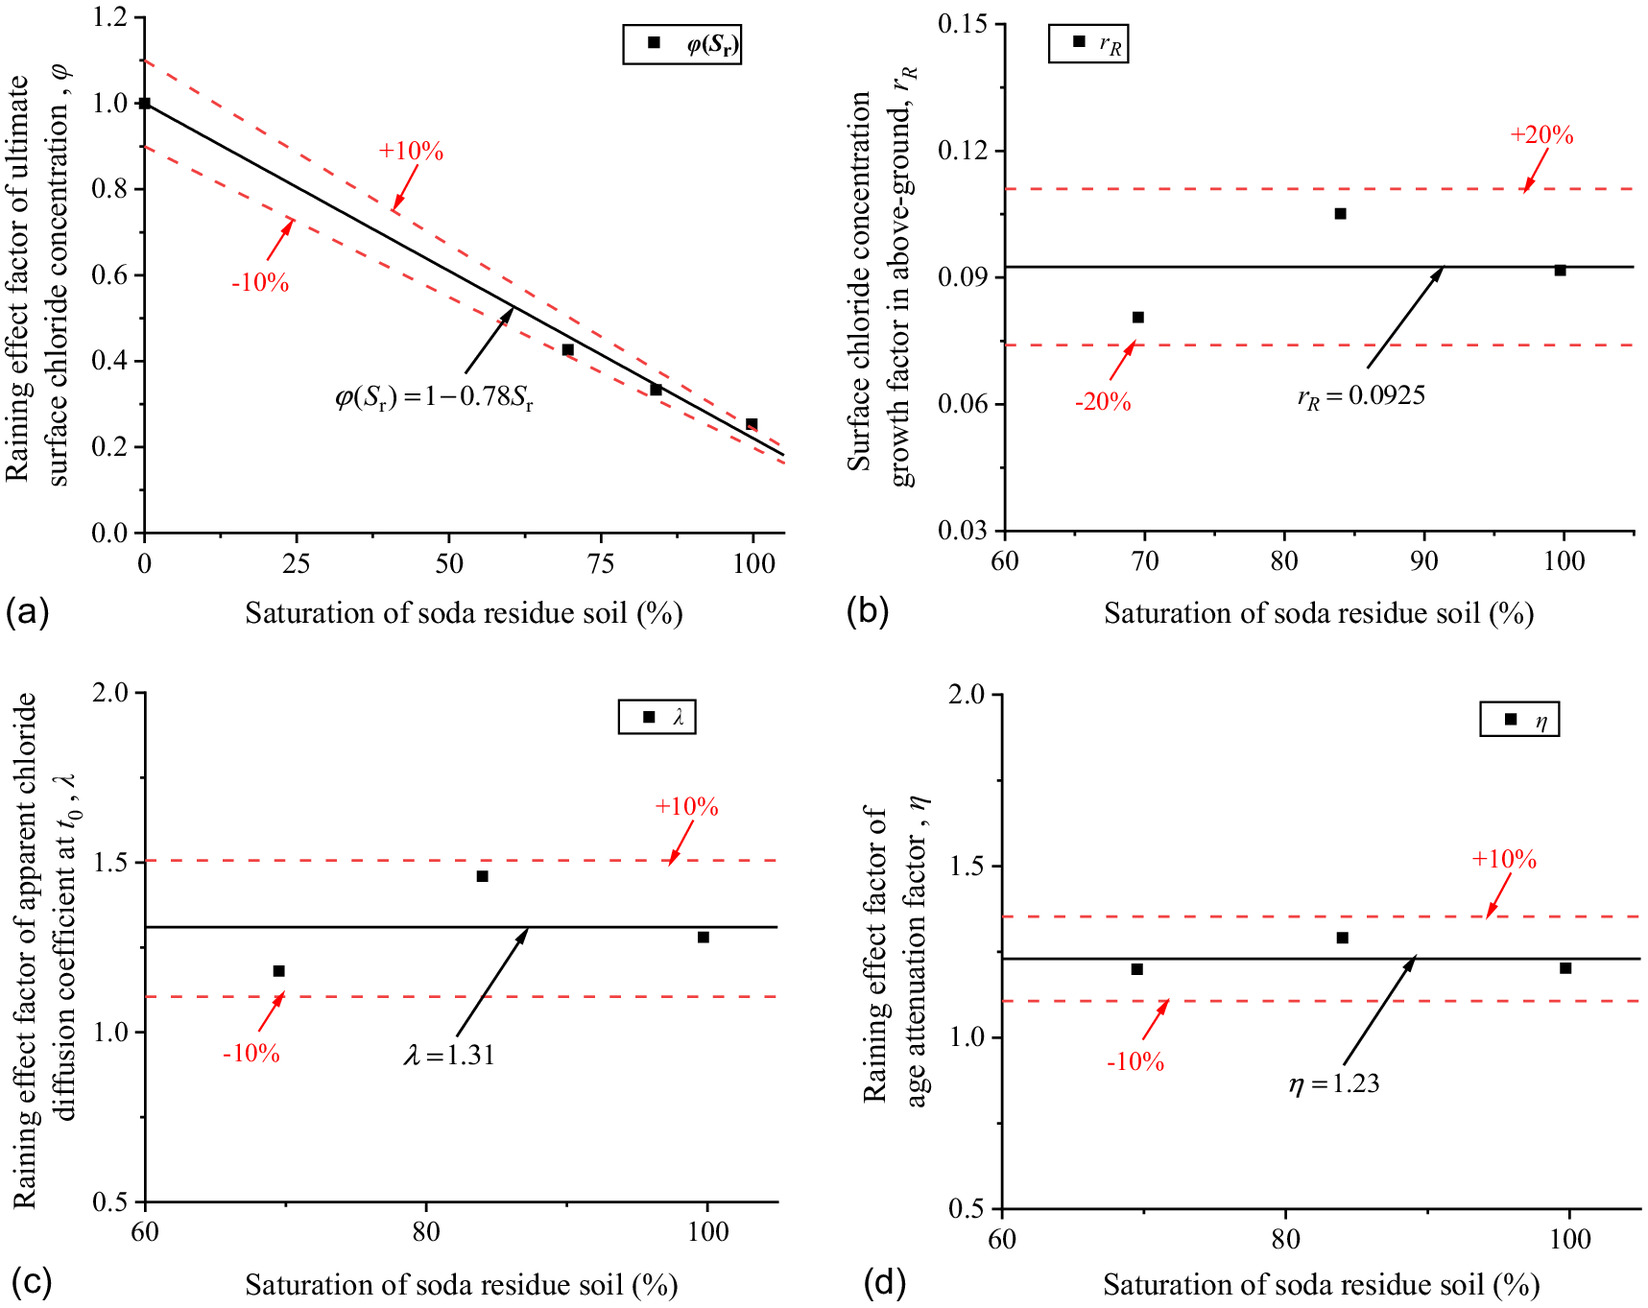
As shown in Fig. 20, decreases with saturation of the soda residue soil by a linear relationship and , , and are constants with average values of 0.092, 1.31, and 1.23, respectively. The predicted results of Eq. (15) are in good correspondence with the fitted scatter of Eq. (3) as shown in Fig. 21, which proves that Eq. (15) is reasonable
(15)
Time-Dependent Prediction Empirical Model of Concrete Chloride Concentration
In combination with Eqs. (3), (5), (7)–(9), (11), and (15), the time-dependent prediction empirical model of concrete chloride concentration in the soda residue foundation environment is established as Eq. (16)
(16)
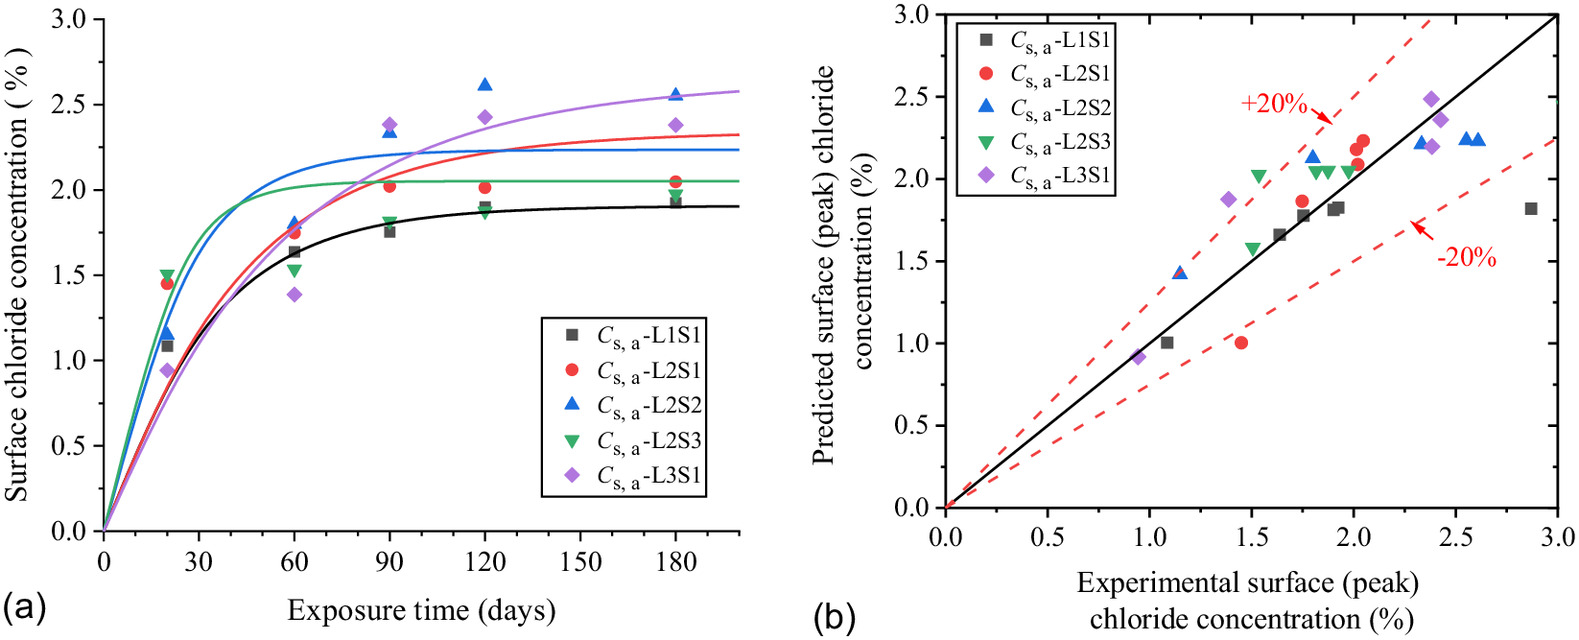
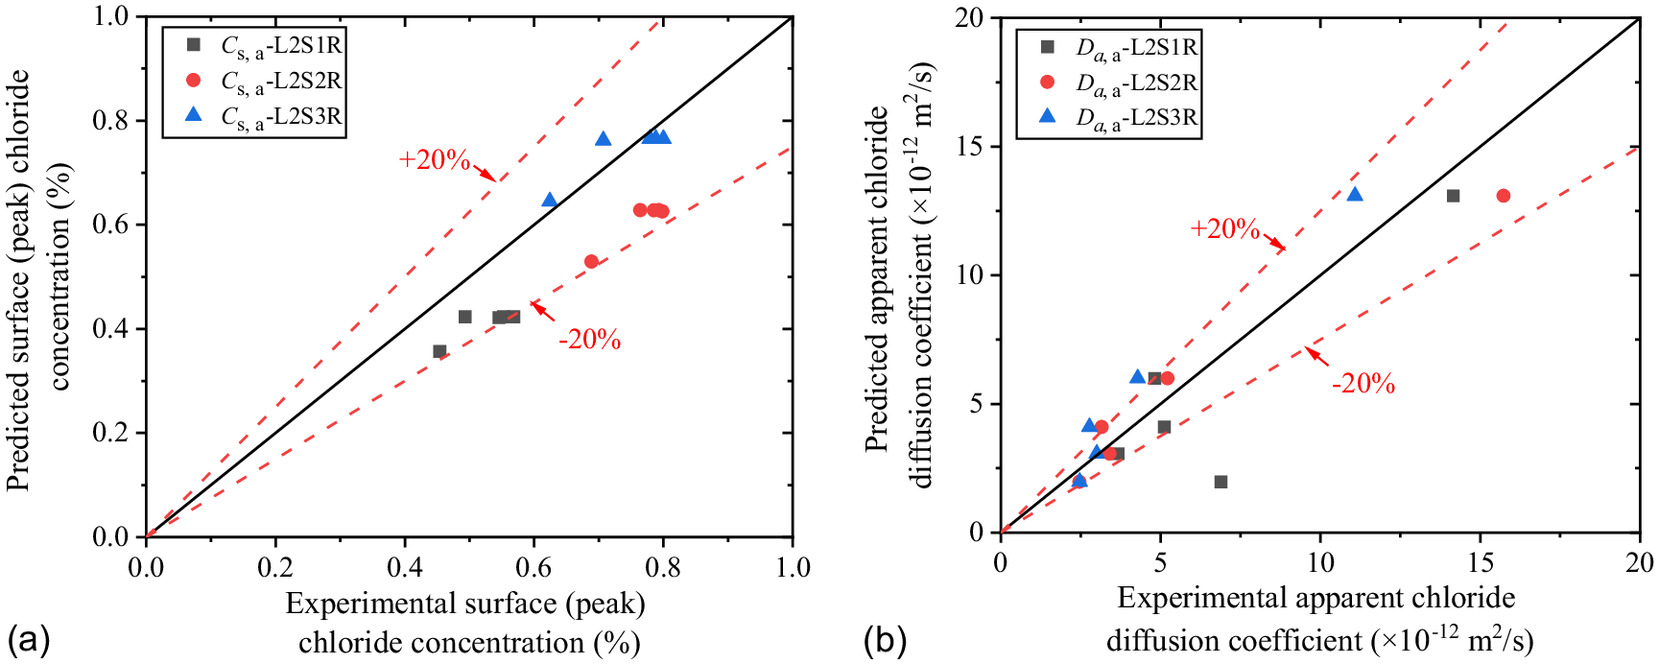
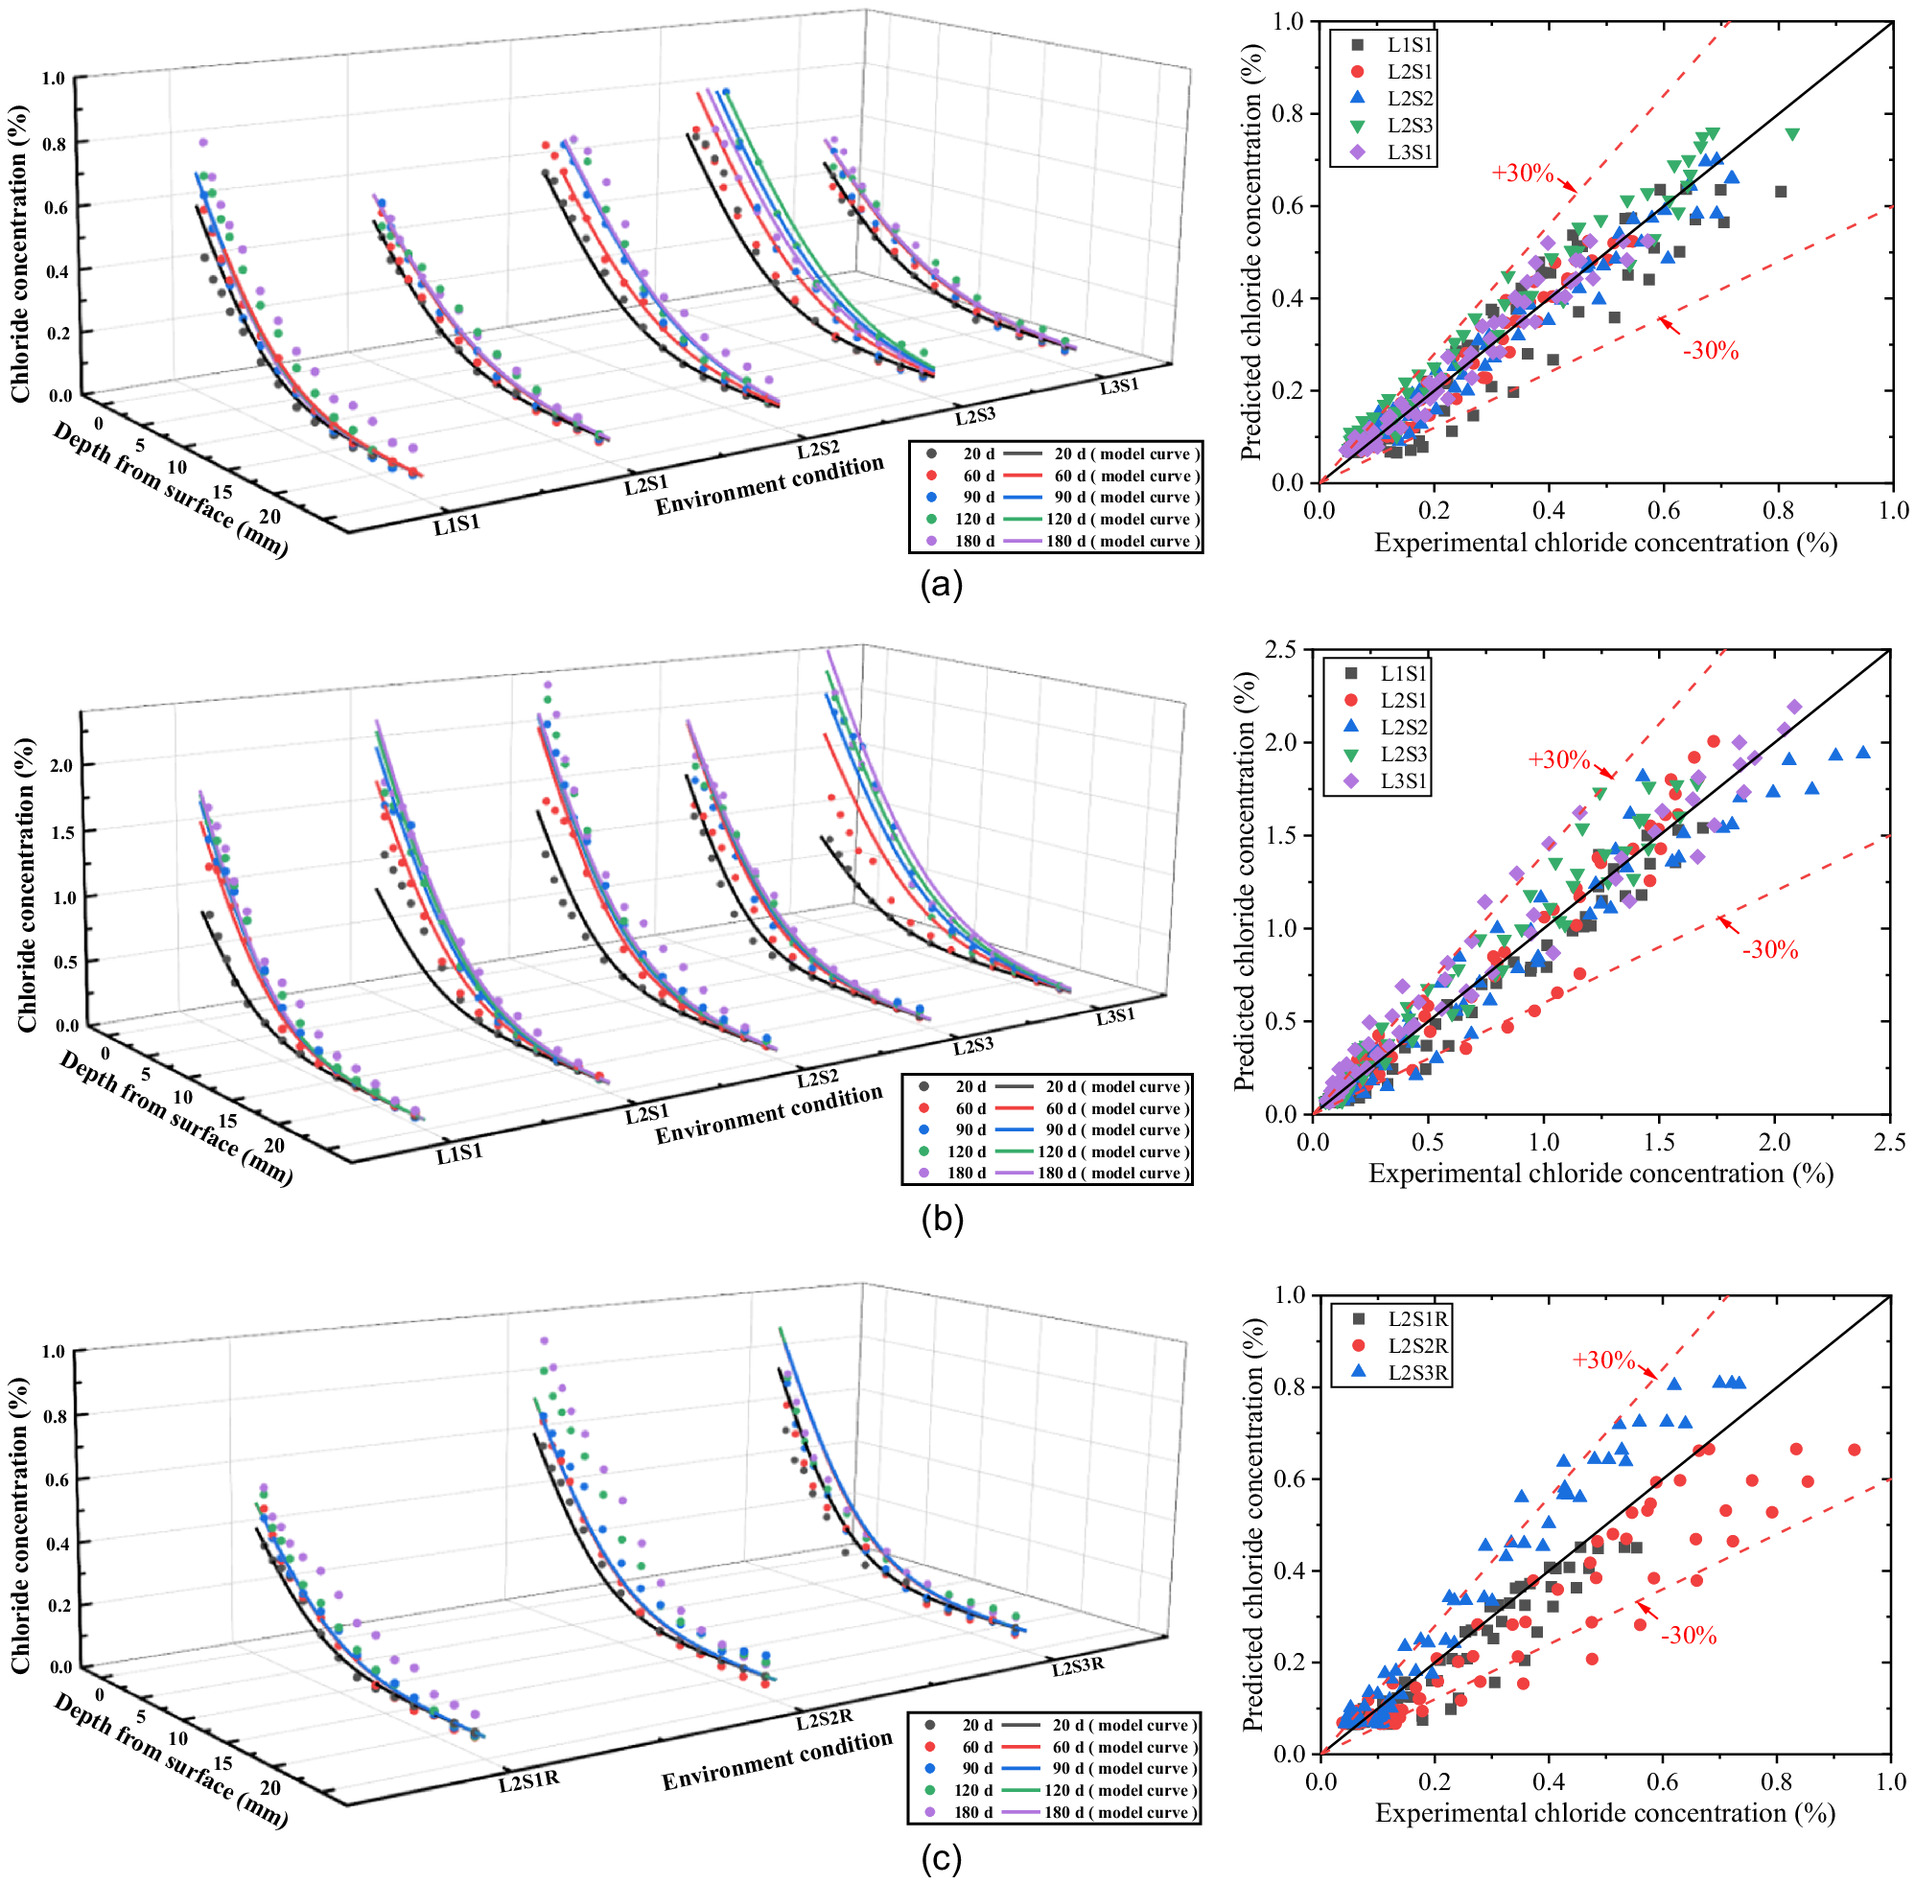
Up to the present, the time-dependent prediction empirical model of concrete chloride concentration in a soda residue foundation environment has been based on experimental data, which can be expressed as Eq. (16). The comparison and the relative error between the experimental value and the empirical value in the below-ground and above-ground parts of the concrete and in the precipitation environment are illustrated in Fig. 22.
As can be seen in Fig. 22, this predictive model fits well with the experimental data. The percentage error between them almost does not exceed . Therefore, the proposed model can effectively reflect the chloride transport rule of the concrete specimens exposed to the soda residue foundation environment. In other words, this model can be used to predict the chloride profiles of concrete in soda residue foundation engineering.
Conclusions
In this paper, a concrete indoor natural exposure experiment in a soda residue soil environment was conducted using the foundation environment simulation device to investigate the effects of water environmental factors—groundwater level of the foundation, saturation of the foundation, RH above ground, and precipitation environment—on chloride transport between foundation and concrete. The time-dependent prediction empirical model of concrete chloride concentration in a soda residue foundation environment was established by introducing water environmental parameters. The following conclusions can be drawn:
•
All specimens have similar regular about chloride concentration distribution along the elevation direction, in which chloride ions are enriched from the ground level to a height of 100 mm in the above-ground part of the concrete, while they are evenly distributed along the elevation in the below-ground part.
•
Pore water in a cycle of three water states—soil pore water, concrete pore water, and water vapor—due to the balance of evaporation and hydraulic gradient force, is the provenance of chloride ion transport and accumulates in the above-ground part of the concrete. This is essentially consistent with the convection action in dry-wet cycles.
•
The influence of water environmental factors on chloride transport in concrete can be summarized as two aspects of the boundary condition: surface chloride concentration and concrete saturation. In the below-ground part of the concrete, saturation of the soda residue soil and the groundwater level change the surface chloride concentration in the concrete by convection action and by changing the solid-liquid contact area. In the above-ground part of the concrete, the coupled action of saturation of the soda residue soil and RH changes the surface chloride concentration of the concrete. RH also affects chloride transport by influencing saturation and hydration rates.
•
Precipitation can effectively reduce the invasion of chloride into concrete under a soda residue foundation, with the total invasion of chloride decreasing from 9 to 3 g in 120 and 180 days compared with that in the nonprecipitation environment. Therefore, leaching desalination of the soda residue soil is the most effective and simplest way to prevent chloride ion erosion damage to reinforced concrete structures built on a soda residue foundation.
•
The time-dependent prediction empirical model of concrete chloride concentration in a soda residue foundation environment is based on Fick’s second law. Further validation showed that the predicted results agree well with the experimental data and that the relative error between them almost does not exceed . This model can be used to predict the chloride profiles of concrete in soda residue foundation engineering by the limpid parameters of groundwater level of the foundation, saturation of the foundation, and RH above ground.
Data Availability Statement
All data, models, and code generated or used during the study appear in the published article.
Acknowledgments
We are grateful for the financial support from the National Natural Science Foundation of China (51979191) and the Tianjin Port Science And Technology Plan Project (2020-165).
References
Al-alaily, H. S., and A. A. A. Hassan. 2018. “A study on the effect of curing temperature and duration on rebar corrosion.” Mag. Concr. Res. 70 (5): 260–270. https://doi.org/10.1680/jmacr.17.00080.
Chen, J. 2016. “Application experiment study on composition design of industrial waste alkaline residue stabilized material.” M.S. thesis, College of Transportation and Civil Engineering, Shandong Jiaotong Univ.
Chen, S. Q., and W. Q. Zhuang. 2016. Geotechnical engineering investigation report of Tianjin Port North Harbor Road, New Harbor No. 7 Road, Jiyun No. 4 road and North Harbor West Road. Tianjin, China: Tianjin Beiyang Water Conservancy Survey and Design Institute.
Chen, T. 2019. “Experimental study on mechanical properties and long-term deformation of soda residue soil under complex stress conditions.” M.S. thesis, School of Civil Engineering, Tianjin Univ.
Costa, A., and J. Appleton. 1999. “Chloride penetration into concrete in marine environment—Part II: Prediction of long-term chloride penetration.” Mater. Struct. 32 (5): 354–359. https://doi.org/10.1007/BF02479627.
Fang, Y. G., and M. Xu. 2006. “Experimental investigation into draining consolidation behavior of soda residue soil under vacuum preloading-electro-osmosis.” J. South China Univ. Technol. 34 (11): 70–75.
Fang, Y. G., and Z. W. Zhu. 2008. “Experimental research on draining consolidation behavior of soda residue soil under vibration.” Rock Soil Mech. 29 (1): 43–47.
Guo, H. Y. 2005. “Trial study on bearing capacity properties of the soda residue with high water content.” M.S. thesis, Tianjin Univ.
Han, J. C. 2012. “Study on the durability of partially-exposed concrete in saline soil areas of Qinghai Province.” Ph.D. thesis, School of Civil Engineering, Chang’an Univ.
Hou, J. F. 2004. “Study of the soda residue replacing the engineering soil.” Ph.D. thesis, College of Civil Engineering, Tianjin Univ.
Hu, Q., and J. Q. Jia. 2020. “Experimental study on mechanical properties of interface between sulphate saline soil and concrete under freezing condition.” J. China Three Gorges Univ. 42 (6): 50–55.
Ivushkin, K., and H. Bartholomeus. 2017. “Global mapping of soil salinity change.” Remote Sens. Environ. 231 (Sep): 111260. https://doi.org/10.1016/j.rse.2019.111260.
Kassir, M. K., and M. Ghosn. 2002. “Chloride-induced corrosion of reinforced concrete bridge decks.” Cem. Concr. Res. 32 (1): 139–143. https://doi.org/10.1016/S0008-8846(01)00644-5.
Lei, C. S. 2010. “Study on the technique of removing the #3 soda residue storage yard and improving the soda residue.” M.S. thesis, School of Civil Engineering, Tianjin Univ.
Li, C., and D. Y. Liu. 2010. “Characteristics of precipitation and precipitation days from 1958 to 2007 in Tianjin.” J. Meteorolog. Environ. 26 (4): 8–11.
Liang, S. C. 2016. “Prevention and treatment of concrete root rot in water conservancy projects.” Jiangxi Build. Mater. 186 (9): 108–109.
Lu, C. G., and Z. Q. Wei. 2021. “Research on damage deterioration and size effect of reinforced concrete in saline soil powered-on environment.” Mater. Rep. 35 (16): 16042–16049.
MCPRC (Ministry of Communications of the People’s Republic of China). 2011. Specification for mix proportion design of ordinary concrete. JGJ 55-2011. Beijing: MCPRC.
Qiao, D., and W. J. Xia. 2010. “Durability of concrete in saline soil in Lianyungang.” Chin. J. Geotech. Eng. 32 (2): 611–614.
Song, H., and C. Lee. 2008. “Factors influencing chloride transport in concrete structures exposed to marine environments.” Cem. Concr. Compos. 30 (2): 113–121. https://doi.org/10.1016/j.cemconcomp.2007.09.005.
Su, X. P. 2012. “Research on the concrete durability due to salinized soil in the western region of Jilin Province.” Ph.D. thesis, College of Construction Engineering, Jilin Univ.
Su, X. P., and Q. Wang. 2012. “Comparing experimental study on the concrete performance under the condition of the salt corrosion and dry-wet cycles.” J. Changchun Inst. Technol. 13 (2): 1–4.
Su, X. P., and Q. Wang. 2013. “Experiment of the concrete performance the condition of multiple salts and dry-wet cycles.” J. Jilin Univ. 43 (3): 851–857.
Tao, L. 2016. “Experimental study on reinforcement technology of high water content and large thickness soda residue foundation.” M.S. thesis, School of Civil Engineering, Tianjin Univ.
Thomas, M. D. A., and P. B. Bamforth. 1999. “Modelling chloride diffusion in concrete: Effect of fly ash and slag.” Cem. Concr. Res. 29 (4): 487–495. https://doi.org/10.1016/S0008-8846(98)00192-6.
Tian, X. W., and X. Z. Li. 2009. “Research on engineering utilization of soda residue soil in Tangshan.” Build. Sci. 25 (7): 77–79.
Wang, C. P., and J. L. Zhang. 2021. “Field exposure test of reinforced concrete short columns in saline soil area based on three-parameter Weibull function.” J. Water Resour. Archit. Eng. 19 (5): 118–123.
Wang, F., and Q. Z. Xu. 2007. “Study on test methods and geotechnical properties of soda residue.” Chin. J. Geotech. Eng. 29 (8): 1211–1214.
Wang, X. G. 2021. “Research on microstructure and engineering characteristics of alar saline soil in southern Xinjiang.” Ph.D. thesis, College of Civil Engineering and Architecture, Zhejiang Univ.
Wang, Y. Z., and X. L. Gong. 2019. “Prediction model of chloride diffusion in concrete considering the coupling effects of coarse aggregate and steel reinforcement exposed to marine tidal environment.” Constr. Build. Mater. 216 (Aug): 40–57. https://doi.org/10.1016/j.conbuildmat.2019.04.221.
Wang, Y. Z., and S. Guo. 2022. “Experimental and analytical investigation on chloride ions transport in concrete considering the effect of dry-exposure ratio under diurnal tidal environment.” Constr. Build. Mater. 328 (Apr): 127138. https://doi.org/10.1016/j.conbuildmat.2022.127138.
Wang, Y. Z., and L. J. Wu. 2018a. “Effects of coarse aggregates on chloride diffusion coefficients of concrete and interfacial transition zone under experimental drying-wetting cycles.” Constr. Build. Mater. 185 (Oct): 230–245.
Wang, Y. Z., and L. J. Wu. 2018b. “Prediction model of long-term chloride diffusion into plain concrete considering the effect of the heterogeneity of materials exposed to marine tidal zone.” Constr. Build. Mater. 159 (Jun): 297–315. https://doi.org/10.1016/j.conbuildmat.2017.10.083.
Xie, T., and C. K. Yuan. 2020. “Experimental research on physical and mechanical properties and dynamic strength of soda residue.” J. Waterway Harbor 41 (6): 707–712.
Yan, C. 2008. “Research on method of synthesis environment estimation and mechanism of strength for pure alkali residue.” Ph.D. thesis, School of Civil Engineering, Tianjin Univ.
Yan, S. W., and X. Z. Meng. 2002. “Study on engineering performance of alkaline residue soil.” Rock Eng. Field 5 (Jul): 25–28.
Zhang, H. L., and Y. F. Zhu. 2015. “Study of the durability of partially-exposed concrete in chloride saline soil areas of Qinghai Province.” J. Hefei Univ. Technol. 38 (6): 804–809.
Zhang, X. Y. 2020. “Research on anti-corrosion performance and mechanism of concrete in saline soil environment.” M.S. thesis, School of Civil Engineering, Taiyuan Univ.
Information & Authors
Information
Published In

Journal of Materials in Civil Engineering
Volume 35 • Issue 12 • December 2023
Copyright
This work is made available under the terms of the Creative Commons Attribution 4.0 International license, https://creativecommons.org/licenses/by/4.0/.
History
Received: Aug 24, 2022
Accepted: Apr 4, 2023
Published online: Sep 19, 2023
Published in print: Dec 1, 2023
Discussion open until: Feb 19, 2024
Authors
Metrics & Citations
Metrics
Citations
Download citation
If you have the appropriate software installed, you can download article citation data to the citation manager of your choice. Simply select your manager software from the list below and click Download.