Degradation Mechanism of the Wood-Cell Wall Surface in a Cement Environment Measured by Atomic Force Microscopy
Publication: Journal of Materials in Civil Engineering
Volume 35, Issue 7
Abstract
Lignocellulosic materials in an alkaline cement environment can be subjected to degradation that always starts from the surface. Atomic force microscopy has been used to establish the changes of surface properties of wood-cell walls. We measured the topographies and adhesion force curves of wood-cell wall surfaces before and after treatments in cement alkaline solutions ranging from 0.5 to 1,104 h at 20°C and 50°C and compared them with untreated controls. We studied the degradation of the cell wall surfaces chemically (dissolution of extractives and degradation of the hemicelluloses-lignin matrix), structurally (changes in surface modulus and deformation), and topographically (looking at the change in cell wall surface). The adhesion forces and jump-off force ratios shifted along two sigmoidal curves and showed a transition phase based on the treatment times. In this article, we analyzed and explained how the cutting and surface heterogeneity affects the atomic force microscopy measurements, and how the temperature rise due to the cement hydration heat could accelerate the surface degradation.
Practical Applications
The article addresses the combination of concrete with plant-based materials, specifically wood. The alkaline environment and hydration temperatures appear to dissolve fundamental buildings blocks of wood used either as a natural aggregate (wood particles in concrete) or when solid wood structural elements are combined with concrete (such wood-concrete composite decks). This is fundamental research that has, in our view, significant implications for using any plant-based fibers or solid wood in combination with concrete in structures where chemical degradation that is accelerated by hydration process must be considered. Whether or not this degradation has an effect on the performance (say stiffness or capacity) of a structural element will require investigation at the element level. Our experiments at the nanoscale level showed, however, that a degradation of interface between concrete and wood is to be expected and that such investigations may be warranted.
Introduction
The combination of lignocellulosic materials with cement as a building material has been used since the early twentieth century and is gaining more importance due to the environmental and economic issues (Brahmia et al. 2020; Frybort et al. 2008; Karade 2010). However, lignocellulosic materials can degrade in the alkaline environment of cement paste, and the mechanical strengths of the material decrease with time (Gram 1983).
Several studies proposed the degradation mechanisms: the mineralization of cement hydration products (mainly ) on fiber surfaces and in lumens, dissolution of hemicelluloses and lignin, and failure of cellulose aggregate (Melo Filho et al. 2013; Stapper et al. 2021; Wei 2018; Wei and Meyer 2015). However, the effects of degradation kinetics on the immediate and the short-term degradation are missing (Stapper et al. 2021; Wei 2018), namely how and when the degradation starts in the nanoscale and how the degradation proceeds.
We assumed that the degradation starts from the immediate mixing of lignocellulosic materials with cement paste, through the cement hydration process under the effect of hydration heat, and to the long-term service life in the cement pore water. The cement hydration heat can cause the temperature to rise to 40°C–80°C, and this can last several days (Do 2013; Mardmomen 2020). We hypothesized that the temporal temperature rise in the alkaline environment can accelerate the degradation of lignocellulosic materials.
In the cement alkaline environment, the degradation starts from the surface. Lignocellulosic materials absorb and infiltrate alkaline solutions from the surface to the inside of cell walls (Melo Filho et al. 2013; Sedan et al. 2007; Wei 2018). We use wood to represent the lignocellulosic materials and are interested in the nanoscale level of wood-cell walls: how the chemical components and structural strength of cell wall surfaces degrade immediately and how the degradation proceeds in the alkaline cement environment with time.
Atomic force microscopy (AFM) provides a nanoscale resolution in the imaging, mechanical, thermal, electrical, and magnetic measurements of materials in the natural state (West 2007). The application of AFM on wood-cell walls succeeds in imaging cell wall fine structures, e.g., cellulose aggregates (Casdorff et al. 2017; Gusenbauer et al. 2020), but the quantitative characterization, i.e., the adhesion force measurement, presents more difficulties (Frybort et al. 2014; Jin and Kasal 2016; Lagaňa et al. 2021; Mao et al. 2021; Meincken and Evans 2009), the reason being the heterogeneity of wood surfaces.
In previous studies (Li and Kasal 2021, 2022a), an easily applied repeatable relocating method with AFM on wood radial-longitudinal cell walls was proposed, and it succeeded in quantitatively measuring how the wood-cell wall degraded under thermal treatments. Sigmoidal curves were found to characterize how the adhesion forces change with treatment time. However, the effect of cutting on the radial-longitudinal wood-cell wall surfaces was not studied. The wood-cell wall can be modeled as a composite polymer where cellulose aggregates are embedded in the hemicelluloses-lignin matrix. The spatial heterogeneity in the chemical composition complicates the cutting of the surfaces: we assumed that the exposed wood-cell wall surfaces after cutting varied in terms of chemical components.
In this study, we measured the topography, adhesion forces, jump-off force ratios, surface moduli, and deformations of wood-cell wall surfaces before and after alkaline treatments for 0.5–1,104 h at 20°C and 50°C. This allowed us to (1) measure the immediate and short-term degradation of the cell wall surfaces; and (2) measure the degradation in the mixing with cement, under the effect of cement hydration heat, in the short-term service life.
We asked (1) whether the adhesion force measurements can characterize how the wood-cell surfaces start to degrade, and how the degradation proceeds with the treatment time; (2) whether the sigmoidal curves from thermal degradation of wood-cell walls can characterize the alkaline degradation of wood-cell walls; (3) whether the cutting of wood-cell walls influences the adhesion force measurements; and (4) whether the rising temperature due to cement hydration heat can accelerate the degradation of wood-cell walls.
Methods
Materials
Samples in the size of [] were cut from an air-dried Norway spruce (Picea abies) woodblock with dimensions of () (20 samples in total). We randomly chose four samples and polished the radial surfaces with a diamond knife (Histo DH4560, Diatome, Nidau, Switzerland) using a rotary microtome (HM 360, Microm, Walldorf, Germany). After cutting, the samples were stored in the desiccator (relative , and ) for 2 months to stabilize the surface. We used saturated solution () to simulate the alkaline environment in cement. In the following analysis, the term alkaline solution is used to represent the saturated solutions.
Treatments
The samples were submerged in air-tight glass jars with 300 mL solutions (). Two samples each were treated at 20°C and 50°C, respectively. The temperature of 50°C was used to simulate the temperature rise due to cement hydrations in the freshly poured concrete (Do 2013; Mardmomen 2020); The temperature of 20°C represented the normal temperature during the service life. At 20°C, the identical samples were treated for the accumulated time of 0.5, 1, 2, 4, 17, 41, 65, 144, 264, 384, 624, and 1,104 h and at 50°C for 1, 7, 48, 144, 264, and 648 h. After each treatment, the samples were washed with deionized water to remove the alkaline ions from the sample surface. Then, the samples were dried with paper tissue and stored in the desiccator (relative and ) for at least 36 h to dry the surface before each AFM measurement.
Atomic Force Microscopy Measurements
The morphology and adhesion force measurements were conducted in the contact mode in the environmental chamber using the AFM Agilent Technologies 5500 (Agilent Technologies, Santa Clara, California). The relative humidity in the chamber was maintained below 5% with a continuous blowing of nitrogen. To avoid uncontrolled wear, a silicon Multi75AL-G (BudgetSensors, Sofia, Bulgaria) tip was blunted purposely and imaged by scanning electron microscopy (SEM) [JEOL (Eching, Germany)]. The tip radius was about 50 nm. The cantilever had a deflection sensitivity of and a force constant of . The same tip was used throughout the entire experiment. Regular checks for potential tip damage were conducted by scanning standard silicon surface and a wood control sample. The tip did not show changes during the measurements.
On each cell wall surface, an image was measured on a rectangular area (about ) using the contact mode () to obtain the morphology; then, 128 force-displacement curves (eight curves each line, 16 lines in total) were measured using the force volume mode. Four cell walls on each sample were measured. Adhesion forces and jump-force ratios were extracted from the retract curve in each force-displacement curve (Fig. 1). Detailed explanations have been given by Li and Kasal (2022a).
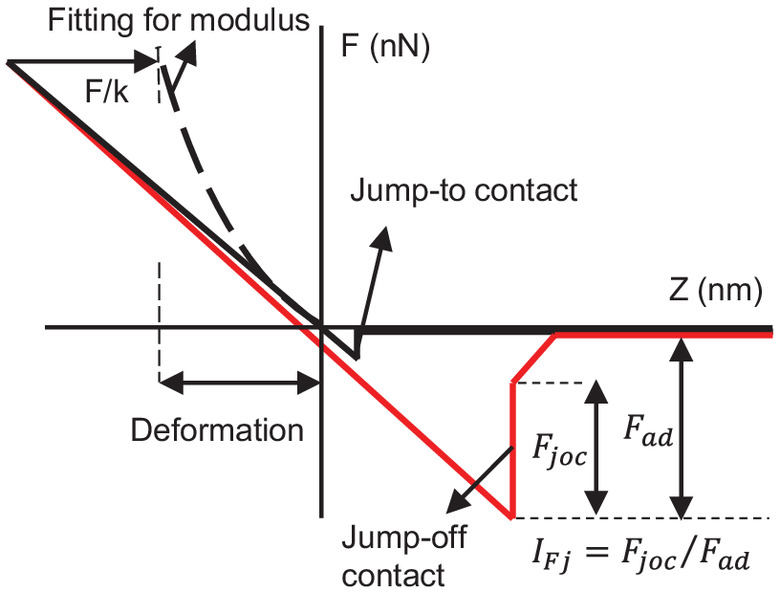
The local surface modulus was calculated using the Hertz model (Hertz 1881) under a peak force of 200 nN from the approach curve in the force-displacement curve (solid curve in Fig. 1). In the approach curve, the adhesion forces () were much smaller than the applied load (200 nN): Therefore, the adhesion forces were neglected. The equations are as follows:where = applied load on the sample surface and here was set as 200 nN; = radius of the tip curvature and here was set as 50 nm (Fig. 2); = sample–tip separation distance; and , , , and , = moduli and Poisson’s ratios of the sample and the tip, where of the silicon tip is about 100 GPa and is much larger than the of the wood surface, so the latter part in Eq. (2) can usually be ignored. The deformation is the displacement of the tip under the applied load (200 nN) after contact with the surface.
(1)
(2)
Repeatability of the Measurements
The identical samples were measured before and after each treatment throughout the experiments. The repositioning method was applied to locate the same cell wall sections (Li and Kasal 2021).
Data Processing and Statistics
Self-written MATLAB version R2020B codes were used to calculate the surface modulus, deformation, adhesion force, and the jump-off force ratio. The statistical analysis was done by IBM SPSS Statistics version 28.0.0.0 (190). The 5% of the lowest and highest ends of the distributions (data of each cell wall) were discarded. A one-way ANOVA with a Tukey’s HSD (honestly significant difference) test as the post hoc analysis was conducted at a level of 0.01. The quotient of two means and the confidence interval (CI) at the 95% level were calculated using Fieller’s slightly theorem (Fieller 1954).
Results
Adhesion Forces and Topography
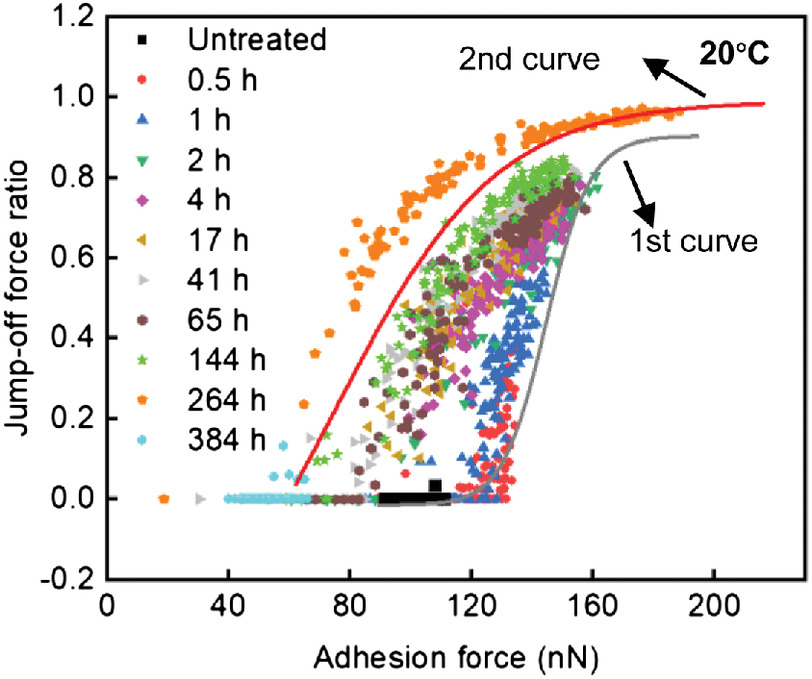
We present the adhesion forces, jump-off force ratios (128 data points on one cell wall section) and topography of cell walls treated at 20°C and 50°C in the alkaline solutions. Due to the spatial heterogeneity of wood surfaces, the wood-cell wall surfaces after cutting varied in chemical components, e.g., the amount and the stacking structure of extractives, the hemicelluloses-lignin matrix, and cellulose aggregates. To avoid the variation between cell walls, we first discuss a typical cell wall treated at 20°C (Figs. 2 and 3). Here, typical means that the chosen cell wall (1) presents the changes in the adhesion forces and topography; and (2) shows the heterogeneity of the cell wall surfaces after cutting. Then, we discuss the effect of cutting and the variations of wood surfaces (Fig. 4), and the effect of temperature (Fig. 5).

Adhesion Forces of a Typical Cell Wall
To show the immediate degradation from the mixing with cement to the short-term service life, we present the results from 0.5 to 384 h. In the following analysis, we define the term data points as the data pairs of adhesion force and the jump-off force ratio. As shown in Fig. 2, at each treatment time, the data points spread in a narrow band: the narrow bands differentiate from each other and progressively shift with the treatment time.
We found that the two sigmoidal curves from the heat treatments (first curve in gray and second curve in red) (Li and Kasal 2022a) corresponded well with the initial (0.5–2 h) and final (264–384 h) hours of the alkaline treatment, except the middle of the alkaline treatment time (4–144 h). The first 2 h (0.5, 1, and 2 h) of treatments moved the untreated data points (solid, at the bottom) upward progressively with time along the first curve: 0.5 h for the red points to the bottom neck, 1 h for the blue points to the middle, and 2 h for the olive points to the top neck. In a previous paper, the bottom of the first curve was interpreted as the extractives on the surface, the top as the almost complete removal of the extractives and exposure of the hemicelluloses-lignin matrix, and the middle as the mix of the extractives and the matrix (Li and Kasal 2022a). Therefore, we can assume that the shift from the bottom to the top of the first curve represents that the extractives were removed from the cell wall surface successively, and the hemicelluloses-lignin matrix was fully exposed.
In the middle of the alkaline treatment time (4–144 h), we found a transition phase from the first curve to the second curve: the purple points for 4 h shifted left to the brown points for 65 h, and then to the green points for 144 h. The transition phase was not observed in the heat treatment in a previous paper (Li and Kasal 2022a). We explain this phase with the surface modulus and deformation in a subsequent section.
After the transition shift phase, the data points shifted onto the second curve: part of the points spread on the top and part of the points spread along the middle of the curve at 264 h (orange points). At 384 h, the data points shifted to the bottom (cyan points). Li and Kasal (2022a) interpreted the second curve as the degradation process of the hemicelluloses-lignin matrix: the least degradation on the top, an increasing degree of degradation downward along the curve, and the almost complete degradation of the matrix on the bottom, where the cellulose aggregates were exposed. Therefore, we can assume that the hemicelluloses-lignin matrix was degraded away after 384-h treatments in the alkaline solutions.
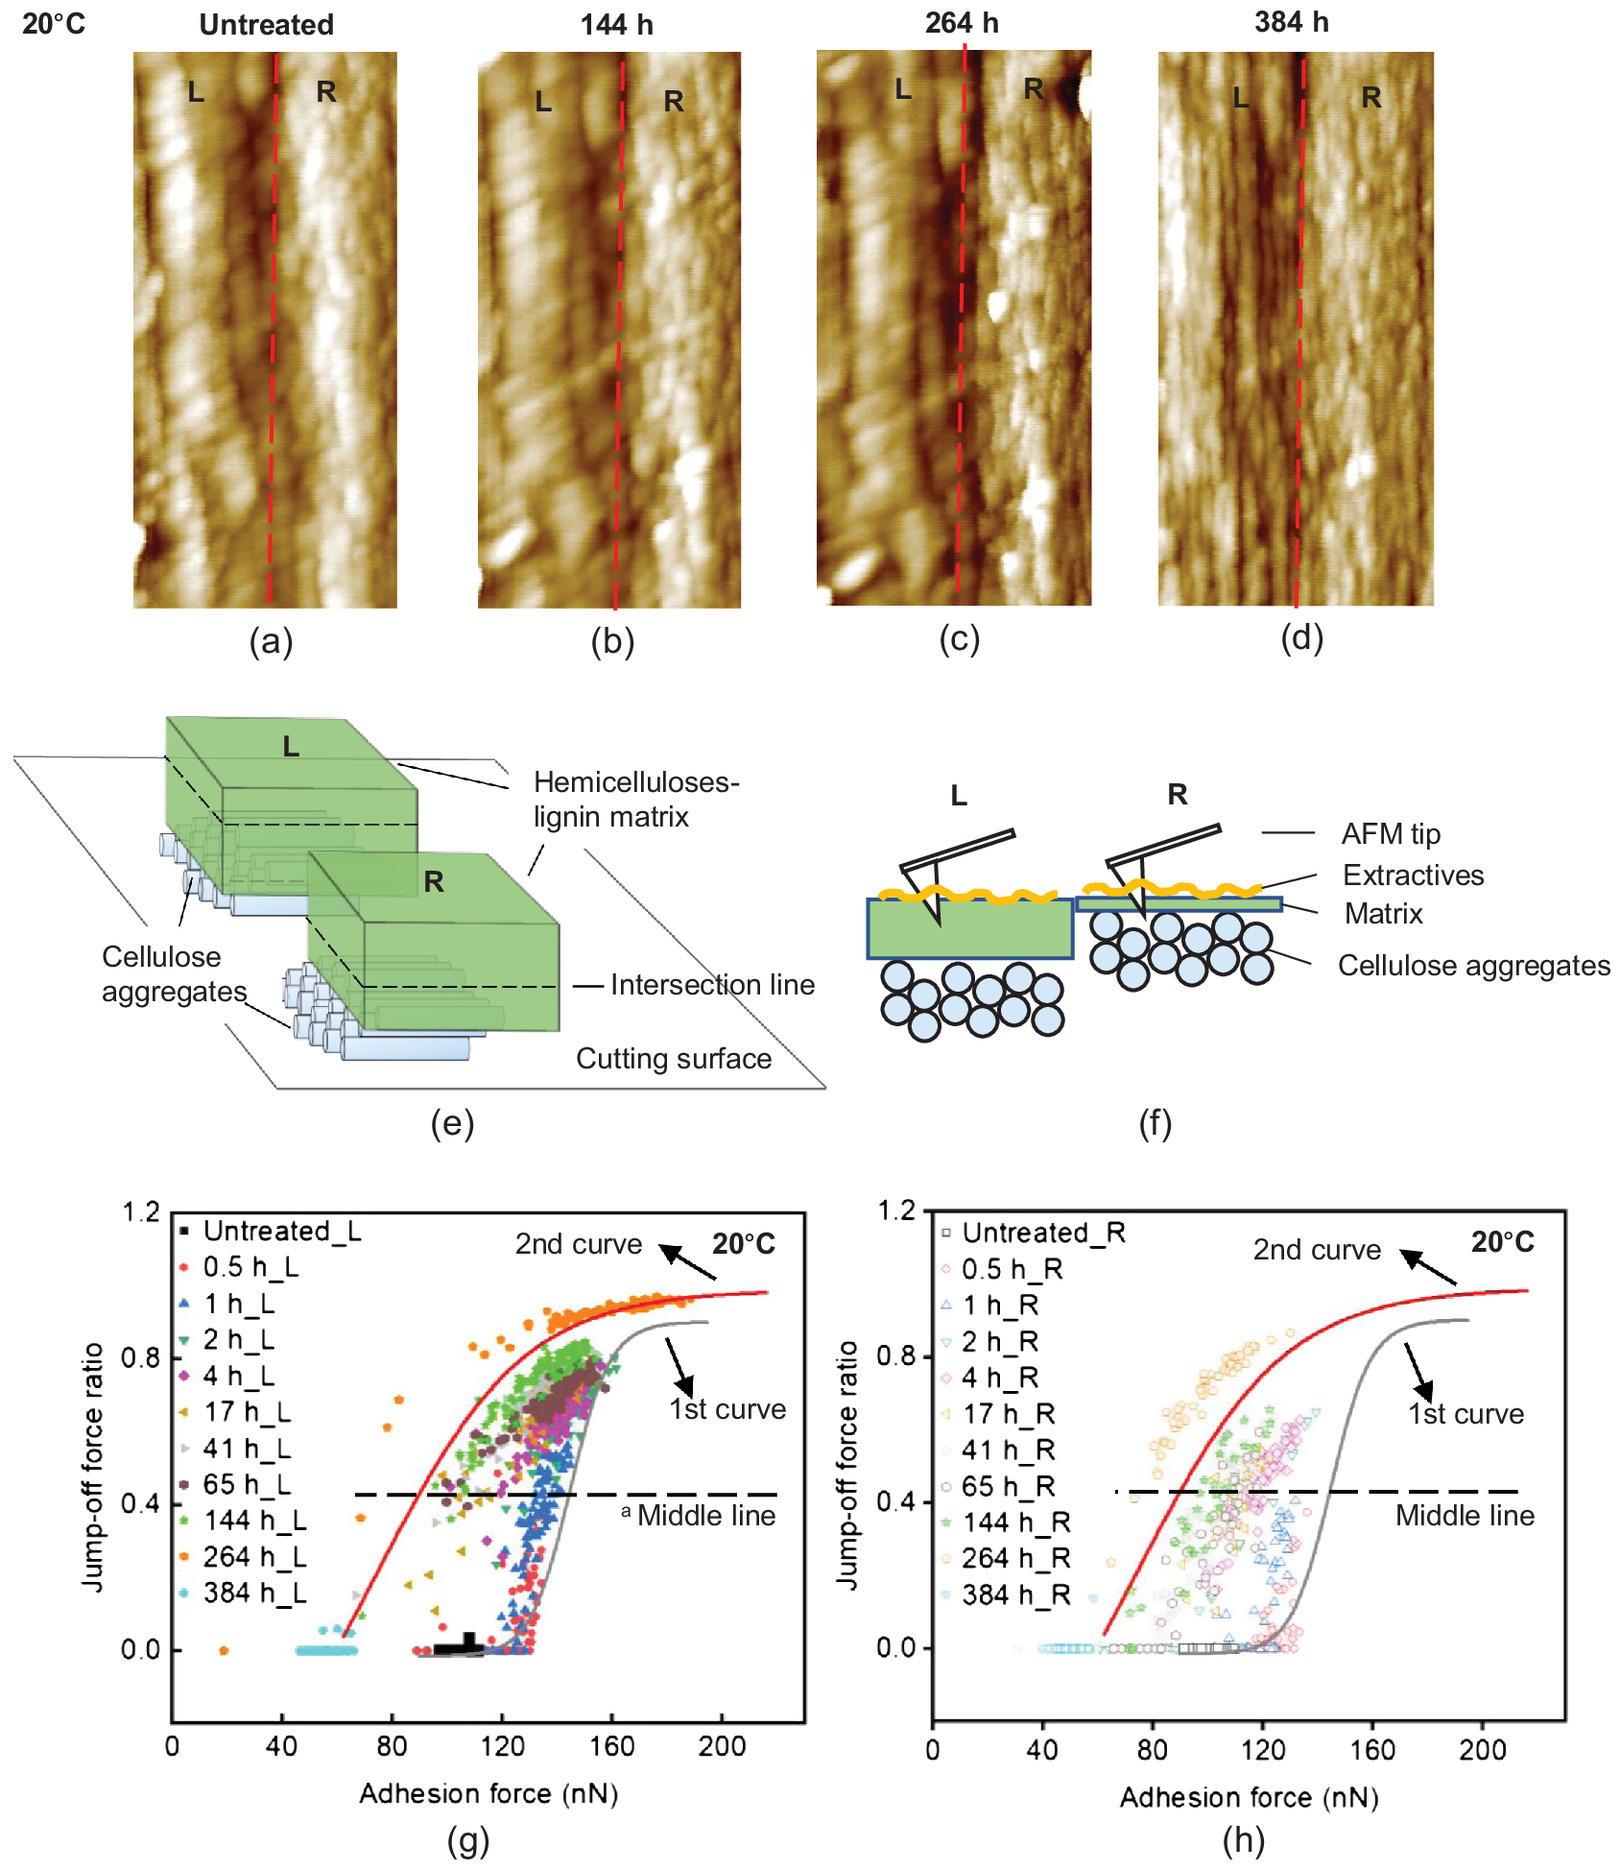
Topography of the Typical Cell Wall
We found that the chosen typical cell wall showed different topographies on the left and right parts of the cell walls [Fig. 3(a)], and here we drew a line (red dashed line): the left part appeared completely amorphous; the right granular part showed that lines or particles stacked together with the size of 60–80 nm. The cell wall surface was heterogeneous, and the cellulose aggregates and the matrix were stacked at different heights at different locations. We assumed that during the preparation of the cell wall surface, the cutting surface intersected with the cell wall components differently at different locations [Fig. 3(e)]. Therefore, we can assume that the left part is the thick layer of the hemicelluloses-lignin matrix and the right part is a thin layer of the matrix on top of the cellulose aggregates [Fig. 3(f)].
With the treatment time, the topography of the cell wall did not show obvious changes on the left part up to 264 h [Figs. 3(a–c)], whereas the lines or particles on the right part appeared clearer. At 384 h, both the left and the right parts of the cell wall were changed to tightly aligned lines or particles, the sizes being 40–60 nm [Fig. 3(d)]. The lines or particles were smaller in size than the untreated ones [Fig. 3(a)]. The literature reported the size of the cellulose aggregates to be 10–60 nm (Penttilä et al. 2020) and specifically 10–30 nm with AFM (Fahlén and Salmén 2003, 2005). Correspondingly, in Fig. 2, all the data points (adhesion forces and jump-off force ratios) shifted to the bottom of the second curve, which represented the exposure of the cellulose aggregates. Therefore, we can conclude that after 384-h treatments, the hemicelluloses-lignin matrix was degraded and the cellulose aggregates were exposed on the surface.
Correlation between Adhesion Forces and Topography on the Typical Cell Wall
Considering the different topographies, we hypothesized that the left and right parts of the typical cell wall should differ in the adhesion forces and jump-off force ratios: We assumed that the interaction between the tip and the left part of the cell wall was predominately influenced by the matrix (a thick matrix layer), whereas the interaction on the right was influenced by the combination of the matrix and the cellulose aggregates (a thin matrix layer). We separated the data points from the left part (Rows 1–5 counting from the left, 16 measurement points on each row) [Fig. 3(g)], and from the right part (Rows 6–8) of the cell wall [Fig. 3(h)]. Here, we drew a horizontal center line that went through the middle point between the top and bottom plateau of the first sigmoidal curve (gray): the upper part is the top half-space; the lower part is the bottom half-space.
We found that the data points from the left part (matrix) spread on the top half-space of the figure [Fig. 3(g)], whereas the data points from the right part spread on the bottom half-space [Fig. 3(h)]. The different spreading locations of the data points confirmed our hypothesis and our assumptions in Figs. 3(e and f). Therefore, we can conclude that (1) the adhesion forces and jump-off force ratios are sensitive to different chemical components on the cell wall surface; and (2) the radial-longitudinal cell wall surfaces are heterogeneous in the exposed chemical components: the cutting influences the adhesion force measurements of wood-cell wall surfaces, thus influencing the measurements of the cell wall surface degradation.
Effects of the Cutting
Here, we show variations in adhesion force measurements on wood surfaces after cutting. Fig. 4(a) shows an untreated cell wall surface with granular patterns of lines or particles, the size being 40–60 nm. We assumed that most of the hemicelluloses-lignin matrix was cut away, and the cellulose aggregates were exposed on the cell wall surface [Fig. 3(f), the right part of the cell wall]. After treatments for 0.5 h, the topography showed that the cell wall became clean [Fig. 4(b)] after the small amounts of extractives or matrix were washed away by the alkaline solutions. At 144 h, part of the cellulose aggregates appeared to swell and bulge [Fig. 4(c)].
The adhesion forces and jump-off force ratios confirmed the assumption: The data points spread at the bottom of the two curves throughout the treatments and shifted from the bottom of the first curve to the bottom of the second curve [Fig. 4(d)]. We can conclude that the bottom of the second curve represents the cellulose aggregates; the middle and top parts of the first and second curves represent the effect of noncellulose components. From the previous paper (Li and Kasal 2022a), the first curve shows the combined effect of the extractives and the matrix, and the second curve shows the degradation of the hemicelluloses-lignin matrix.
Fig. 4(e) shows the adhesion forces of the cell wall surface with evenly amorphous patterns [similar to the left part in Figs. 4(a and f)]: we assumed that the whole surfaces were covered by the thick hemicelluloses-lignin matrix, and the matrix dominated the adhesion forces and jump-off force ratios. As shown in Fig. 4(e), the spread and the shift of the data points during treatments confirmed this assumption: after the extractives were washed away (0.5–2 h), the data points spread on the top half-space of the figure (4–264 h) as in Fig. 3(g).
The wood-cell wall surfaces also present the heterogeneity in the shifting speed of the data points. For example, for some cell walls, after 384–1,104 h of treatments, the data points were still in the transition phase between the first and thesecond curves [Fig. 4(f)]. After cutting, the chemical components and their amounts or thickness on cell wall surfaces were different; this reflects the complexity and heterogeneity of the radial-longitudinal surfaces of wood-cell walls after cutting.
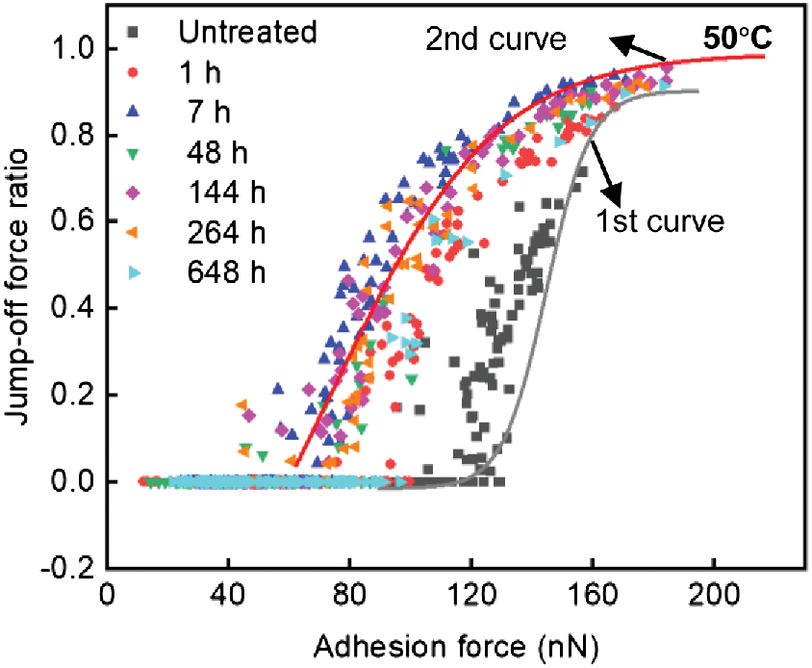
Effect of Temperature Treatment
The treatments at 50°C showed no transition phase compared with those at 20°C (Fig. 5). The untreated data points spread at the bottom and the middle of the first curve (combination effects of extractives and the matrix). The 1-h treatment shifted the data points to the second curve; the matrix starts to degrade. In the following 7–264 h, the data points stayed at the second curve, and at 648 h, the data points shifted to the bottom of the second curve; the matrix was degraded away and the cellulose aggregates were exposed. We assumed that the chemical reactions at 50°C were so fast that the transition phase could not be measured in the time frame in this study.
Surface Modulus and Deformation
Considering the cutting effects and the heterogeneity of wood-cell wall surfaces, we show the surface moduli of four cell walls at each treatment temperature (Fig. 6). The selected cell walls are located in adjacent parallel wood cells; the morphology appeared evenly amorphous, without linear lines or particles in size of 40–60 nm. The adhesion forces and jump-off force ratios spread and changed in patterns like Fig. 4(e). We assumed that the cell wall surfaces were covered with thick layers of the hemicelluloses-lignin matrix. However, we cannot determine the thickness of the matrix layers.
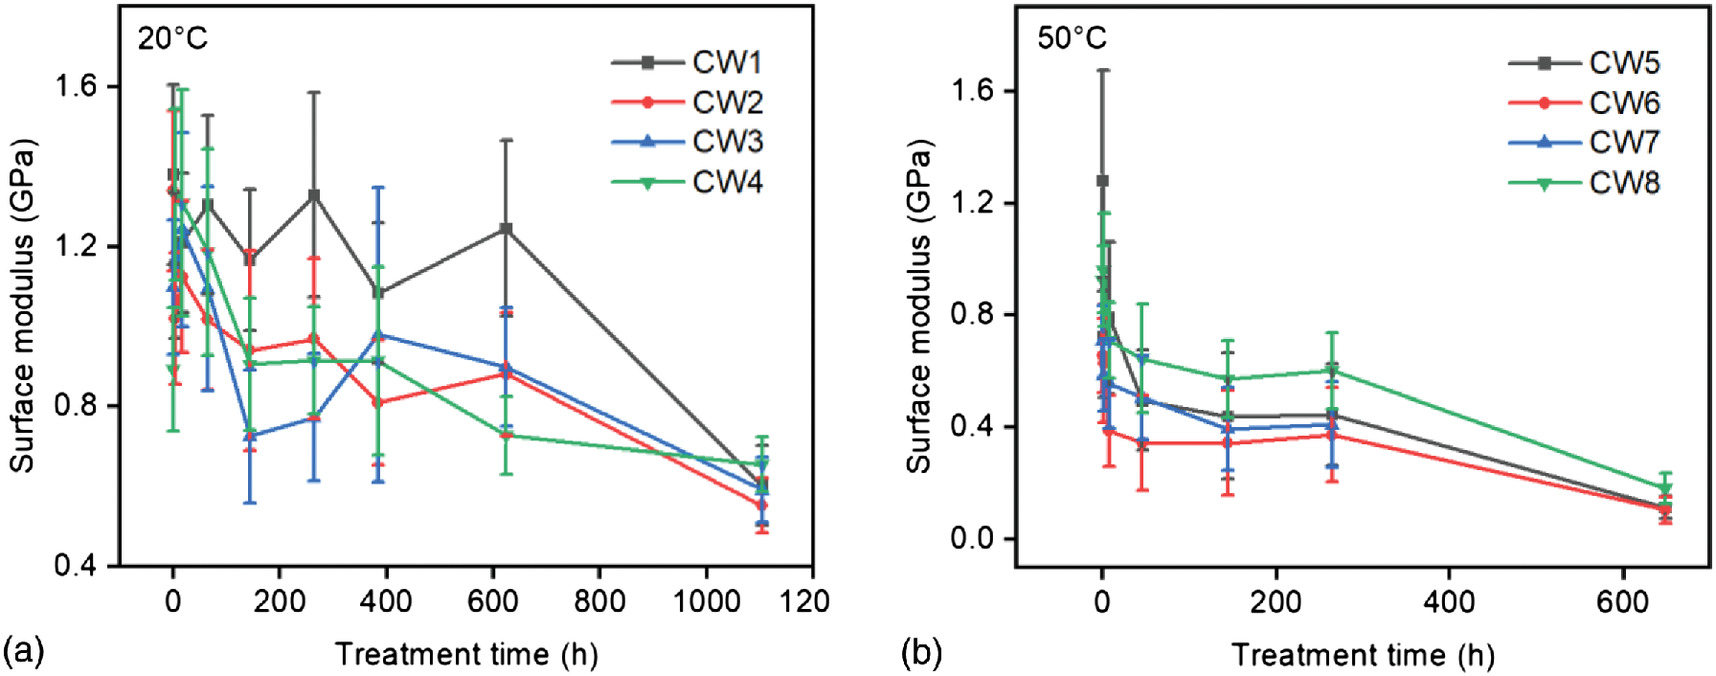
At 20°C, the surface modulus of each cell wall showed a slightly decreasing trend with fluctuations up to 600 h of treatment; The residual moduli at 1,104 h were around 0.6 GPs. In comparison, at 50°C, the modulus of each cell wall showed a sharper decrease; the residual moduli at 648 h were close to zero.
Fig. 7 shows the pooled data of the surface moduli and deformations of four cell walls (Fig. 6) at each treatment time and temperature. To show the relative change of the surface modulus and deformation with treatment time, we calculated the ratio of means between treated and untreated samples using Fieller’s theorem (Fieller 1954) at the 95% level. The calculated ratios of the surface modulus () and the ratios of the surface deformation () are shown in Figs. 7(e and f).
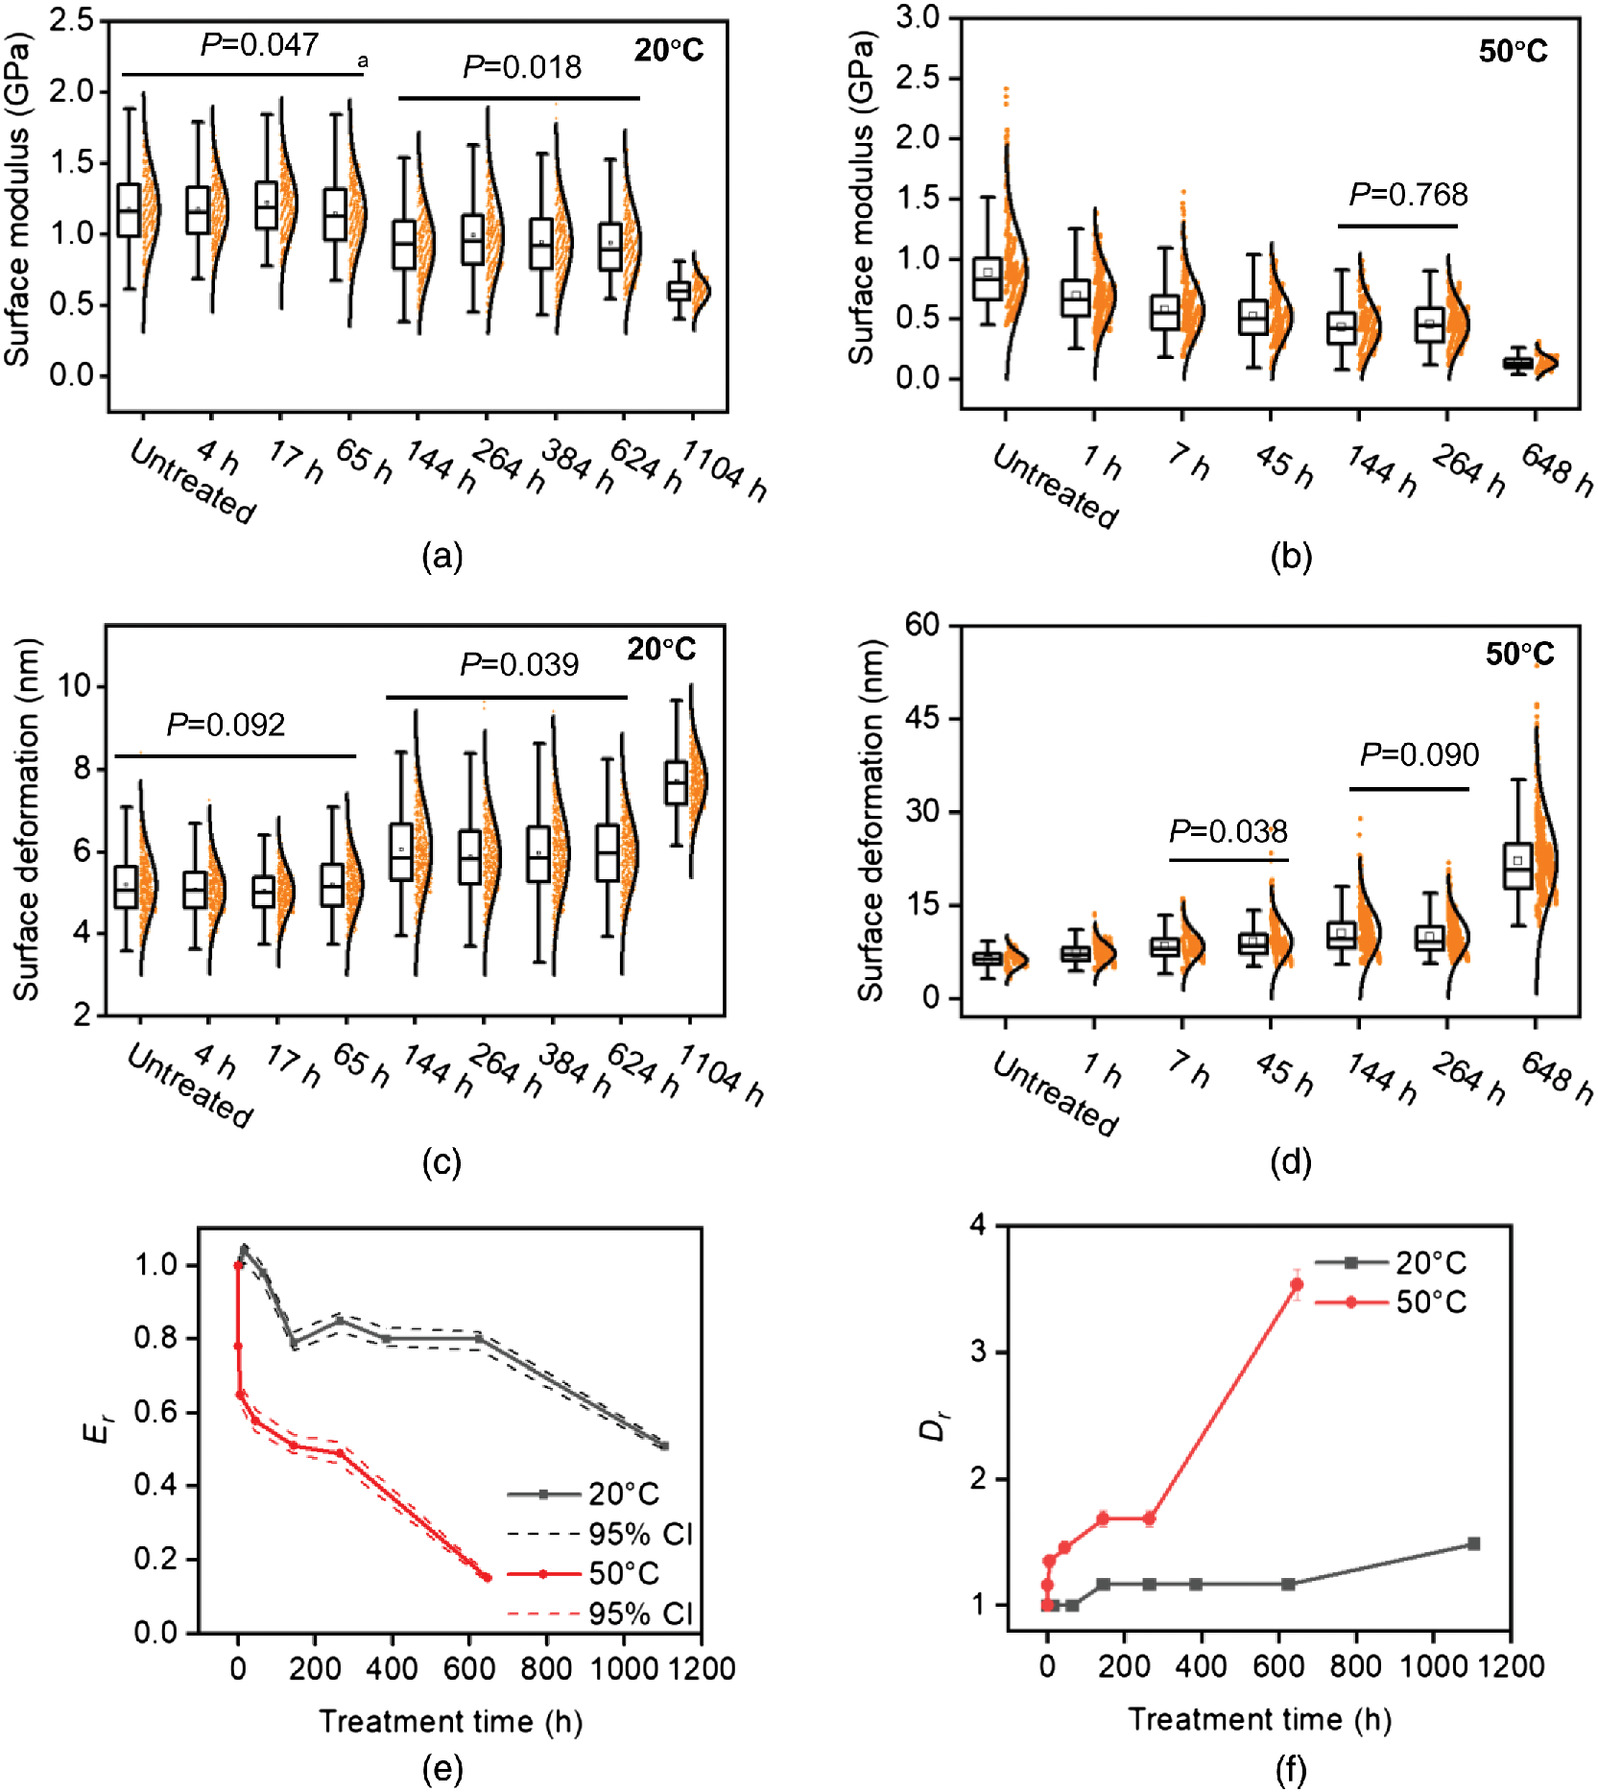
At 20°C, the surface modulus and deformation did not show significant changes up to 65 h of treatment [Fig. 7(a)]. At 144 h, the modulus decreased to 0.79 times [(0.77, 0.82) at 95% CI] that of the untreated samples and was not significantly changed up to 624 h [Fig. 7(e)]. At 1,104 h, the modulus decreased to 0.51 times [(0.50, 0.52) at 95% CI] that of the untreated samples. The deformation increased to 1.17 times [(1.14, 1.19) at 95% CI] and 1.49 times [(1.47, 1.52) at 95% CI] that of the untreated samples after 144–624 and 1,104 h of treatments [Figs. 7(b and f)].
At 50°C, the surface modulus decreased to 0.78 times [(0.75, 0.82), at 95% CI] that of the untreated samples after 1-h treatments compared with the similar decrease to 0.79 times after 144 h at 20°C [Fig. 7(c)]. At 264 h, the modulus decreased to 0.49 times [(0.46, 0.52), at 95% CI] of the untreated samples compared with the similar decrease to 0.51 times after 1104 h at 20°C. After 648 h, the modulus decreased to 0.15 times [(0.14, 0.16), at 95% CI] that of the untreated samples. The deformation showed similar accelerations, with an increase to 1.16 times that of untreated samples at 1 h compared with 1.17 times at 144 h at 20°C, and an increase to 1.46 times at 45 h compared with 1.49 times at 1,104 h at 20°C. At 648 h, the deformation increased to 3.54 times [(3.42, 3.66), at 95% CI] times that of the untreated samples [Figs. 7(d and f)].
Discussion and Conclusion
We studied the degradation process of wood radial-longitudinal cell wall surfaces after treatments in solutions at 20°C and 50°C. The treatments lasted from 0.5 h to several and hundreds of hours (648 and 1,104 h), which allowed us to measure the rapid dissolution of extractives, the progressive degradation of the hemicelluloses-lignin matrix, and the exposure of cellulose aggregates. We measured the morphologies and force-displacement curves with AFM, and we extracted adhesion forces, jump-off force ratios, surface moduli, and deformations from the force-displacement curves as parameters to describe the chemical and structural degradation process.
We found that AFM could measure the immediate and short-term degradation of the cell wall surface at 20°C in the alkaline solutions with the adhesion forces and jump-off force ratios. The extractives were dissolved progressively from the cell wall surface in the initial hours (0.5–2 h); the hemicelluloses-lignin matrix was degraded after 4–384 h of treatments, and the cellulose aggregates were exposed. The sigmoidal curves found in the heat treatment of wood-cell walls (Li and Kasal 2022a) could partially describe the degradation in alkaline solutions (Fig. 2). In initial hours (0.5–2 h), the upward shifts of the data along the first curve indicate removal of the extractives; in the final hours (264–384 h), and the downward shifts along the second curve indicate the degradation of the matrix, and the shift to the bottom of the second curve and the exposure of the cellulose aggregates. However, a different shifting occurred in the middle of the treatment time (4–264 h): the alkaline degradation showed a transition phase, i.e., the progressive shifts of the data from the first to the second curve.
The data shift at 50°C did not show the transition phase (Fig. 5). We assumed that the chemical reactions at 50°C were so fast that the transition phase could not be measured in the time frame used in this study. We found that the lack of the transition phase corresponded well in treatment time to the decrease of the surface moduli at 50°C. Specifically, the 1-h treatment at 50°C caused a similar decrease (about 0.2 times) as 144 h at 20°C (Fig. 7). In addition, the 1-h treatment at 50°C shifted the data points directly to the second curve without the transition phase (Fig. 5), whereas the transition phase at 20°C occurred before 144 h of the treatment time [Fig. 4(e)]. Therefore, the transition phase occurred when the decrease in the surface modulus of the cell wall surface was less than 0.2 times.
We discussed the effect of cutting on the adhesion force measurements on cell walls and found that the cell wall surfaces could have different chemical components, namely cellulose aggregates or the hemicelluloses-lignin matrix; the thickness of the matrix could be also different (Figs. 3 and 4). This affected the adhesion forces of the untreated samples and the changes during alkaline treatments. For instance, when cellulose aggregates were on top of the surfaces, the data shifted from the bottom of the first sigmoidal curve directly to the bottom of the second sigmoidal curve, without the upward shifting and the transition phase [Fig. 4(d)]. When the hemicelluloses-lignin matrix was on top of the surfaces, the data showed upward shifting along the first curve and the transition phase [Fig. 4(e)]. The thickness of the matrix also influenced the spread of the data points [Fig. 4(f)].
The temperature of 50°C accelerated the decrease of the surface moduli and the increase of the surface deformations (Fig. 7). The 1-h treatment at 50°C caused a 0.2 times decrease in the surface moduli as 144–624 h at 20°C; a 0.5 times decrease occurred after 264 h at 50°C, and at 1,104 h at 20°C. Considering the uncertainty during the cutting and the heterogeneity of wood-cell walls, we were not able to measure the exact thickness of the matrix layer on cell wall surfaces. Therefore, we do not know whether the top matrix layers of cell walls treated at 20°C or 50°C have the same thickness, and we could only assume that the chosen cell walls have a thick matrix layer with a similar degradation path (shifting) of the adhesion forces and jump-off force ratios [Fig. 4(e)]. This is the weakness of the comparisons between 20°C and 50°C, and we should bear this in mind when interpreting the acceleration effect of 50°C.
To conclude, we measured the immediate and short-term degradation process of the wood-cell wall surfaces with atomic force microscopy after the treatments at 20°C and 50°C. We presented the progressive degradation from the dissolution of extractives through the degradation of the hemicelluloses-lignin matrix, to the exposure of cellulose aggregates. The adhesion forces and jump-off force ratios shifted along two sigmoidal curves (Li and Kasal 2022a) in the initial and final hours of the treatment time and showed a transition phase in the middle of the treatment time. The cell wall topography changed from an amorphous state to a linear pattern.
The cutting and the heterogeneity of the cell wall surface affected the atomic force microscopy measurements and the characterization of the surface degradation. The temperature of 50°C accelerated the decrease of the surface moduli and the increase of the surface deformations. This work expands the nanoscale characterization of the wood surface degradation in the cement alkaline environment. We believe that this work can facilitate a deeper understanding of the usage of lignocellulosic materials (such as plant fibers) with cement.
Data Availability Statement
Some or all data, models, or code that support the findings of this study are available from the corresponding author upon reasonable request.
Acknowledgments
This research was partially funded by the German Research Foundation (DFG) as a part of the Graduiertenkolleg 2075. The Fraunhofer Wilhelm-Klauditz-Institute provided access to the AFM equipment. The help of Martina Zühlke with the nitrogen gas is gratefully acknowledged. The authors express thanks to Dr. Dirk.Lukowsky for the discussion of wood cutting. Author contributions: Juan Li designed the experiments, prepared the materials, and performed the experiments. Juan Li analyzed the data and wrote the manuscript. Bohumil Kasal directed the research and revised the manuscript.
References
Brahmia, F. Z., P. G. Horváth, and T. L. Alpár. 2020. “Effect of pre-treatments and additives on the improvement of cement wood composite: A review.” Bio Res. 15 (3): 7288–7308. https://doi.org/10.15376/biores.15.3.Brahmia.
Casdorff, K., T. Keplinger, and I. Burgert. 2017. “Nano-mechanical characterization of the wood cell wall by AFM studies: Comparison between AC- and QI™ mode.” Plant Methods 13 (11): 60. https://doi.org/10.1186/s13007-017-0211-5.
Do, T. A. 2013. “Finite element modeling of behavior of mass concrete placed on soil.” Monographic dissertation, Dept. of Civil and Coastal Engineering, Univ. of Florida.
Fahlén, J., and L. Salmén. 2003. “Cross-sectional structure of the secondary wall of wood fibers as affected by processing.” J. Mater. Sci. 38 (1): 119–126. https://doi.org/10.1023/A:1021174118468.
Fahlén, J., and L. Salmén. 2005. “Pore and matrix distribution in the fiber wall revealed by atomic force microscopy and image analysis.” Biomacromolecules 6 (1): 433–438. https://doi.org/10.1021/bm040068x.
Fieller, E. C. 1954. “Some problems in interval estimation.” J. Reine Angew. Math. 16 (2): 175–185. https://doi.org/10.1111/j.2517-6161.1954.tb00159.x.
Frybort, S., R. Mauritz, A. Teischinger, and U. Müller. 2008. “Cement bonded composites—A mechanical review.” BioResources 3 (Feb): 602–626. https://doi.org/10.1007/s00107-004-0501-2.
Frybort, S., M. Obersriebnig, U. Müller, W. Gindl-Altmutter, and J. Konnerth. 2014. “Variability in surface polarity of wood by means of AFM adhesion force mapping.” Colloids Surf. A 457 (Jun): 82–87. https://doi.org/10.1016/j.colsurfa.2014.05.055.
Gram, H.-E. 1983. “Durability of natural fibres in concrete.” Swedish Cem. Concr. Res. Inst. 1 (83): 255.
Gusenbauer, C., D. S. Jakob, X. G. Xu, D. V. Vezenov, É. Cabane, and J. Konnerth. 2020. “Nanoscale chemical features of the natural fibrous material wood.” Biomacromolecules 21 (10): 4244–4252. https://doi.org/10.1021/acs.biomac.0c01028.
Hertz, H. 1881. “Ueber die Berührung fester elastischer Körper.” J. Reine Angew. Math. 1882 (92): 156–171. https://doi.org/10.1515/crll.1882.92.156.
Jin, X., and B. Kasal. 2016. “Adhesion force mapping on wood by atomic force microscopy: Influence of surface roughness and tip geometry.” R. Soc. Open Sci. 3 (10): 160248. https://doi.org/10.1098/rsos.160248.
Karade, S. R. 2010. “Cement-bonded composites from lignocellulosic wastes.” Constr. Build. Mater. 24 (8): 1323–1330. https://doi.org/10.1016/j.conbuildmat.2010.02.003.
Lagaňa, R., C. Csiha, N. Horváth, L. Tolvaj, T. Andor, J. Kúdela, R. Németh, F. Kačík, and J. Ďurkovič. 2021. “Surface properties of thermally treated European beech wood studied by PeakForce Tapping atomic force microscopy and Fourier-transform infrared spectroscopy.” Holzforschung 75 (1): 56–64. https://doi.org/10.1515/hf-2019-0146.
Li, J., and B. Kasal. 2021. “Repeatability of adhesion force measurement on wood longitunial cut cell wall using atomic force microscopy.” Wood Fiber Sci. 53 (1): 3–16. https://doi.org/10.22382/wfs-2021-02.
Li, J., and B. Kasal. 2022a. “Effects of thermal aging on the adhesion forces of biopolymers of wood cell walls.” Biomacromolecules 23 (4): 1601–1609. https://doi.org/10.1021/acs.biomac.1c01397.
Li, J., and B. Kasal. 2022b. “The immediate and short-term degradation of the wood surface in a cement environment measured by AFM.” Mater. Struct. 55 (18): 179. https://doi.org/10.1617/s11527-022-01988-8.
Mao, J., H. Abushammala, and B. Kasal. 2021. “Monitoring the surface aging of wood through its pits using atomic force microscopy with functionalized tips.” Colloids Surf. A 609 (Sep): 125871. https://doi.org/10.1016/j.colsurfa.2020.125871.
Mardmomen, S. 2020. “On-site measurement of the water-cementitious ratio and heat of hydration of delivered concrete.” Dissertation, West Virginia Univ.
Meincken, M., and P. D. Evans. 2009. “Nanoscale characterization of wood photodegradation using atomic force microscopy.” Eur. J. Wood Wood Prod. 67 (2): 229–231. https://doi.org/10.1007/s00107-008-0305-x.
Melo Filho, J. D. A., F. D. A. Silva, and R. D. Toledo Filho. 2013. “Degradation kinetics and aging mechanisms on sisal fiber cement composite systems.” Cem. Concr. Compos. 40 (3): 30–39. https://doi.org/10.1016/j.cemconcomp.2013.04.003.
Penttilä, P. A., M. Altgen, M. Awais, M. Österberg, L. Rautkari, and R. Schweins. 2020. “Bundling of cellulose microfibrils in native and polyethylene glycol-containing wood cell walls revealed by small-angle neutron scattering.” Sci. Rep. 10 (7): 20844. https://doi.org/10.1038/s41598-020-77755-y.
Sedan, D., C. Pagnoux, T. Chotard, A. Smith, D. Lejolly, V. Gloaguen, and P. Krausz. 2007. “Effect of calcium rich and alkaline solutions on the chemical behaviour of hemp fibres.” J. Mater. Sci. 42 (22): 9336–9342. https://doi.org/10.1007/s10853-007-1903-4.
Stapper, J. L., F. Gauvin, and H. Brouwers. 2021. “Influence of short-term degradation on coir in natural fibre-cement composites.” Constr. Build. Mater. 306 (Dec): 124906. https://doi.org/10.1016/j.conbuildmat.2021.124906.
Wei, J. 2018. “Degradation behavior and kinetics of sisal fiber in pore solutions of sustainable cementitious composite containing metakaolin.” Polym. Degrad. Stab. 150 (4): 1–12. https://doi.org/10.1016/j.polymdegradstab.2018.01.027.
Wei, J., and C. Meyer. 2015. “Degradation mechanisms of natural fiber in the matrix of cement composites.” Cem. Concr. Res. 73 (Mar): 1–16. https://doi.org/10.1016/j.cemconres.2015.02.019.
West, P. E. 2007. Introduction to atomic force microscopy: Theory, practice, applications: Santa Clara, CA: Pacific Nanotechnology.
Information & Authors
Information
Published In

Journal of Materials in Civil Engineering
Volume 35 • Issue 7 • July 2023
Copyright
This work is made available under the terms of the Creative Commons Attribution 4.0 International license, https://creativecommons.org/licenses/by/4.0/.
History
Received: May 17, 2022
Accepted: Oct 4, 2022
Published online: Apr 18, 2023
Published in print: Jul 1, 2023
Discussion open until: Sep 18, 2023
Authors
Metrics & Citations
Metrics
Citations
Download citation
If you have the appropriate software installed, you can download article citation data to the citation manager of your choice. Simply select your manager software from the list below and click Download.