Management of Foreign Exchange Risk for Build–Own–Operate–Transfer Hydropower Projects in Nepal: A Good-for-All Approach
Publication: Journal of Infrastructure Systems
Volume 29, Issue 2
Abstract
Financing demands for the increasing number of large-scale build–own–operate–transfer (BOOT) hydropower projects in Nepal have necessitated greater mobilization of foreign investment. International investors and lenders perceive significant foreign exchange (FoREX) risk when investing in such projects. In Nepal and various developing countries, FoREX risk-allocation mechanisms offered by the public sector allocate significant FoREX risks to project sponsors and have failed to attract substantial foreign investment. The industry is thus in need of alternative FoREX risk-allocation mechanisms that ensure reasonable returns to project sponsors, minimize downside risk to the public sector, and maintain reasonable electricity tariffs for consumers. To address this need, this study proposes a feasible good-for-all risk-allocation mechanism and presents a financial analysis of the proposed mechanism via a case study of an ongoing Nepalese BOOT hydropower project. The comparative merits of the proposed risk-allocation mechanism over the existing mechanism are illustrated via a case study of an ongoing BOOT hydropower project in Nepal. The case study is also extended to represent different hydropower projects using various cost and revenue scenarios. The results of extended analysis showed that the proposed risk-allocation mechanism should be more effective for economic projects, and that implementation is feasible based on the current institutional arrangements observed in Nepal.
Introduction
The long-term national development vision for Nepal involves the development of 32,680 MW of technically feasible hydropower potential (WECS 2019). However, Nepal currently suffers from limited long-tenor credit availability in the local financial market. This is reflected in the current practices of loan syndication, which requires the involvement of up to seven to eight commercial banks for a 25-MW-sized project (World Bank 2015). Recent estimates stated that electricity sector investments in Nepal will require an average of USD 1.3–2.1 billion annually between 2018 and 2040 (World Bank 2019). However, because of the limited capital base and prudential regulatory norms, local Nepalese banks are unable to finance the demand for hydropower projects and require access to foreign capital for investment (World Bank 2019).
Financing build–own–operate–transfer (BOOT) infrastructure projects in foreign currencies naturally exposes sponsors and lenders to the risks associated with currency devaluation (Gupta and Sravat 1998; Wang et al. 2000; Wang and Tiong 2000). Since the Asian financial crisis of 1997, investors and lenders have recognized foreign exchange (FoREX) risk as a major risk factor when investing in infrastructure projects in developing countries (Chowdhury et al. 2015; Chowdhury and Charoenngam 2009; Ehrlich 2010). For a highly leveraged BOOT power project financed in a foreign currency, the ability of sponsors to service debt and receive undepreciated return on equity is severely undermined when FoREX risks materialize (Gray and Irwin 2003b; Lam 1999). Consequently, in the absence of a proper risk-mitigation mechanism for FoREX risk, future cash flows subject to depreciation risk make debt financing difficult, and could render the project unattractive for international investors. The public sector thus faces a challenge in providing appropriate risk mitigation mechanisms for investors to attract investment into BOOT hydropower projects (Ameyaw and Chan 2015; Ng and Loosemore 2007; Zhang 2005).
However, the role of the public sector in Nepal in mitigating FoREX risk has remained contentious since its first engagement in the Khimti and Upper Bhotekoshi hydropower projects in the 1990s. For both projects, the public sector fixed the tariffs in USD in an effort to relieve sponsors from FoREX risk. The Nepalese rupee (NPR) then proceeded to inauspiciously depreciate approximately 100% against the US dollar from 1996 to 2020. This led to devastating financial losses to the Nepal Electricity Authority (NEA), which signed the power purchase agreements (PPA) for these projects. Exposed to such significant downside risk and consequential public criticism, the public sector remained reluctant, until 2016, to offer further mitigation measures for FoREX risk. However, the severe power crisis that persisted during 2006–2016, exacerbated by low investments in the hydropower sector, combined with the rising demand of domestic sponsors to arrange debt from foreign sources, has led the Nepalese public sector to reconsider its role in FoREX risk management.
In 2016, the public sector introduced a new FoREX risk-allocation mechanism to be applied to a project promoted by Korean sponsors, but it appears inadequate in attracting sponsors to invest in foreign currencies (World Bank 2019). In this manner, international sponsors are also cognizant of the significant FoREX risks for achieving reasonable returns, and have been increasingly reluctant to participate in Nepalese projects with large equity requirements (Neupane 2013).
An alternative FoREX risk-allocation mechanism that can better ensure reasonable returns to project sponsors, minimizes downside risk to the public sector, and maintains reasonable electricity tariffs for consumers is therefore necessary. To address this need, this study proposes a feasible good-for-all risk-allocation mechanism and presents a financial analysis of the proposed mechanism via a case study of an ongoing Nepalese BOOT hydropower project.
The remainder of this paper is organized as follows. First, the relevant literature concerning the theory and practices of FoREX risk allocation in BOOT/public-private-partnership (PPP) infrastructure projects is reviewed and discussed. Second, a description of the data and methods is provided. Third, the current risk-allocation mechanism to manage FoREX risk is discussed and evaluated through a case study of an actual hydropower project in Nepal. Finally, the impact of a proposed risk-allocation strategy is analyzed using a simulated financial analysis of the selected case.
Literature Review
The generally accepted principle for risk allocation in infrastructure projects is to allocate the risk to a party that is best able to manage it at the lowest cost (Bing et al. 2005; Cooper et al. 2005; Ng and Loosemore 2007). However, the willingness of each party to take risk is significantly influenced by factors such as risk tolerance capacity, risk perception, and risk-return expectations (Ward et al. 1991), which can prevent risk from being allocated to appropriate parties.
In exchange rate fluctuations, volatility is linked to the macroeconomic conditions of the host country, which are influenced by their fiscal and monetary policies. Thus, the public sector appears to be the most appropriate party for managing and controlling the uncertainty associated with currency fluctuations. For example, Mas (1998) argued that governments are well-positioned to provide exchange rate guarantees, with their knowledge about future policy intentions that are fundamentally linked to macroeconomic stability. However, Mas’s (1998) work also highlighted the need to formulate alternative policy options to avoid moral hazards associated with guarantees by eliminating information bottlenecks, presenting market-friendly policy commitments, and reinforcing the private sector’s capacity to intermediate exchange rate risks. Similarly, Gray and Irwin (2003b) argued that exchange rate guarantees could transform into a source of political or regulatory risk due to the failure of the public sector to deliver such guarantees during periods of macroeconomic crises.
Irwin (2007) classified exchange rate fluctuations as an economywide risk of a distributional nature, in which the risk factors cannot be controlled by most stakeholders. This suggests that the management of such risks should be accomplished by responding to risk factors or absorbing risk, rather than by influencing the risk factors. Such a principle argues that FoREX risk must not be borne by the public sector alone when both investors and consumers possess a certain capacity to absorb the risk. For investors, it is generally argued and accepted that FoREX risks can also be addressed by diversifying country-specific risks to a large pool of shareholders through their risk-uncorrelated assets operating in various countries (Gray and Irwin 2003a; Matsukawa et al. 2003). For consumers, the argument is that risk is diversified across a wider base of economic participants that can respond to FoREX volatility through their ability to initiate demand-side responses consistent with price signals. However, it must be noted that this is relatively difficult to achieve in developing countries with poor consumers and a lack of substitutes in segments such as the energy market (Matsukawa et al. 2003).
Some countries have adopted unique approaches to allocate FoREX risk within BOOT/PPP infrastructure projects. South Korea adopted a FoREX risk guarantee to compensate for losses due to exchange rate fluctuations under the Private Participation in Infrastructure (PPI) Act of 1998. This act enabled mitigation measures, such as tariff rate adjustments, government subsidies, or concession period adjustments, to cover half of the total losses when exchange rates fluctuated by more than 20% (Hahm 2003). Because the Korean won mostly appreciated and remained stable after the issuance of these guarantees (Irwin 2007), the Korean government later abolished this risk-allocation provision (Park 2012). However, the current PPI Act continues to provide support to the concessionaire in the form of subsidies or long-term loans if projects containing debt in foreign currencies are subject to excessive currency devaluation during the construction or operation period.
The government of Chile implemented a different approach by delivering exchange rate insurance for loans denominated in foreign currencies for PPP projects between 2000 and 2013 (Albalate et al. 2015; Vassallo et al. 2020). The insurance arrangement was designed to share both upside and downside risks with private sponsors when the national currency appreciated or depreciated over 10% of the value of when the concessions were signed (Vassallo et al. 2020). However, because PPP financing needs are now met through local financial markets, exchange rate insurance has been discontinued (Aslan and Duarter 2014).
It is therefore clear that countries in the early stages of PPP implementation that rely on foreign financial resources may need to provide exchange rate guarantee. Later, as the local financial market evolves in its ability to increase credit, the public sector could decide whether they need to abolish exchange rate guarantees. Consistent with this argument, the public sector in Nepal currently offers a FoREX risk-allocation mechanism where equity investors need to share one-third of FoREX exposure on debt and bear full FoREX exposure on equity. Moreover, the public sector is required to bear a two-thirds exposure to debt for only 10 years. It remains questionable as to whether 10 years is a sufficient period for equity investors to complete debt servicing for such large-scale projects that require foreign investment. Furthermore, compromising equity investors’ risk-return expectations, the public sector has capped the allowable return on equity to 17%, placing a ceiling on the risk-return expectations for investors (World Bank 2019).
Academic research that attempts to analyze current FoREX risk-allocation mechanisms within PPP energy projects is scarce, and our study provides a much-needed discussion and evaluation of the potential impacts of risk-allocation mechanisms based on actual financial indicators and practices within Nepalese projects. The following section will briefly describe the data and methods utilized to propose an alternative FoREX risk-allocation mechanism based on a Nepalese case study.
Methodology
The alternative risk-allocation mechanism proposed and evaluated in this study is based on a case study of the Upper Trishuli-1 (UT-1) hydropower project currently under development. Primary and secondary data and insight into current FoREX risk management practices were gathered through the model PPA document (NEA 2017) and interviews with the chief executive officer and the general manager of the UT-1 project in November 2020. Similarly, project documents such as the project development agreement (PDA) (MoEWRI 2016) and feasibility study reports provided the details of other risk-allocation arrangements and project parameters that structured the financial analysis. The case study thus consists of qualitative and quantitative data that were synthesized to highlight the FoREX risk-allocation practices, which will be described in the following sections.
The financial analysis of the UT-1 project subject to the anticipated future currency fluctuations has been performed to understand the attractiveness of risk-allocation mechanisms. Table 1 lists the assumptions for the project parameters derived from feasibility study reports and interviews. Future fluctuations of the local currency (NPR) against the USD were assumed to follow Brownian motion. Monthly averages of past exchange rates were calculated using publicly available daily NPR/USD exchange data from the Nepal Rashtra Bank. Monthly averages were fitted using the software program @Risk 8.1 and the Brownian motion mean reversal jump diffusion process, corresponding to the lowest Akaike information criterion (AIC) value, deemed to best represent fluctuations observed during 2000–2021.
| Parameters | Values |
|---|---|
| Operation and maintenance (O&M) cost (% of EPC cost) | 1.50 |
| Depreciation (years) | 30 |
| Inflation (O&M cost) (%) | 6.0 |
| Project cost (million USD) | 647.5 |
| Debt equity ratio | 70:30 |
| Interest rate on debt (%) | 9 |
| Loan tenor | 15 |
| Discount rate (%) | 8 |
| Maximum return on equity (%) | 17 |
The potential impact of currency fluctuations on project finances were analyzed through Monte Carlo simulations of annual cash flows of the project, based on parameters defined by actual risk-allocation practices revealed in the UT-1 project’s model PPA document, PDA, and through interviews with practitioners. FoREX risk, market risk, inflation risk, and relevant parameters such as maximum allowable return on equity, fiscal incentives, value-added tax (VAT) exemptions, and tariff rates delineated in the PPA and PDA have been incorporated to generate 5,000 stochastic cash flow simulations using @Risk 8.1.The financial analysis of the case study also enables us to propose and evaluate alternative risk-allocation mechanisms and compare the impact on financial indicators against the same currency fluctuation simulations. The financial analysis is also extended to represent different project cases that consider different project costs and plant factor scenarios. The next section will provide an overview of the case and the current FoREX risk-allocation mechanism of the UT-1 project, before proposing the alternative mechanism.
Existing FoREX Risk-Allocation Mechanism in Nepalese Hydropower Projects
Introduction of the Case: Power Purchase Agreements in Nepal
The NEA is a state-owned utility and off-taker that signs PPAs with project companies in a tariff denominated in NPR. Payments to the project company are based on the quantity of energy (kWh) supplied to the NEA multiplied by seasonal posted tariff rates, that is, NPR in the wet season (June–November) and NPR in the dry season. An annual increase of 3% in posted rates is provided for the first 8 years after the commercial operation date (COD). Of the total monthly payments, the NEA utilizes a currency mix ratio to determine the proportion of monthly payments payable to the project company in foreign currency. The currency mix ratio is equivalent to the proportion of foreign currency debt to total financing and excludes equity financing, regardless of its currency denomination. Offered as a standard risk-allocation arrangement [jointly approved by the Government of Nepal (GoN) and NEA], the FoREX exposure on payments in foreign currencies is thereafter split evenly among the project company, GoN, and NEA for a maximum of 10 years after COD. Exposure to exchange rate fluctuations within this agreement is calculated as the difference in exchange rates compared with the rate on the date that the PPA was signed.
Thus, the present risk-allocation mechanism involves equal sharing of FoREX exposure for foreign currency loans among the project company, GoN, and NEA for 10 years. After 10 years, the project company takes full exposure for the remaining concession while simultaneously bearing full exposure to equity. Similarly, tariff rates are not indexed to local inflation 8 years after COD, which prevents an equivalent opportunity for the project company to neutralize FoREX risk over the medium to long term (Matsukawa et al. 2003). Consequently, future cash flows from operating the hydro-project can be significantly exposed to FoREX risk, which can adversely affect the project’s financial indicators such as financial internal rate of return (FIRR) or net present value (NPV). Moreover, after a bitter experience by the NEA in the Khimti and Upper Bhotekoshi hydropower projects, in which both project companies received over 50% return on equity (RoE) at the expense of the NEA bearing complete market and FoREX risk (BPC 2019), the NEA began negotiating strict caps on RoE at 17% (NEA 2017). This cap on RoE could aggravate the sponsor’s risk-return expectation after transferring a significant share of FoREX risk to the project company.
Current FoREX Risk-Allocation Mechanism in Practice in the Upper Trishuli-1 Hydropower Project: A Negotiated Free-Energy Agreement
First, to observe the impact of FoREX risk in the absence of a standard risk allocation (Fig. 1), the FIRR of UT-1 was simulated using two cases, one in which the project company bears no risk and the other in which it bears full risk. The mean FIRR value was estimated to be 9.10% when the project company bears no FoREX risk, and 6.61% when the project company bears full risk. These findings show that passing full FoREX exposure to the project company can pull the project’s FIRR into an unfeasible range, that is, below the utilized discount rate (8%).
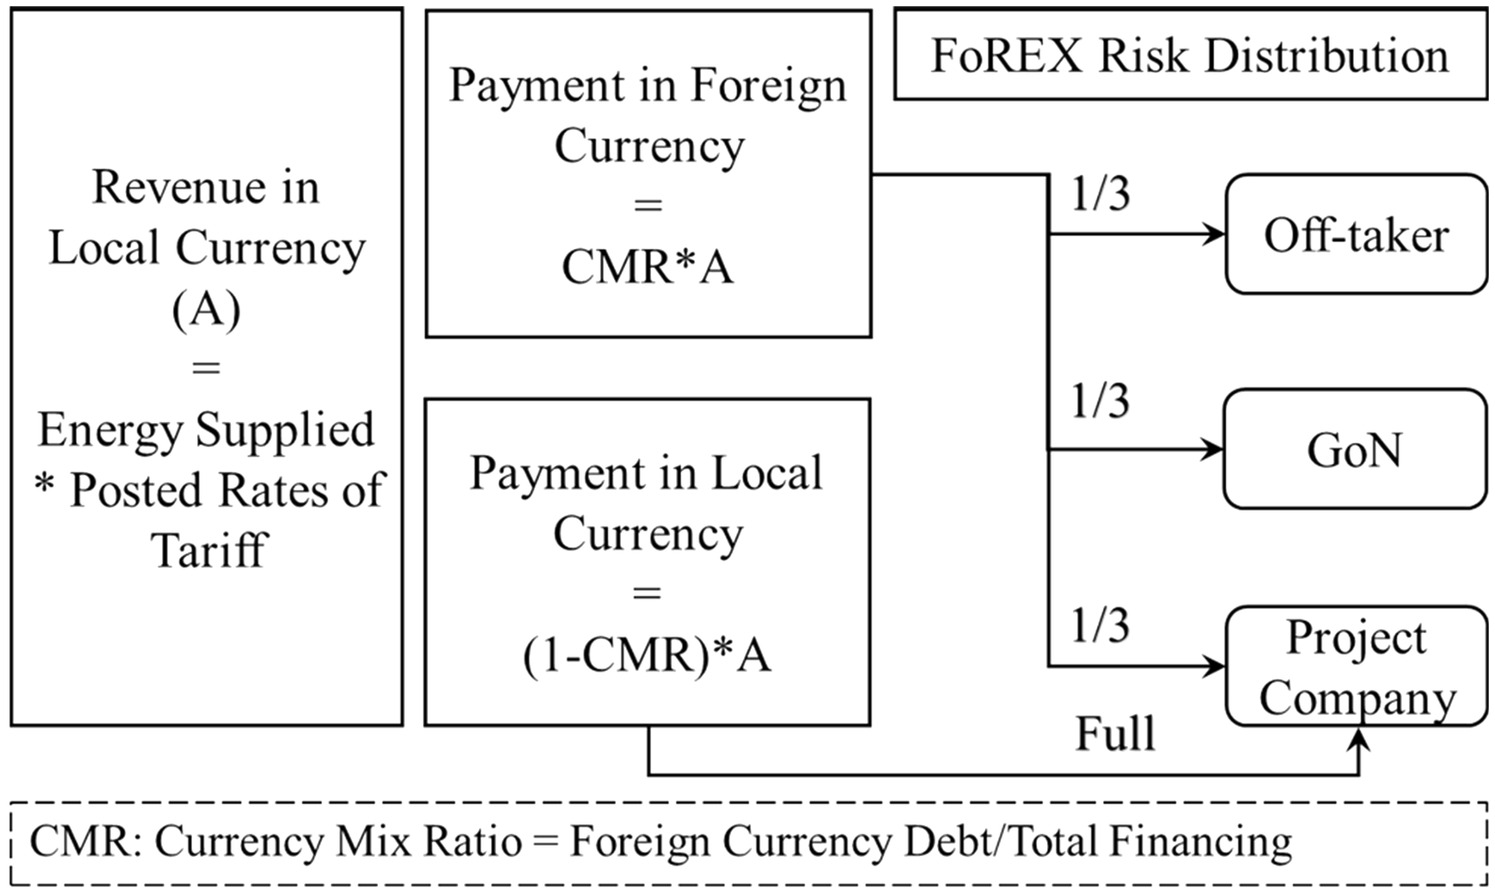
As shown in Fig. 1, the standard risk allocation required the project company, the Nepal Water and Energy Development Company (NWEDC), to bear one-third of the FoREX risk. Dissatisfied with this arrangement, NWEDC negotiated with the NEA to deliver 17% of the energy generated by the project for free after the 14th year from COD, rather than bearing a third of this risk for the first 10 years of operation. Therefore, the current FoREX risk allocation observed in UT-1 is now concentrated within the public sector (two-thirds to the NEA and one-third to GoN) for 10 years after COD. Delayed compensation through free energy in a nominal and undiscounted value helped the project company marginally improve its projected FIRR. This modification of the standard arrangement reinforces the claim that the sponsor perceived significant risk exposure associated with FoREX volatility. The simulated FIRRs in both the standard and negotiated risk-allocation mechanisms are shown in Fig. 2. The results show that the project company’s ability to relieve itself of FoREX risk through free-energy agreements can marginally improve the project’s FIRR and reduces volatility.
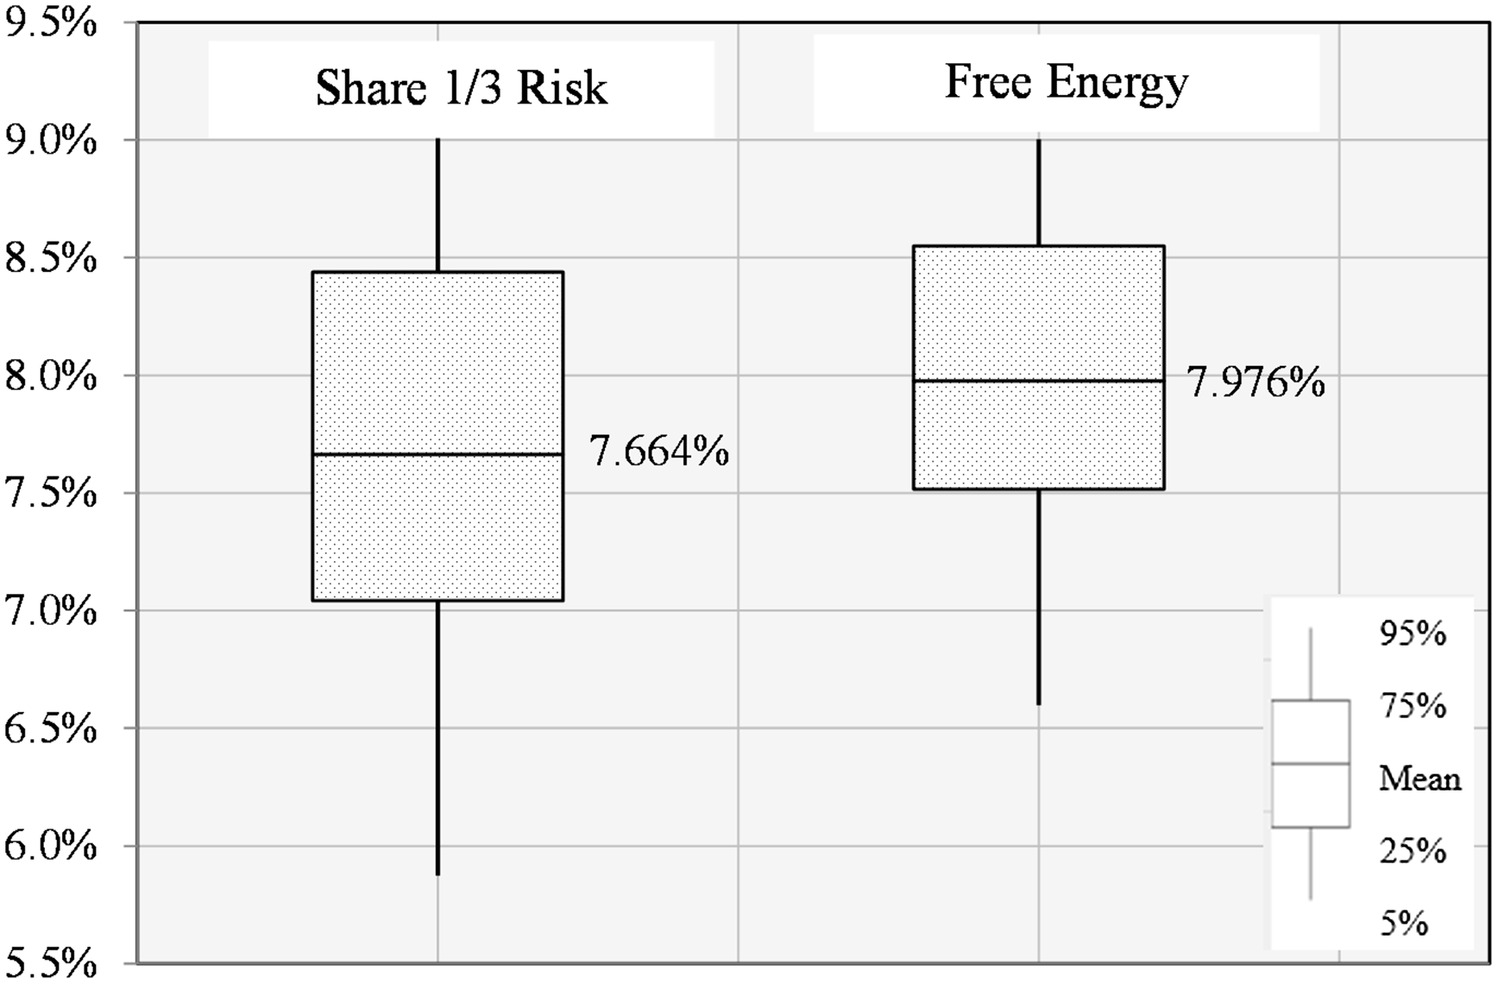
However, even after such improvements, the mean FIRR value was estimated at 7.97%, which is equivalent to the discount rate (i.e., 8%), making the arrangement financially unattractive. Because sponsors have a choice of different investment opportunities, such low returns for a BOOT/PPP project do not adequately compensate for the assumed risks, and will fail to attract investment (Albalate et al. 2015). The current FoREX risk-allocation mechanisms offered by the public sector, including the modified free-energy agreements negotiated by the sponsor in UT-1, are unlikely to entice sponsors to invest in foreign currencies. Therefore, the financial analysis suggests that the current risk-allocation mechanism, in which the FoREX risk is shared by the project company and the public sector with the RoE capped at 17%, is unlikely to render a satisfactory risk-return profile for the sponsors.
Proposed Risk-Allocation Mechanism: A Good-for-All Model
The public sector should consider changing its current allocation strategy to improve the allocation structure and generate a satisfactory risk-return profile for sponsors. A variety of win–win models for PPP/BOOT infrastructure projects have been proposed in the literature that consider possible uncertainties during the concession period. A guiding principle for most risk-sharing models is to ensure a reasonable return to the sponsors while minimizing downside risk to the public sector (Carbonara et al. 2014; Carbonara and Pellegrino 2018; Tavakoli and Hosseini Nourzad 2020; Park 2012). The good-for-all model proposed in this study is based on the same basic principles.
For a developing country like Nepal with excessive currency devaluation risk, wherein financial markets to hedge such risks are absent, the public sector (i.e., the GoN and NEA) is relatively better positioned to bear FoREX risk in priority BOOT hydropower projects. The NEA arranges significant financial resources from international financial institutions to finance its generation, transmission, and distribution projects. To maintain the financial soundness of a vertically integrated NEA in an expanding power market, and to prevent placing the full burden of currency exposure onto consumers, the GoN should assume a significant proportion of such risks. Against its absorption of FoREX risk, the GoN could set a reasonable return for the sponsors, which is comparable to the risk-free rate of return on GoN bonds. Balancing the risk-return expectation of sponsors in this manner, both sponsors and the GoN can jointly achieve the objectives of mitigating FoREX risk while incentivizing international investment in hydropower projects.
Under this premise, the proposed allocation strategy is structured to maximize the mean value of the annual return on equity [i.e., RoE (mean)], such that there is a 90% probability that the return on investment lies within a predetermined range ( to ). As an example, we show results for a return on investment that is in the range of 10%–12%, such that the project FIRR remains more attractive than the long-term risk-free rate of return from GoN bonds set at 8%subject towherewhere = net cash flow in time ; = discount rate (%); and = construction period.
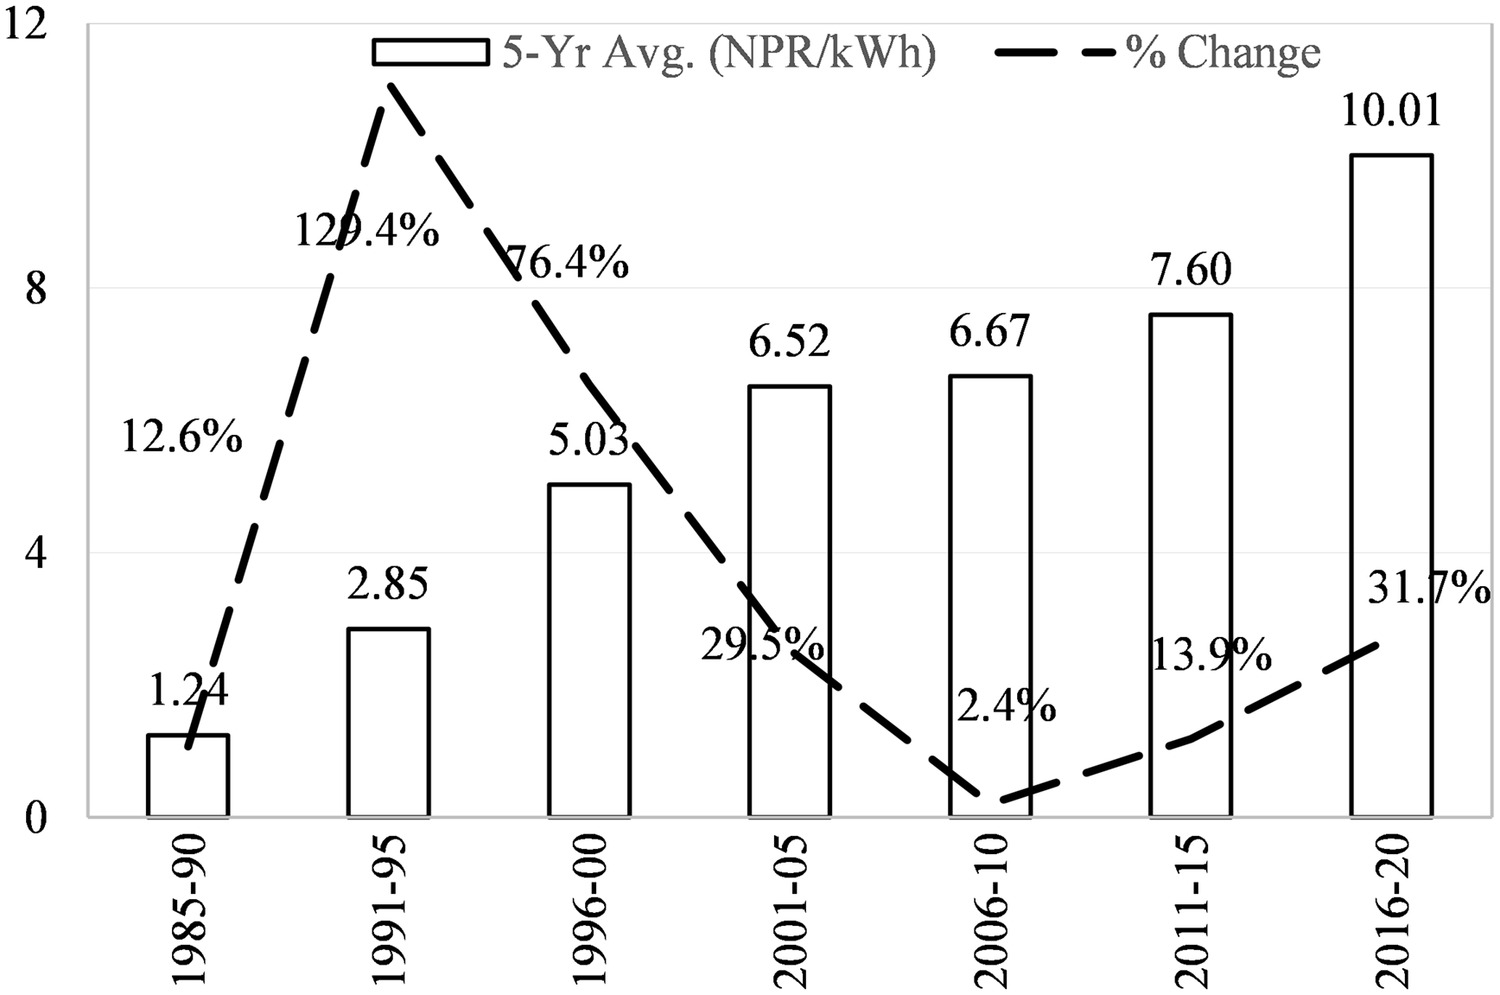
Our model also proposes transferring a limited amount of FoREX exposure to consumers. For a developing country such as Nepal, transferring the entire exposure to consumers through proportional tariff increases is generally undesirable owing to the resultant socioeconomic and political tolls (Hobman et al. 2016). Consequently, an appropriate option is to apply reasonable and periodic increments in consumer tariffs to absorb local inflation. To minimize the FoREX exposure of the GoN, our model proposes a marginal transfer of exposure to consumers through a controlled escalation of consumer tariffs. The proposal allows for a maximum 10% tariff increase every 5 years. We believe consumers would accept such an arrangement as reasonable because average tariff increases in Nepal over 5-year increments have consistently been above 10% since 1985 (with the exception of 2006–2010) (Fig. 3).
As stated previously, the NEA is a vertically integrated utility, and thus does not maintain separate accounts or costs for its generation, transmission, and distribution businesses. Therefore, the NEA sets consumer tariffs based on their expected average cost and leverages the available economies or diseconomies of scope. Consequently, the NEA is also unable to separate and transfer costs or currency exposure to consumers. Under such an arrangement, the controlled escalation of consumer tariffs should occur later in the future, which will concurrently fulfill the GoN’s objective of minimizing its FoREX exposure and the consumer’s objective of receiving relatively inexpensive tariffs. In summary, the proposed allocation puts all stakeholders in a better position with regard to FoREX exposure, including consumers, who are expected to bear tariff increments that are, on average, lower than those observed over the last 3 decades.
Payment Structure
The proposal includes the utilization of a cost-plus regulated return payment to the project company rather than payments based on the posted rates of energy in local currency. Tariffs paid to the project company is availability-based and include capacity payments and energy payments. Capacity payments are made if the project company makes the plant available per dispatch instructions, whereas energy payments are based on the quantity of energy delivered. The project company is guaranteed of a total capacity payment of 70% of the total annual cost. However, the NEA can decide on the appropriate ratio of capacity to energy payments and set the ratio depending on the level of market risk. A program evaluation and review technique (PERT) distribution was used to model market risk. It was assumed that the NEA will purchase power for at least 10 months out of the year in the pessimistic scenario. Similarly, it was assumed that the NEA purchases energy for 11 months out of the year in the most likely scenario, and the NEA purchases power for all 12 months of the year in the optimistic scenario.
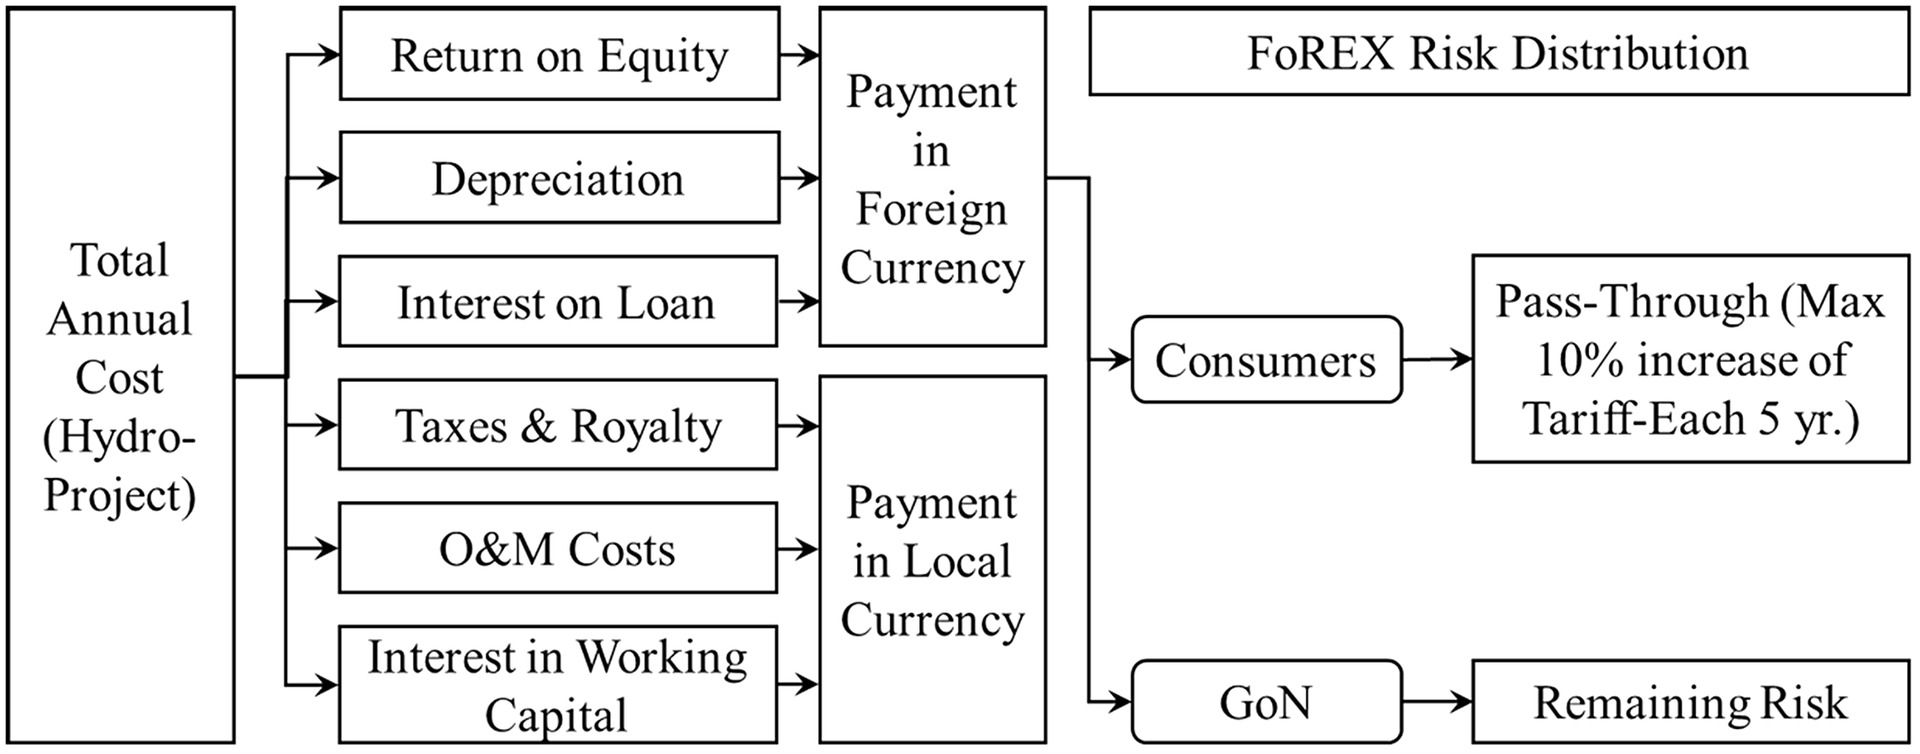
This payment structure allows for payment of different project costs in specific currency denominations. For hydropower projects financed in foreign currencies, return on equity, depreciation, and loan interests are the costs realized in the foreign currency (Fig. 4). After debt repayment, depreciation and return on equity remain the two sources of FoREX exposure. Distinguishing these costs and their denomination provides an opportunity to address the specific sources of exposure systematically, which is unattainable through a payment structure utilizing currency mix ratios. Moreover, making payments based on actual audited costs that meet predefined financial covenants enables the public sector to benefit from possible cost savings achieved by the project company during the operation period.
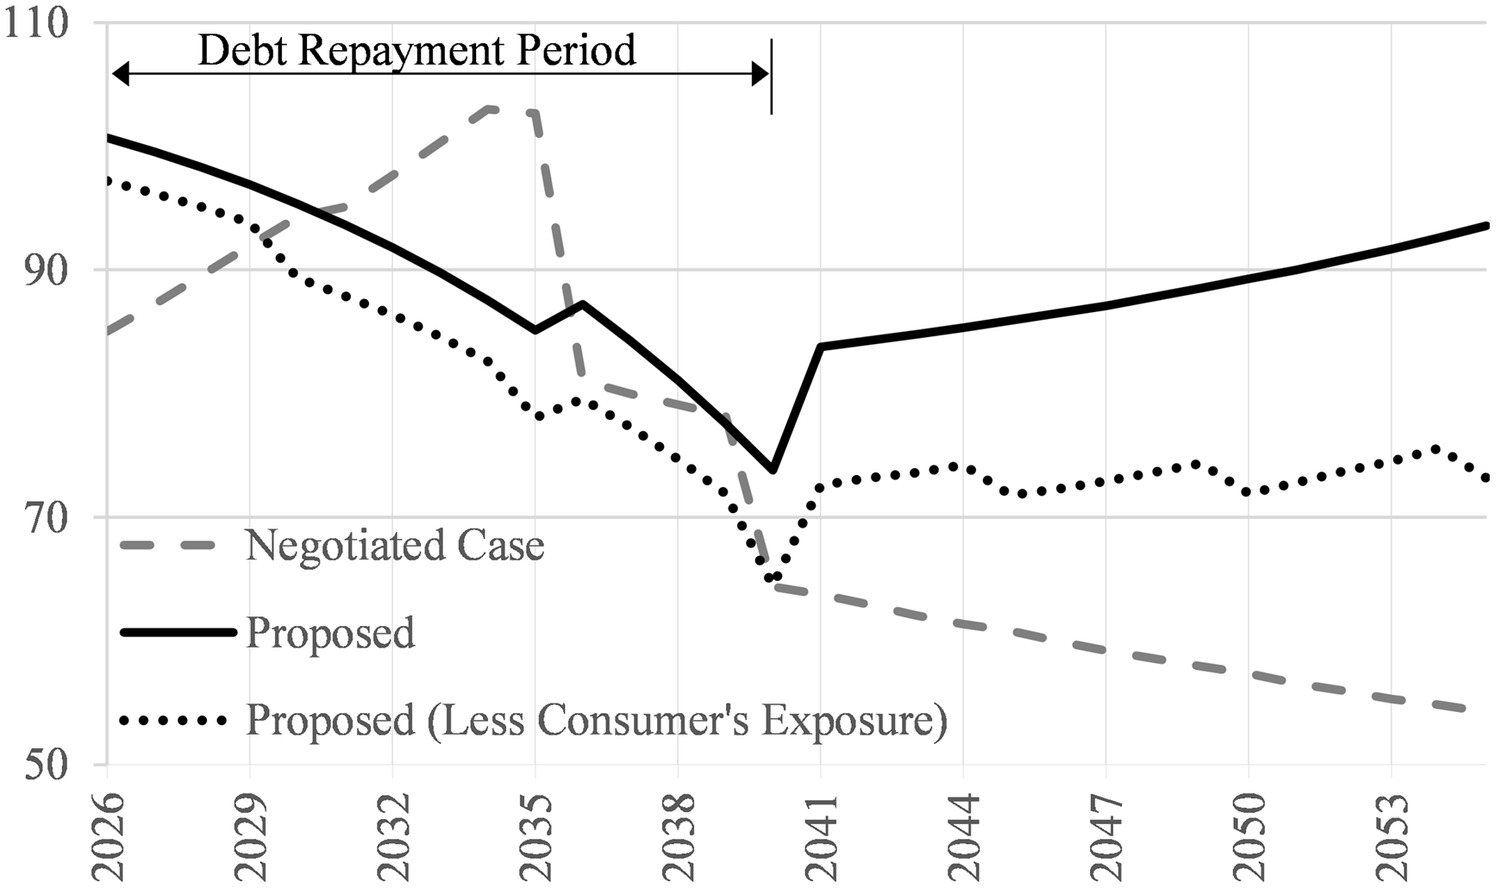
A comparison of the simulated mean annual payment receipts of the project company during the concession period is shown in Fig. 5. The proposed front-loaded payment structure declines as interest payments diminish through debt repayment and increases until the concession ends. Consequently, the annual payment stream remains roughly uniform after debt repayment because none of the FoREX risks are transferred to the project company. In the case of the negotiated free-energy agreement currently in practice, payments are shown to increase for the first 10 years due to the escalation enabled through posted rates, and none of the currency risk is transferred to the project company. However, the payment stream erodes significantly after 10 years, subject to the FoREX risk and the obligation to deliver free energy.
If FoREX exposure is not transferred to consumers, the net payment obligations for the public sector (GoN and NEA) in the proposed mechanism remain higher, on average, compared with the negotiated free-energy agreement. By having limited transfers in place, net payment obligations for the public sector during debt repayment are reduced in comparison with the free-energy agreements. Similarly, owing to such a transfer, the net payment obligations for the public sector after debt repayment fall to roughly half the level of the free-energy agreement and the scenario in which consumers do not bear any currency risk. Savings in the net payment incurred during debt repayment and payment reductions after debt repayment tend to equalize or reduce the total payment of the public sector compared with the free-energy agreement. The net present value of such obligations is compared and discussed in the next section.
Financial Analysis: Results, Sensitivity Analysis, and Scenario Comparisons
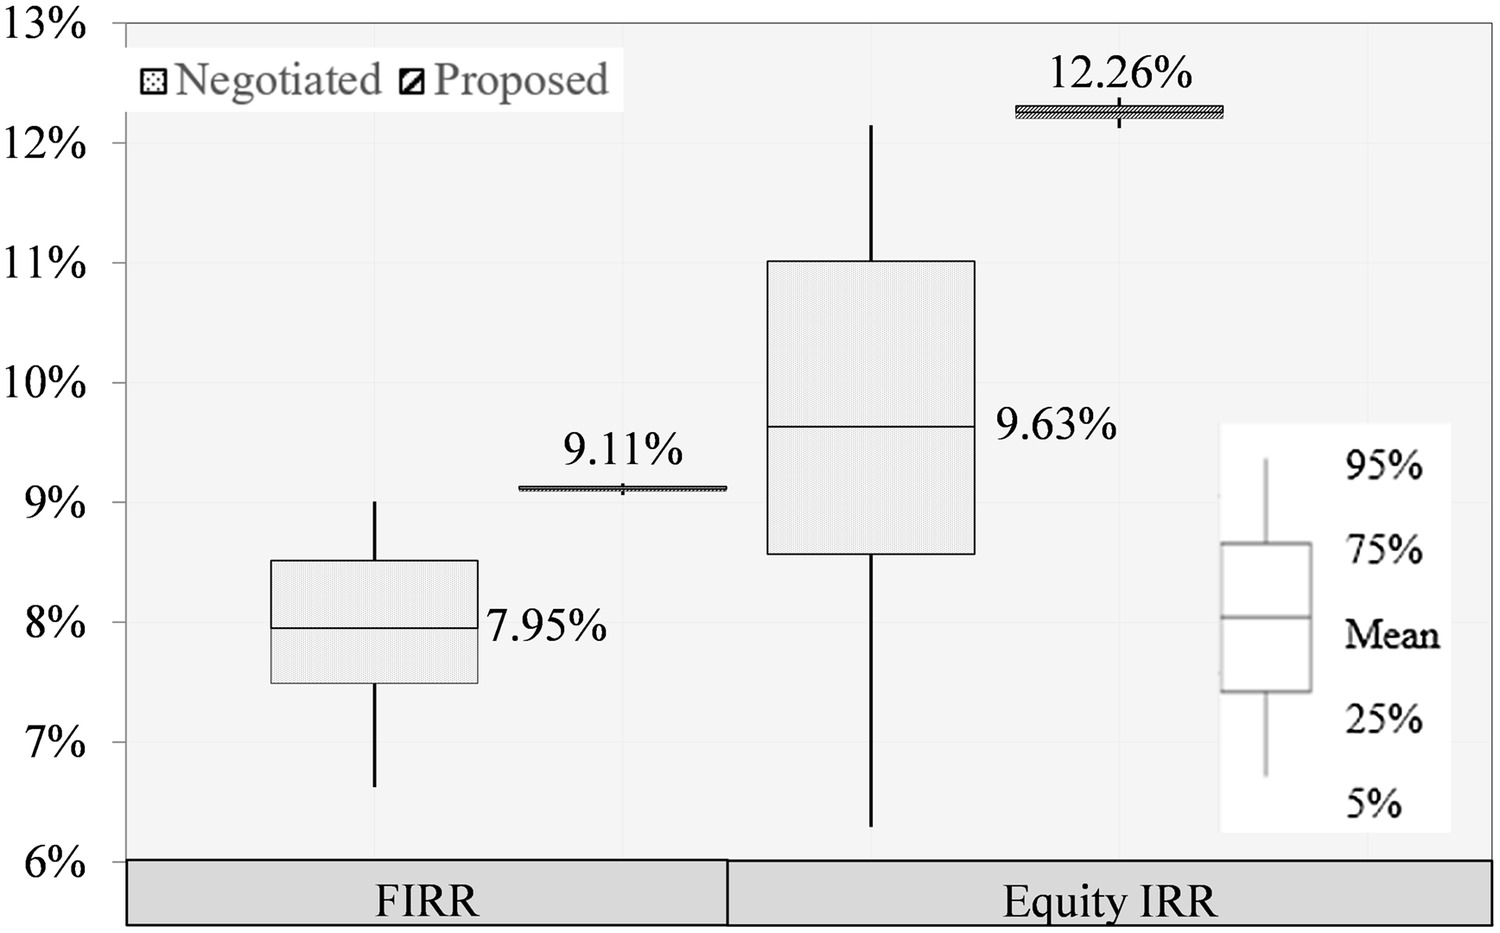
The assumptions and proposed model were applied to UT-1, and the potential financial impacts were compared with the financial performance expectations of the negotiated free-energy agreement. The estimated RoE of UT-1 is 17.07% [when there is a 90% probability of a return on investment () to lie in between 10% and 12%]. A comparison of the estimated FIRR of the project between the negotiated free-energy agreement and proposed scheme is shown in Fig. 6. Using the proposed risk-allocation strategy wherein the public sector absorbs significant commercial risk, a mean FIRR and internal rate of return on equity (equity IRR) of 9.11% and 12.26%, respectively, can be achieved with minimum volatility. The mean FIRR value exceeds the discount rate, making the project financially viable. In comparison with the free-energy agreement, the proposed allocation strategy is more attractive to sponsors because it provides a fixed level of return.
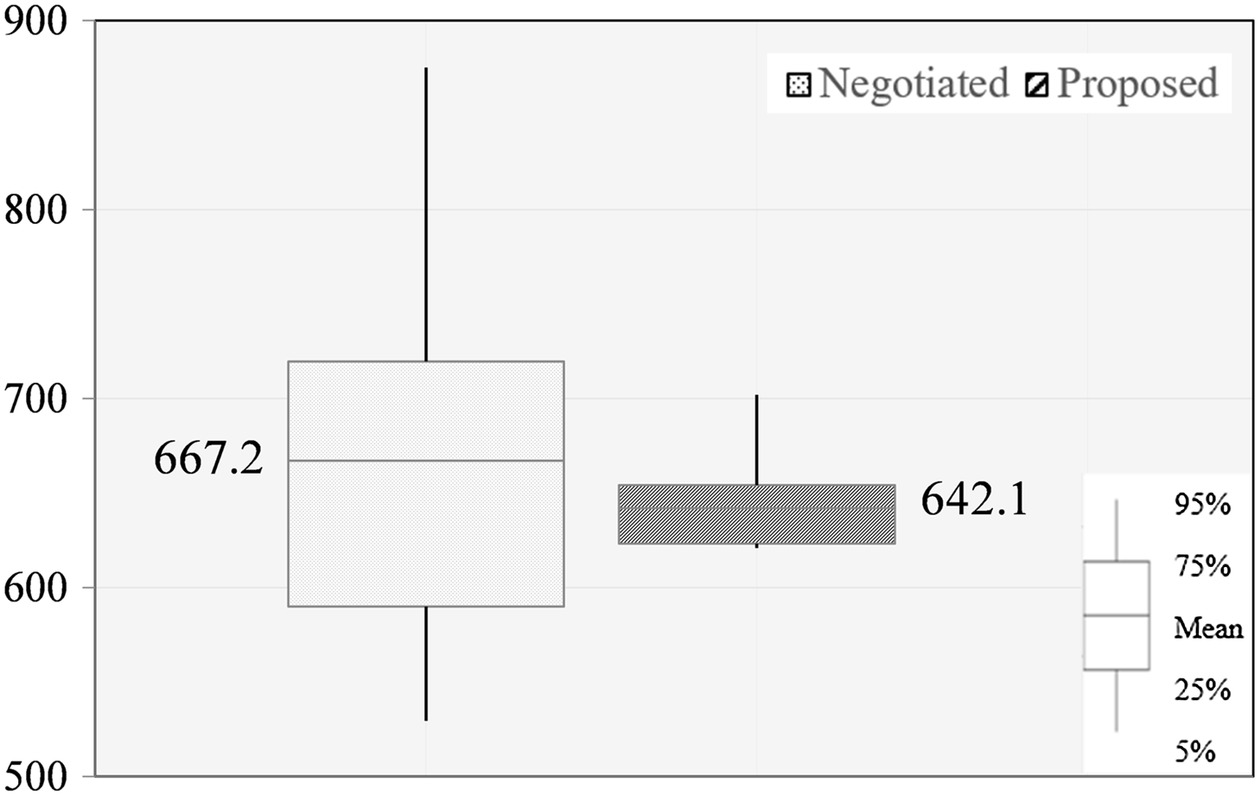
We compared the net payment obligation of the public sector between the free-energy agreement and the proposed model (Fig. 7). The figures show that the NPV of the net annual payment made by the public sector to the project company in the proposed model is lower in terms of both the mean value and volatility. The partial transfer of FoREX exposure to consumers and the redistribution of annual payment streams through cost-plus-regulated returns enable the public sector to minimize its net payment obligations.
Sensitivity Analysis: Time and Cost
Fig. 8 illustrates how the RoE value varied in response to different loan tenors and changes in project costs. The sensitivity analysis shows that RoE is more sensitive to changes in loan tenors than project costs. A higher RoE for shorter loan tenors reflects higher tariffs because of the need to complete debt servicing with early payments. For project costs, virtually no change to RoE is observed for a 15-year tenor with changes to estimated costs that reflect the numbers published in the feasibility study report of UT-1. The minimal sensitivity is due to tariff payments or cost components that increase or decrease in proportion to the change in total project cost.
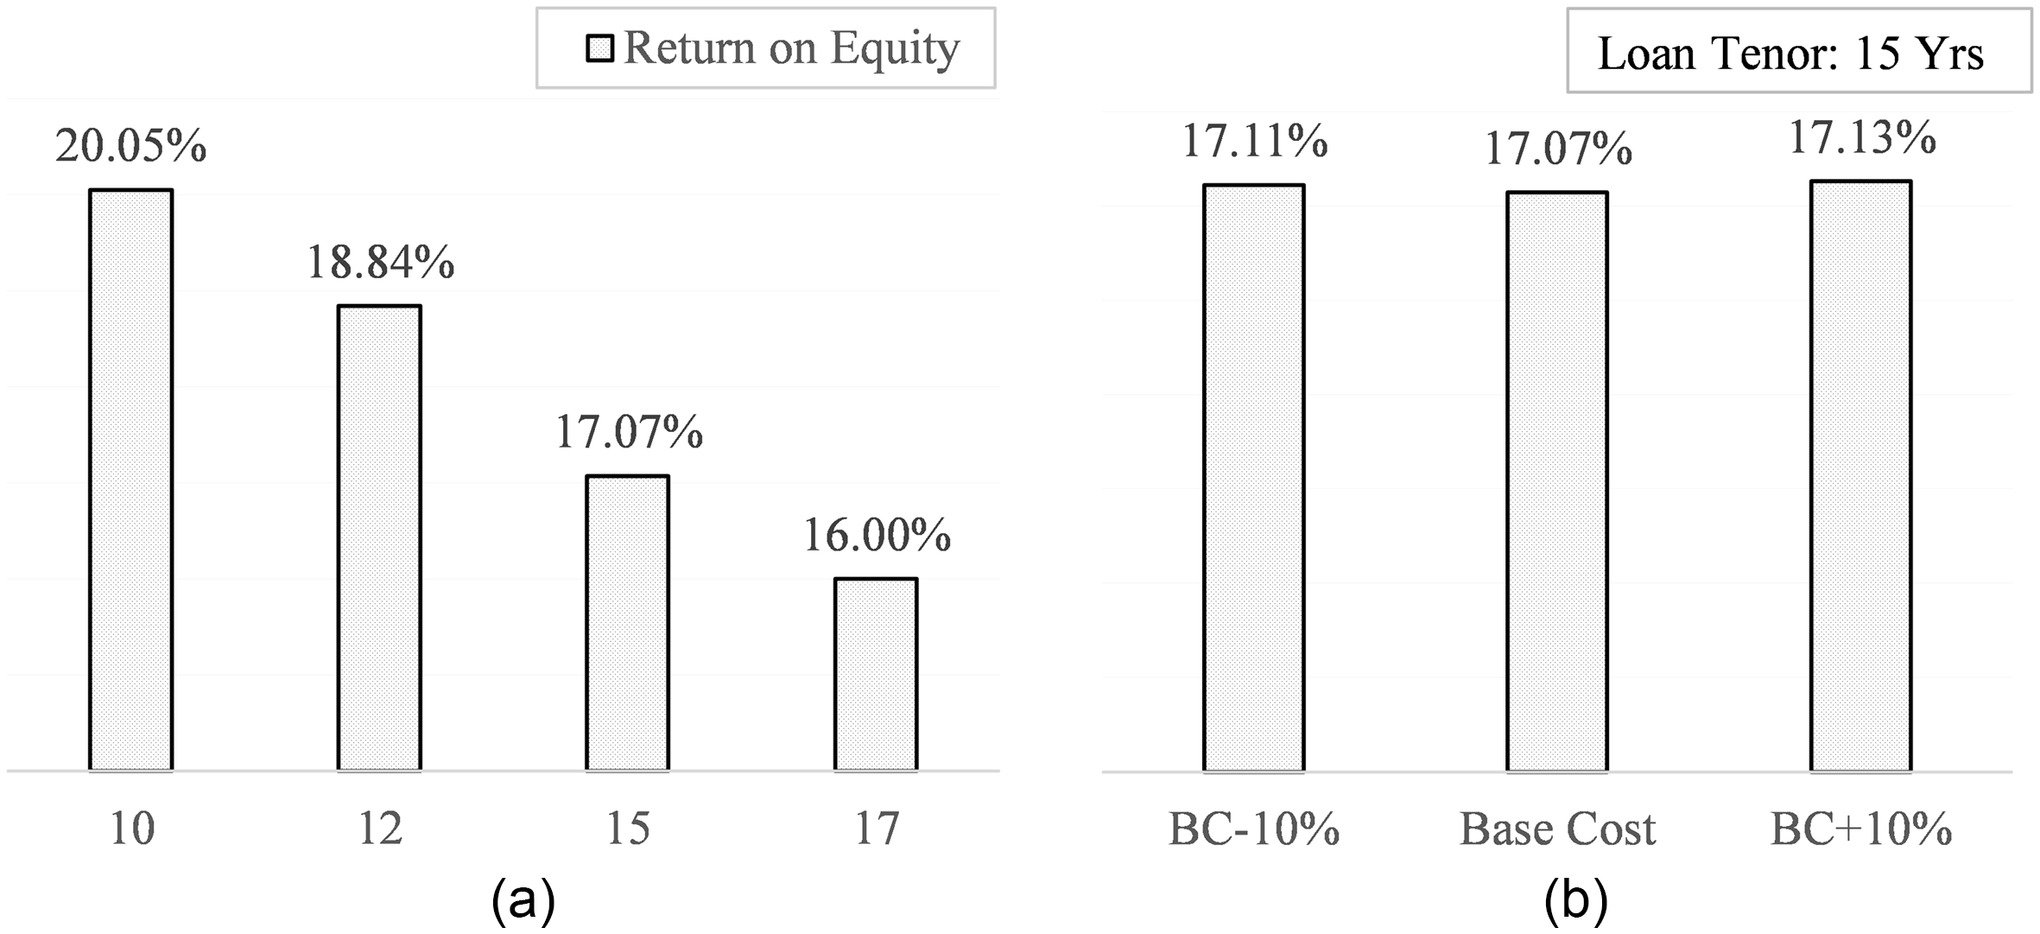
These results suggest that, given constant interest rates, a longer loan tenor could allow the public sector to pay less RoE to the sponsors to deliver a constant range of return on investment. However, investors are reluctant to lend to private-sector projects with a loan tenor longer than 15 years and tend to charge higher interest rates for such loans. Therefore, the calculation described subsequently assumed a tenor of 15 years.
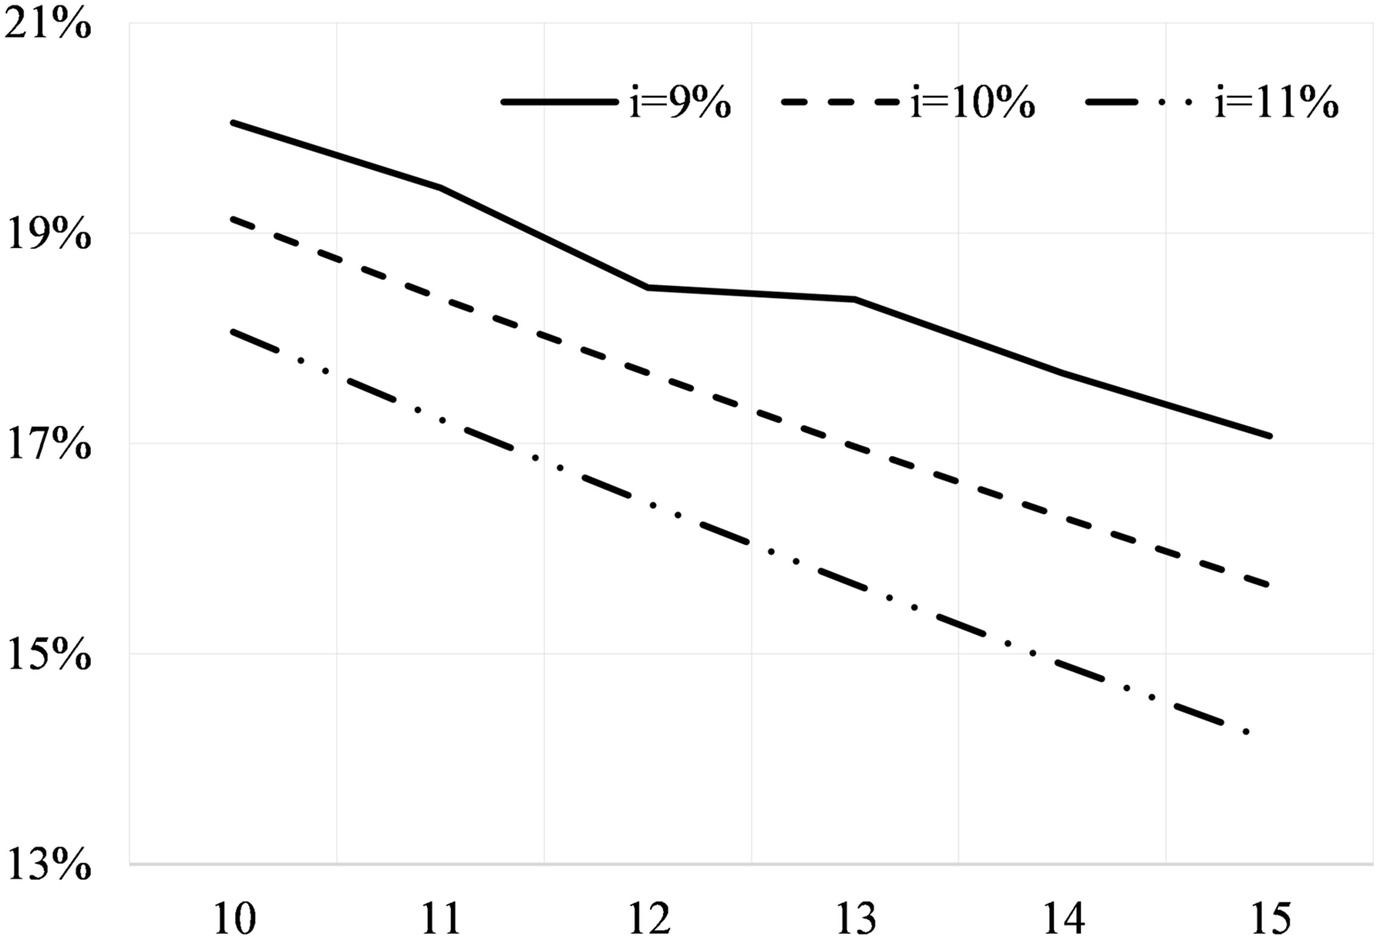
Fig. 9 shows the effect of different interest rate scenarios on the RoE values. The results show that the RoE for a given loan tenor of 15 years decreased corresponding to the increase in interest rates (i.e., RoE was 17.07%, 15.65%, and 14.18% for interest rates of 9%, 10%, and 11%, respectively). As described previously, owing to the optimizing constraint utilized in the model, the total additional value from the project remained constant in the range of 10%–12%. Higher interest payments in total tariffs during debt repayments reduce the value of the RoE component to maintain a constant project value. Against an expensive loan in the proposed model, sponsors lose the incentive to receive a higher return. Consequently, sponsors would need to find inexpensive financing sources to attain better RoE. Given the exchange rate guarantee available under the proposed risk allocation, sponsors should be able to negotiate for lower interest rates (Grimsey and Lewis 2002).
Comparing Downside Risk across Project Scenarios
If exchange rates fluctuate significantly and a local currency depreciates after signing the PPA, cash flows from the project are exposed to downside risk. The mean NPV value of downside risk to the GoN in the proposed risk-allocation mechanism was estimated and compared with the negotiated free-energy agreement (Fig. 10). The mean NPV value of downside risk and its corresponding volatility for the base cost (BC) case and the BC+10% case are higher than that of the free-energy agreement. The volatility is higher because in the proposed model, the GoN fully bears FoREX risk for a 30-year concession period, whereas in the free-energy agreement, the public sector, NEA, and GoN jointly bear such risks for the first 10 years of operation.
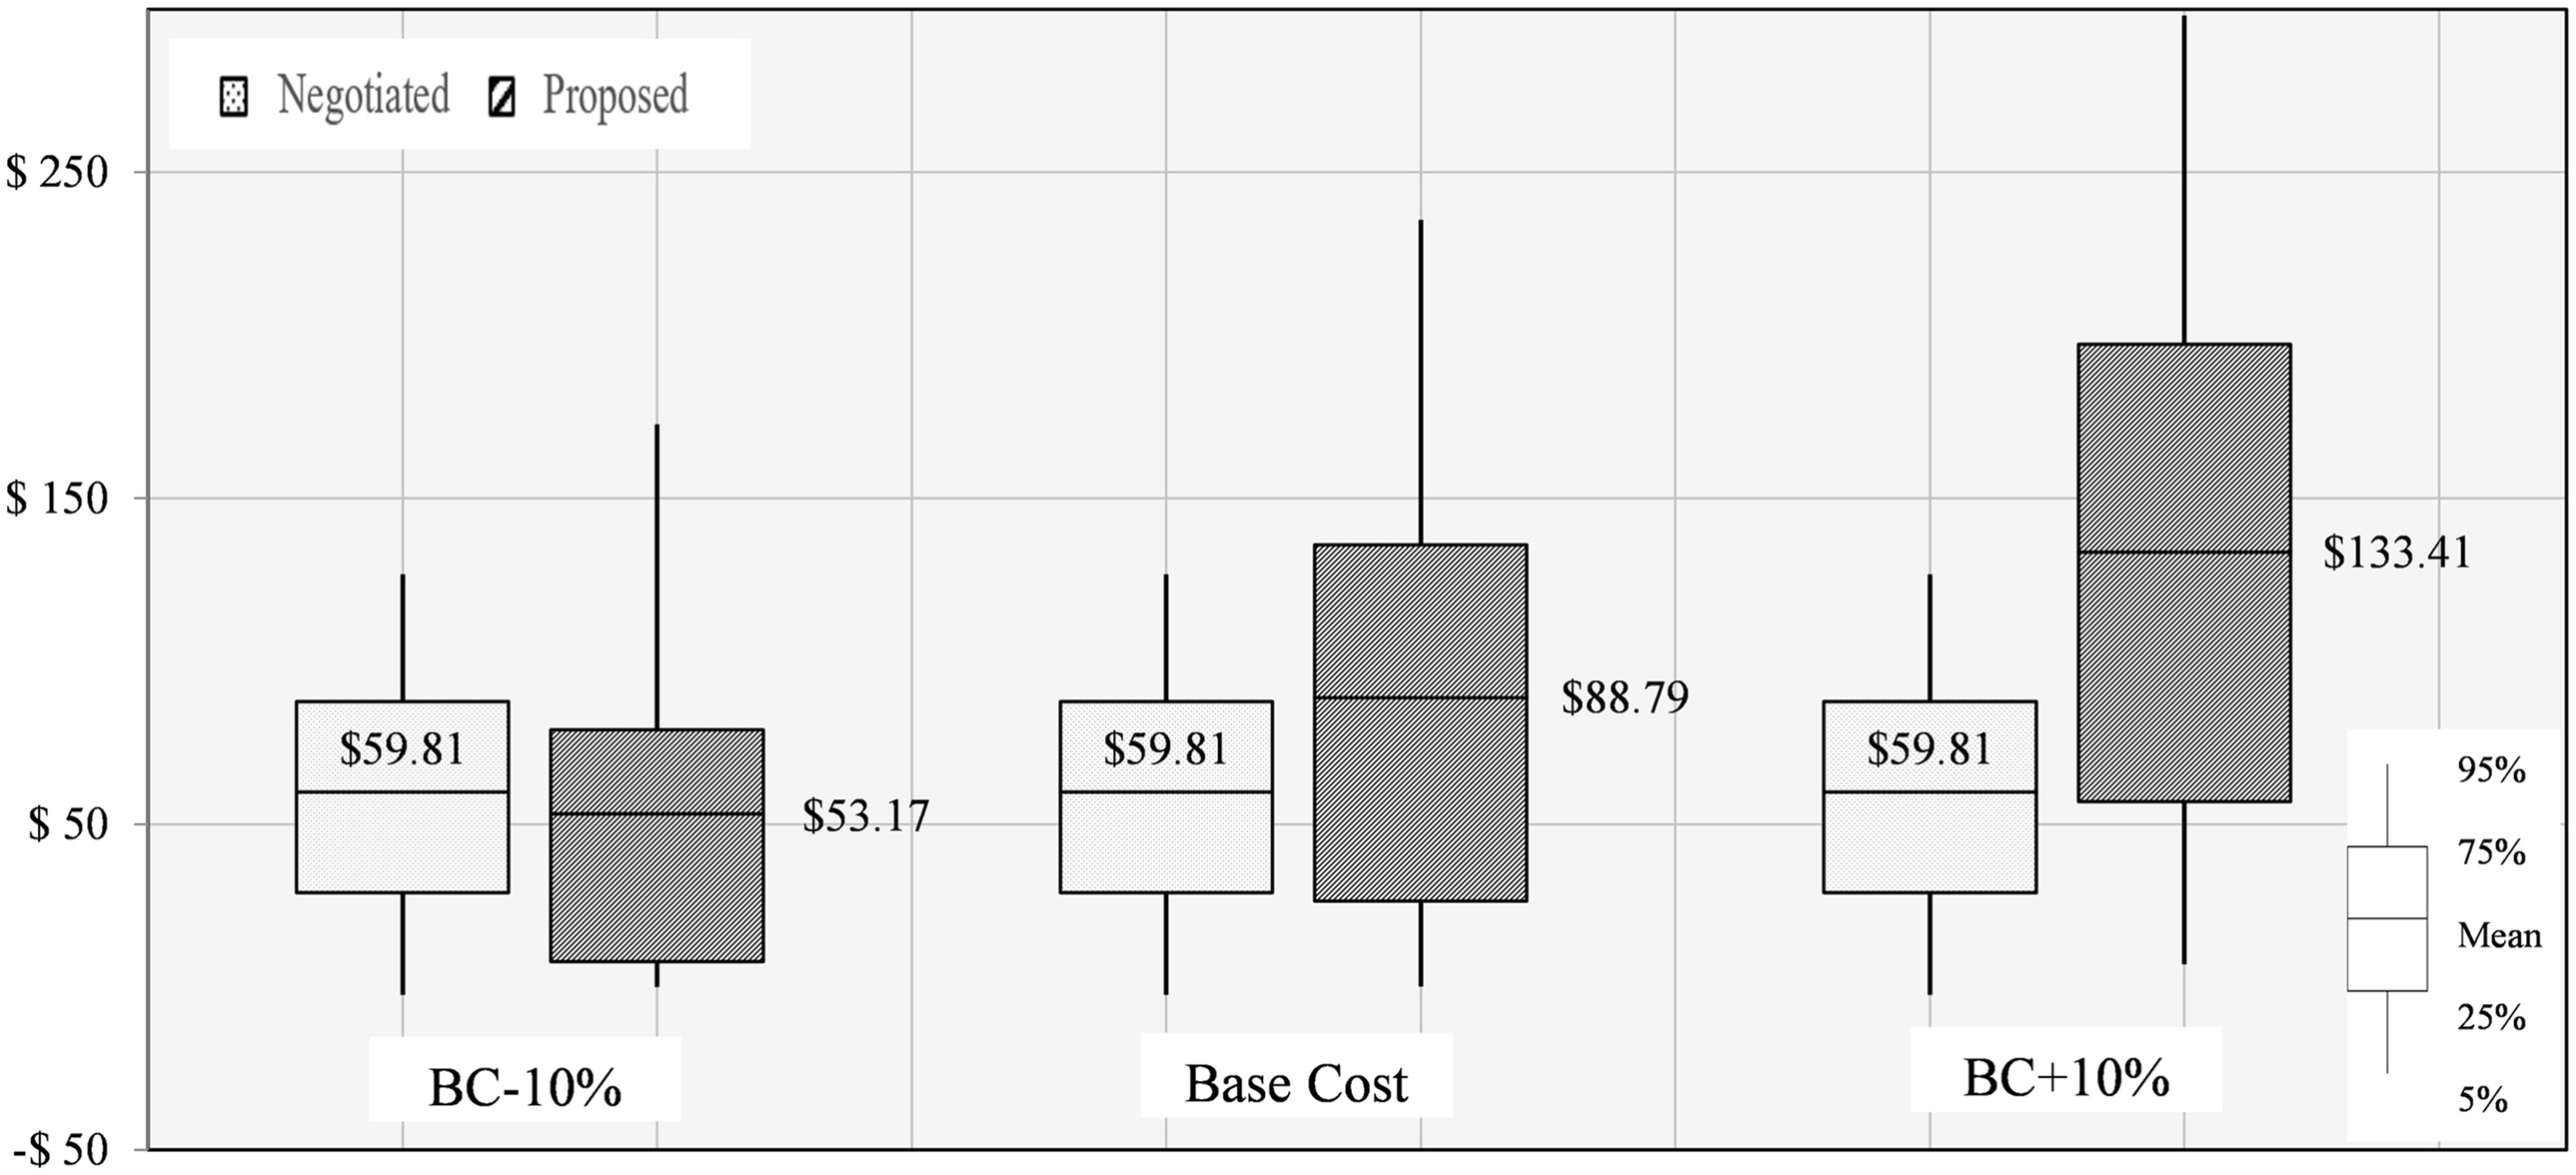
The results show that the expected downside risk to the GoN increased as project cost increased. However, because the PPA for the project is finalized prior to construction and the risks of cost overruns are allocated to the EPC contractor, the public sector is dissociated from increases in project costs, and the downside risk estimated for the operation phase remains constant. Therefore, the downside risk to the public sector once a PPA is signed corresponds to that of the base cost scenario. Moreover, in the free-energy agreement, downside risk is independent of project costs and solely dependent on the revenue paid to the project company, which remains constant owing to fixed posted rates and roughly uniform annual energy generation.
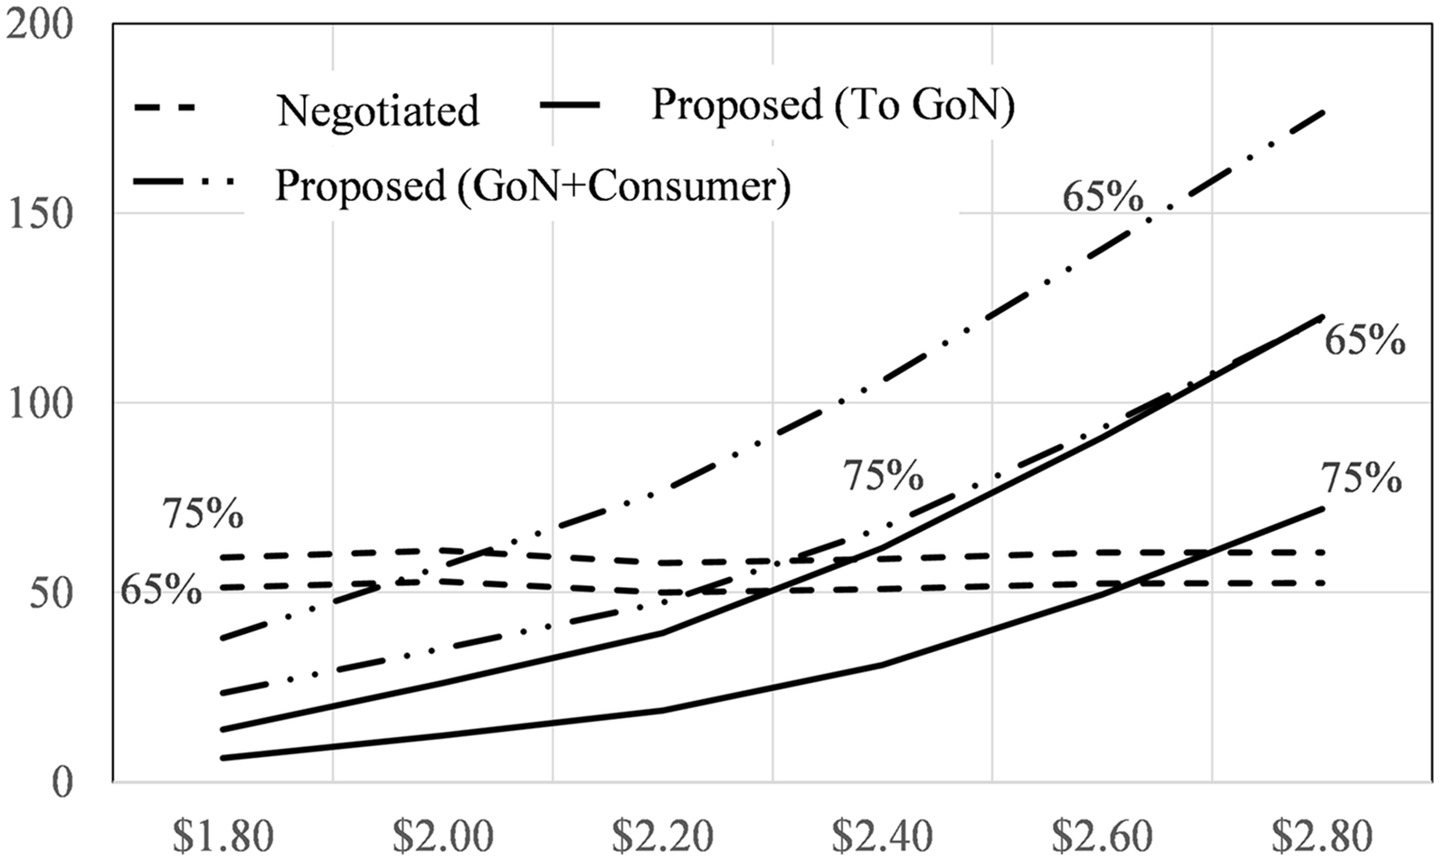
We extended the sensitivity analysis to determine the impact of different project scenarios on the NPV and downside risks to the GoN. Cost scenarios are represented by differences in the per-MW cost of the project, and the corresponding revenue scenarios are influenced on the plant factor. The cost of UT-1 is estimated at approximately USD 2.99 million per MW, which is higher than the USD 1.80–2.30 million costs incurred by other developers (Gautam and Karki 2004; Ojha 2020). The project was delayed for over 8 years prior to beginning construction, which increased project costs by almost 30% (Thapa 2020). The plant factor of the project is the ratio of the total annual energy generated to the total annual energy per rated capacity. The plant factor of hydropower plants in Nepal is typically in the range of 65%–75% (NEA 2019).
Fig. 11 shows that for the projects in a normal cost range, i.e., USD 1.80–2.30 million per MW, the downside risk to the GoN in the proposed model is lower than that of the free-energy agreement. Similarly, the combined total downside risk to the GoN and consumers is lower than that of the free-energy agreement for a project with a plant factor of 75% and cost below USD 2.30 million per MW. The results show that under the proposed mechanism, the public sector must prioritize projects within the normal cost range with a higher plant factor. This will enable sharing FoREX risk to attract foreign investment and minimize downside risks for both the GoN and consumers.
Discussion: Benefits and Feasibility of the Proposed Approach
The good-for-all model proposed in this paper revealed several benefits for key hydropower stakeholders. First, because the approach transfers some FoREX risk to the consumers and the GoN, PPA negotiations should become relatively simpler and less arduous. Subsequently, after partially transferring FoREX exposure to the consumers, downside risks are reduced for GoN, and project sponsors can receive a fixed RoE throughout the concession period without any FoREX exposure. In addition, capacity payments would ensure the recovery of capital costs and guarantee essential cash flows for the project company in the event of a significant decline in water discharge due to hydrological risks.
Under the proposed approach, the offtake risk generated from the obligation to pay capacity payments would be equivalent (or smaller) to the offtake risk currently being borne by the NEA through the take-or-pay PPA. Because no FoREX exposure is allocated to the NEA under the proposed approach, the total magnitude of financial risk for the NEA would be reduced. Therefore, our approach should be more attractive to sponsors compared with the existing approach, but the public sector’s risk exposure would be similar, or even reduced given that economical projects are selected.
The discussion on adopting a two-part tariff policy based on cost-plus regulated returns is not new in Nepal. A task force was constituted in December 2008 with members representing the GoN, NEA, independent power producers, and consumers. The task force formulated and proposed a 10-year hydropower development plan (MoEWRI 2008) that recommended the immediate adoption of a similar tariff policy for projects greater than 25 MW as a means of encouraging hydropower sponsors by guaranteeing reasonable returns. The task force report recommended that consumer tariffs reflect foreign exchange rate variations. This also suggests a level of agreement within the industry to enable the transfer of FoREX risk to consumers. However, this tariff policy was not implemented because of the lack of an independent regulatory authority that could ensure the transparent determination and approval of tariffs.
However, the current tariff determination process has benefited from enhanced transparency due to the formation of an independent regulatory authority, the Electricity Regulatory Commission (ERC), in 2017. The ERC must review and approve tariff agreements negotiated between the project company and the NEA. Similarly, open public consultations are conducted for determining tariffs. Thus, under the current institutional arrangement, adoption of the proposed approach is feasible, although it is necessary to reinforce the cost-auditing capacity of both the NEA and ERC for effective implementation.
Conclusion
Developing countries such as Nepal must carefully consider the management of FoREX risk for BOOT/PPP infrastructure projects to attract and effectively utilize international investments. For the Nepalese market, higher currency devaluation risks and the unavailability of derivative markets to hedge FoREX risk present significant exposure for prospective financiers of BOOT hydropower projects. We proposed a feasible solution to allocate FoREX exposure in BOOT hydropower projects, which better ensures minimum reasonable returns to sponsors and minimizes downside risks for the public sector. A comparison of the impact of the proposed risk-allocation mechanism on financial indicators against the existing risk-allocation mechanism was illustrated through a case study and financial analysis of the UT-1 hydropower project.
The simulated application of our proposed risk-allocation mechanism to the UT-1 project demonstrates that the proposed approach should be more attractive to sponsors than current practice. Downside risks for the public sector and consumers can be substantially reduced if economic projects are selected and projects are implemented in a timely manner. We also posit that recent developments led by the Nepalese government’s task force suggest that the proposed approach is feasible within the current institutional context.
The merits of the proposed risk-allocation approach should benefit Nepalese public-sector stakeholders responsible for the promotion of foreign investment by offering a balanced yet attractive risk-return structure to investors interested in financing BOOT/PPP hydropower projects. Moreover, similar payment structures that can account for differences in the currency of realized costs and the operationalization of risk-return trade-offs through stochastic optimization can be applied to other types of BOOT/PPP infrastructure projects. Future studies should explore and investigate the applicability and generalizability of the proposed approach under different financing options employed for PPP projects.
Data Availability Statement
The data and models that support the findings of this study are available from the corresponding author upon request. Data on the exchange rate of USD versus NPR are available here: https://www.nrb.org.np/forex.
Acknowledgments
This paper is a part of the master’s thesis of the corresponding author, who acknowledges the receipt of the ADB-JSP Scholarship for his study at the University of Tokyo, Japan.
References
Albalate, D., G. Bel, P. Bel-Piñana, and R. R. Geddes. 2015. “Risk mitigation and sharing in motorway PPPs: A comparative policy analysis of alternative approaches.” J. Comp. Policy Anal. 17 (5): 481–501. https://doi.org/10.1080/13876988.2015.1010788.
Ameyaw, E. E., and A. P. C. Chan. 2015. “Evaluation and ranking of risk factors in public-private partnership water supply projects in developing countries using fuzzy synthetic evaluation approach.” Expert Syst. Appl. 42 (12): 5102–5116. https://doi.org/10.1016/j.eswa.2015.02.041.
Aslan, C., and D. Duarter. 2014. How do countries measure, manage, and monitor fiscal risks generated by public-private partnerships?. Washington, DC: World Bank.
Bing, L., A. Akintoye, P. J. Edwards, and C. Hardcastle. 2005. “The allocation of risk in PPP/PFI construction projects in the UK.” Int. J. Project Manage. 23 (1): 25–35. https://doi.org/10.1016/j.ijproman.2004.04.006.
BPC (Butwal Power Company). 2019. Annual report 2018-2019. Kathmandu, Nepal: Butwal Power Company.
Carbonara, N., N. Costantino, and R. Pellegrino. 2014. “Concession period for PPPs: A win-win model for a fair risk sharing.” Int. J. Project Manage. 32 (7): 1223–1232. https://doi.org/10.1016/j.ijproman.2014.01.007.
Carbonara, N., and R. Pellegrino. 2018. “Revenue guarantee in public–private partnerships: A win–win model.” Construct. Manage. Econ. 36 (10): 584–598. https://doi.org/10.1080/01446193.2018.1467028.
Chowdhury, A. N., and C. Charoenngam. 2009. “Factors influencing finance on IPP projects in Asia: A legal framework to reach the goal.” Int. J. Project Manage. 27 (1): 51–58. https://doi.org/10.1016/j.ijproman.2008.01.011.
Chowdhury, A. N., P. H. Chen, and R. L. K. Tiong. 2015. “Credit enhancement factors for the financing of independent power producer (IPP) projects in Asia.” Int. J. Project Manage. 33 (7): 1576–1587. https://doi.org/10.1016/j.ijproman.2015.04.007.
Cooper, D., S. Grey, G. Raymond, and P. Walker. 2005. Project risk management guidelines: Managing risk in large projects and complex procurements. West Sussex, UK: Wiley.
Ehrlich, M. 2010. “Estimation of foreign exchange exposure for public - private partnership infrastructure projects.” Doctoral dissertation, Dept. of Civil Engineering, Nanyang Technological Univ.
Gautam, U., and A. Karki. 2004. Hydropower pricing in Nepal. Kathmandu, Nepal: Jalsrot Vikas Sanstha.
Gray, P., and T. Irwin. 2003a. Exchange rate risk: Allocating exchange rate risk in private infrastructure projects, 266. Washington, DC: World Bank.
Gray, P., and T. Irwin. 2003b. Reviewing the record for private infrastructure contracts, 262. Washington, DC: World Bank.
Grimsey, D., and M. K. Lewis. 2002. “Evaluating the risks of public private partnerships for infrastructure projects.” Int. J. Project Manage. 20 (2): 107–118. https://doi.org/10.1016/S0263-7863(00)00040-5.
Gupta, J. P., and A. K. Sravat. 1998. “Development and project financing of private power projects in developing countries: A case study of India.” Int. J. Project Manage. 16 (2): 99–105. https://doi.org/10.1016/S0263-7863(97)00030-6.
Hahm, J. 2003. “Private participation in the infrastructure programme of the Republic of Korea.” Transport Commun. Bull. Asia Pac. 72: 57–75.
Hobman, E. V., E. R. Frederiks, K. Stenner, and S. Meikle. 2016. “Uptake and usage of cost-reflective electricity pricing: Insights from psychology and behavioural economics.” Renewable Sustainable Energy Rev. 57 (May): 455–467. https://doi.org/10.1016/j.rser.2015.12.144.
Irwin, T. C. 2007. Government guarantees: Allocating and valuing risk in privately financed infrastructure projects. Washington, DC: World Bank.
Lam, P. T. I. 1999. “A sectoral review of risks associated with major infrastructure projects.” Int. J. Project Manage. 17 (2): 77–87. https://doi.org/10.1016/S0263-7863(98)00017-9.
Mas, I. 1998. “Managing exchange rate and interest rate related project exposure: Are guarantees worth the risk?” In Dealing with public risk in private infrastructure, edited by T. Irwin, M. Klein, G. E. Perry, and M. Thobani, 109–128. Washington, DC: World Bank.
Matsukawa, T., R. Sheppard, and J. Wright. 2003. Foreign exchange risk mitigation for power and water projects in developing countries. Washington, DC: World Bank.
MoEWRI (Ministry of Energy Water Resource and Irrigation). 2008. Program formulation for ten years hydro-electricity development-Task force report. Kathmandu, Nepal: MoEWRI.
MoEWRI (Ministry of Energy Water Resource and Irrigation). 2016. Project development agreement, Upper Trishuli-1 hydropower project. Kathmandu, Nepal: MoEWRI.
NEA (Nepal Electricity Authority). 2017. Foreign currency PPA template. Kathmandu, Nepal: NEA.
NEA (Nepal Electricity Authority). 2019. Generation directorate fiscal year 2018/19. Kathmandu, Nepal: NEA.
Neupane, A. 2013. “The necessity of/and challenges to international project financing of hydropower projects in Nepal.” J. Water Energy Environ. 13 (Jul): 16–19. https://doi.org/10.3126/hn.v13i0.10033.
Ng, A., and M. Loosemore. 2007. “Risk allocation in the private provision of public infrastructure.” Int. J. Project Manage. 25 (1): 66–76. https://doi.org/10.1016/j.ijproman.2006.06.005.
Ojha, K. P. 2020. “An analysis of hydro-energy deficit in Nepal.” Pravaha 26 (1): 101–108. https://doi.org/10.3126/pravaha.v26i1.41864.
Park, H. 2012. Government supports for PPP projects in Korea. Bangkok, Thailand: United Nations Economic and Social Commission for Asia and the Pacific.
Tavakoli, N., and S. H. Hosseini Nourzad. 2020. “Win-win pricing method for BOT projects using a simulation-based evolutionary optimization.” Construct. Manage. Econ. 38 (2): 157–171. https://doi.org/10.1080/01446193.2019.1657234.
Thapa, B. 2020. “Is FDI in Hydro justified?” The Annapurna Express. Accessed April 6, 2021. https://theannapurnaexpress.com/news/anniversary-special-is-fdi-in-hydro-justified-2203.
Vassallo, J. M., J. Heras-Molina, L. Garrido, and J. Gomez. 2020. “Urban toll highway concession system in Santiago, Chile: Lessons learned after 15 years.” J. Infrastruct. Syst. 26 (2): 05020004. https://doi.org/10.1061/(ASCE)IS.1943-555X.0000540.
Wang, S. Q., and L. K. Tiong. 2000. “Case study of government initiatives for PRC’s BOT power plant project.” Int. J. Project Manage. 18 (1): 69–78. https://doi.org/10.1016/S0263-7863(98)00072-6.
Wang, S. Q., R. L. K. Tiong, S. K. Ting, and D. Ashley. 2000. “Foreign exchange and revenue risks: Analysis of key contract clauses in China’s BOT project.” Construct. Manage. Econ. 18 (3): 311–320. https://doi.org/10.1080/014461900370672.
Ward, S., C. B. Chapman, and B. Curtis. 1991. “On the allocation of risk in construction projects.” Int. J. Project Manage. 9 (3): 140–147. https://doi.org/10.1016/0263-7863(91)90038-W.
WECS (Water and Energy Commission Secretariat). 2019. Assessment of hydropower potential of Nepal. Kathmandu, Nepal: WECS.
World Bank. 2015. UT1 aide memoire. Washington, DC: World Bank.
World Bank. 2019. Nepal infrastructure sector assessment: Private sector solutions for sustainable infrastructure development. Washington, DC: World Bank.
Zhang, X. 2005. “Critical success factors for public–private partnerships in infrastructure development.” J. Constr. Eng. Manage. 131 (1): 3–14. https://doi.org/10.1061/(ASCE)0733-9364(2005)131:1(3).
Information & Authors
Information
Published In
Journal of Infrastructure Systems
Volume 29 • Issue 2 • June 2023
Copyright
This work is made available under the terms of the Creative Commons Attribution 4.0 International license, https://creativecommons.org/licenses/by/4.0/.
History
Received: Feb 12, 2022
Accepted: Dec 24, 2022
Published online: Feb 13, 2023
Published in print: Jun 1, 2023
Discussion open until: Jul 13, 2023
ASCE Technical Topics:
- Business management
- Case studies
- Construction engineering
- Construction management
- Developing countries
- Disaster risk management
- Energy engineering
- Energy sources (by type)
- Engineering fundamentals
- Financial management
- Hydro power
- Investments
- Methodology (by type)
- Practice and Profession
- Project management
- Public administration
- Public health and safety
- Renewable energy
- Research methods (by type)
- Risk management
Authors
Metrics & Citations
Metrics
Citations
Download citation
If you have the appropriate software installed, you can download article citation data to the citation manager of your choice. Simply select your manager software from the list below and click Download.