Abstract
Sewer bend manholes are frequent elements of urban drainage systems. Any deviation of straight-lined supercritical flow, as within the manhole, generates shock waves, possibly impinging at the manhole end or imposing a hydraulic jump. Then the free-surface flow regime abruptly breaks down and backwater effects occur. Thus it is important to know the maximum discharge that safely can pass across a bend manhole, as a function of its geometry, without generating collapsing flow. This study conducted calibrated numerical simulations to assess the hydraulic features of supercritical bend manholes with variable deflection angles, curvature radii, and lengths of straight downstream extension elements. The numerical model was validated previously with data from analogous physical model tests documented in the literature. The combined data from the numerical simulation and from the physical model indicated a hydraulic capacity of the bend manholes for different geometrical setups. It was demonstrated that the hydraulic capacity of a bend manhole increases with increased curvature radii and straight extension lengths, whereas the effect of the deflection angle is less significant. A multiple regression technique provided an empirical equation indicating the normalized discharge capacity of supercritical bend manholes as a function of the governing geometrical parameters, along with the approach flow filling ratio.
Introduction
Sewer structure hydraulics is a classical topic in hydraulic engineering. Drops, bends, and combining and dividing elements are implemented within urban drainage systems for different purposes. Some of these are rare and hydraulically complex, whereas others are frequent and have clear flow features. The latter include bend manholes (BMs), placed where the sewer changes direction. The deflection is realized inside a manhole in which, if the approach flow is supercritical, free-surface instabilities and irregular flow phenomena might occur. These disturb the free-surface flow, potentially provoking flow chocking (Hager 2010).
To date, bend manholes typically have been investigated by performing physical model tests. Studies related to the present approach are as follows:
•
Del Giudice et al. (2000) studied 45° and 90° supercritical bend manholes with a curvature radius , where is the axial bend curvature radius, and is the pipe diameter, which is constant within the manhole. The curved part was a U-shaped section. Empirical equations to predict the main flow features, such as the wave height and the maximum manhole capacity, were provided. Additionally, the installation of a horizontal cover plate limiting the shock wave height was discussed.
•
•
Practical guidelines to design bend manholes with supercritical flow were given by Hager and Gisonni (2005), summarizing previous physical model investigations.
In addition to manhole bends, the literature has documented the hydraulic behavior of conduit bends (circular or rectangular section) and the possible measures to control the flow pattern. Beltrami et al. (2007) investigated the efficiency of special water flaps placed upstream from supercritical rectangular bends to reduce the maximum shock wave height. Ghaeini Hessaroeyeh and Tahershamsi (2009) and Ghaeini-Hessaroeyeh et al. (2011) proposed an analytical approach and a two-dimensional numerical model, respectively, to predict the free-surface profile along the outer wall of rectangular bends. Reza Jaefarzadeh et al. (2012) showed that the addition of a convex corner to the inner wall of rectangular bends reduced the wave height. Kolarevic et al. (2015) analyzed the supercritical flow behavior across a circular-shaped pipe bend by varying the bend curvature radius and the deflection angle in a physical model. The hydraulic conditions led to helical flow with a shock front rotation around the pipe axis, finally resulting in choking (breakdown of the free-surface flow and abrupt transition to pressurized flow). It was shown that the maximum free-surface flow capacity, prior to choking, was influenced by the curvature radius and the deflection angle. Huang and Wang (2018) carried out both physical tests and numerical simulations with supercritical flow across a rectangular curved channel. The simulations were based on the volume-of-fluid (VOF) method, and the results agreed well with the physical model observations. Tian et al. (2019) conducted a theoretical study to propose a supercritical channel bend of a rectangular section and a variable transverse bottom slope. The latter was tested in a physical model, in which the wave height along the external wall was reduced for approach flow Froude numbers below 2.50. Zhang et al. (2019) focused on the ability of a longitudinal guiding wall to limit wave heights. Physical model observations indicated satisfactory performance. Ghazanfari-Hashemi et al. (2020) showed that a numerical three-dimensional (3D) VOF model was more accurate than a two-dimensional (2D) model for characterizing the shock wave pattern in supercritical rectangular conduit bends with different deflection angles and curvature radii. Their results indicated that the inclusion of a turbulence model in 3D VOF simulations did not improve the accuracy significantly.
To summarize, the literature has reported the dominant influence of the bend curvature radius and deflection angle on the flow features establishing along the bend. However, the design indications for bend manholes provided by Del Giudice et al. (2000) and Gisonni and Hager (2002) referred to a single geometrical setup, with a fixed curvature radius of . This implies that the construction, transport, and installation of these (possibly prefabricated) bend manholes become onerous, especially when the bend manhole should be inserted within sewer pipes with large diameters. The manholes become even larger if a straight U-shaped extension of length between the bend end and the subsequent pipe is required to increase the discharge capacity.
Thus it would be useful to know the hydraulic manhole capacity for smaller curvature radii () and shorter linear extension lengths ( for U-shaped sections), completing the studies of Del Giudice et al. (2000) and Gisonni and Hager (2002). The present study analyzed the flow behavior and discharge capacity of these supercritical flow bend manholes with small curvature radii and short extensions. A 3D numerical model of supercritical flow bend manholes was developed and operated, after validation with the data of Del Giudice et al. (2000) and Gisonni and Hager (2002).
Materials and Methods
Geometry and Flow Pattern
A bend manhole is shown schematically in Fig. 1. A pipe of diameter and bottom slope conveys a supercritical flow through the bend. The latter has a U-shaped section, with a semicircular lower cross section of diameter and two vertical walls of height . Thus the total vertical wall height of the side benches is . The deflection angle between the approach flow and the downstream pipes is denoted . The centerline curvature radius is . At the bend end, there is a straight extension of U-shaped section and length . A downstream pipe of diameter and bottom slope (similar to the approach pipe) receives the flow from the manhole.
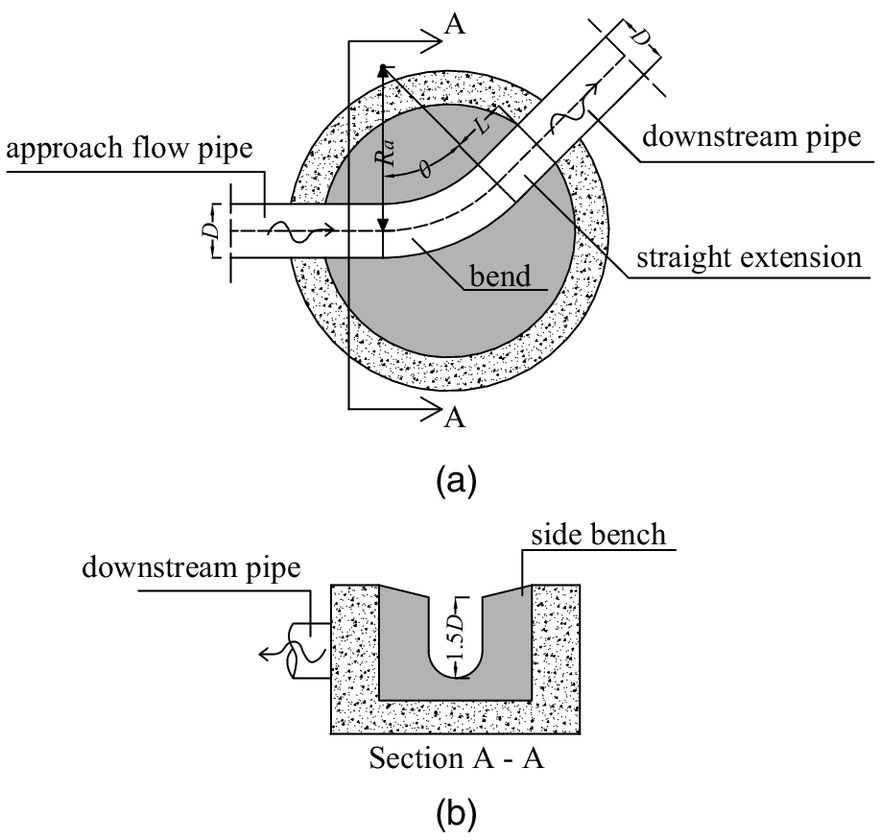
The flow pattern in such that a bend manhole with supercritical flow is dominated by a shock wave and its reflections. The wave might hit the back face of the manhole, where the section changes from U- to O-shaped. The wave potentially impacts there, collapses, and finally produces gated flow (Hager and Gisonni 2005). This condition corresponds to choking, and must be avoided.
Numerical Model
A 3D numerical model to replicate the flow field establishing in the bend manhole was set up in FLOW-3D version 22.1.0.17. It solves the continuity [Eq. (1)] and the momentum conservations [Eq. (2)] by applying the VOF methodwhere = time; = velocity component in -direction; = volume fraction of fluid in each cell; = fractional flow area in -direction; and and = viscosity and gravity acceleration components, respectively, in -direction. The value of depends on the correspondent wall-shear stress component, which was calculated by assuming a turbulence model. The renormalization group (RNG) model (Yakhot and Orszag 1986) was applied.
(1)
(2)
A modified VOF method was implemented, based on the definition of the fluid function volume, the application of a method to solve the VOF transport equation, and the selection of the boundary conditions at the free surface. The VOF transport equation iswhere = volume of fluid fraction, which indicates the fluid occupancy in a single grid cell, where for an empty cell, for a partially filled cell, and for a full cell. The VOF method of FLOW-3D uses a structured and orthogonal mesh to discretize the physical domain and to solve the governing equations. For this purpose, the Fractional Area-Volume Obstacle Representation (FAVOR) method was used to transform the geometric features in the physical domain in a computational mesh.
(3)
The hydraulic boundary conditions were defined at the borders of the computational domains. At the upstream domain border, a volume flow rate condition was imposed, with a fixed fluid elevation. At the downstream border, a free-overfall condition was set, as usual for a supercritical approach flow. This condition was imposed by adopting a stagnation pressure condition with a fixed value of the fractional area equal to zero. For all the other boundaries, a standard rigid wall condition was adopted.
Preliminary validation tests of the cell size and the surface roughness were conducted. Cell sizes of , 0.010, and 0.012 m were tested. The predicted shock wave heights along the outer wall differed by about 5% (relative to the smallest cells) and 13% for the three tested values of . Thus, was set. Analogously, the equivalent sand roughness coefficients , , and were tested. The roughest value was excluded because in some cases, for which Del Giudice et al. (2000) and Gisonni and Hager (2002) observed a free-surface flow, the manhole was submerged in the simulations. The differences in terms of wave heights between and were not negligible and, compared with the physical model data, were smaller for . Therefore the wall roughness was set to . Finally, a simulation time of 20 s was required to reach steady-state conditions, with a cold start condition. Only pure water flow was simulated, without adopting a specific air entrainment model. This implies that the generic controlling body was made up exclusively of water.
Numerical Model Validation
Three sets of experimental data with and without extension () [Fig. 2(a)], and with an extension of [Fig. 2(b)], and and without extension () [Fig. 2(c)], as investigated by Del Giudice et al. (2000) and Gisonni and Hager (2002), were used to validate the numerical model. Their tests were conducted with a circular pipe of up- and downstream of the bend. The centerline curvature radius was . The downstream pipe was long, as replicated in the numerical model. All the other geometrical features followed the setup described previously. The pipes and the vertical walls of the bend were made of transparent Perspex, whereas the semicircular part of the bend manhole was fabricated from PVC.
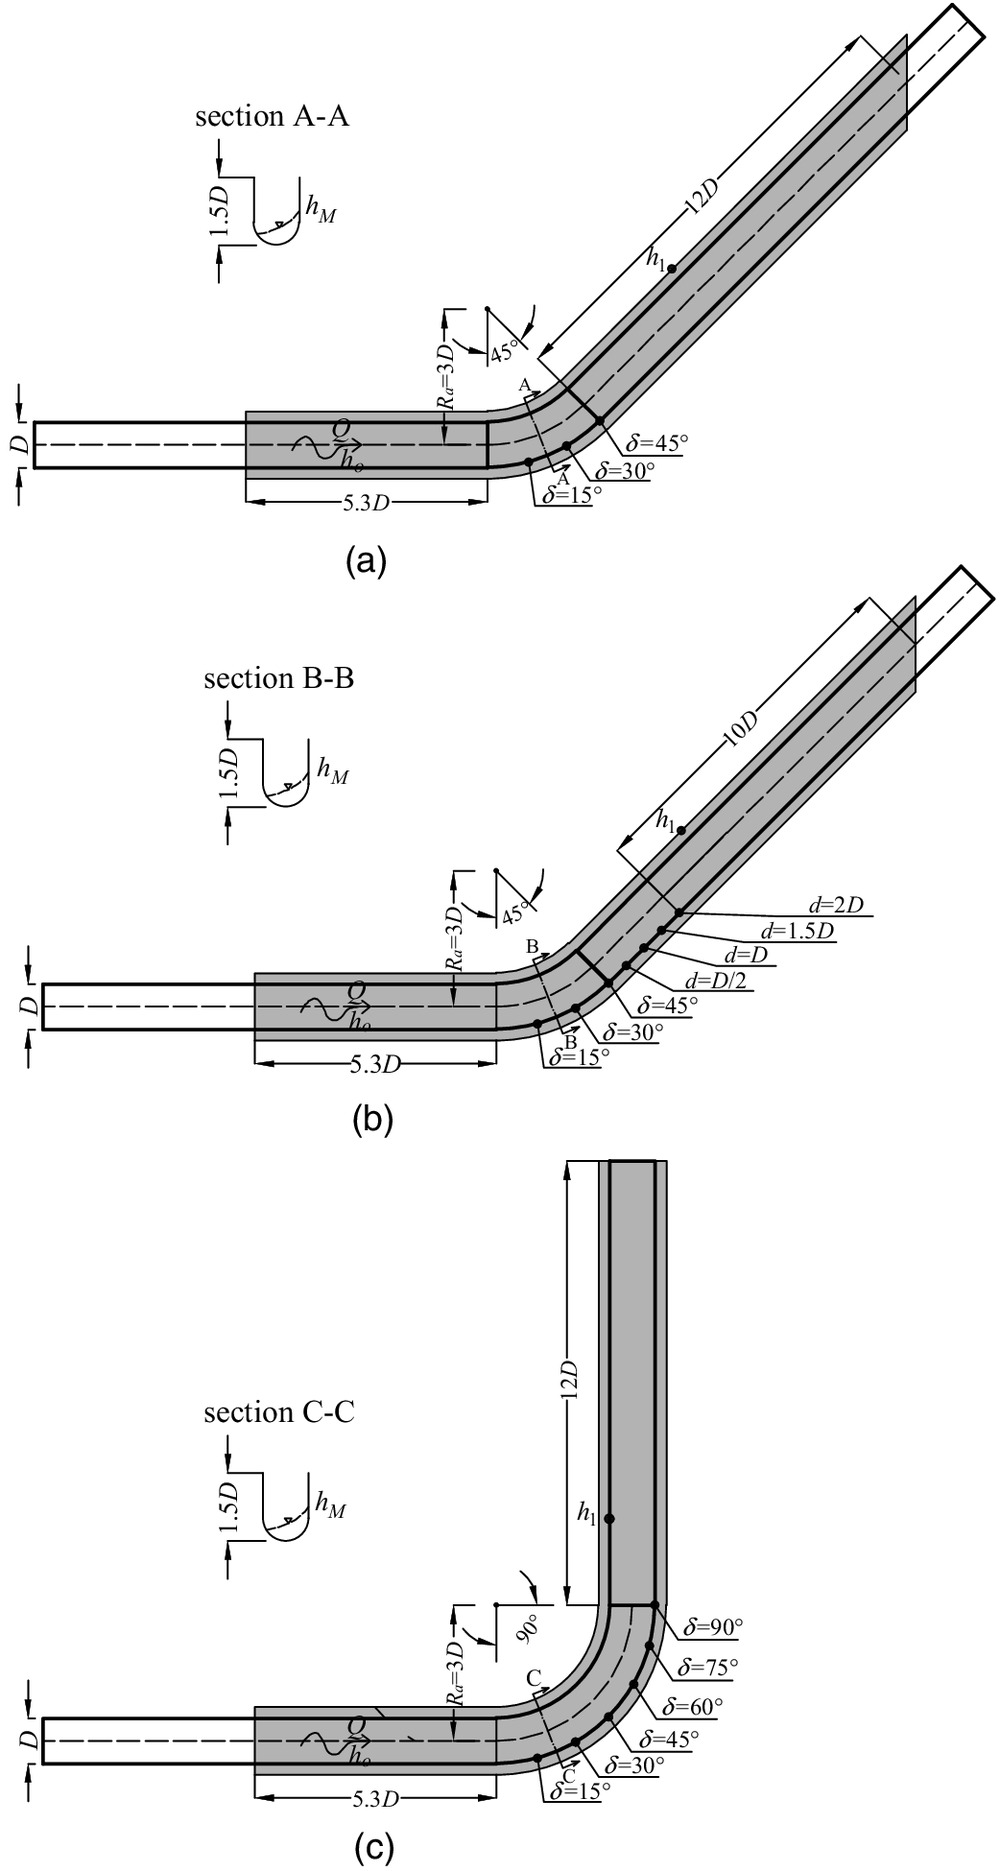
During the tests of Del Giudice et al. (2000) and Gisonni and Hager (2002), the approach flow depth was measured along the approach flow pipe, where the free-surface flow was close to uniform conditions. These values of were adopted to fix the upstream boundary condition in the simulations. Along the bend, the maximum wave height at the deflection angle as well as the flow depth along the outer wall at deflection angles , 30°, and 45° were measured for , and additionally at , 75°, and 90° for (Fig. 2). If a straight extension was present, then also was measured at distances , , , and downstream of the bend end [Fig. 2(b)]. The maximum flow depth along the downstream pipe was recorded. All these observations were used to verify the accuracy of the numerical simulations.
The hydraulic features of the physical model tests used to verify the numerical simulations are listed in Table 1, where is the approach (subscript ) flow filling ratio, and is the approach Froude number, which was calculated aswhere = gravitational acceleration (e.g., Crispino et al. 2018). Eq. (4) gives accurate results within .
(4)
| (degrees) | Test ID | () | (m) | (m) | ||
|---|---|---|---|---|---|---|
| 45 (without straight extension) | 1 | 9.80 | 2.56 | 0.21 | 0.11 | 0.07 |
| 2 | 28.20 | 2.15 | 0.39 | 0.17 | 0.15 | |
| 3 | 38.90 | 1.90 | 0.48 | 0.26 | 0.18 | |
| 45 (with straight extension) | 4 | 31.00 | 4.78 | 0.27 | 0.27 | 0.23 |
| 5 | 55.00 | 3.07 | 0.45 | 0.31 | 0.24 | |
| 6 | 67.50 | 1.97 | 0.53 | 0.32 | 0.24 | |
| 90 (without straight extension) | 7 | 18.50 | 5.96 | 0.19 | 0.31 | 0.13 |
| 8 | 26.57 | 2.78 | 0.33 | 0.16 | 0.14 |
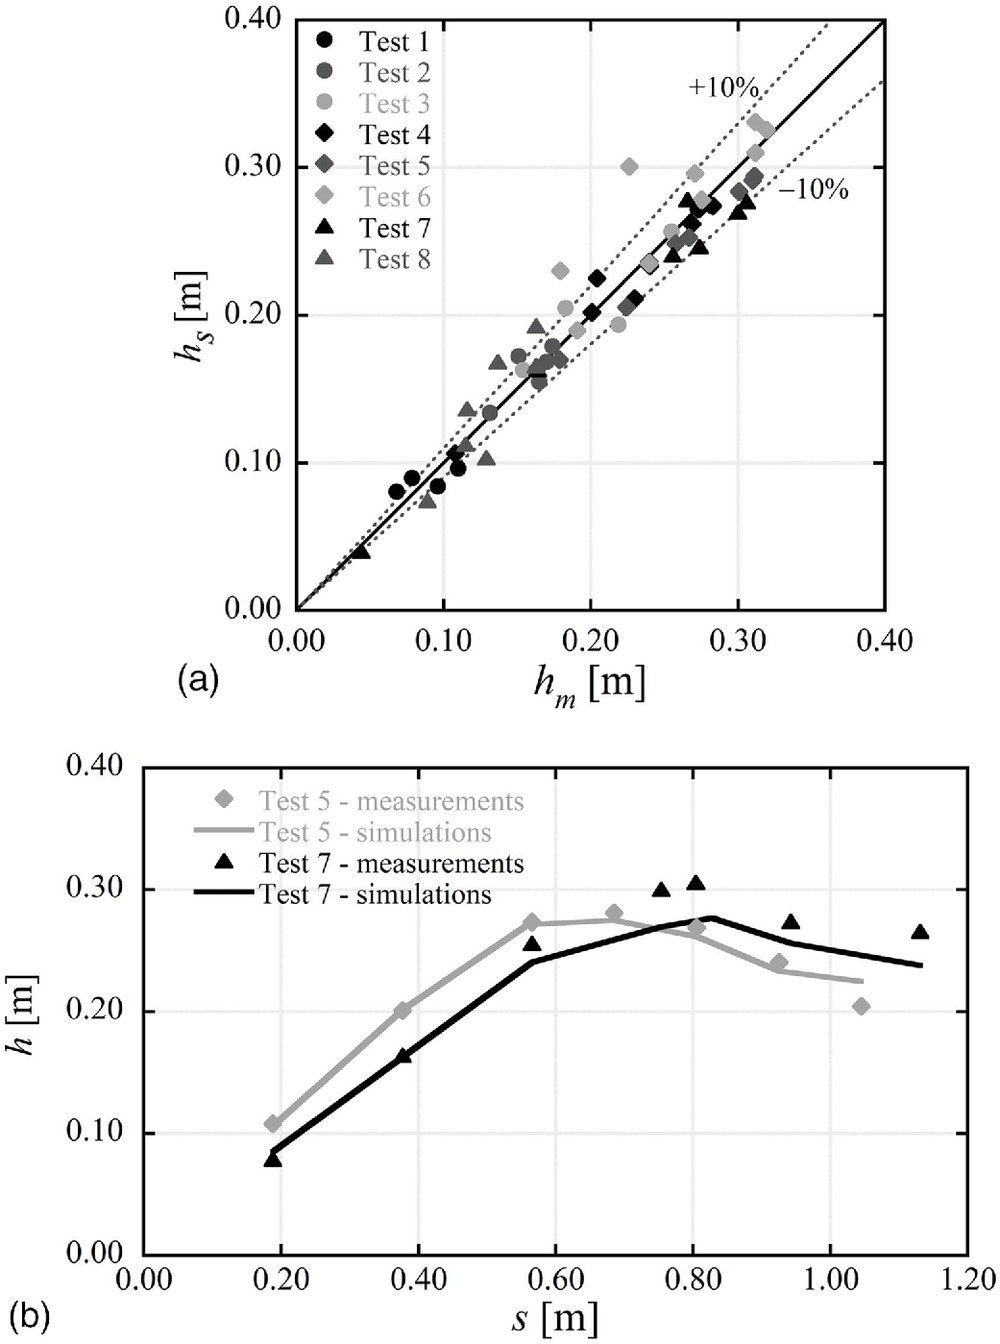
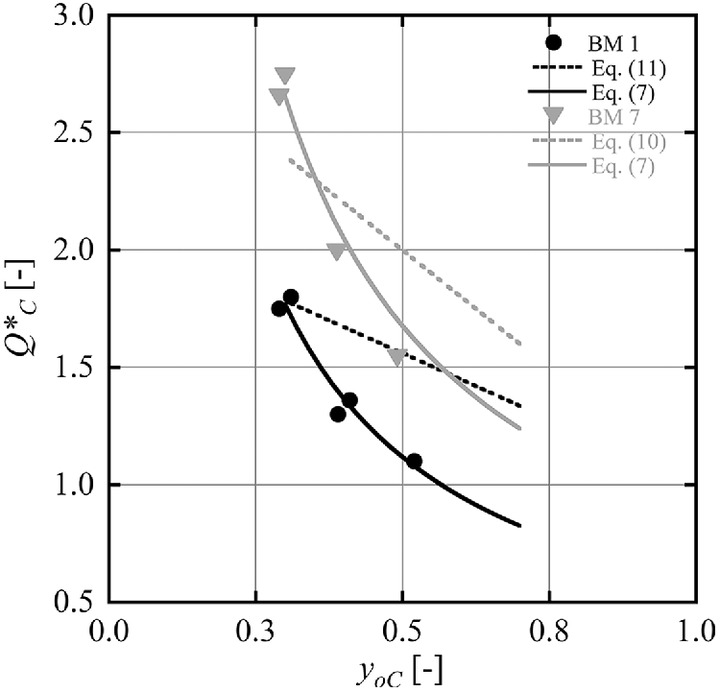
The simulated flow depths (subscript ) were compared with the corresponding measured data (subscript ) (Fig. 3). The numerical model provided reliable shock wave heights along the bend and in the downstream pipe. Most of the points were within [Fig. 3(a)], whereas the others related to tests with the largest discharges (Table 2). These points involved significant turbulence and spray formation, so that the physical model data might be subjected to some imprecision. For example, Fig. 3(b) shows the outer shock wave profiles for BMs 5 and 7 of both the physical model and the numerical simulation. Here, is the developed coordinate along the outer bend wall. The numerical simulation predicted the waves satisfactorily. For BM 7, the simulation slightly underestimated the wave heights, with an average relative error (RE) smaller than 8%.
| Test ID | |||||||||
|---|---|---|---|---|---|---|---|---|---|
| RE (%) | RMSE (m) | RE (%) | RMSE (m) | RE (%) | RMSE (m) | ||||
| 1 | 4.31 | 0.99 | 0.004 | 11.02 | 0.64 | 0.013 | 9.00 | 0.84 | 0.009 |
| 2 | 2.84 | 0.94 | 0.005 | 5.50 | 0.65 | 0.015 | 10.71 | 0.28 | 0.029 |
| 3 | 6.10 | 0.92 | 0.016 | 13.59 | 0.71 | 0.031 | 20.11 | 0.30 | 0.054 |
| 4 | 3.50 | 0.98 | 0.011 | 8.91 | 0.90 | 0.029 | 14.22 | 0.78 | 0.049 |
| 5 | 4.85 | 0.99 | 0.014 | 8.53 | 0.97 | 0.025 | 13.93 | 0.70 | 0.041 |
| 6 | 8.52 | 0.88 | 0.030 | 5.81 | 0.98 | 0.019 | Choking | ||
| 7 | 6.44 | 0.98 | 0.020 | 11.81 | 0.91 | 0.099 | 9.18 | 0.94 | 0.027 |
| 8 | 10.56 | 0.86 | 0.019 | 8.89 | 0.95 | 0.048 | 15.92 | 0.69 | 0.026 |
Table 2 lists the relative error, the coefficient of determination , and the RMS error for the wave heights per test and per value of . The subscript denotes the average value of the wave height data set. Table 2 confirms that the numerical simulations reproduced the wave heights suitably. Decreasing precision with increasing discharge was identified. We suggest that the challenging hydraulic features in the physical model contributed to this observation. The accuracy decreased with increasing , as noted previously. The bend manhole with choked in Test 6, despite the fact that this critical condition was not observed in the physical model.
Test Program
The numerical simulations were carried out for 11 bend manhole setups with and 90°, , 2, and 3, and , 1, and 2. The other geometrical properties were similar to those of Del Giudice et al. (2000) and Gisonni and Hager (2002). For the flow features, first the filling ratio was fixed as the upstream boundary condition (systematic increase: , 0.4, 0.5, 0.6, and 0.7). Then, for each , was increased progressively from up to a maximum at which choking occurred. We set to avoid transitional flows (Hager 2010). Each was maintained for 15 s to stabilize the flow conditions (following from the sensitivity analysis conducted previously), whereas was increased to the subsequent larger value within 5 s.
Table 3 gives the simulated geometries and hydraulic parameters. Parameterwas added to normalize the discharge. In total, 167 hydraulic conditions were simulated.
(5)
| Bend manhole setup | (degrees) | |||||
|---|---|---|---|---|---|---|
| BM 1 | 45 | 1 | 0 | 1.30–4.00 | 0.30–0.60 | 0.18–0.71 |
| BM 2 | 45 | 1 | 2 | 1.44–3.98 | 0.30–0.60 | 0.18–0.88 |
| BM 3 | 90 | 1 | 0 | 1.30–4.38 | 0.30–0.60 | 0.18–0.71 |
| BM 4 | 90 | 1 | 2 | 1.30–5.00 | 0.30–0.60 | 0.18–0.88 |
| BM 5 | 45 | 2 | 0 | 1.30–3.85 | 0.30–0.60 | 0.18–0.84 |
| BM 6 | 45 | 2 | 1 | 1.30–3.95 | 0.30–0.60 | 0.18–0.84 |
| BM 7 | 45 | 2 | 2 | 1.30–5.00 | 0.30–0.60 | 0.18–0.89 |
| BM 8 | 45 | 3 | 0 | 1.50–4.52 | 0.30–0.70 | 0.18–0.81 |
| BM 9 | 45 | 3 | 2 | 1.50–4.85 | 0.30–0.70 | 0.18–0.88 |
| BM 10 | 90 | 3 | 0 | 1.92–4.88 | 0.30–0.70 | 0.18–1.05 |
| BM 11 | 90 | 3 | 2 | 1.85–5.86 | 0.30–0.70 | 0.18–1.17 |
Results
Flow Patterns
The deflection perturbs the supercritical approach flow and a shock wave occurs. The simulations indicated two main effects:
•
A pronounced shock wave propagates along the external bend wall, starting at the deflection start and including a first wave maximum within the bend. If the bend is sufficiently long, a second wave maximum occurs at the inner wall. The shock wave affects the downstream pipe flow and a cross-wave pattern is observed.
•
According to Gisonni and Hager (2002), the first shock wave maximum (at the outer wall) occurs at about . If the bend manhole ends there, the wave often impinges at the manhole end (transition from U- to O-shaped), leading to spray and turbulence phenomena. At worst, the flow chokes, partially generating a hydraulic jump.
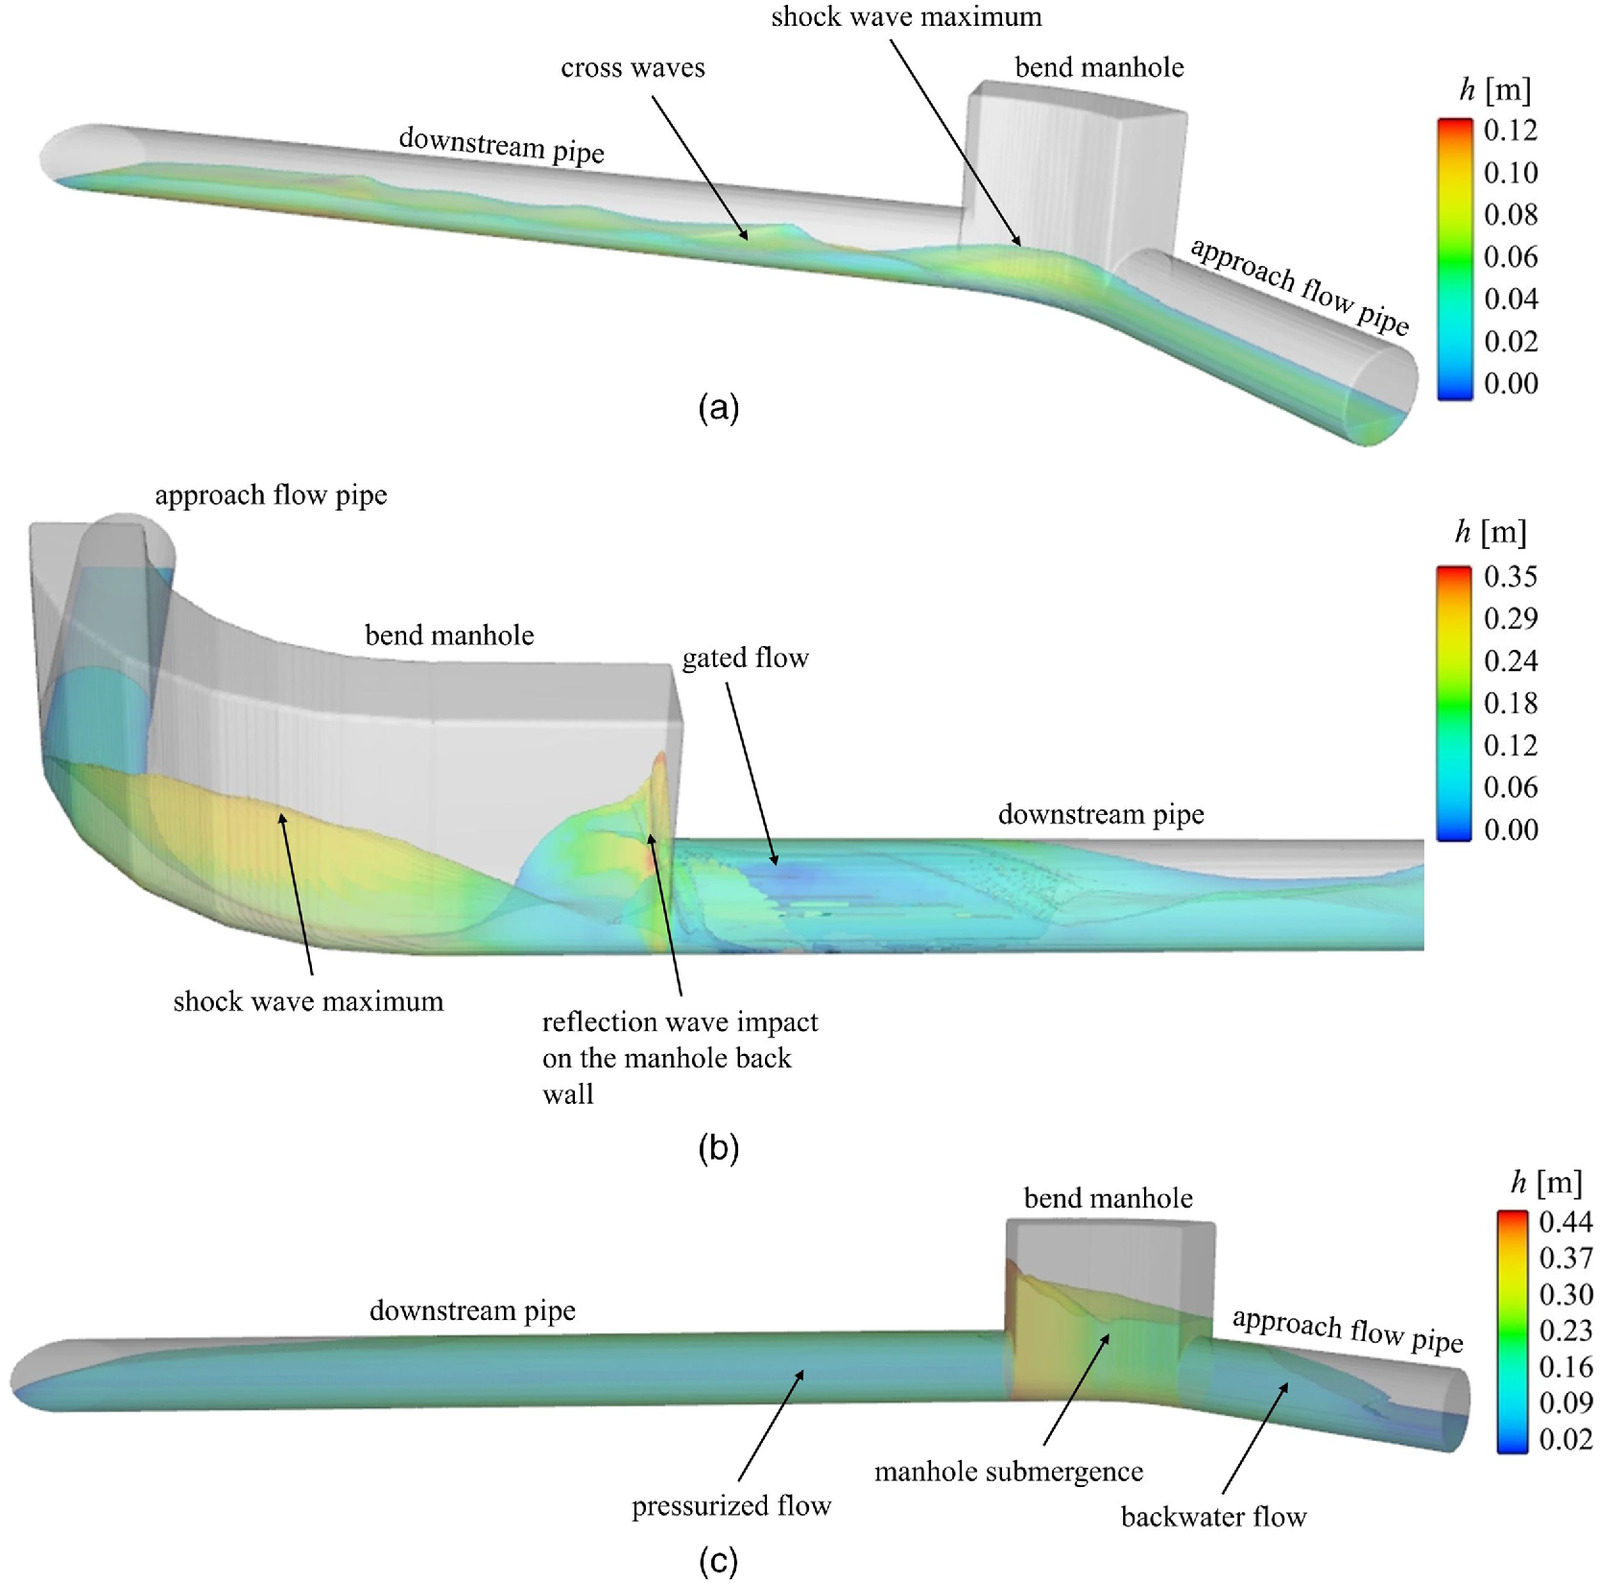
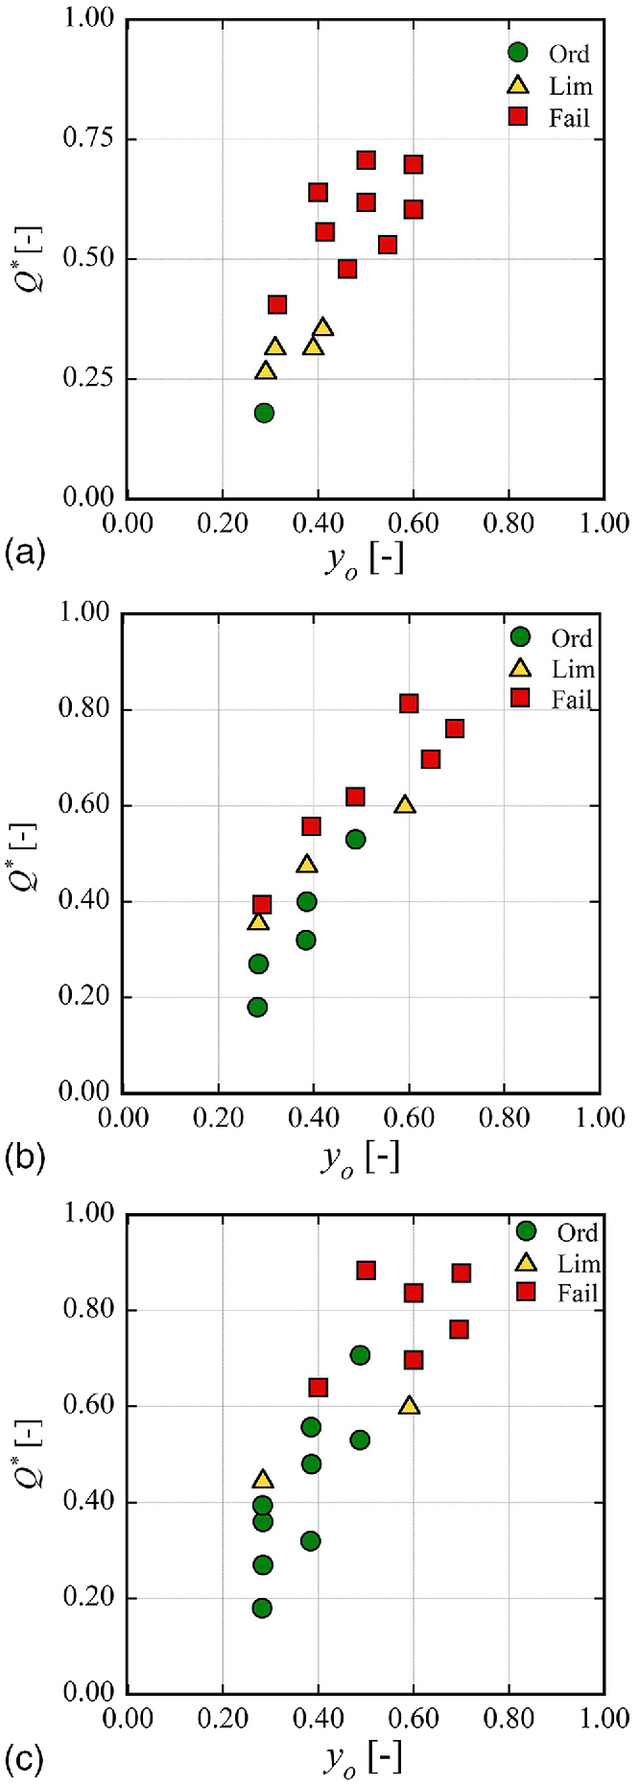
We defined three conditions to interpret the flow behavior across the manhole (Fig. 4):
1.
Ordinary condition (subscript ord). A free-surface supercritical flow regime across the bend manhole emerges. The maximum shock wave at the outer wall characterizes the flow pattern within the manhole [Fig. 4(a)].
2.
Limit condition (subscript lim). Hydraulic anomalies occur within the manhole and, possibly, in the downstream pipe. Pronounced spray is observed at the manhole end. The outlet cross section is close to submergence and behaves similar to a gate. The supercritical flow regime is maintained in the manhole, whereas the filling ratio along the downstream pipe increases [Fig. 4(b)].
3.
Failure condition (subscript fail). The supercritical flow regime breaks down with choking in the manhole. A hydraulic jump moves up into the approach flow pipe, and the downstream pipe is pressurized, with [Fig. 4(c)].
Hydraulic Capacity
As suggested by Del Giudice et al. (2000) and Gisonni and Hager (2002), the nondimensional parameter to express the discharge across a bend is
(6)
The hydraulic capacity (subscript , limit condition) of a bend manhole with supercritical flow is reached for a specific discharge when failure occurs. Thus, for the limit condition equal to the manhole capacity, is defined.
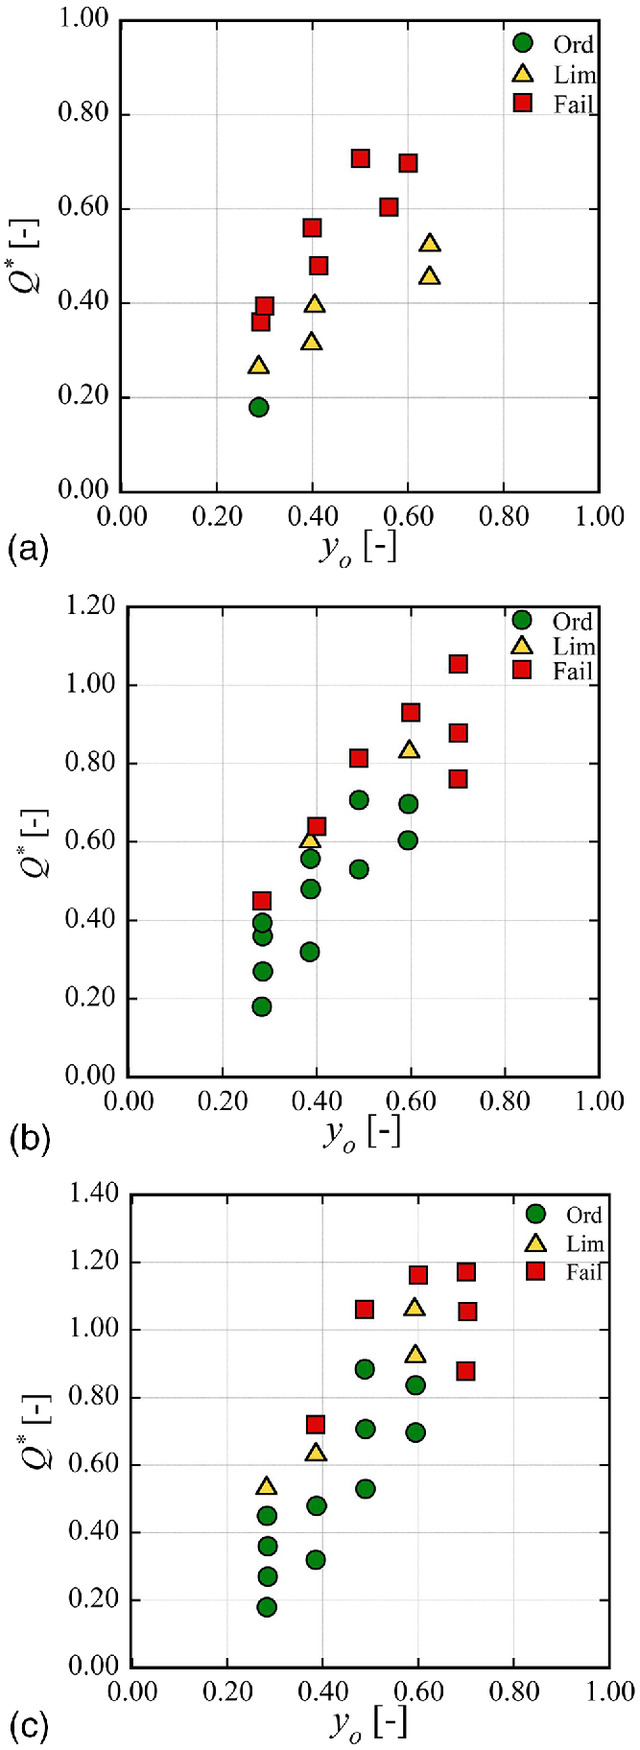
Fig. 5 shows tested versus for the 45° bend, including BMs 1, 8, and 9 as examples (Table 3). For a certain BM and a numerically fixed , the increase of led to the transition from the ordinary condition (circles) via the limit condition (triangles, similar to ) to the failure condition (squares). Globally, increased with , probably due to the reduced mechanical energy of the supercritical approach flow. Comparing the BMs [Figs. 5(a–c)] suggests that the increase of and the addition of a straight extension increases the capacity of the bend manhole. BM 1 could convey flows only with , whereas was possible for BMs 8 and 11. Furthermore, for a certain , the capacity (triangles) of BMs 8 and 11 was larger than that of BM 1. In particular, the effect of on the bend manhole capacity is evident in Figs. 5(a and b), with increasing from 1 [Fig. 5(a)] to 3 [Fig. 5(b)]. An increase of resulted in increased .
Figs. 5(b and c) show the effect of the straight extension on the capacity. As expected, a longer increased the capacity. This was due to the position of the shock wave maximum located at about (Gisonni and Hager 2002). Thus, the wave was distant from the manhole end if an extension was present. Equally, the straight extension did not increase , which was equal to 0.6 for .
The values versus of the tested 90° bends are shown in Fig. 6 with three BMs as examples. For a fixed value of , (triangles) increased with increasing and with the addition of a -long straight extension. In all the BMs in Fig. 6, was a constant 0.6. For a given bend curvature radius and extension length, the 90° bend had a larger capacity than the 45° bend. Again, this circumstance probably was related to the typical position of the shock wave maximum, located at about , and, therefore, far from the manhole end for 90° bends.
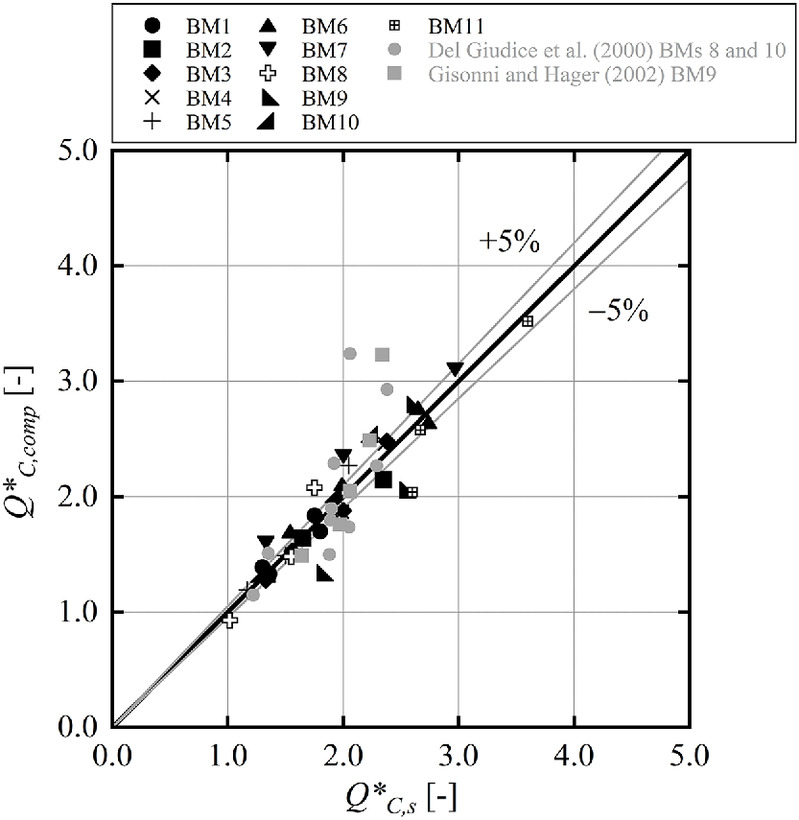
Using the present data, an empirical equation to estimate the hydraulic capacity of the bend manholes as a function of the geometrical and hydraulic parameters was derived. Thus, was estimated for aswith and depending on , , and as follows:where is expressed in radians. Eqs. (7)–(9) are valid in the inspected range of the influential parameters, that is, for , , and . According to these equations, the effects of the increase of the bend curvature radius and of the straight extension contribute equally to the increase of bend capacity. If increases, then also increases, but the positive effect on the capacity tends to decrease as increases. The accuracy of Eq. (7) is shown in Fig. 7, which compares the observed in the numerical simulations (subscript ) with those computed (subscript comp) using Eqs. (7)–(9). Eq. (7) can predict quite satisfactorily. Most points were within a confidence interval of , and the overall correlation coefficient . Fig. 7 also includes the data from the physical models recorded by Del Giudice et al. (2000) and Gisonni and Hager (2002), and indicates a good fit ().
(7)
(8)
(9)
Gisonni and Hager (2002) proposed two distinct equations to derive for 45° and 90° bend manholes with and with [Eq. (10)] or without [Eq. (11)] an -long straight extension
(10)
(11)
Discussion
In most technical guidelines for bend manholes, (Hager and Gisonni 2005). The addition of a -long straight extension or of a bend cover plate (Gisonni and Hager 2002) can be foreseen to increase the capacity. However, these design rules are constricting for a sewer with a large , because the size of the manhole and its protecting appurtenances increase with . Fig. 9 shows the effect of and on the manhole, and supports the selection of the manhole geometry by balancing hydraulic and practical requirements. It shows how varies with according to Eq. (7) for 45° and 90° bends. For example, a 45° bend manhole () with a supercritical approach flow, , a maximum (subscript ) dimensionless discharge , and [Eq. (4)] has to be designed for a capacity of [Eq. (6)]. This implies that the manhole cannot be constructed with because the resulting is smaller than according to Eq. (7). It becomes necessary to choose , and a straight extension must be used at the bend end if .
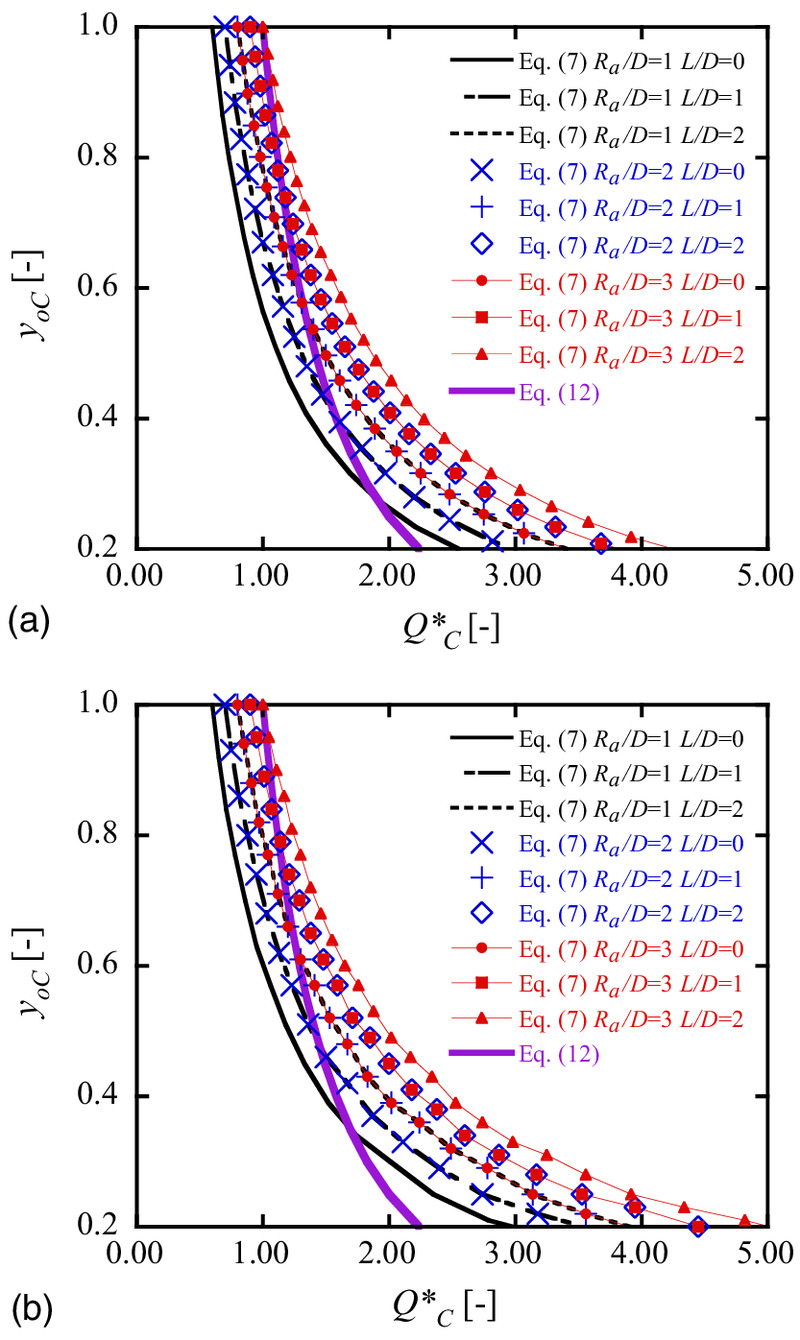
Fig. 9 includes the choking criterion of Stahl and Hager (1999) for straight pipe flow, according to which supercritical flow () chokes due to a direct hydraulic jump for , where is the choking number. From Eqs. (4) and (6), , so that . This implies that choking occurs for straight pipes if
(12)
Eq. (12) is included in Fig. 9, which indicates the conditions for which the up- and downstream pipes possibly choke. The failure criteria of the bend manhole can be more restricting than the pipe choking criterion of Stahl and Hager (1999). For example, a supercritical flow in a pipe of with and does not choke the pipe because it respects the criterion of Stahl and Hager (1999), but it can provoke failure in a bend manhole for and .
Furthermore, the Sauerbrey (1969) criterion usually limits the uniform approach flow pipe partial filling ratio to about for supercritical flow.
Conclusions
A 3D numerical simulation based on the volume-of-fluid method was conducted to investigate the flow behavior across supercritical bend manholes. The numerical model was set up with an appropriate mesh cell size and roughness coefficient. The accuracy of the model was assessed by comparing the simulated wave heights with the corresponding data from the physical models of 45° and 90° bend manholes (Del Giudice et al. 2000; Gisonni and Hager 2002). The relative error in the replication of the physical model data was about 5%. This comparison gave satisfactory outcomes, and therefore the numerical model was used to conduct systematic flow simulations in 45° and 90° bend manholes. Different setups with variable curvature radii and straight extensions at the manhole end were considered, and for each configuration the approach flow discharge was increased progressively (for a fixed partial filling ratio) up to failure (capacity).
Large curvature radii and long extensions have an equivalent positive effect on the manhole capacity, with a significant increase of the maximum discharge safely conveyable inside the structure. The combination of the simulated and physical model data allowed for the development of an equation estimating the discharge capacity of the supercritical flow bend manholes as a function of the approach flow filling ratio, the bend angle, the relative curvature radius, and the potential presence of a straight extension. Two design charts were developed to support practitioners in the selection of bend manhole geometry to prevent choking flows.
In this study, the effect of the lateral bench height on the bend manhole capacity was not explicitly addressed. A fixed value of was assumed. Nevertheless, observations clearly indicate that such a high bend is required to guide the shock wave.
Notation
The following symbols are used in this paper:
- fractional area open to flow;
- choking number;
- diameter;
- distance from bend end;
- cell size;
- Froude number;
- volume of fluid fraction;
- viscous acceleration;
- gravity acceleration;
- flow depth;
- maximum wave height;
- first wave maximum along downstream pipe;
- coefficient;
- equivalent sand roughness coefficient;
- straight extension length;
- flow discharge;
- capacity discharge;
- dimensionless discharge;
- relative discharge;
- curvature radius;
- coefficient of determination;
- bottom slope;
- time;
- velocity component;
- volume fraction of fluid;
- streamwise coordinate;
- approach flow filling ratio;
- downstream filling ratio;
- exponent;
- progressive deflection angle; and
- deflection angle.
Data Availability Statement
All data that support the findings of this study are available from the corresponding author upon reasonable request.
Acknowledgments
The authors acknowledge the financial support of the Swiss Federal Office for the Environment (BAFU-087.2-527/287/3) and of CREABETON PRODUKTIONS AG (Switzerland). Its representative, Thomas Rohr, gave much practical advice. Thank you!
References
Beltrami, G. M., A. Del Guzzo, and R. Repetto. 2007. “A simple method to regularize supercritical flow profiles in bends.” J. Hydraul. Res. 45 (6): 773–786. https://doi.org/10.1080/00221686.2007.9521815.
Crispino, G., M. Pfister, and C. Gisonni. 2018. “Supercritical flow in junction manholes under invert- and obvert-aligned set-ups.” J. Hydraul. Res. 57 (4): 534–546. https://doi.org/10.1080/00221686.2018.1494056.
Del Giudice, G., C. Gisonni, and W. H. Hager. 2000. “Supercritical flow in bend manhole.” J. Irrig. Drain. Eng. 126 (1): 48–56. https://doi.org/10.1061/(ASCE)0733-9437(2000)126:1(48).
Ghaeini Hessaroeyeh, M., and A. Tahershamsi. 2009. “Analytical model of supercritical flow in rectangular chute bends.” J. Hydraul. Res. 47 (5): 566–573. https://doi.org/10.3826/jhr.2009.3538.
Ghaeini-Hessaroeyeh, M., A. Tahershamsi, and M. Montazeri Namin. 2011. “Numerical modelling of supercritical flow in rectangular chute bends.” J. Hydraul. Res. 49 (5): 685–688. https://doi.org/10.1080/00221686.2011.589130.
Ghazanfari-Hashemi, R. S., M. M. Namin, M. Ghaeini-Hessaroeyeh, and E. Fadaei-Kermani. 2020. “A numerical study on three-dimensionality and turbulence in supercritical bend flow.” Int. J. Civ. Eng. 18 (3): 381–391. https://doi.org/10.1007/s40999-019-00471-w.
Gisonni, C., and W. H. Hager. 2002. “Supercritical flow in manholes with a bend extension.” Exp. Fluids 32 (3): 357–365. https://doi.org/10.1007/s003480100364.
Hager, W. H. 2010. Wastewater hydraulics: Theory and practice. Berlin: Springer.
Hager, W. H., and C. Gisonni. 2005. “Supercritical flow in sewer manholes.” J. Hydraul. Res. 43 (6): 660–667. https://doi.org/10.1080/00221680509500385.
Huang, X.-B., and Q. Wang. 2018. “Numerical models and theoretical analysis of supercritical bend flow.” Water Sci. Eng. 11 (4): 338–343. https://doi.org/10.1016/j.wse.2018.12.002.
Kolarevic, M., L. Savic, R. Kapor, and N. Mladenovic. 2015. “Supercritical flow in circular conduit bends.” J. Hydraul. Res. 53 (1): 93–100. https://doi.org/10.1080/00221686.2014.932856.
Reza Jaefarzadeh, M., A. Reza Shamkhalchian, and M. Jomehzadeh. 2012. “Supercritical flow profile improvement by means of a convex corner at a bend inlet.” J. Hydraul. Res. 50 (6): 623–630. https://doi.org/10.1080/00221686.2012.719200.
Sauerbrey, M. 1969. “Abfluss in Entwässerungsleitungen unter besonderer Berücksichtigung der Fliessvorgänge in teilgefüllten Rohren [Flow in drainage pipes with particular reference to partially filled conduits].” [In German.] Wasser und Abwasser in Forschung und Praxis, 1. Erich Schmidt: Bielefeld.
Stahl, H., and W. H. Hager. 1999. “Hydraulic jump in circular pipes.” Can. J. Civ. Eng. 26 (3): 368–373. https://doi.org/10.1139/l98-068.
Tian, Z., C. Ding, W. Wang, and C.-N. Zhang. 2019. “Supercritical flow in bend with variable curvature radius.” J. Hydraul. Res. 57 (5): 724–732. https://doi.org/10.1080/00221686.2018.1494049.
Yakhot, V., and S. A. Orszag. 1986. “Renormalization group analysis of turbulence. I. Basic theory.” J. Sci. Comput. 1 (1): 3–51. https://doi.org/10.1007/BF01061452.
Zhang, J., Q. Zhang, T. Wang, J. Yang, and X. Li. 2019. “Research on the water level in a bending channel using a guide wall.” Water Supply 19 (8): 2494–2506. https://doi.org/10.2166/ws.2019.130.
Information & Authors
Information
Published In

Journal of Irrigation and Drainage Engineering
Volume 149 • Issue 2 • February 2023
Copyright
This work is made available under the terms of the Creative Commons Attribution 4.0 International license, https://creativecommons.org/licenses/by/4.0/.
History
Received: Jul 22, 2022
Accepted: Oct 17, 2022
Published online: Dec 8, 2022
Published in print: Feb 1, 2023
Discussion open until: May 8, 2023
Authors
Metrics & Citations
Metrics
Citations
Download citation
If you have the appropriate software installed, you can download article citation data to the citation manager of your choice. Simply select your manager software from the list below and click Download.
Cited by
- Mokrane Amirouche, Ali Berreksi, Larbi Houichi, Lyes Amara, Computation of 2D Supercritical Free-Surface Flow in Rectangular Weak Channel Bends, Journal of Irrigation and Drainage Engineering, 10.1061/JIDEDH.IRENG-10136, 150, 5, (2024).
- Yu Qian, David Z. Zhu, Bert van Duin, Closure to “Design Considerations for High-Speed Flow in Sewer Systems”, Journal of Hydraulic Engineering, 10.1061/JHEND8.HYENG-13858, 150, 1, (2024).
- Gaetano Crispino, Michael Pfister, Corrado Gisonni, Willi H. Hager, Discussion of “Design Considerations for High-Speed Flow in Sewer Systems”, Journal of Hydraulic Engineering, 10.1061/JHEND8.HYENG-13541, 150, 1, (2024).