The Role of Fabric, Stress History, Mineralogy, and Particle Morphology on the Triaxial Behavior of Nontextbook Geomaterials
Publication: Journal of Geotechnical and Geoenvironmental Engineering
Volume 150, Issue 8
Abstract
Soil mechanics traditionally have focused on studying pure clays and clean sands. However, natural soils and other geomaterials usually do not fall into these two classes. Most geomaterials are a complex matrix of fines and coarser particles, with distinct shapes and mineralogy interacting. This paper studied iron ore tailings over a broad range of pressures and stress histories to investigate the mechanical behavior of this nontextbook geomaterial. A thorough experimental program was conducted, and aspects of the stress–strain response, yielding, hardening, and critical state were evaluated. The state boundary surface of iron ore tailings also was investigated. The results demonstrated that the stress history of tailings affects the tailings’ behavior only at elevated stress levels. The existence of particles with distinct mineralogy in the iron ore tailings (mainly iron oxide and quartz) could have induced different breakage patterns, with an evolving particle morphology being the dominant mechanism up to the pressures achieved.
Introduction
Historically, soil mechanics have focused on studying clean sands and pure clays, in order to delimitate the boundaries of a much wider range of natural soils. However, most natural soils and anthropic materials are a complex matrix of plastic or nonplastic fines and coarser granular materials with distinct mineralogy interacting. Some researchers have studied the behavior of materials with more unusual origins and characteristics, such as carbonate sands (e.g., Coop 1990; Jovicic and Coop 1997; He et al. 2019), silty sands (e.g., Lade and Yamamuro 1997; Salgado et al. 2000; Thevanayagam and Mohan 2000; Carraro et al. 2009; Liu et al. 2021), glacial sediments (e.g., Altuhafi et al. 2010, 2006), tailings (Consoli et al. 2023; Li and Coop 2019; Velten et al. 2023; Wagner et al. 2023), and other industrial residues (e.g., Consoli et al. 2007).
The investigation of granular materials usually neglects the effects of particle breakage, particle morphology, mineralogy, and fabric. Such effects are more noticeable in more-complex geomaterials (such as sand–fines mixtures and tailings). Even when some of these aspects are investigated, this is done separately, to assess each contribution from a macro- or microscopic point of view (e.g., Ciantia et al. 2019; de Bono and McDowell 2020; Li and Dafalias 2012; McDowell and Bolton 1998; Muir Wood 2007; Yao et al. 2022). The modeling frameworks considering deviations from typical response are not able to fully represent some aspects of behavior, or they are too complex to allow for their practical implementation.
This paper contributes to the understanding of the mechanical response of nontextbook geomaterials based on experimental data obtained for iron ore tailings. Tailings are clastic, anthropic materials of industrial nature that result from ore extraction and beneficiation processes (from crushing and screening to more sophisticated methods). Those processes give rise to materials with characteristics different from those of natural soils, such as marked angularities, high surface roughness, and the presence of nonplastic or plastic fines, among others (Consoli et al. 2022; Fourie et al. 2022; Wagner et al. 2023; Yang et al. 2019). These aspects induce behavior that may be significant to the mechanical response of tailings, such as the influence of fabric, particle breakage, and particle morphology (Carvalho 2023; Li and Coop 2019; Velten et al. 2023; Wagner et al. 2023).
This manuscript is organized as follows. First, the behavior of iron ore tailings under compression and shearing paths is described using critical state soil mechanics. Then the influence of recent stress history and stress level on stiffness and aspects of yielding and hardening are evaluated. Next, the state paths followed are presented, and the state boundary surfaces (SBS) are determined, considering the influence of fabric on the behavior of tailings. Then the plastic flow direction and a discussion of the flow rule for the material are presented, and the effects of particle morphology on the observed response are highlighted. Each of these aspects individually contributes to understanding the complex mechanisms occurring in this nontextbook geomaterial.
Materials and Methods
Materials
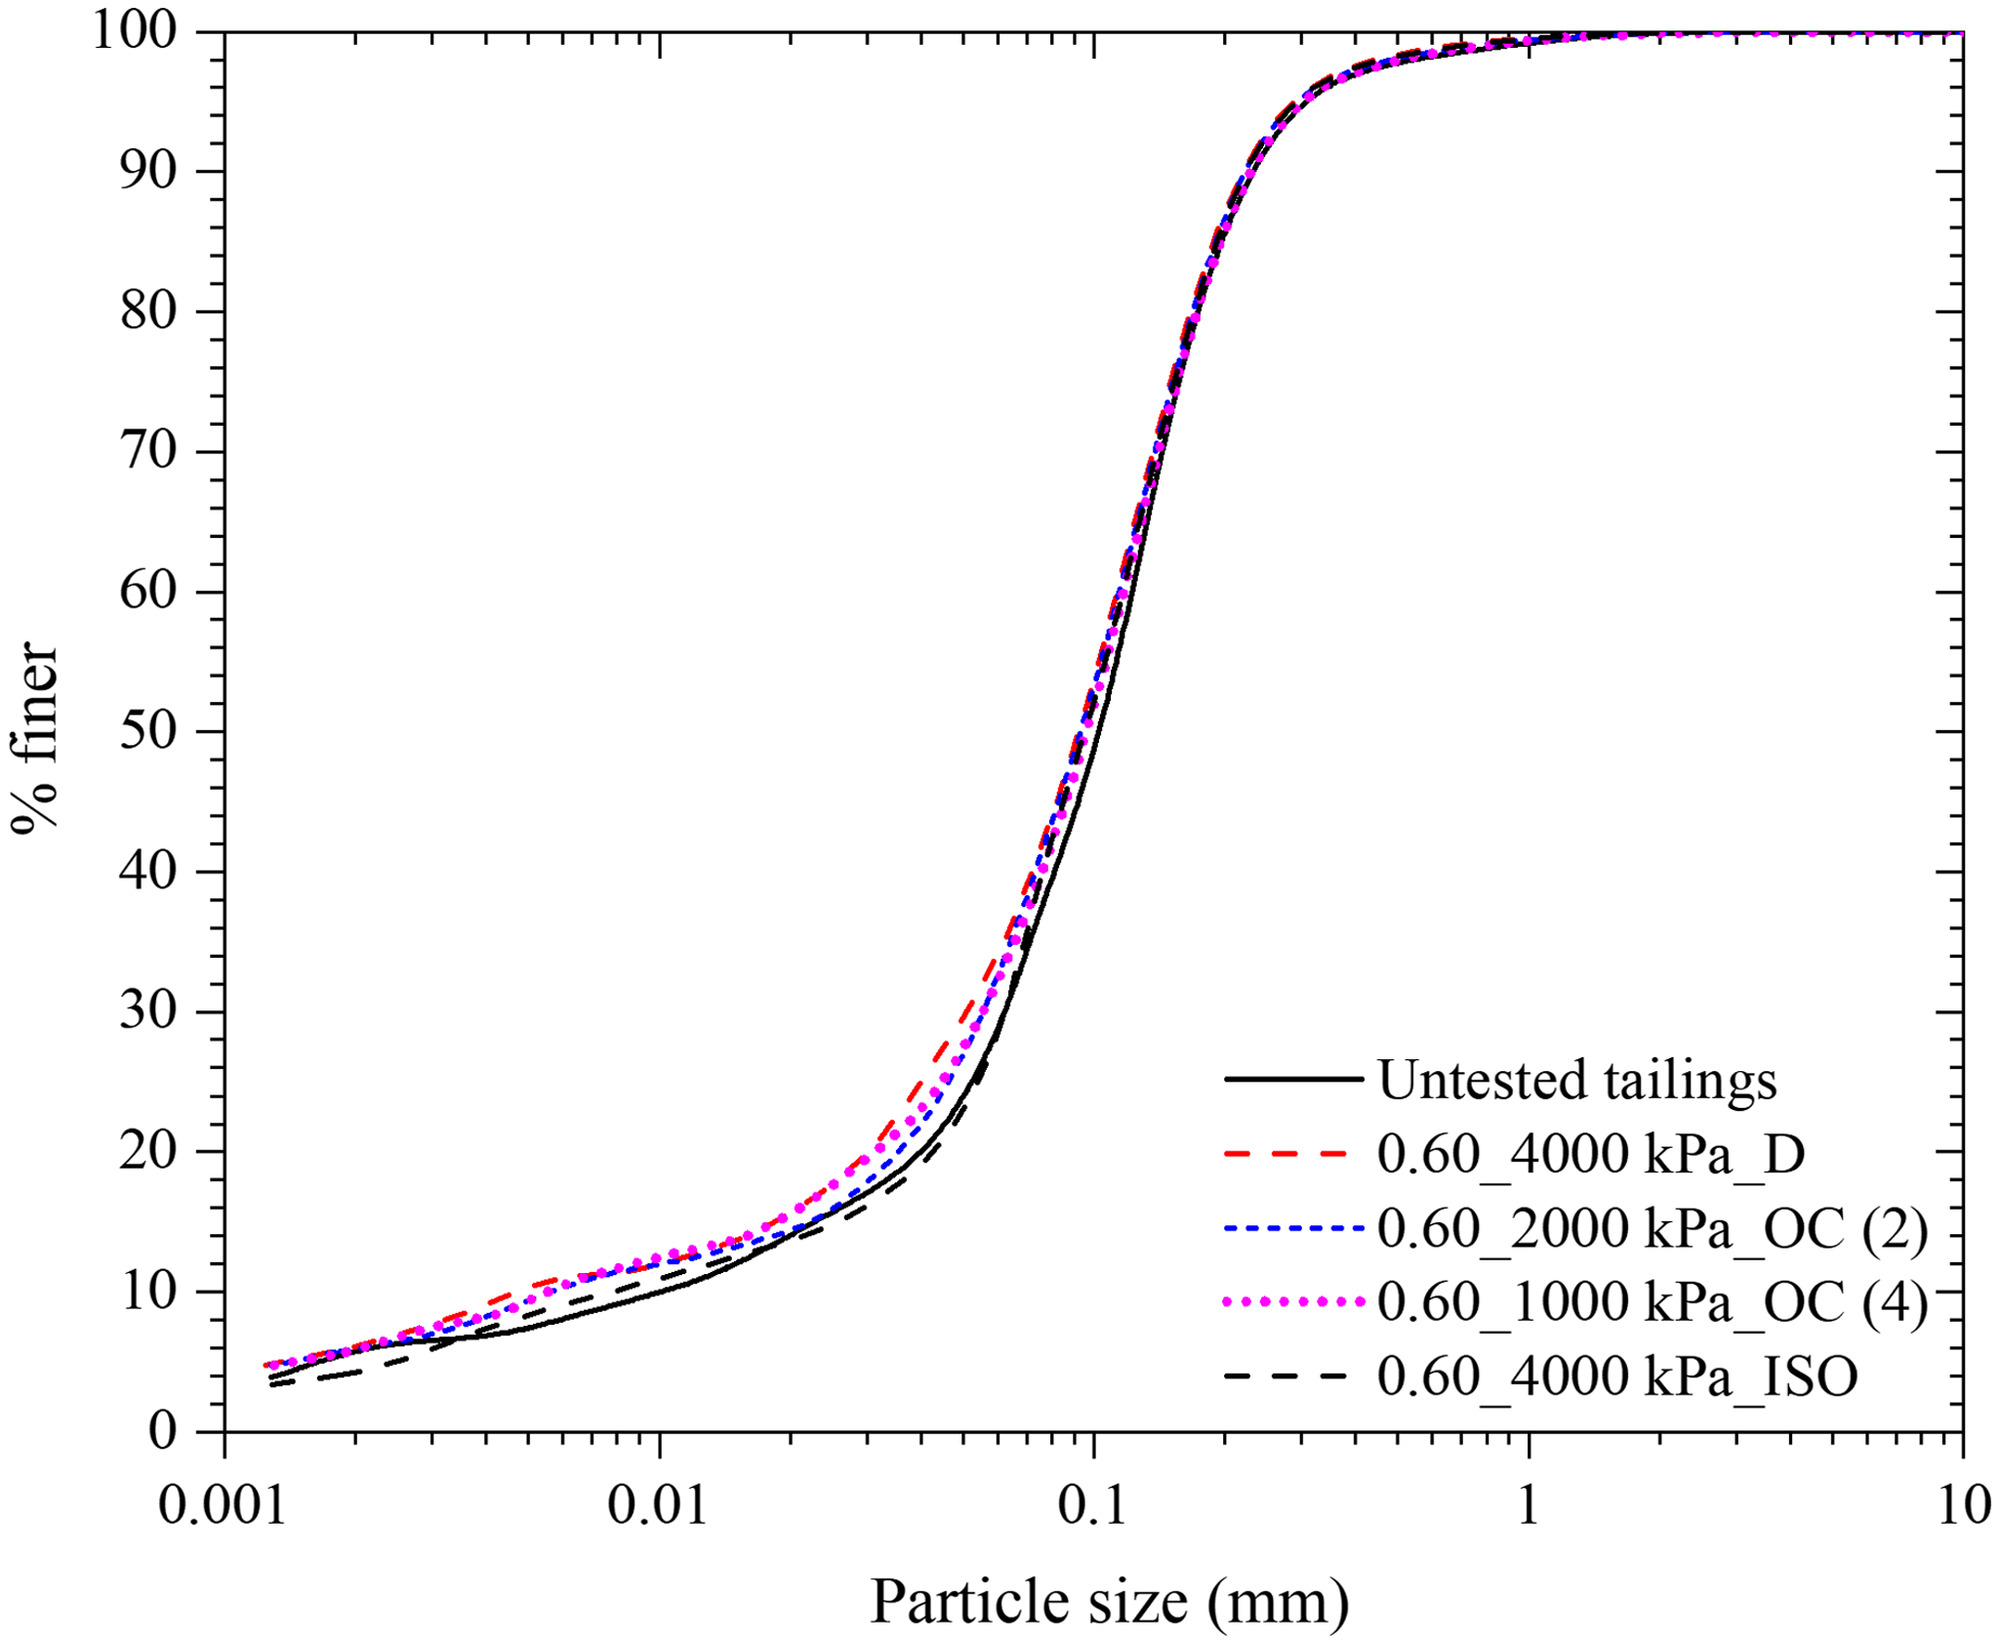
Mining is an important economic activity worldwide, and extracting minerals from ore demands comminution. Therefore, ore processing includes simple crushing and screening methods (to obtain the coarser iron products) as well as more-sophisticated processes (to upgrade the ore quality and recover iron from smaller particles). All these processes result in large volumes of tailings worldwide. The iron ore tailings studied herein were collected from a beneficiation plant at Quadrilátero Ferrífero in the central region of Minas Gerais in Brazil. This region is responsible for approximately 65% of all Brazilian iron ore production. The tailings were obtained at the exit plant after the filtering processing. The particle-size distribution is presented in Fig. 1 following ASTM D7928 (ASTM 2021a). The studied tailings were composed predominantly of fine sand (60%) and silt (32%) fractions. The tailings were classified as silty sand (SM) according to the Unified Soil Classification System (ASTM 2017), and were nonplastic.
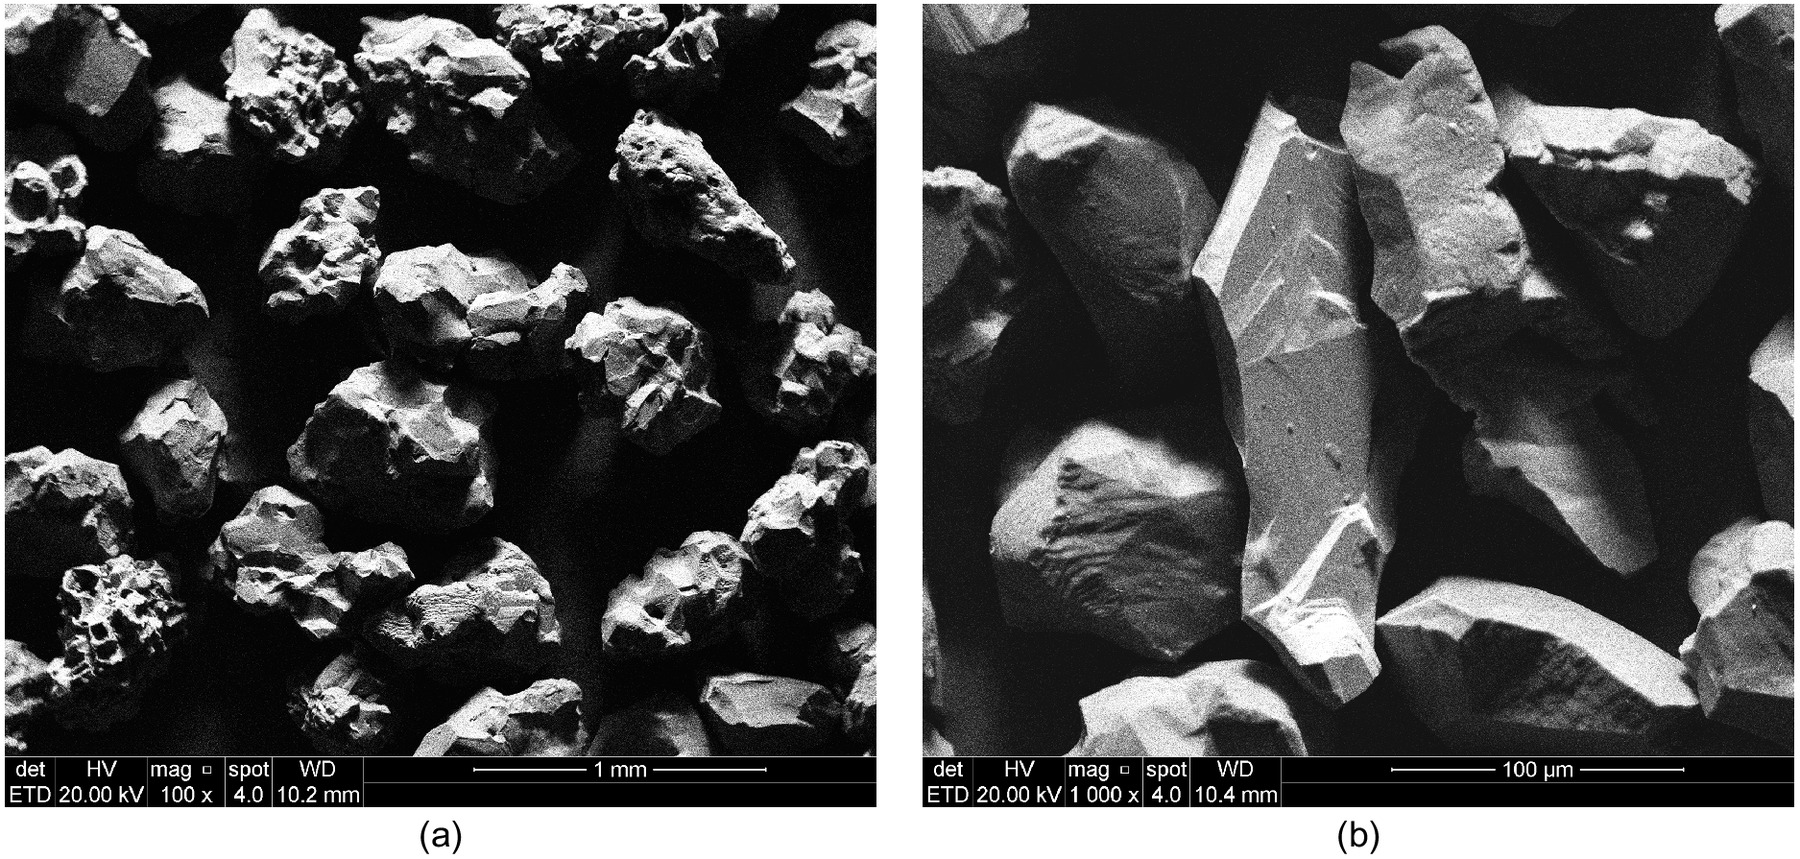
The industrial processing of the tailings provides some specific characteristics to these materials. Generally, the tailings are more angular and rougher than natural sands (e.g., Yang et al. 2019). The particle angularity and roughness also were observed in the present tailings using scanning electron microscopy (SEM) analysis for different particle sizes (Fig. 2). The beneficiation processes are not totally efficient, and the tailings had some residual iron contents. Energy-dispersive X-ray spectroscopy (EDS) analysis revealed that the iron ore tailings were composed mostly of iron oxide (28%) and quartz (64%). This high iron content affected the specific gravity (), which was evaluated in accordance with ASTM D854 (ASTM 2014). The compaction characteristics were assessed using the standard effort (, and ) in accordance with ASTM D698 (ASTM 2021b).
Testing Methods
The specimens were molded using moist tamping and static compaction, following the undercompaction method (Ladd 1978; Frost and Park 2003). Two molding conditions were adopted, one to obtain dense samples considering 100% of the compaction degree () and the other to obtain loose samples considering 85% of the compaction degree (). The necessary dry tailings weight was mixed with water to achieve the optimum moisture content of 12.8%. The specimens were molded in cylinders 50 mm in diameter and 100 mm in height. Three layers were used in this process, and the tops of the first and second layers were scarified to guarantee the adherence of the subsequent layer.
Conventional isotropically consolidated drained (CID) triaxial tests were performed to assess the mechanical response of the iron ore tailings over a broad range of initial effective confining pressures () and considering different stress histories. The specimens were named according to their stress history: overconsolidated (OC) refers to specimens that experienced some overconsolidation, whereas specimens molded in compression paths before the convergence to normal compression line (NCL) are referred to dense (D) or loose (L). Table 1 summarizes the 19 drained triaxial tests. The tests are identified using the notation , where is the void ratio at molding, is the initial confining pressure (50, 125, 250, 500, 1,000, 2,000, or 4,000 kPa), and indicates the stress history (OC, D, or L).
| Test | Molding | After isotropic compression | End of test | Peak | ||||||||||
|---|---|---|---|---|---|---|---|---|---|---|---|---|---|---|
| () | (kPa) | (kPa) | (kPa) | (degrees) | (kPa) | (kPa) | (degrees) | |||||||
| 0.79_50 kPa_L | 1.79 | 16.3 | 1.79 | 50 | 0.057 | 1.74 | 90.2 | 120.6 | 1.34 | 33.1 | 90.2 | 120.6 | 1.34 | 33.1 |
| 0.80_250 kPa_L | 1.80 | 16.2 | 1.78 | 250 | 0.064 | 1.70 | 433.8 | 551.3 | 1.27 | 31.6 | 433.8 | 551.3 | 1.27 | 31.6 |
| 0.79_500 kPa_L | 1.79 | 16.3 | 1.76 | 500 | 0.057 | 1.68 | 863.1 | 1,089.4 | 1.26 | 31.4 | 863.1 | 1,089.4 | 1.26 | 31.4 |
| 0.79_1000 kPa_L | 1.79 | 16.3 | 1.73 | 1,000 | 0.051 | 1.65 | 1,694.9 | 2,084.6 | 1.23 | 30.7 | 1,694.9 | 2,084.6 | 1.23 | 30.7 |
| 0.78_2000 kPa_L | 1.78 | 16.4 | 1.71 | 2,000 | 0.068 | 1.62 | 3,352.8 | 4,058.4 | 1.21 | 30.2 | 3,352.8 | 4,058.4 | 1.21 | 30.2 |
| 0.78_4000 kPa_L | 1.78 | 16.4 | 1.67 | 4,000 | 0.087 | 1.55 | 6,756.0 | 8,268.1 | 1.22 | 30.5 | 6,756.0 | 8,268.1 | 1.22 | 30.5 |
| 0.59_50 kPa_D | 1.59 | 18.4 | 1.59 | 50 | 1.62 | 97.1 | 141.4 | 1.46 | 35.9 | 120.4 | 211.1 | 1.75 | 42.7 | |
| 0.60_125 kPa_D | 1.60 | 18.2 | 1.60 | 125 | 1.68 | 250.5 | 376.6 | 1.50 | 36.9 | 288.3 | 489.8 | 1.70 | 41.5 | |
| 0.61_250 kPa_D | 1.61 | 18.1 | 1.60 | 250 | 1.66 | 484.0 | 701.9 | 1.45 | 35.7 | 558.1 | 924.4 | 1.66 | 40.5 | |
| 0.60_500 kPa_D | 1.60 | 18.2 | 1.57 | 500 | 1.62 | 1,059.0 | 1,677.1 | 1.58 | 38.8 | 1,086.3 | 1,758.9 | 1.62 | 39.6 | |
| 0.60_1000 kPa_D | 1.60 | 18.3 | 1.57 | 1,000 | 1.59 | 1,994.2 | 2,982.5 | 1.50 | 36.8 | 2,101.7 | 3,305.0 | 1.57 | 38.5 | |
| 0.60_2000 kPa_D | 1.60 | 18.2 | 1.55 | 2,000 | 1.56 | 3,448.8 | 4,346.5 | 1.26 | 31.4 | 3,706.8 | 5,120.4 | 1.38 | 34.2 | |
| 0.60_4000 kPa_D | 1.60 | 18.2 | 1.55 | 4,000 | 1.51 | 7,002.5 | 9,007.5 | 1.29 | 32.0 | 7,034.1 | 9,110.7 | 1.30 | 32.2 | |
| 0.60_50 kPa_OC (4) | 1.60 | 18.2 | 1.60 | 50 | 1.65 | 88.1 | 114.2 | 1.30 | 32.2 | 118.5 | 205.5 | 1.73 | 42.3 | |
| 0.60_1000 kPa_OC (4) | 1.60 | 18.2 | 1.57 | 1,000 | 1.60 | 1,513.5 | 1,548.8 | 1.02 | 25.9 | 1,925.2 | 2,797.2 | 1.45 | 35.8 | |
| 0.60_1000 kPa_OC (2) | 1.60 | 18.2 | 1.57 | 1,000 | 1.62 | 1,652.0 | 1,955.9 | 1.18 | 29.6 | 1,927.6 | 2,782.7 | 1.44 | 35.6 | |
| 0.60_2000 kPa_OC (2) | 1.60 | 18.2 | 1.54 | 2,000 | 1.58 | 3,119.6 | 3,358.8 | 1.08 | 27.2 | 3,659.9 | 4,979.7 | 1.36 | 33.7 | |
| 0.78_50 kPa_L_Undrained | 1.78 | 16.4 | 1.78 | 50 | 0.040 | 1.78 | 0.00 | 0.00 | — | — | 29.51 | 35.09 | 1.19 | 29.7 |
| 0.60_4000 kPa_D_ISO | 1.60 | 18.2 | 1.55 | 4,000 | — | — | — | — | — | — | — | — | — | |
Two extra tests were performed after defining the critical state line (CSL) over the initial range of effective confining pressures. One isotropically consolidated undrained (CIU) triaxial test with was conducted to check the CSL intercept adopted, and one isotropic compression test initially with was conducted up to the highest pressures achievable within the apparatus considered (4,000 kPa) to verify the influence of breakage during isotropic compression.
The recommendations of ASTM D7181 (ASTM 2020b) and ASTM D4767 (ASTM 2020a) were followed. Thus, the tests were performed on fully saturated specimens that were subjected to a saturation process composed of carbon dioxide percolation, water percolation, and application of back-pressure increments (maintaining a mean effective stress constant of 20 kPa). The Skempton values were measured after the saturation was finished, and were greater than 0.98. The consolidation phase was conducted by increasing the chamber pressure at a constant rate up to the desired value. The rate varied from 2 to and was adequate, because no excess pore pressure was generated during this procedure. All specimens were maintained under the desired confining pressure for at least 30 min, or until the volumetric strains ceased, to avoid the effects of incomplete consolidation. After the consolidation was terminated, shearing was started at a rate of . The postshearing void ratio was determined using the moisture content of the specimen at the end of the test. The initial specific volumes were obtained following the procedure described by Shipton and Coop (2015). The procedure consists of obtaining the initial specific volumes in different forms in the most independent way possible. The average precision for specific volume determination obtained was 0.005.
The confining pressure and the back-pressure were monitored independently using electronic pressure transducers. Both were applied through a pressure controller by a servomotor system. The load was registered by a load cell. The axial external displacements were measured using a linear deformation transducer. Internally, two Hall effect sensors were used to evaluate the axial displacements, and one was employed to measure the radial displacements (Clayton and Khatrush 1986). The internal displacement measurements were taken throughout all the triaxial testing phases.
The use of internal measurements with the resolutions depicted in Table 2 allowed for the determination of stiffness from very small load increments. For the CID tests, the volume change was evaluated by measuring the flow volume of water entering and leaving the specimen using piston-type volume change devices. Table 2 presents the data acquisition and control system’s specifications, and Table 3 presents the devices’ measurement resolution.
| Device | Excitation (V) | Output (V) | Resolution (V) |
|---|---|---|---|
| Pressure transducers | 24 | 0–10 | |
| Load cell | 5 | ||
| Linear deformation transducer (LDT) | 10 | 0–10 | |
| Hall effect sensors | 10 | 0–10 | |
| Servomotors | 220 |
| Measurement | Device | Quantity | Resolution |
|---|---|---|---|
| Confining pressure | Pressure transducer | 1 | 0.2100 kPa |
| Back-pressure | Pressure transducer | 1 | 0.2100 kPa |
| External axial strain | LDT | 1 | 0.0015%a |
| Axial strain | Hall effect sensors | 2 | 0.0006%a |
| Radial strain | Hall effect sensors | 1 | 0.0012%a |
| Volumetric strain | Pressure controller | 1 | 0.0003%a |
a
Strain resolution based on cylindrical specimen initial dimensions.
Mechanical Response over a Broad Spectrum of Pressures
Compression Behavior
Fig. 3 presents the compression paths of the two specimens with different initial specific volumes () that achieved the highest confining pressure (4,000 kPa). The compression curves from different values converged very slowly, so even at the maximum stress level achieved, a unique NCL cannot be identified. Thus, for the usual and even for special tailings storage facilities in which the pressures would be at most in the range 2,000–10,000 kPa, the material would not be in a normally consolidated state.
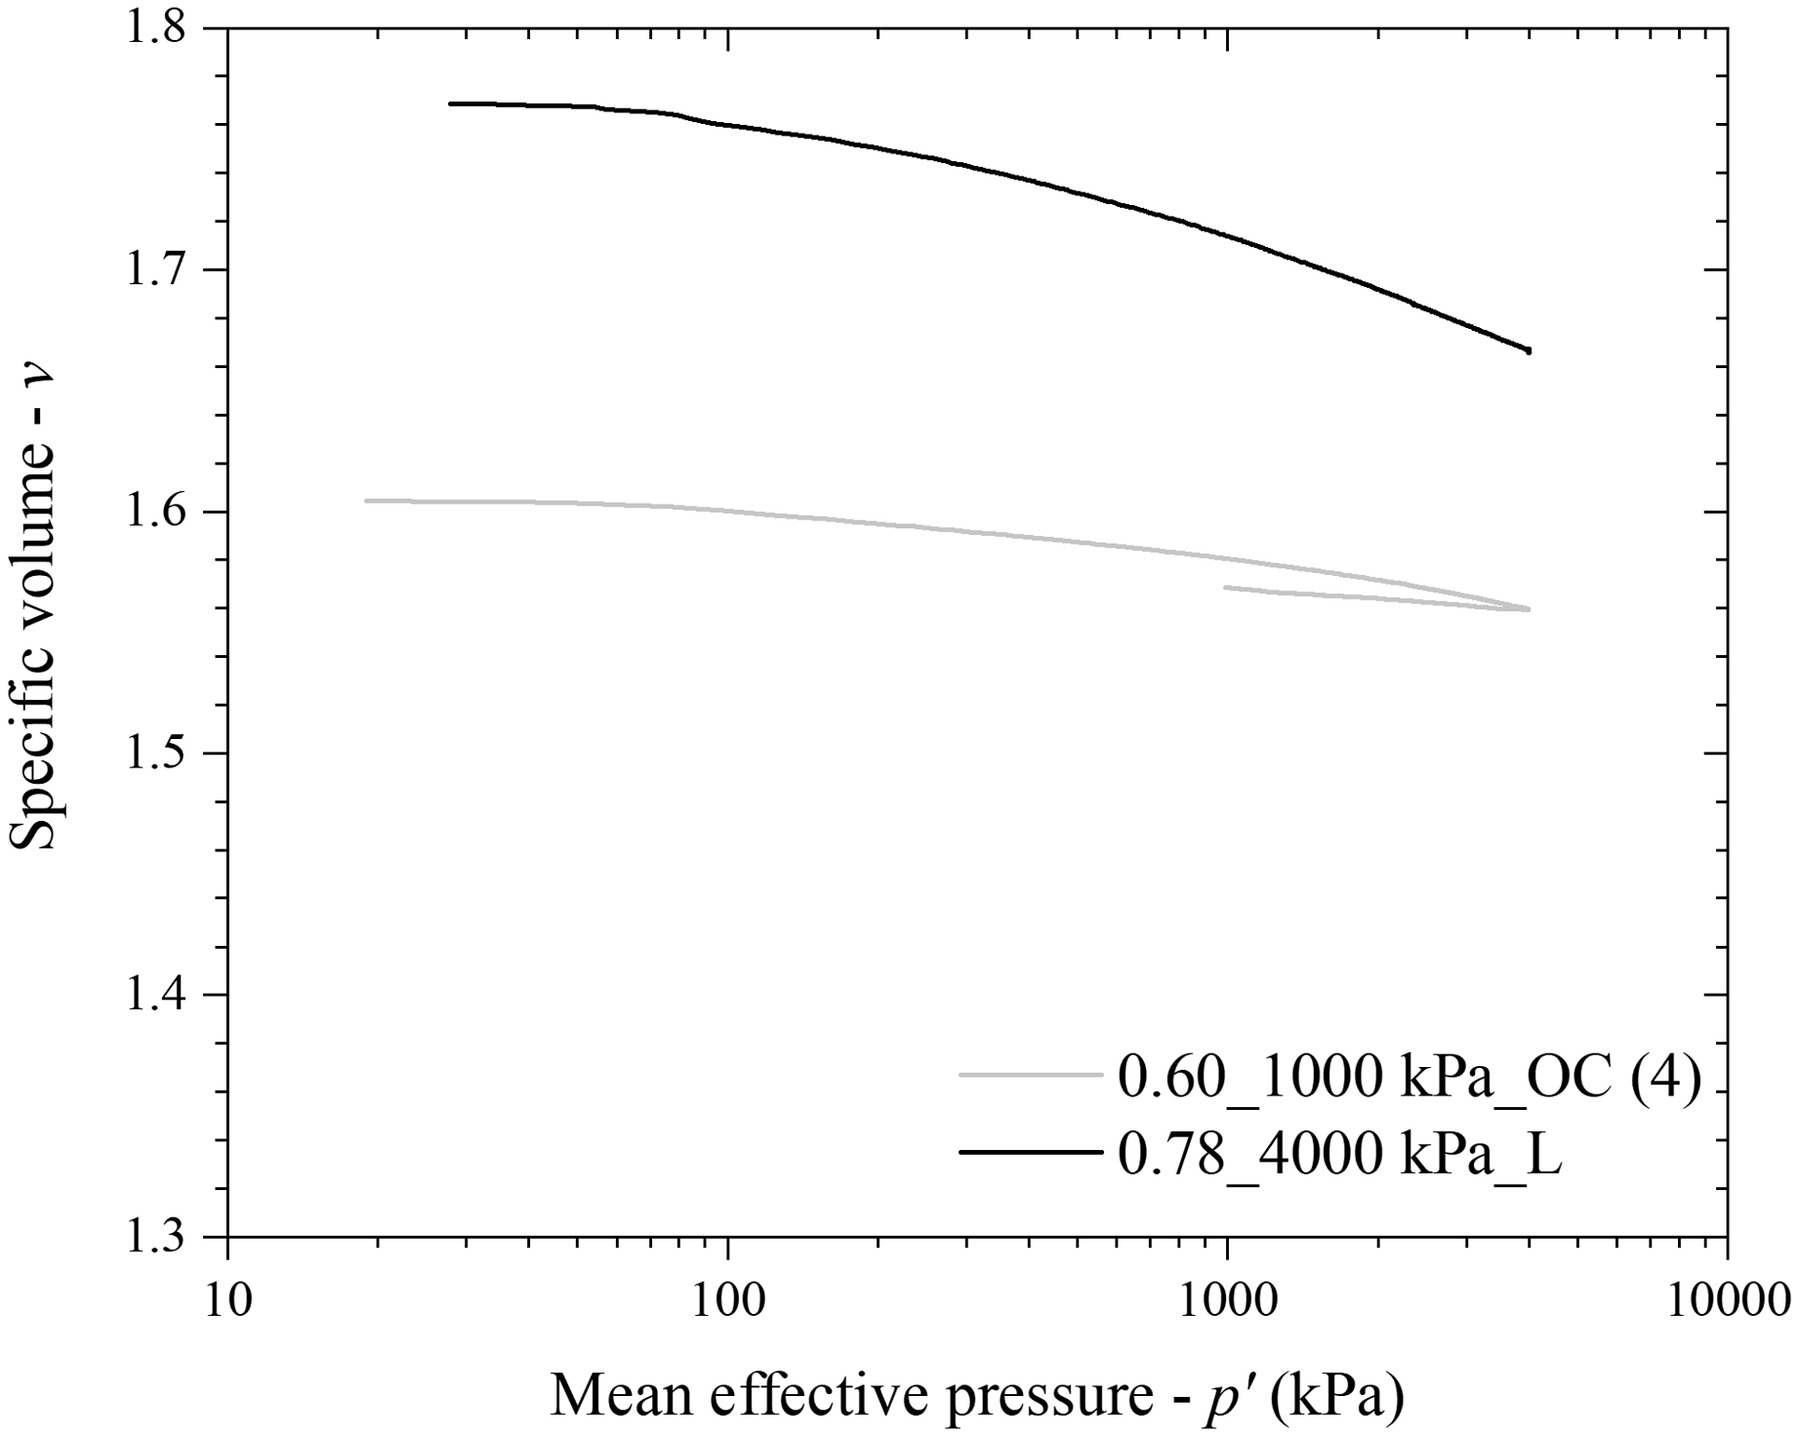
Fig. 3 also shows the unloading response of the dense specimen considering an overconsolidation ratio of 4. The slope of the unloading–reloading line is similar to the slope of the virgin consolidation line, which demonstrates the predominance of elastic strains during isotropic compression for dense specimens at this pressure range. This compression path also indicates that particle breakage had not yet become the main deformation mechanism, because the plastic strains on unloading still were low.
Shearing Behavior
This section presents the stress–strain behavior and the volume change response of the studied tailings in different initial states (loose, dense, and overconsolidated) for different stress levels. Only the tests sheared with 50, 1,000, and 2,000 kPa of confining pressure are presented for brevity. The overall characteristics of the tests are presented in Table 1.
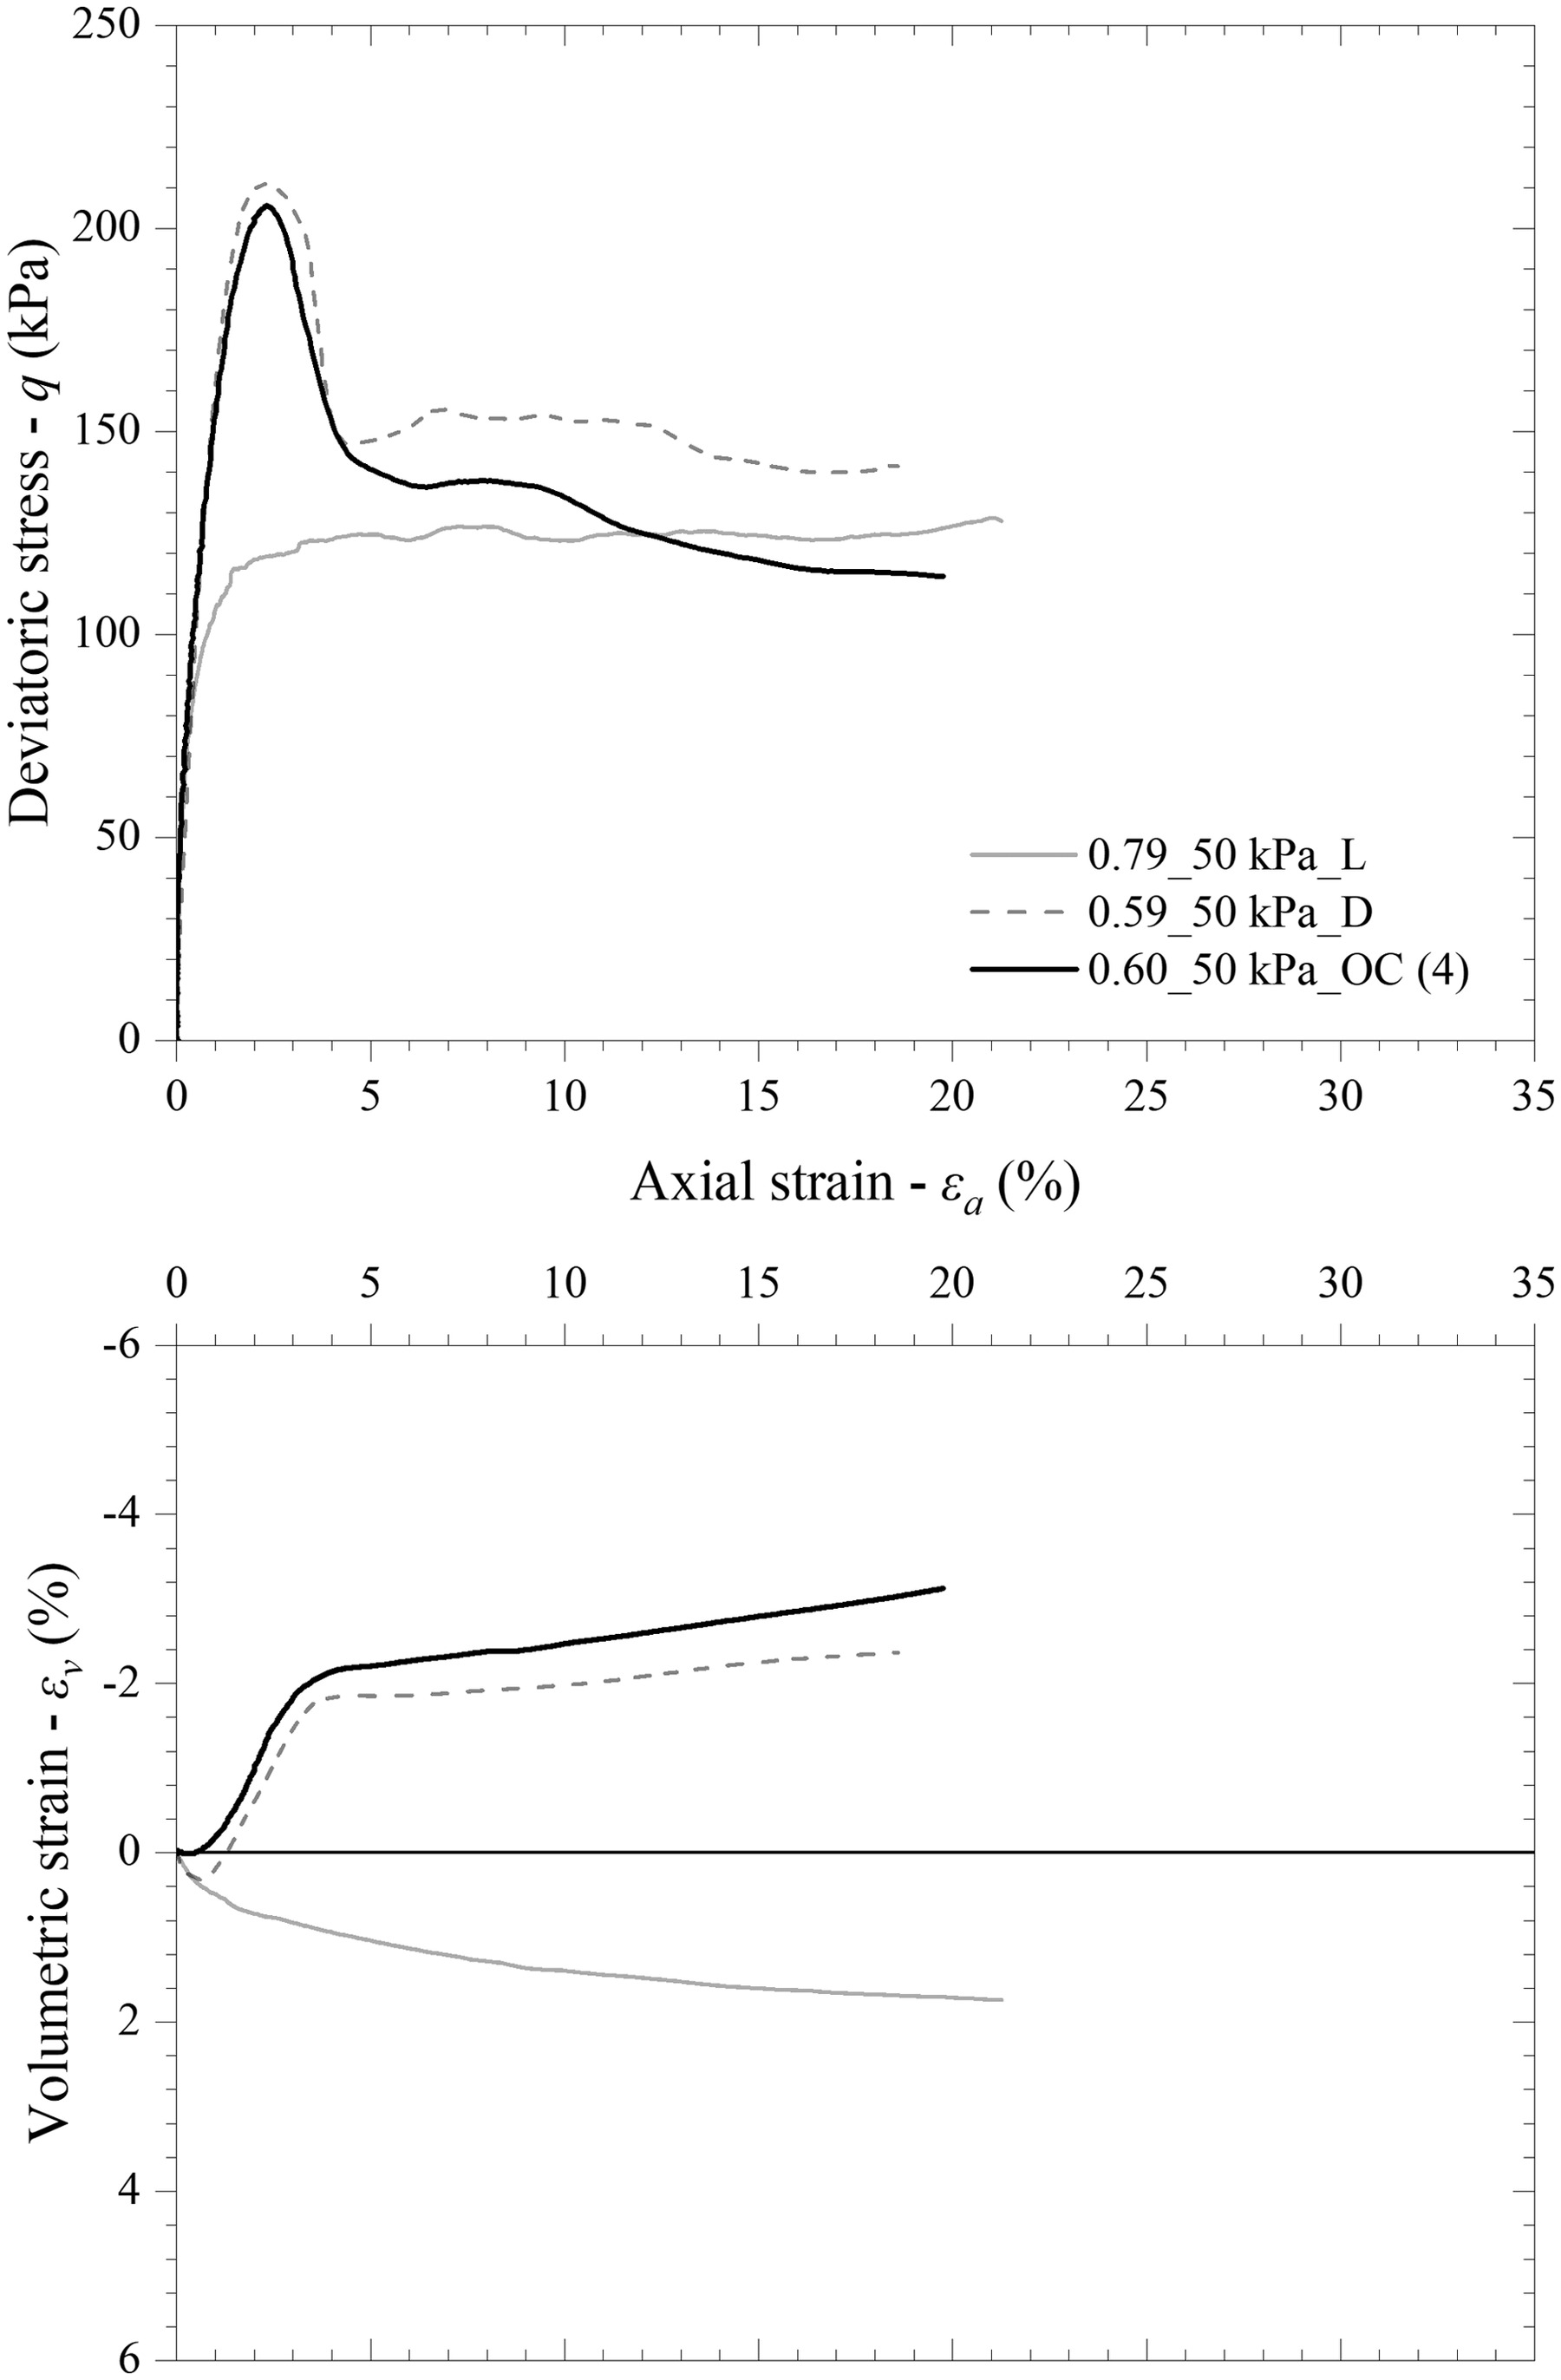
The stress history influence on the iron ore tailings’ mechanical response was evaluated at two stress levels by comparing overconsolidated specimens with nonoverconsolidated specimens. Fig. 4 presents the stress–axial strain–volumetric strain response for the specimens sheared under 50 kPa confining pressure. The overconsolidation did not significantly affect the stress–strain response, as would be expected for granular materials. This occurred because the strength mobilization in these materials is due to friction between grains, without chemical or cementing bonding’s contributions. The peak strength and the initial stiffness were very similar for dense or overconsolidated specimens. Even the void ratio at the beginning of shearing was similar, indicating the small effect decurrent of the loading and unloading process. The main difference between the tests sheared under 50 kPa confining stress was that the initial volumetric compression was suppressed in the overconsolidated specimen because it already had experienced these strains during the isotropic compression up to a 4- times higher load (200 kPa).
The stress history influence also was evaluated at higher pressures. For the tests sheared with shown in Fig. 5(a), the overconsolidation mainly affected the volumetric response. However, the overconsolidation ratio (the ratio of to at the beginning of shear) did not influence the maximum strength and volumetric strains. Both overconsolidated specimens had higher dilative volumetric strains and smaller compression than the dense specimen. Because the void ratios at the beginning of shearing were very similar for OC and D specimens, the differences in volumetric behavior can be associated with changes in the particles arrangement after experiencing higher confining pressures (2,000 or 4,000 kPa). In the tests sheared with [Fig. 5(b)], in addition to the changes in volumetric response, the main difference was that the overconsolidated () specimen had a slightly lower peak strength than the dense specimens sheared under the same confinement level. For all stress levels, the results of the ultimate strength are difficult to compare due to the very marked strain localization occurring for these specimens.
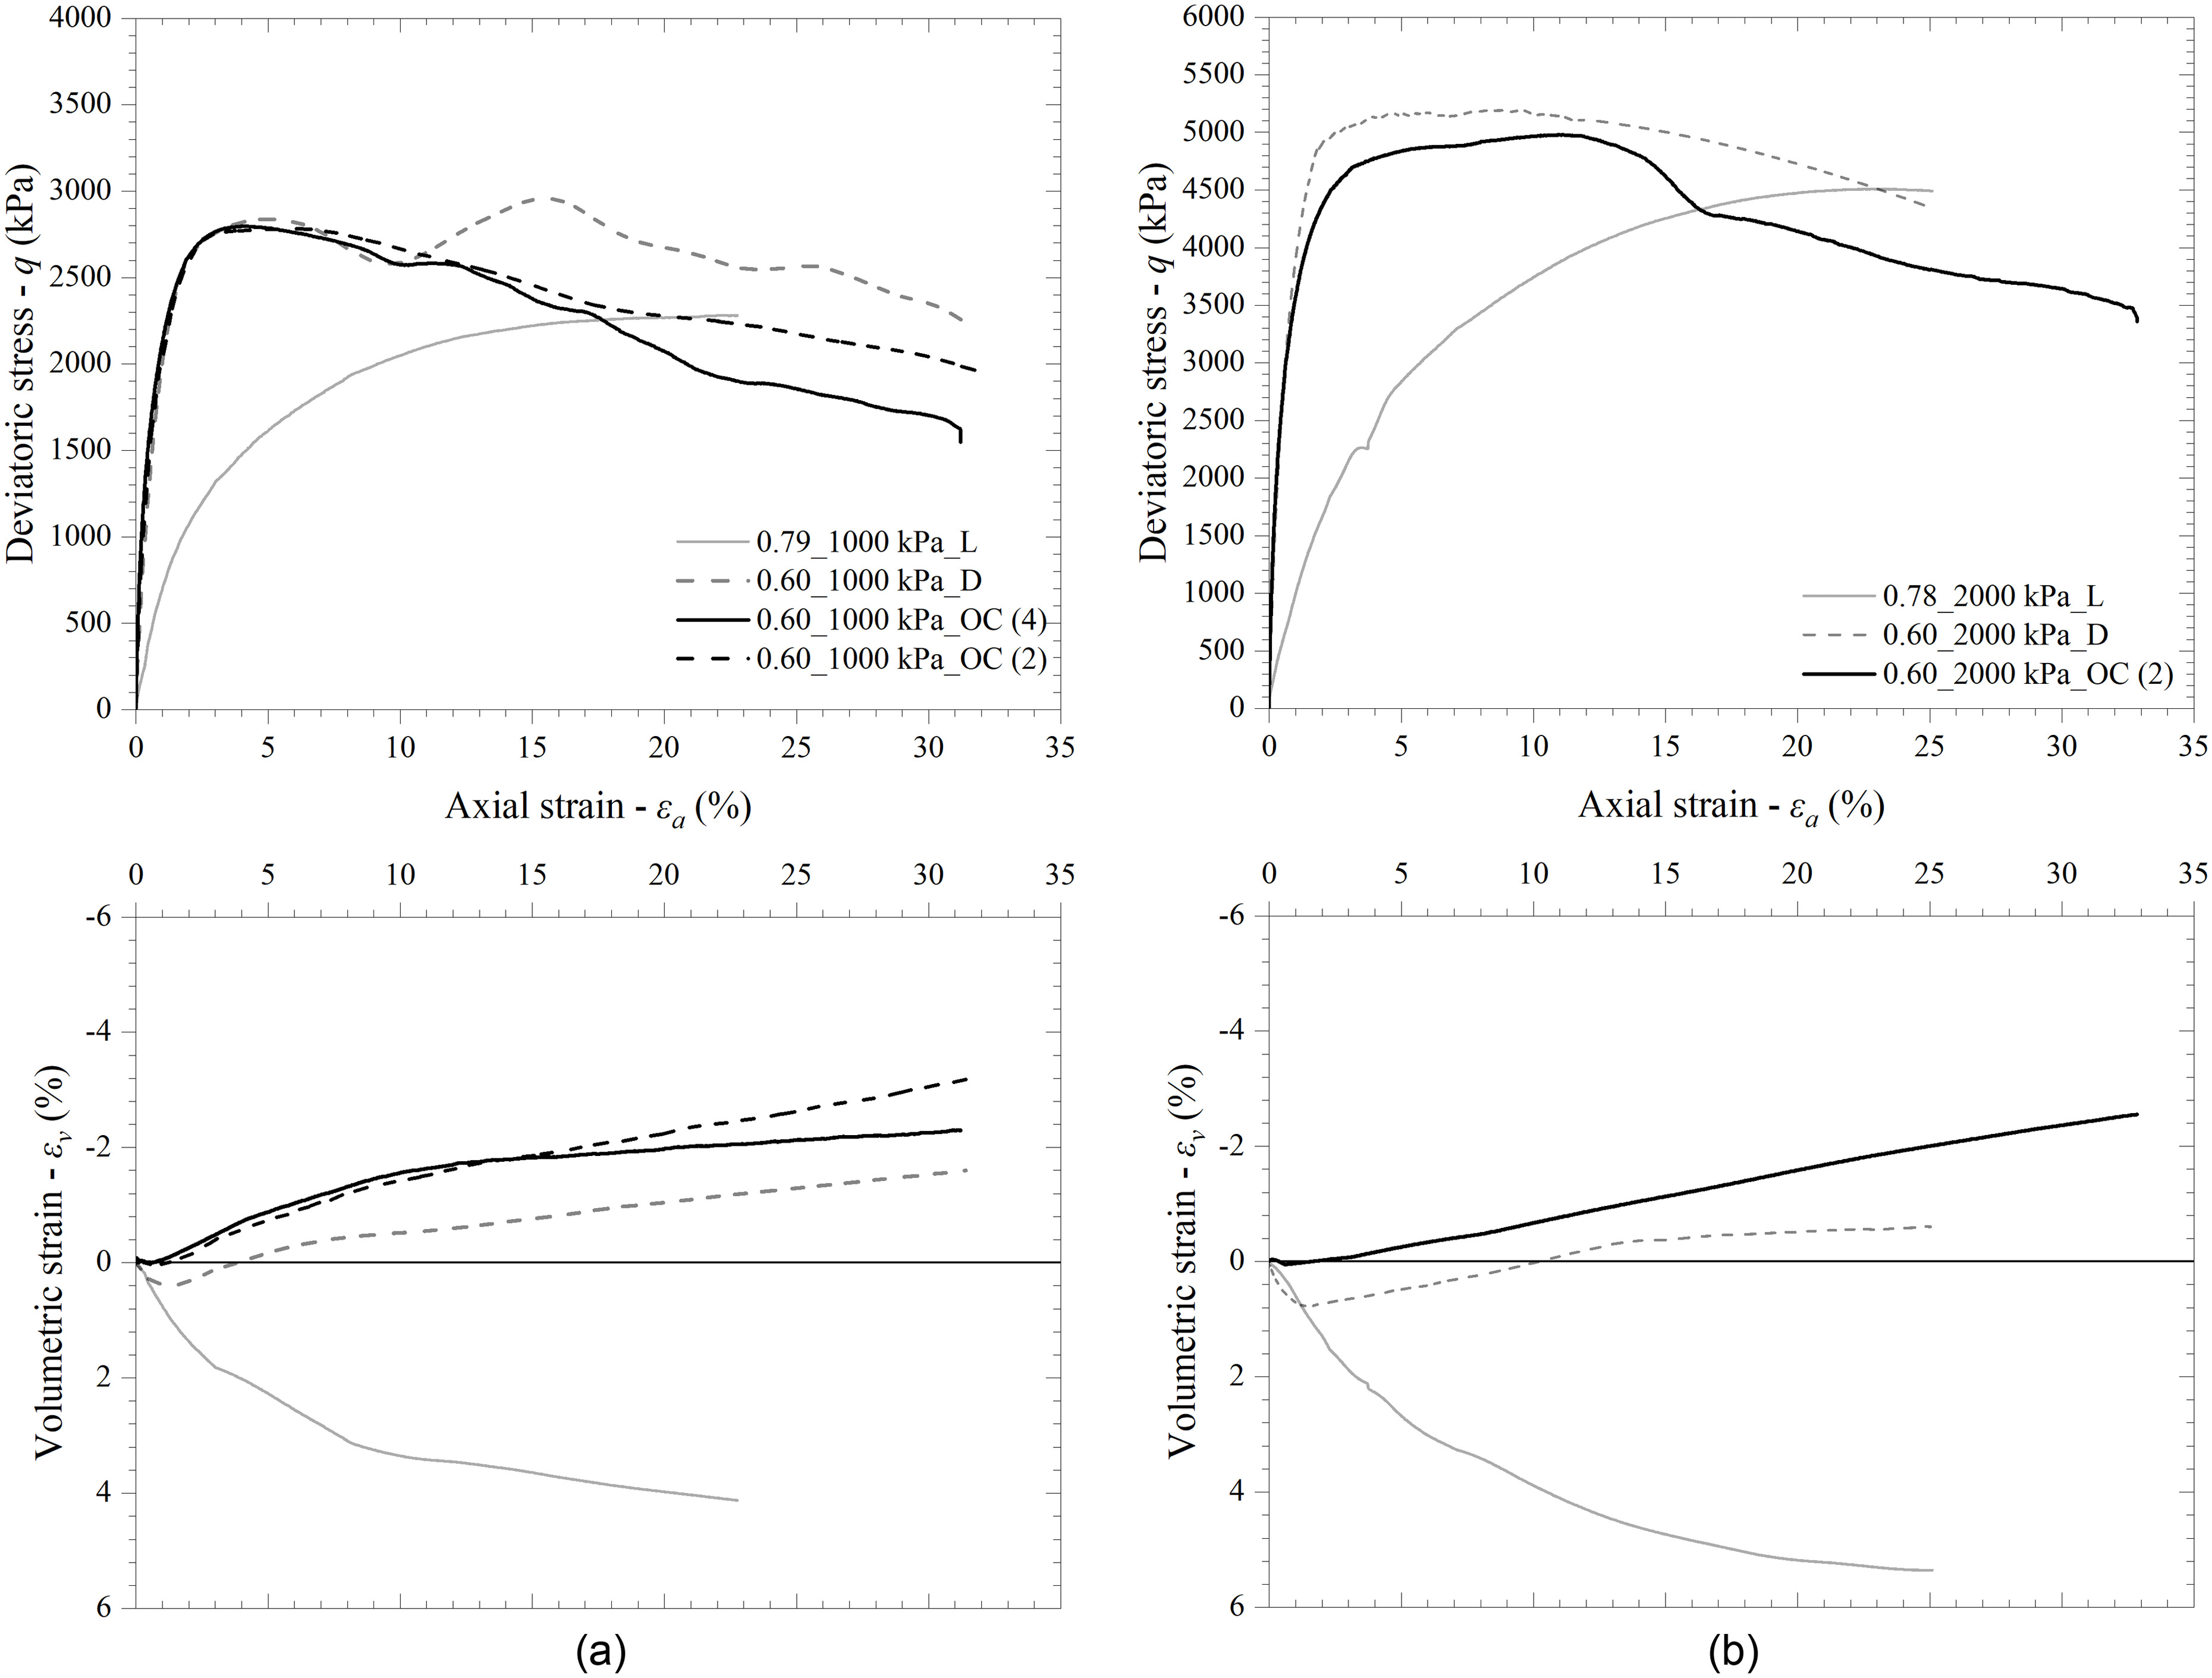
It is possible to associate the overconsolidated specimens’ lower peak strength (compared with that of the dense specimens) and distinct volumetric response with particle morphology and arrangement changes during isotropic compression and shearing. In the overconsolidated tests, the grain arrangement already had been modified to support higher stress than those experienced at a given moment, and the higher pressures can change the particles’ roughness and shape, which facilitates their relative movement. These differences could have reduced the interlocking contribution to the behavior of overconsolidated specimens.
Figs. 4 and 5 also plot the tests performed in initially loose conditions. A fully contractive volumetric response and a strain-hardening behavior are verified. The deviatoric stress after the peak of dense and overconsolidated specimens tended to the maximum strength of the loose specimen. However, there was no full convergence due to postpeak strain localization in the dense and overconsolidated specimens.
Critical State
The critical state line (CSL) in the --plane was estimated considering the stability in the deviatoric stress and the volumetric strains. Moreover, only tests performed with loose specimens were considered in the fitting due to the strain localization in dense specimens. Fig. 6 shows the CSL obtained. The fitting resulted in an value of 1.29, corresponding to a critical state friction angle of approximately 32.1°. Fig. 6 also demonstrates the suitability of the estimated CSL by analyzing the normalized results concerning the stress ratio () versus shear strain.
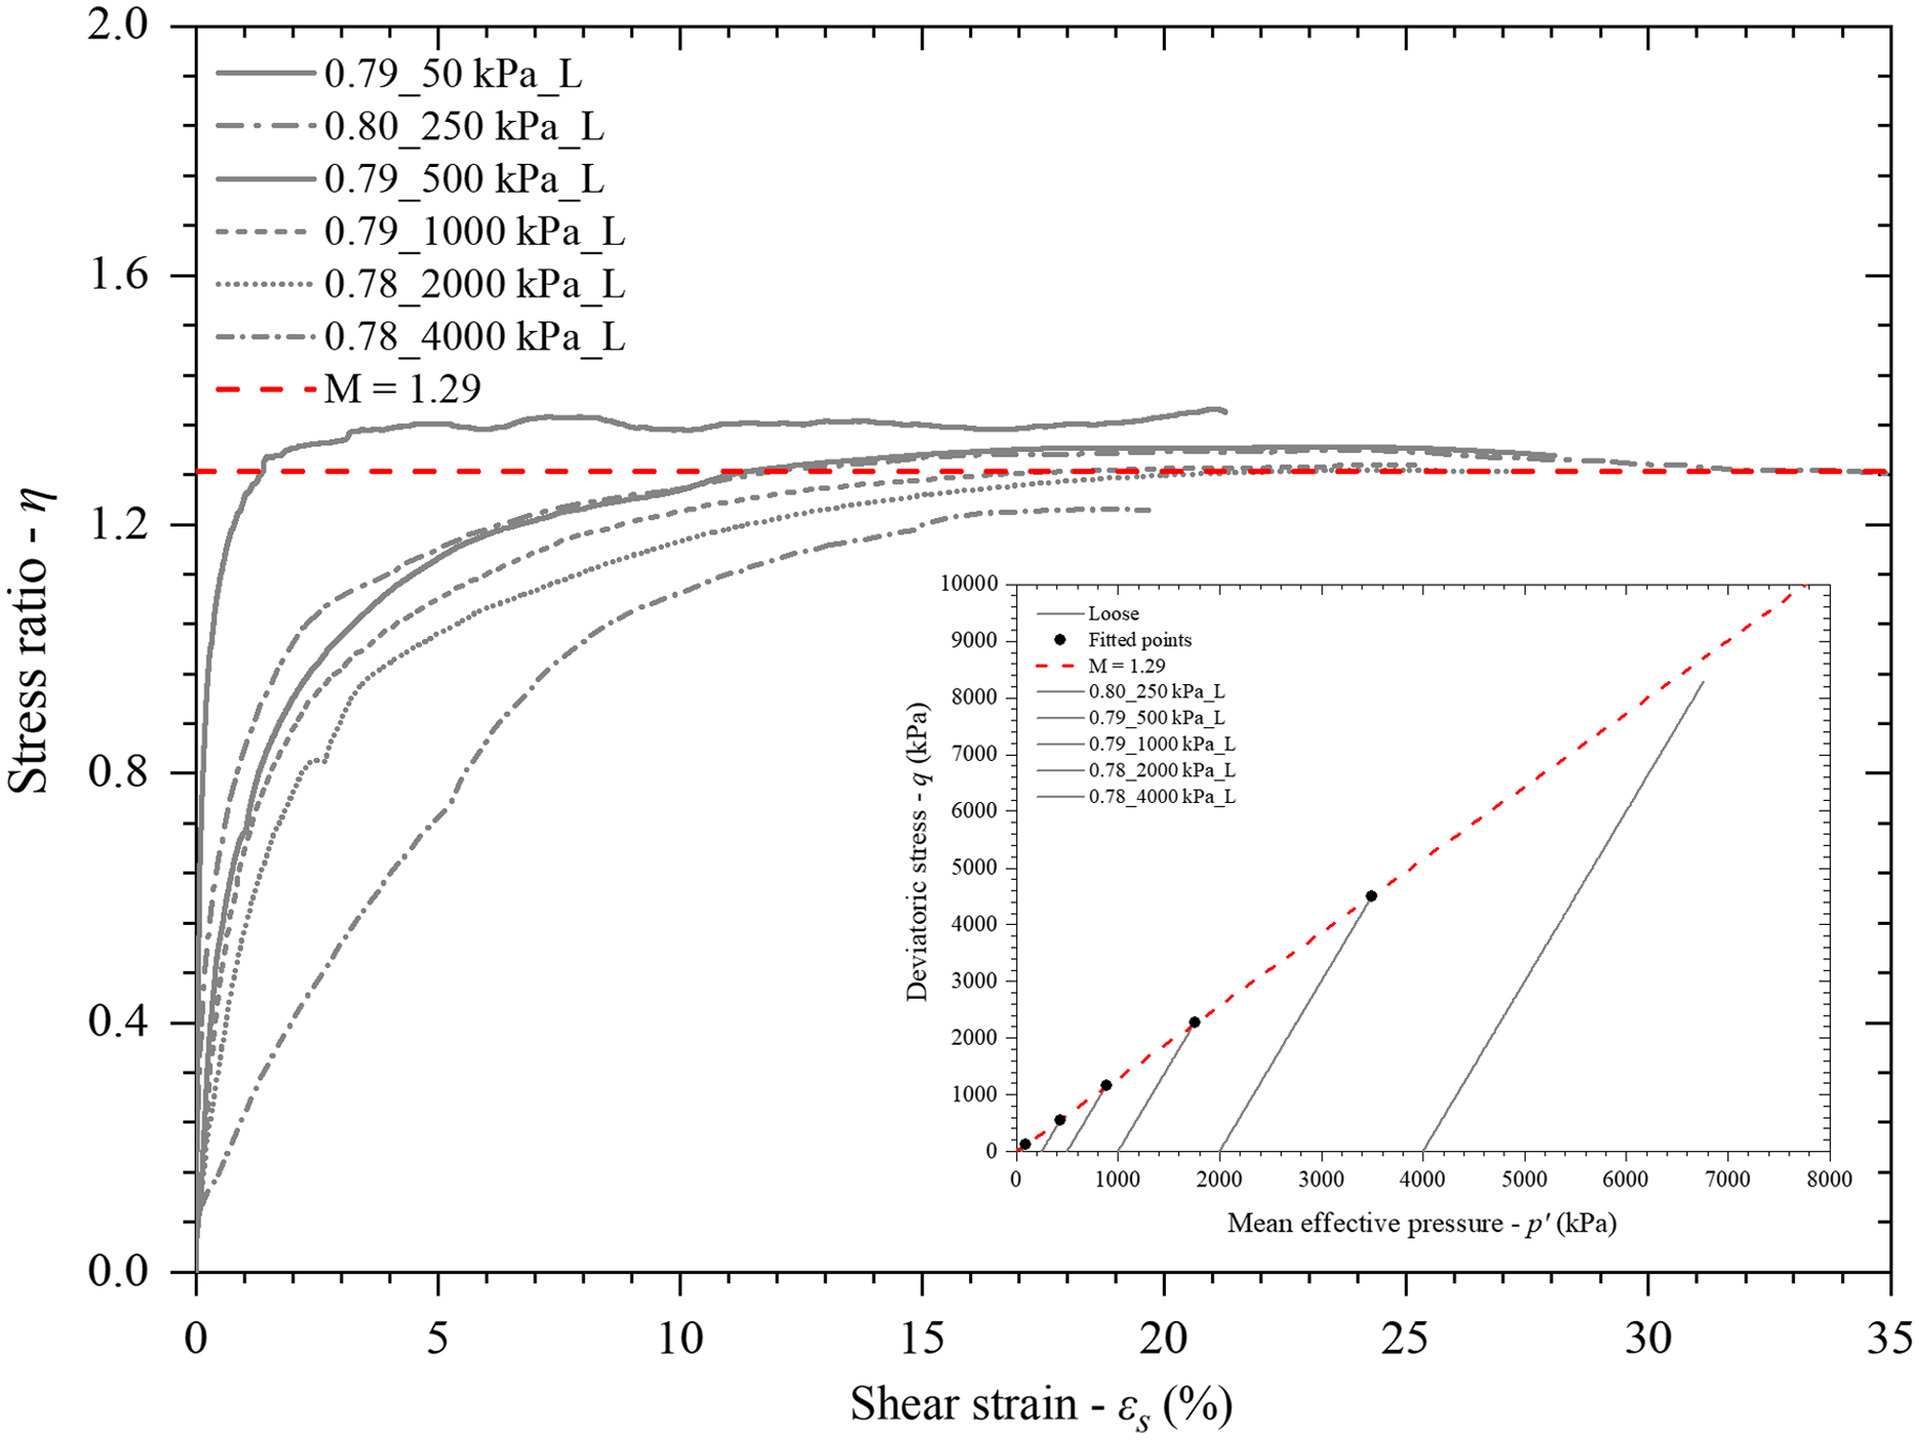
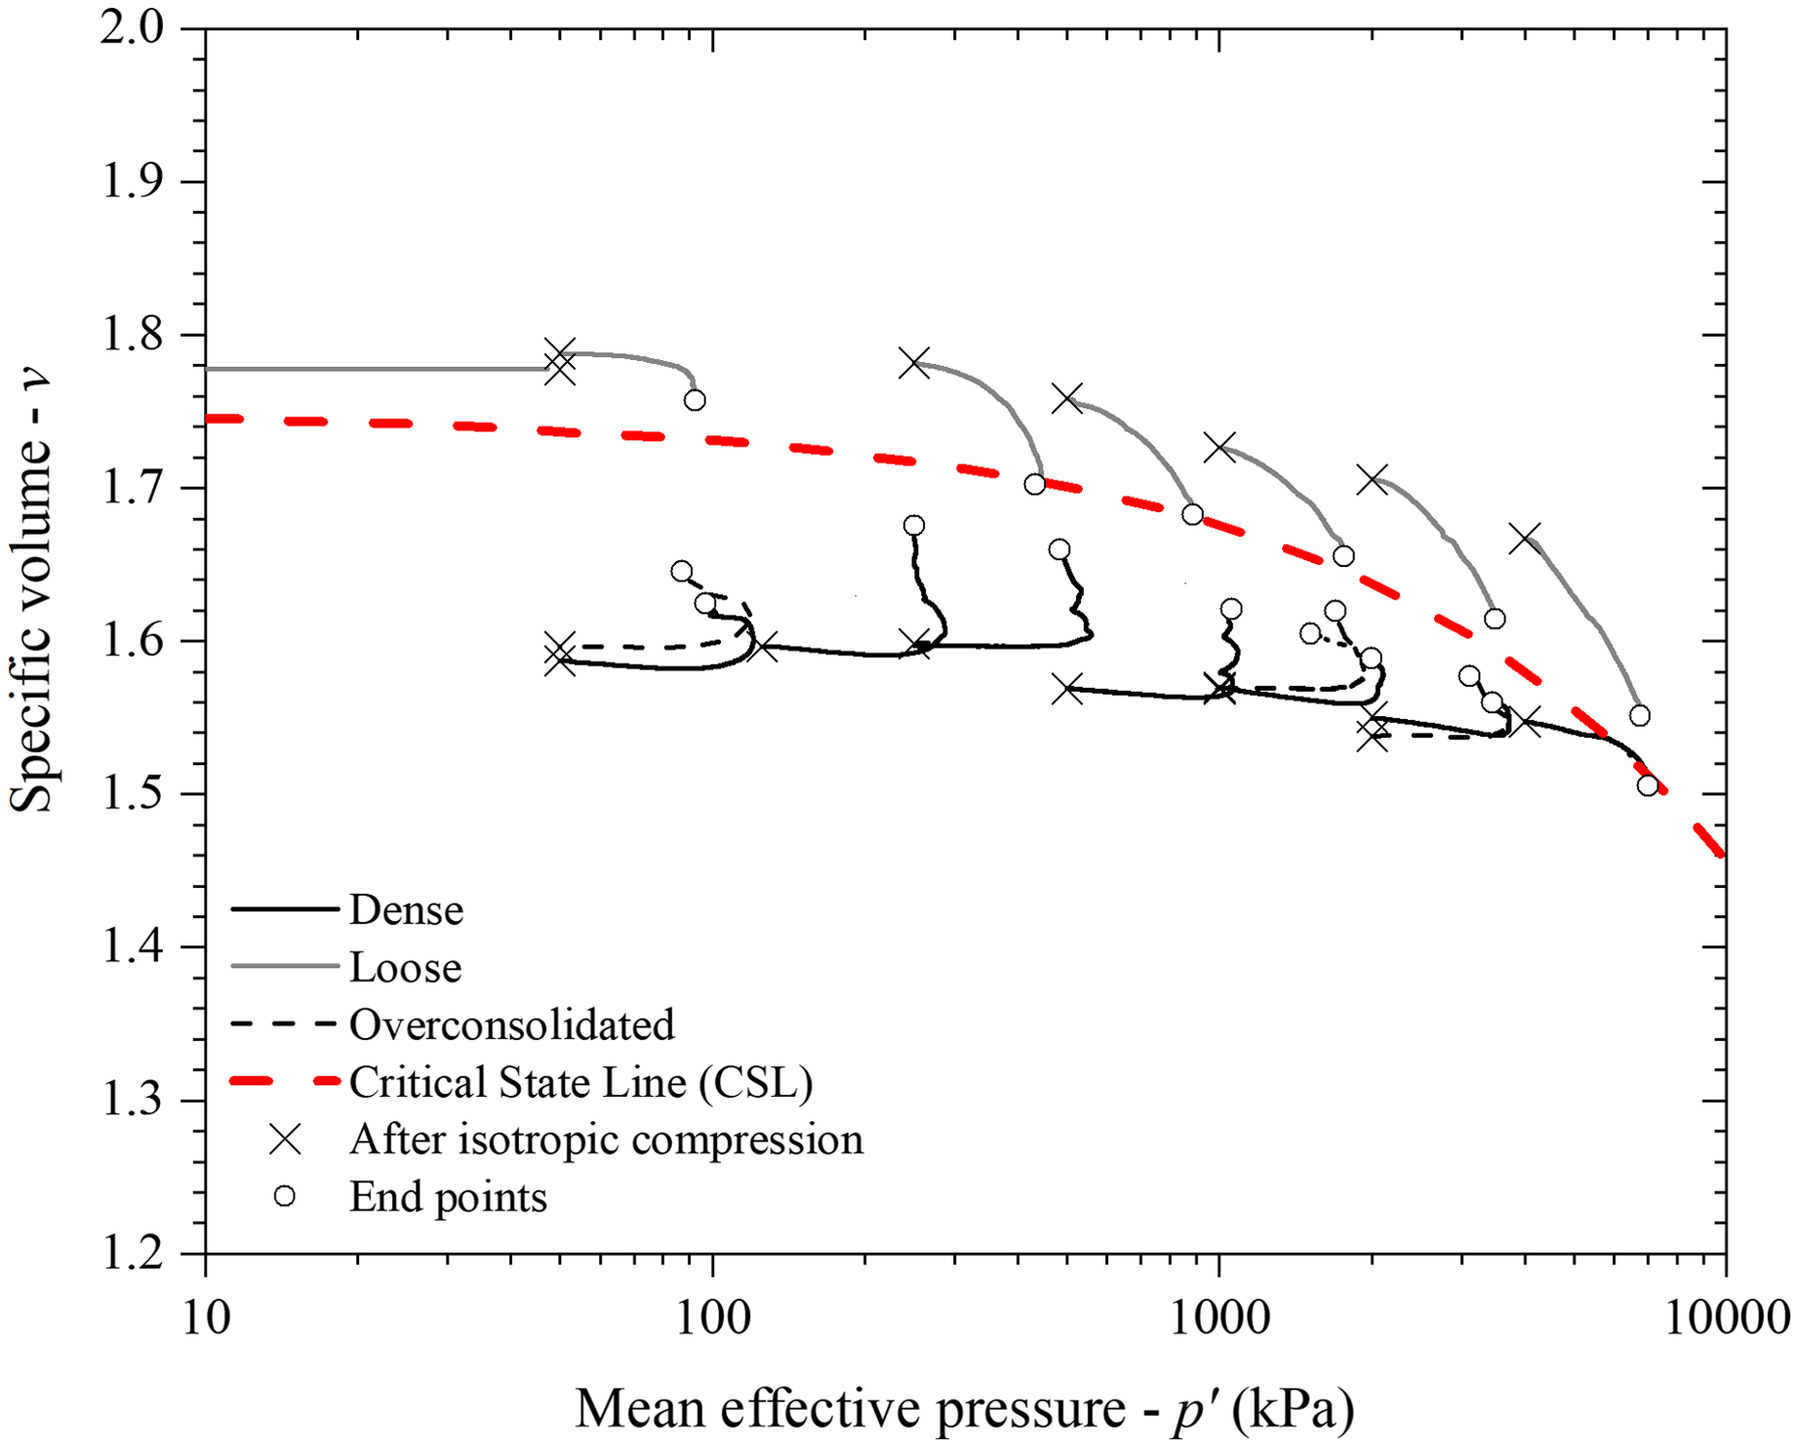
The loose, dense, and overconsolidated specimens delimited the CSL, making it possible to define the critical state locus in the , -plane (Fig. 7). However, the CSL was determined using the endpoints of the tests that were closer to the critical state condition. Dense and overconsolidated specimens were not used in this adjustment because they had not yet achieved constant volume and stress states and presented significant strain localization. In addition, a loose specimen was tested under undrained conditions at low stresses to verify the CSL intercept () adopted. As the specimen was looser than at the beggining of shearing, it must liquefy ( and tending to zero), as was observed. The curved CSL fitted were obtained using a power law to include all the stress ranges testedwhere = curve intercept; = initial curve slope; is an exponent that controls the curvature; and was chosen as 100 kPa. The values adopted were , , and .
(1)
Discussion
Stiffness
Pure isotropic hardening usually is assumed for geomaterials, although soils follow a conjunction of kinematic and isotropic hardening (Gajo and Muir Wood 1999; Jardine 1992; Kuwano and Jardine 2007). Kinematic hardening is the translation of the yield surfaces in the stress space without necessarily increasing its size and maintaining a constant shape (Mróz 1967). A kinematic hardening approach can model the typical stiffness degradation presented by soils. This is achieved by introducing a very small elastic region that moves with the current stress state (Gajo and Muir Wood 1999). Additionally, this approach can be extended to the concept of multiple surfaces and different degrees of yielding up to large yielding, at which abrupt changes in stress–strain response can be noticed (Jardine 1992).
Adopting kinematic hardening also allows for retaining information regarding the soil’s recent stress history. Atkinson et al. (1990) defined the recent stress history as the most recent loading followed by the material to reach the current state and the time required to do so, or a sudden change in the stress path direction. They characterized the recent stress history of soil using the angle of rotation required to follow the new stress path, with clockwise rotation taken as positive.
The effects of recent stress history on soil behavior have been investigated extensively for clays (e.g., Atkinson et al. 1990; Jardine 1992; Stallebrass and Taylor 1997; Baudet and Stallebrass 2004). Other authors (e.g., Kuwano and Jardine 2007; Hong et al. 2017) have verified the influence of recent stress history on sands. In studying clays, Stallebrass and Taylor (1997) found equal stiffness degradation curves for stress paths with a recent stress history of 90° and . These angles of stress path rotation were achieved through isotropic compression followed by shearing at a constant triaxial compression () or extension (90°) stress path. However, the latter recent stress history also could be achieved by isotropically overconsolidating the specimen, then returning to the original pressure and shearing at a constant triaxial compression path. Hong et al. (2017) performed this procedure for Toyoura sand and achieved results equivalent to those of Stallebrass and Taylor (1997). Fig. 8 presents the recent stress history and stiffness degradation from Hong et al. (2017) for Toyoura sand [Figs. 8(a and b)] and the results obtained herein for iron ore tailings under low stress levels [Figs. 8(c and d)].
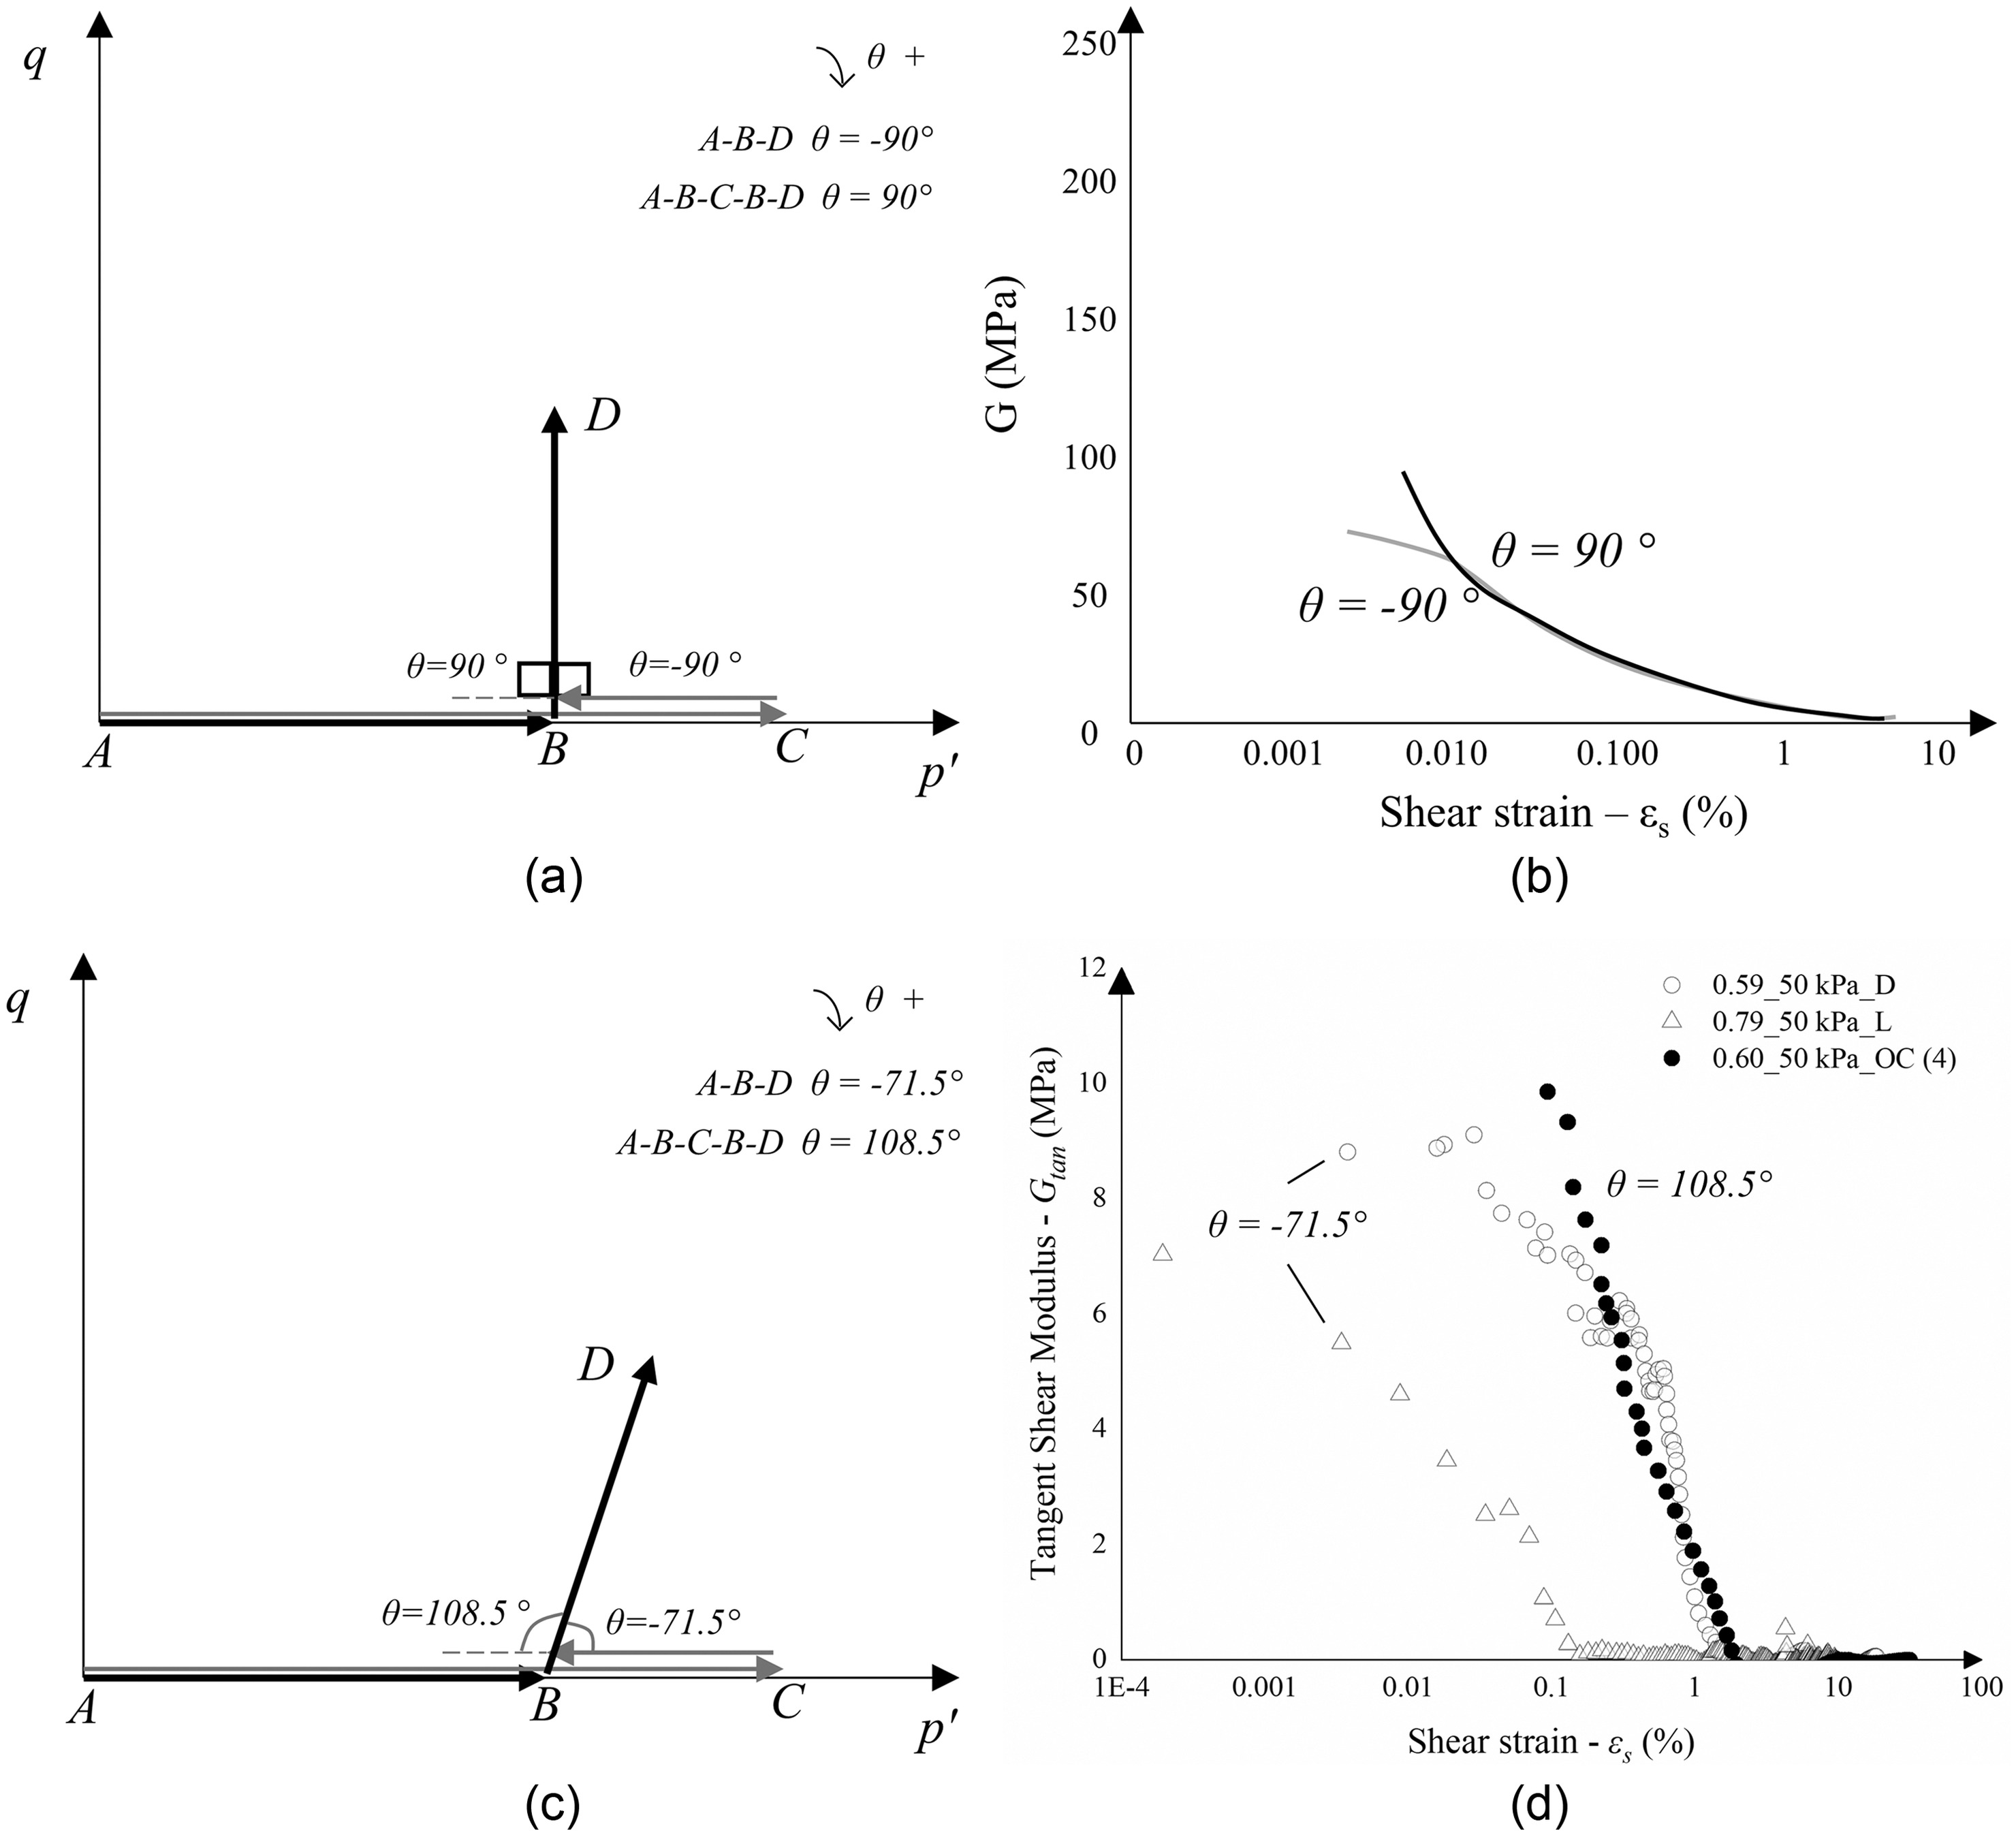
Although the stress paths followed for iron ore tailings were not the same as those in Hong et al. (2017), the overall response with low influence of recent stress history on stiffness was the same. This could be explained by the specimens having not yet achieved full yielding. Coop and Lee (1993) argued that, in sands, the full yielding is delayed until particle breakage dominates and the compression paths in the , -plane steepen to join the NCL, which had not yet occurred in Fig. 3. Furthermore, these observations agree with the general trend observed in quartz sands, in which for a typical range of pressures they have the same sensitivity to pressure during the loading or unloading processes (He et al. 2019; Lo Presti et al. 1993). This analysis is possible because of the proximity of void ratio values of the specimens, which has a great influence on stiffness.
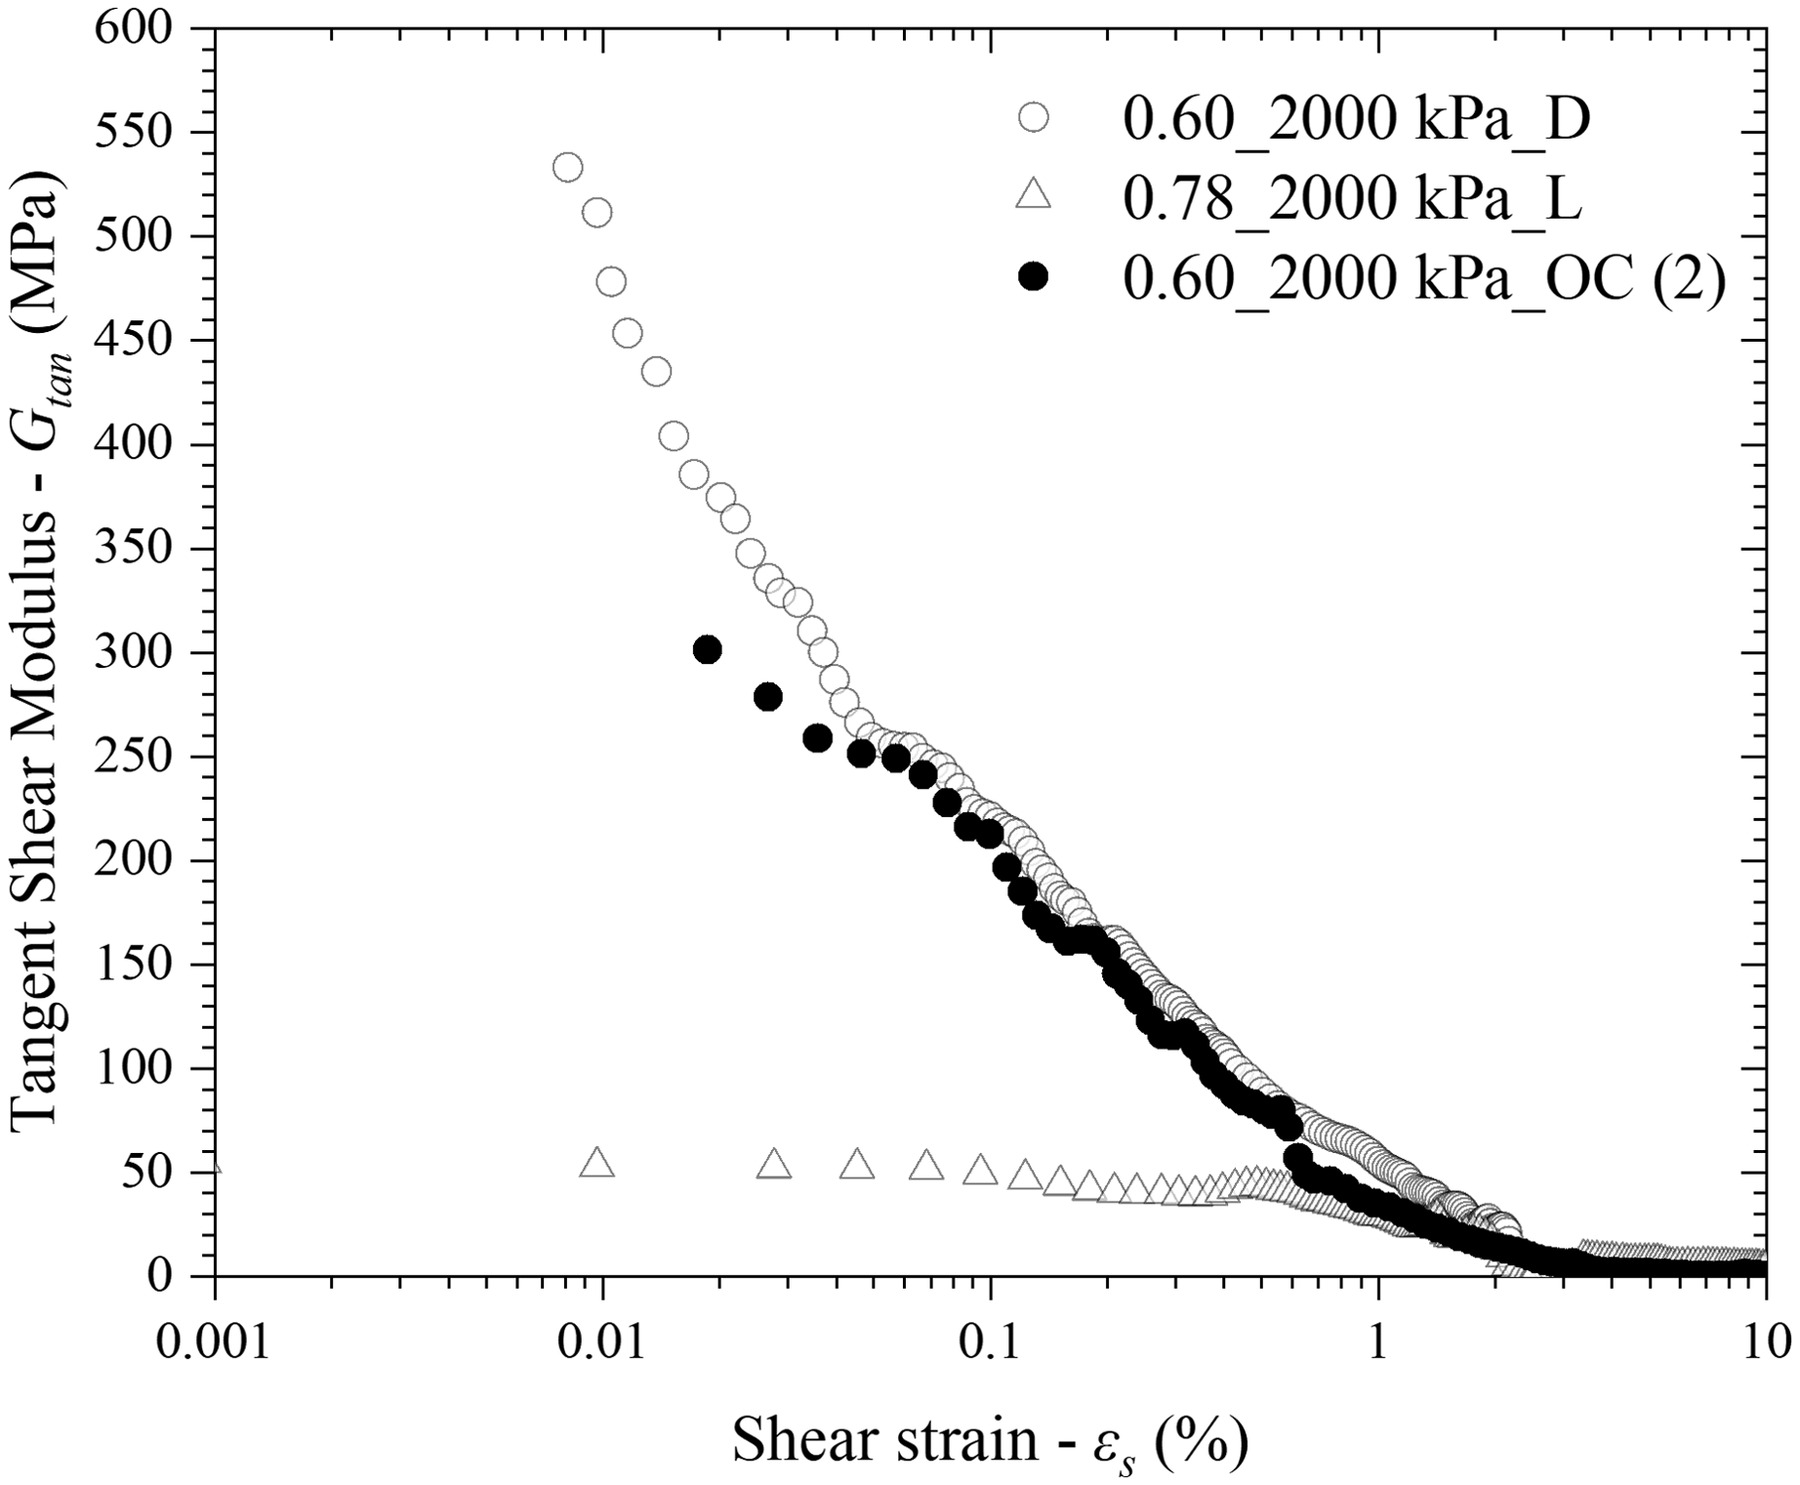
Fig. 9 depicts the stiffness degradation curves for specimens sheared at 2,000 kPa of confining pressure. The results for the specimens sheared at 1,000 kPa indicated a similar response and are omitted for brevity. The stiffness of tailings was slightly lower for the overconsolidated specimens than for the specimen isotropic compressed to 2,000 kPa and subsequently sheared. This effect, along with the changes in stress–strain response (reduction in maximum mobilized strength and volumetric strains) observed for the overconsolidated specimens at high pressures [Figs. 5(a and b)], can be related to the reduction of the interlocking contribution on these specimens.
State Boundary Surface
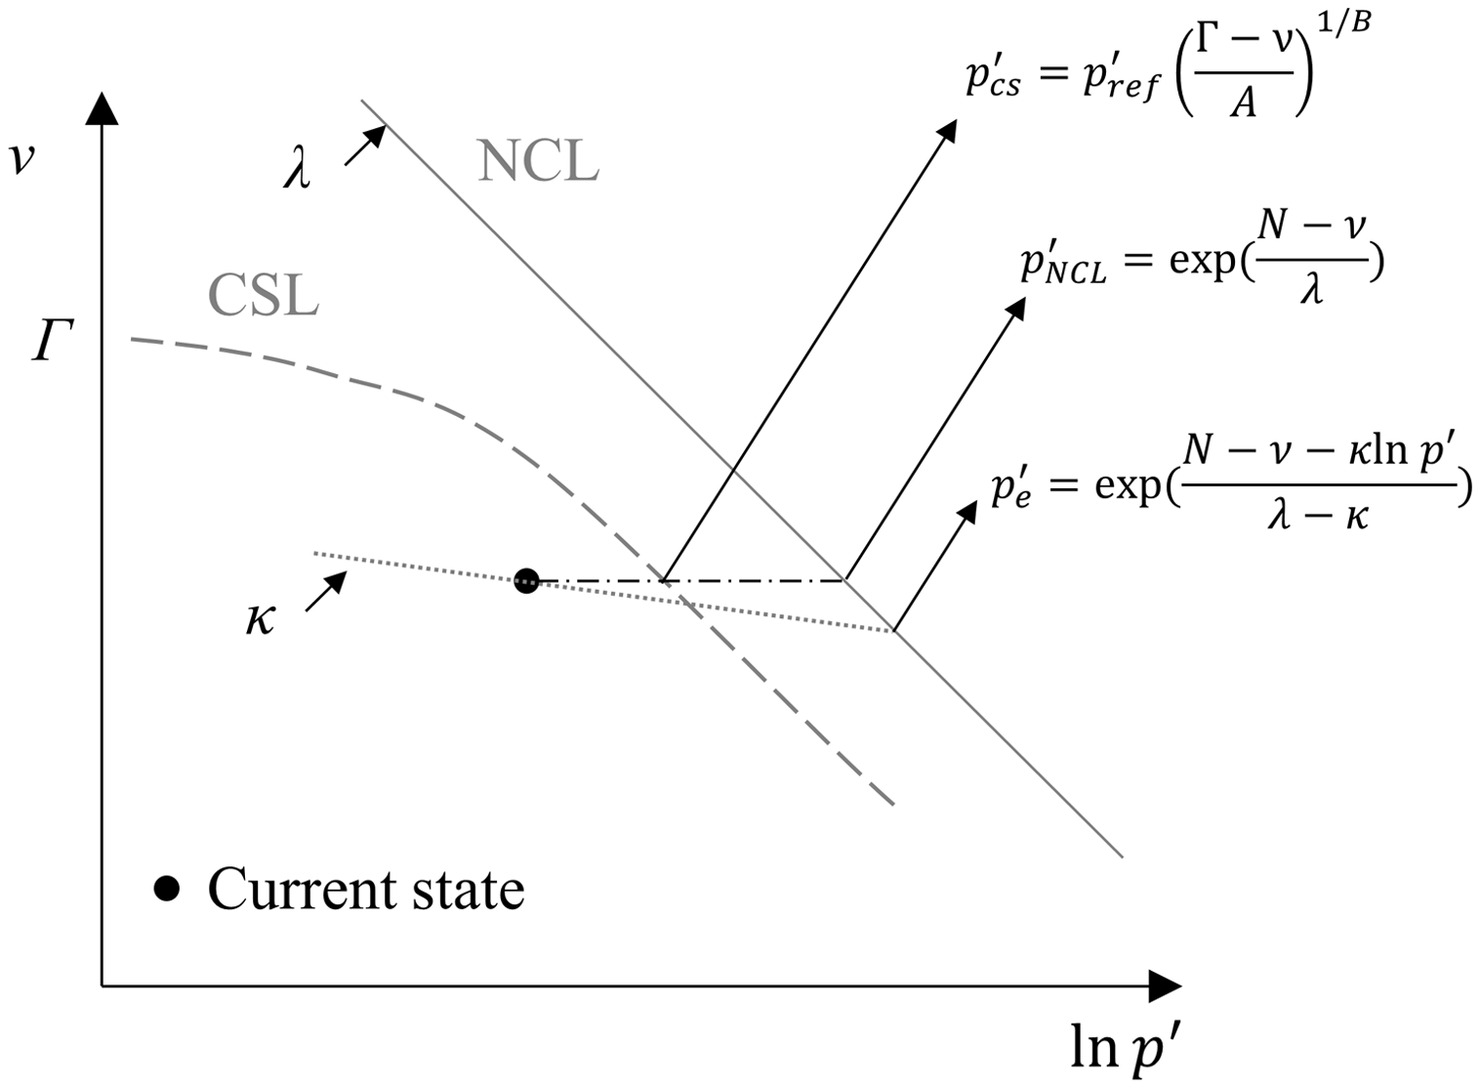
The state boundary surface (SBS) of a material usually is assumed to have a constant shape and only to increase in size. Thus, it is necessary to adopt a normalization technique in order to represent the SBS. These techniques take the pressure at some reference state as the normalizing pressure. Fig. 10 presents possible choices for reference states and the corresponding normalization. In this paper, the reference state selected was the critical state, considering a CSL in the compression plane in the form of Eq. (1). By adopting the pressure at critical state () as the normalizing parameter, it was possible to plot the state paths followed by the specimens tested (Fig. 11). In addition, the tests were normalized further with respect to the deviatoric stresses by considering the critical state strength, , so that the critical state in this plane would plot at (1,1).
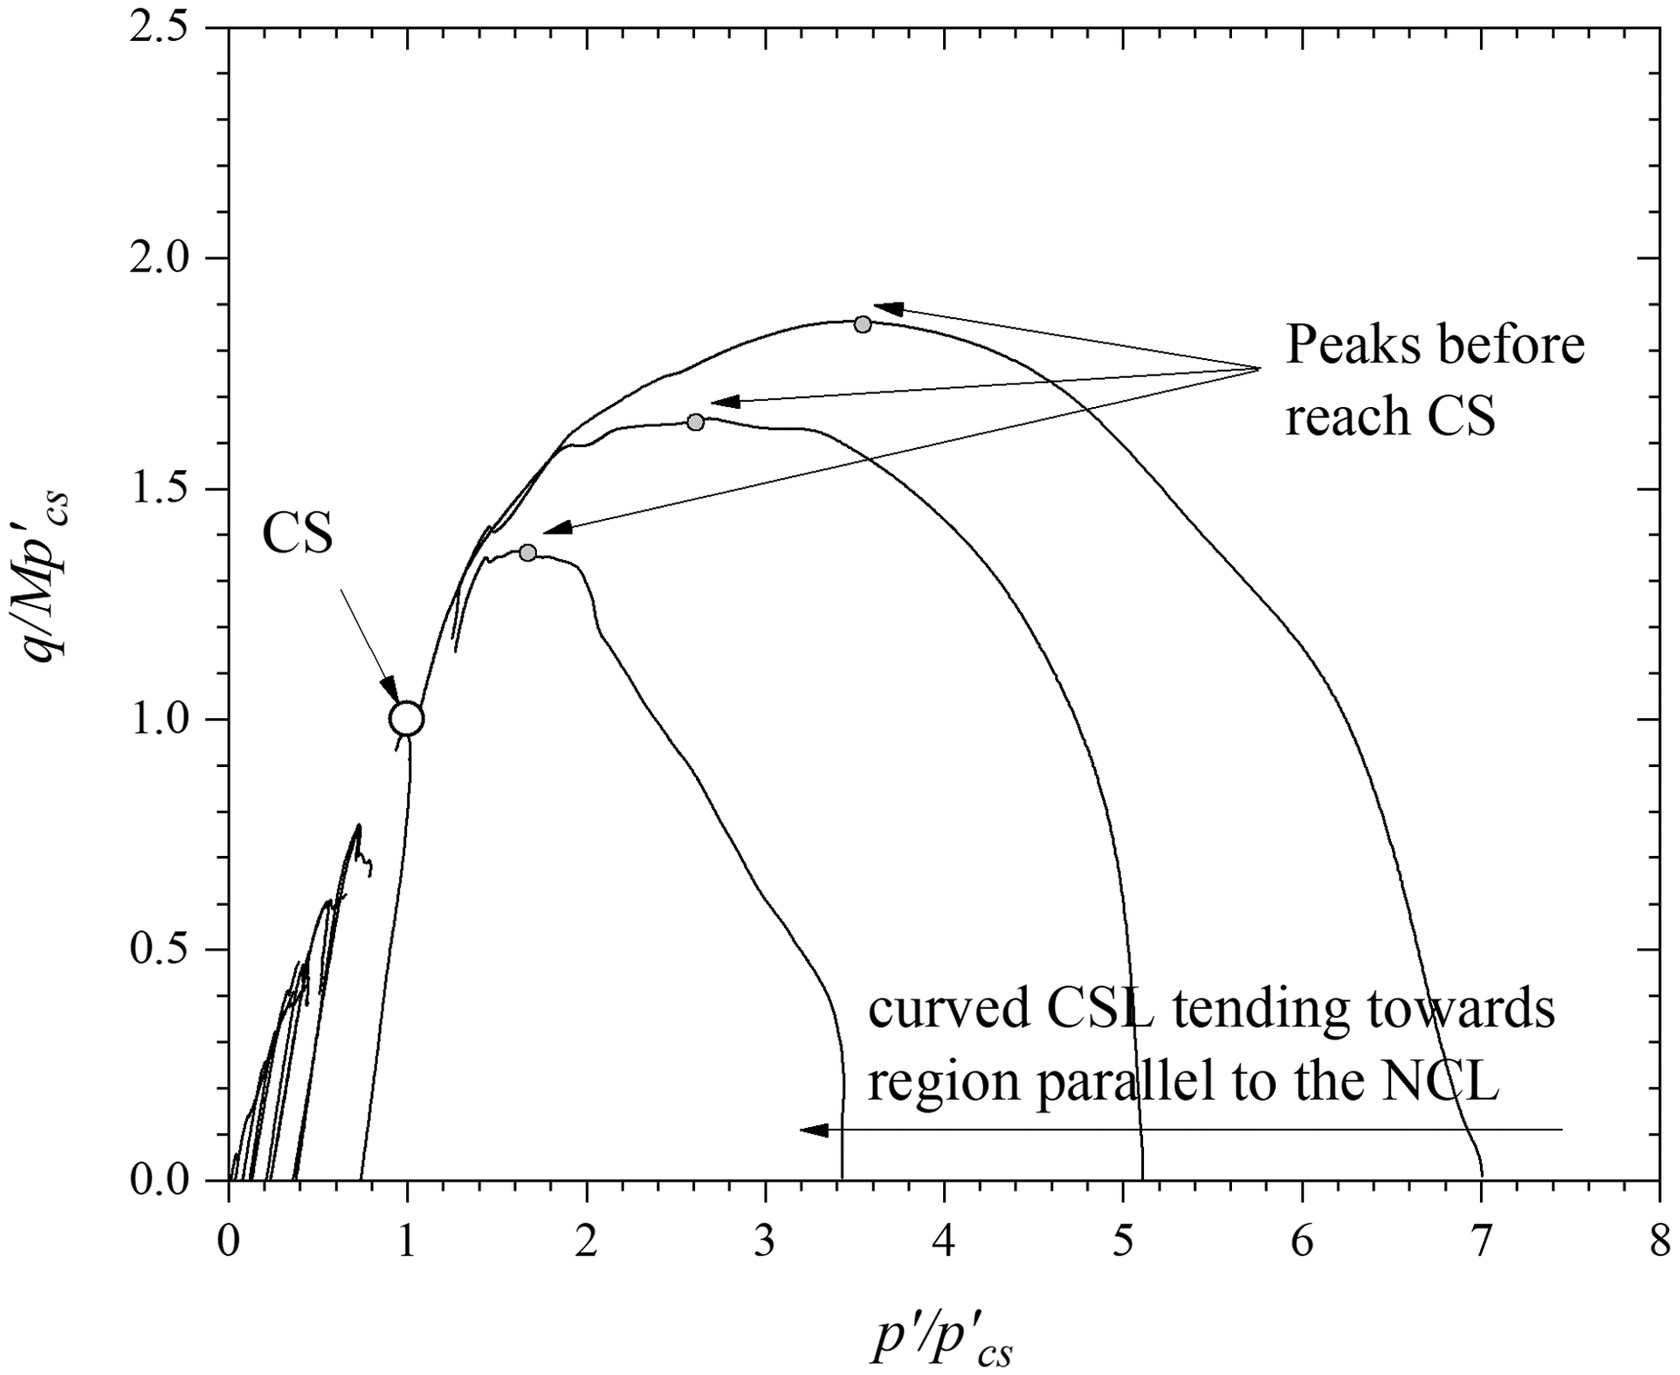
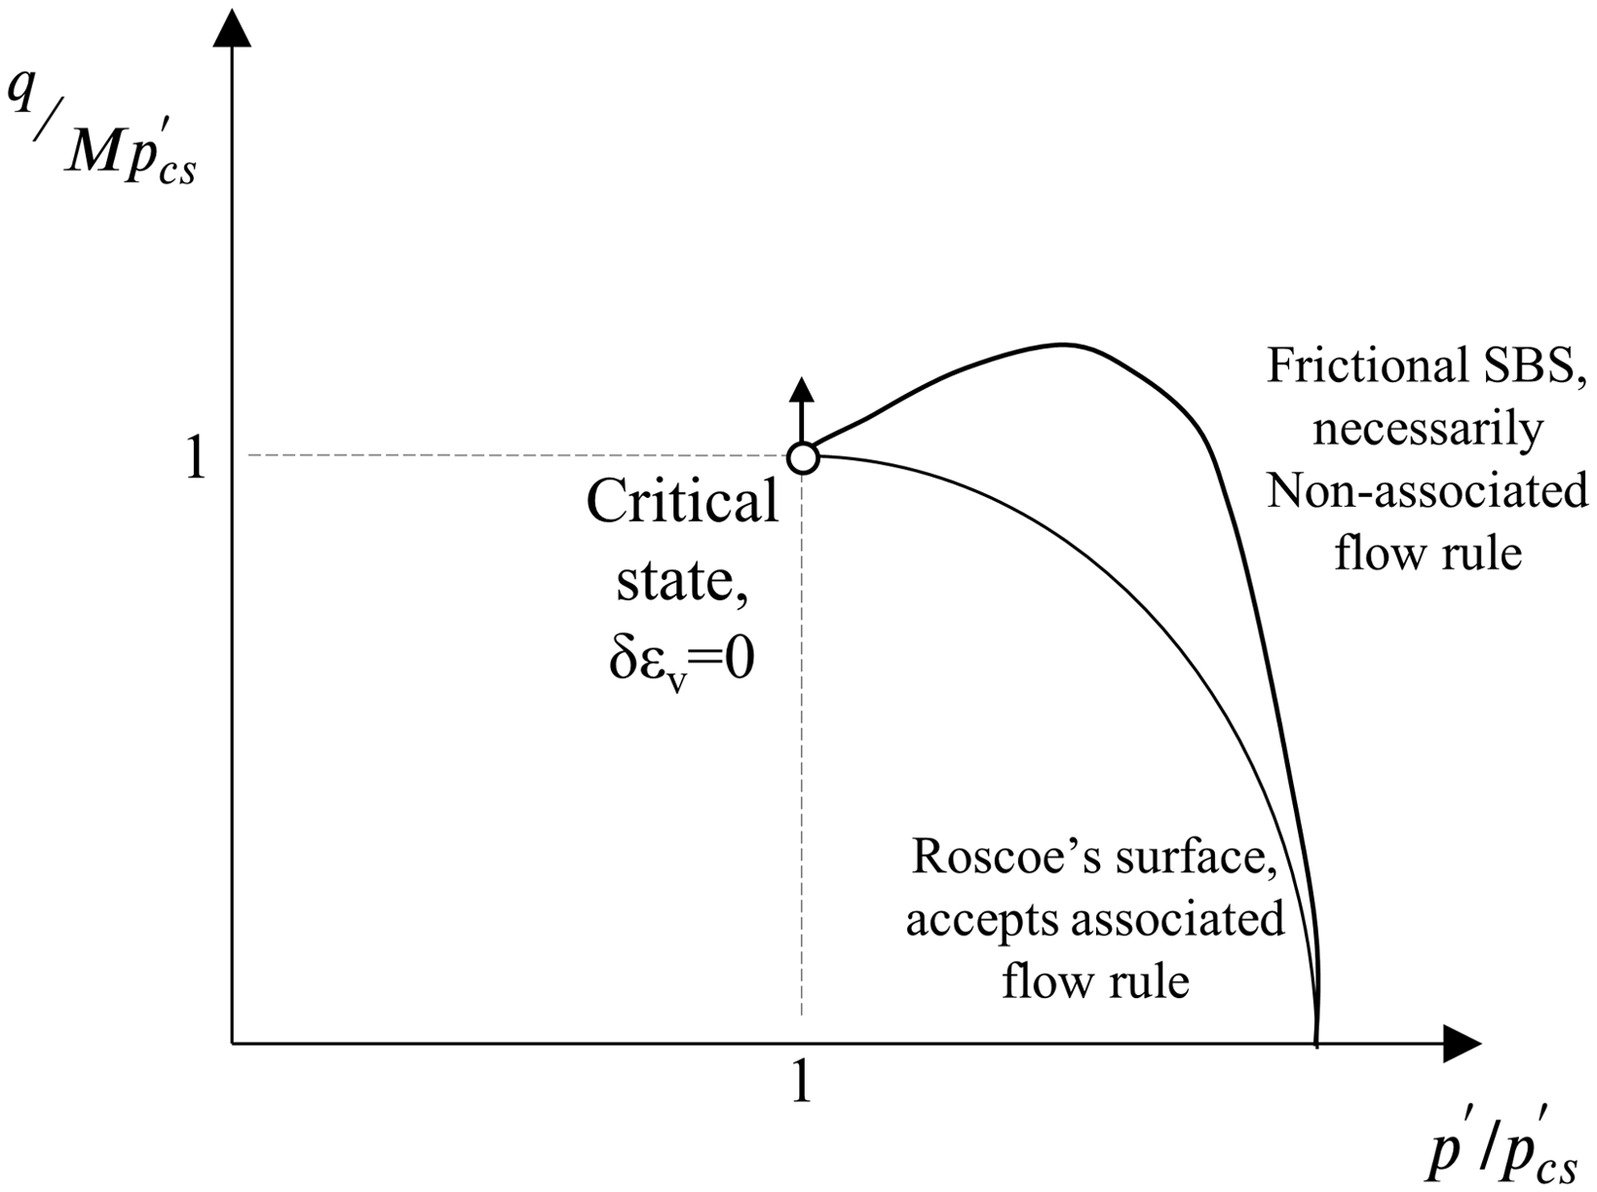
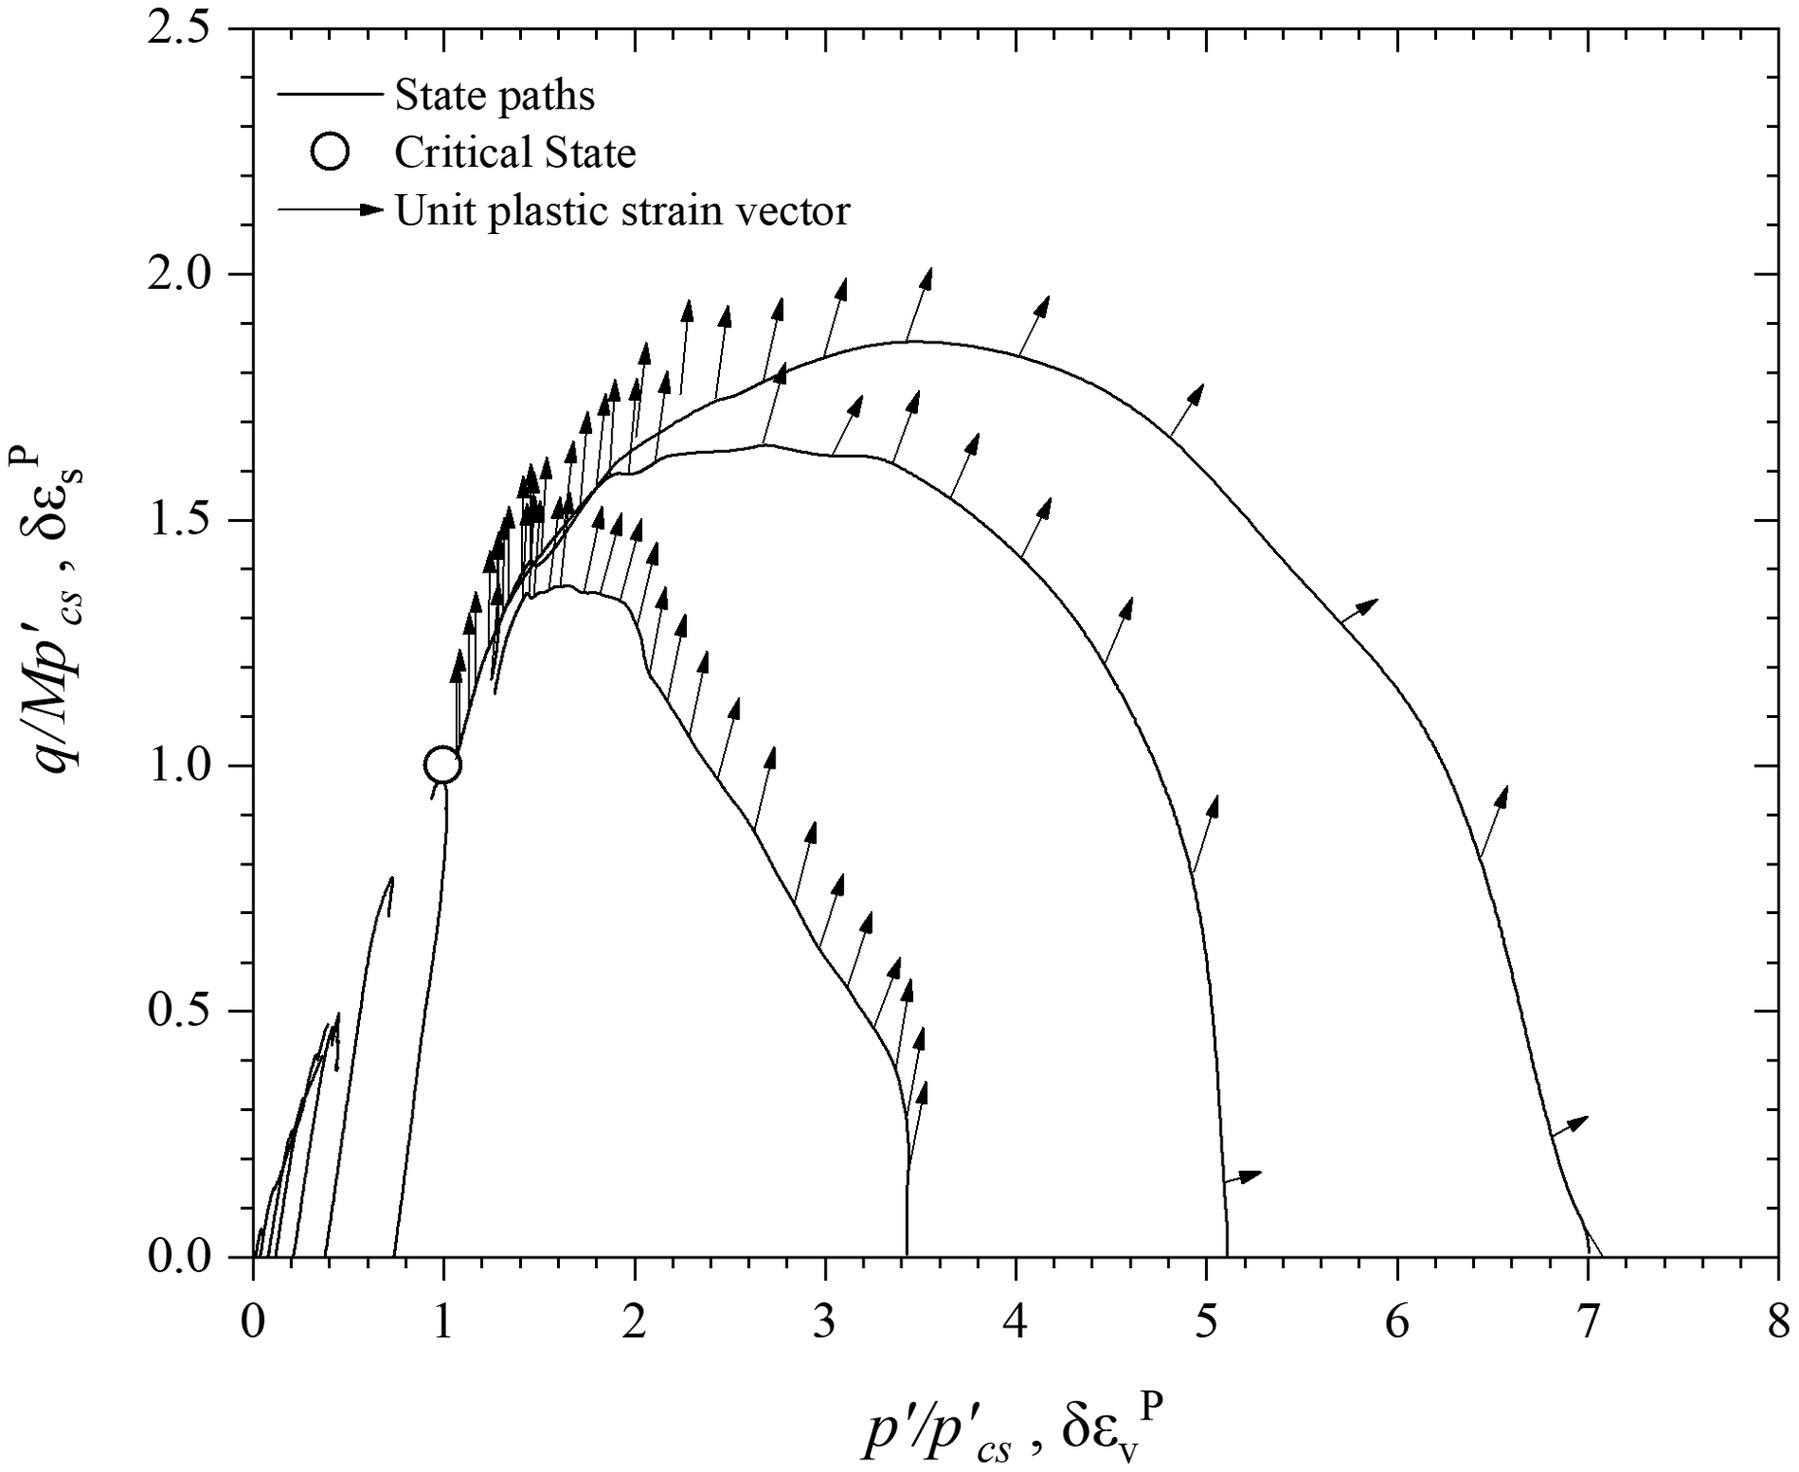
Li and Coop (2019) first investigated the SBS of tailings. They found surfaces that changed from clay shape to sand shape as the fines content was reduced and the tailings became coarser. The SBS of clays usually have an elliptical shape with the apex at the critical state (Roscoe et al. 1958), whereas those for sands have an apex before reaching the critical state (Chandler 1985; Coop 1990). Fig. 12 presents the SBS for clays and sands to illustrate how changes in SBS shape influence the materials’ flow rule. When the SBS apex coincides with the critical state, an associated flow rule (the strain increases in the same direction as the stress increases) can represent the plastic strains occurring. However, when this apex does not coincide with the critical state, the material necessarily follows a nonassociated flow rule (the plastic strain increases in a direction independent of the stress increase direction). The iron ore tailings studied herein had an apex before reaching the critical state, indicating the existence of nonassociated flow for this material (Fig. 11). This also can be demonstrated by superimposing the plastic strain vectors on the SBS and verifying their nonorthogonality (Fig. 13). The plastic strains were obtained by considering an elastic model, determining the elastic strains for each stress increase, and subtracting them from the total strain increase (Kuwano and Jardine 2007).
Another feature of the SBS is its intercept with the normalized mean effective pressure axis. For an initially isotropic compressed specimen, the value at which its state path intercepts the abscissas axis indicates the spacing ratio (the ratio of the on the CSL to that on the NCL for the same specific volume). However, Li and Coop (2019) stated that this normalization could not work well for the curved part of CSL because the value of for liquefiable states would approach zero, giving a very large apparent SBS. Coop (1990) also demonstrated that the behavior of some nontextbook materials (carbonate sands) reduces to the classical critical state framework (straight CSL and NCL in the , -plane) when sufficient pressures are achieved. Thus, Li and Coop (2019) only regarded as the true SBS the surface defined in the region where the CSL is approximately straight and parallel to the NCL. In turn, Consoli et al. (2023) demonstrated for two iron ore tailings from different stages of treatment the achievement of linear critical state lines and normal compression lines at high pressures with a spacing ratio of 2.71.
However, Poorooshasb (1989) defined the SBS as the surface in the state space that encloses all the possible states that a sample of a granular medium may assume. Therefore, the large state paths obtained in Fig. 11 also would be enclosed by the true SBS because the specimen existed in these states.
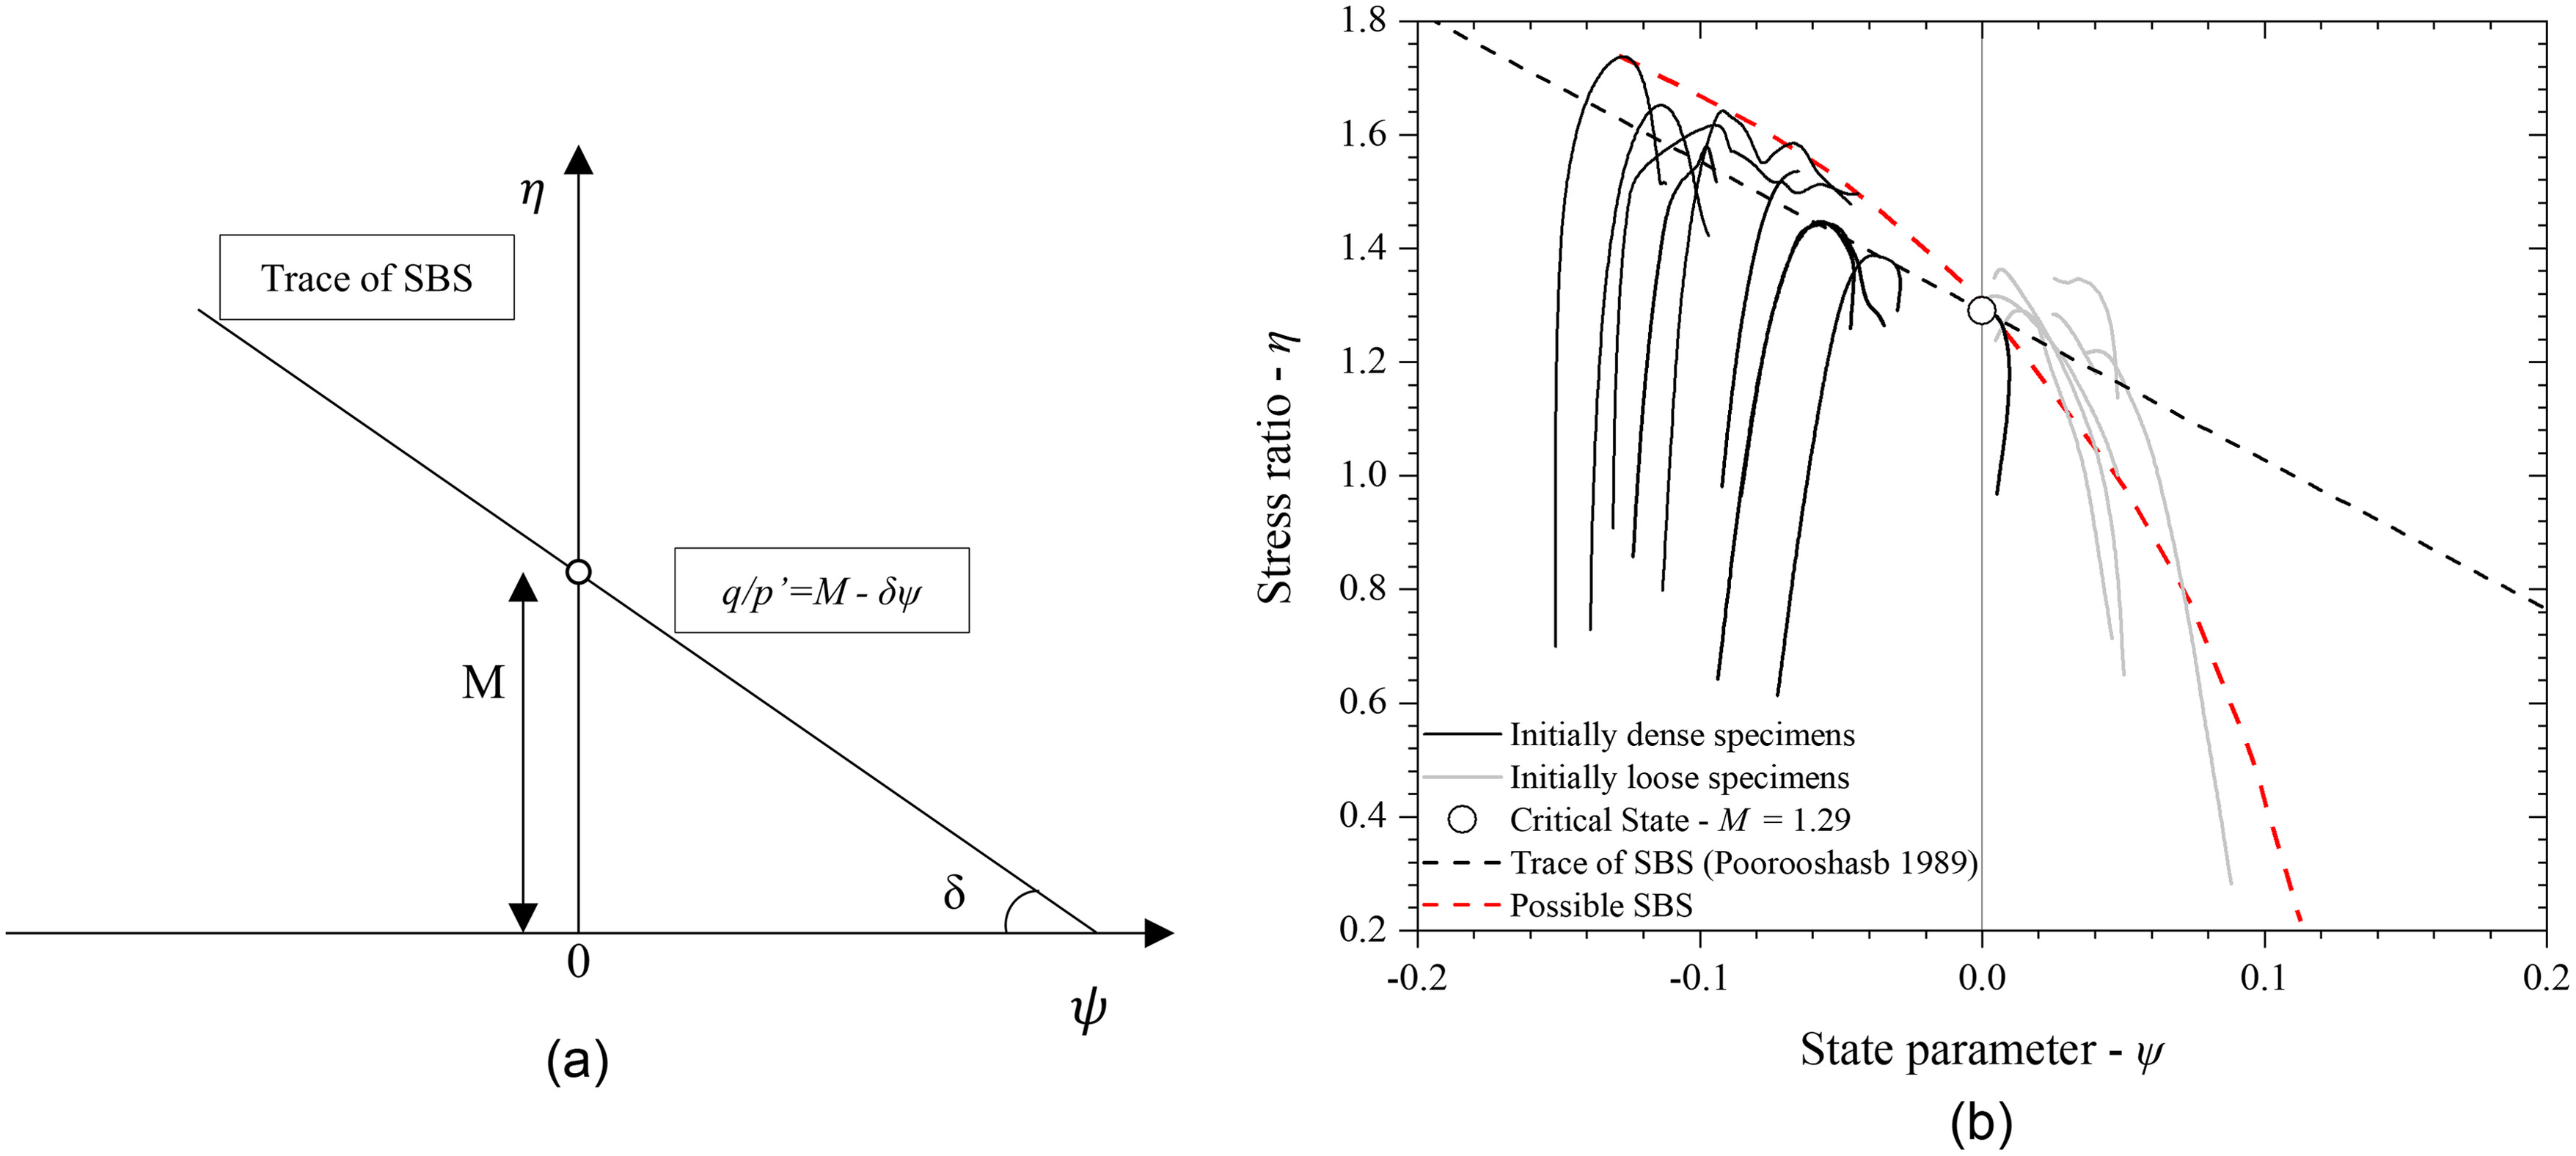
Poorooshasb (1989) proposed a different plane to plot the results and obtain a trace of the SBS [Fig. 14(a)]. Fig. 14(b) demonstrates the SBS obtained for iron ore tailings herein on the state parameter () versus stress ratio space proposed by Poorooshasb (1989). The indicated SBS is nonlinear, as was that found by Todisco and Coop (2016) for another material. Thus, there is a trend of stabilization with decreasing state parameter, not predicting infinite stress ratios, and consequently dilatancies, as the specimens move farther from the critical state at the dry side (lower state parameter values).
Fabric
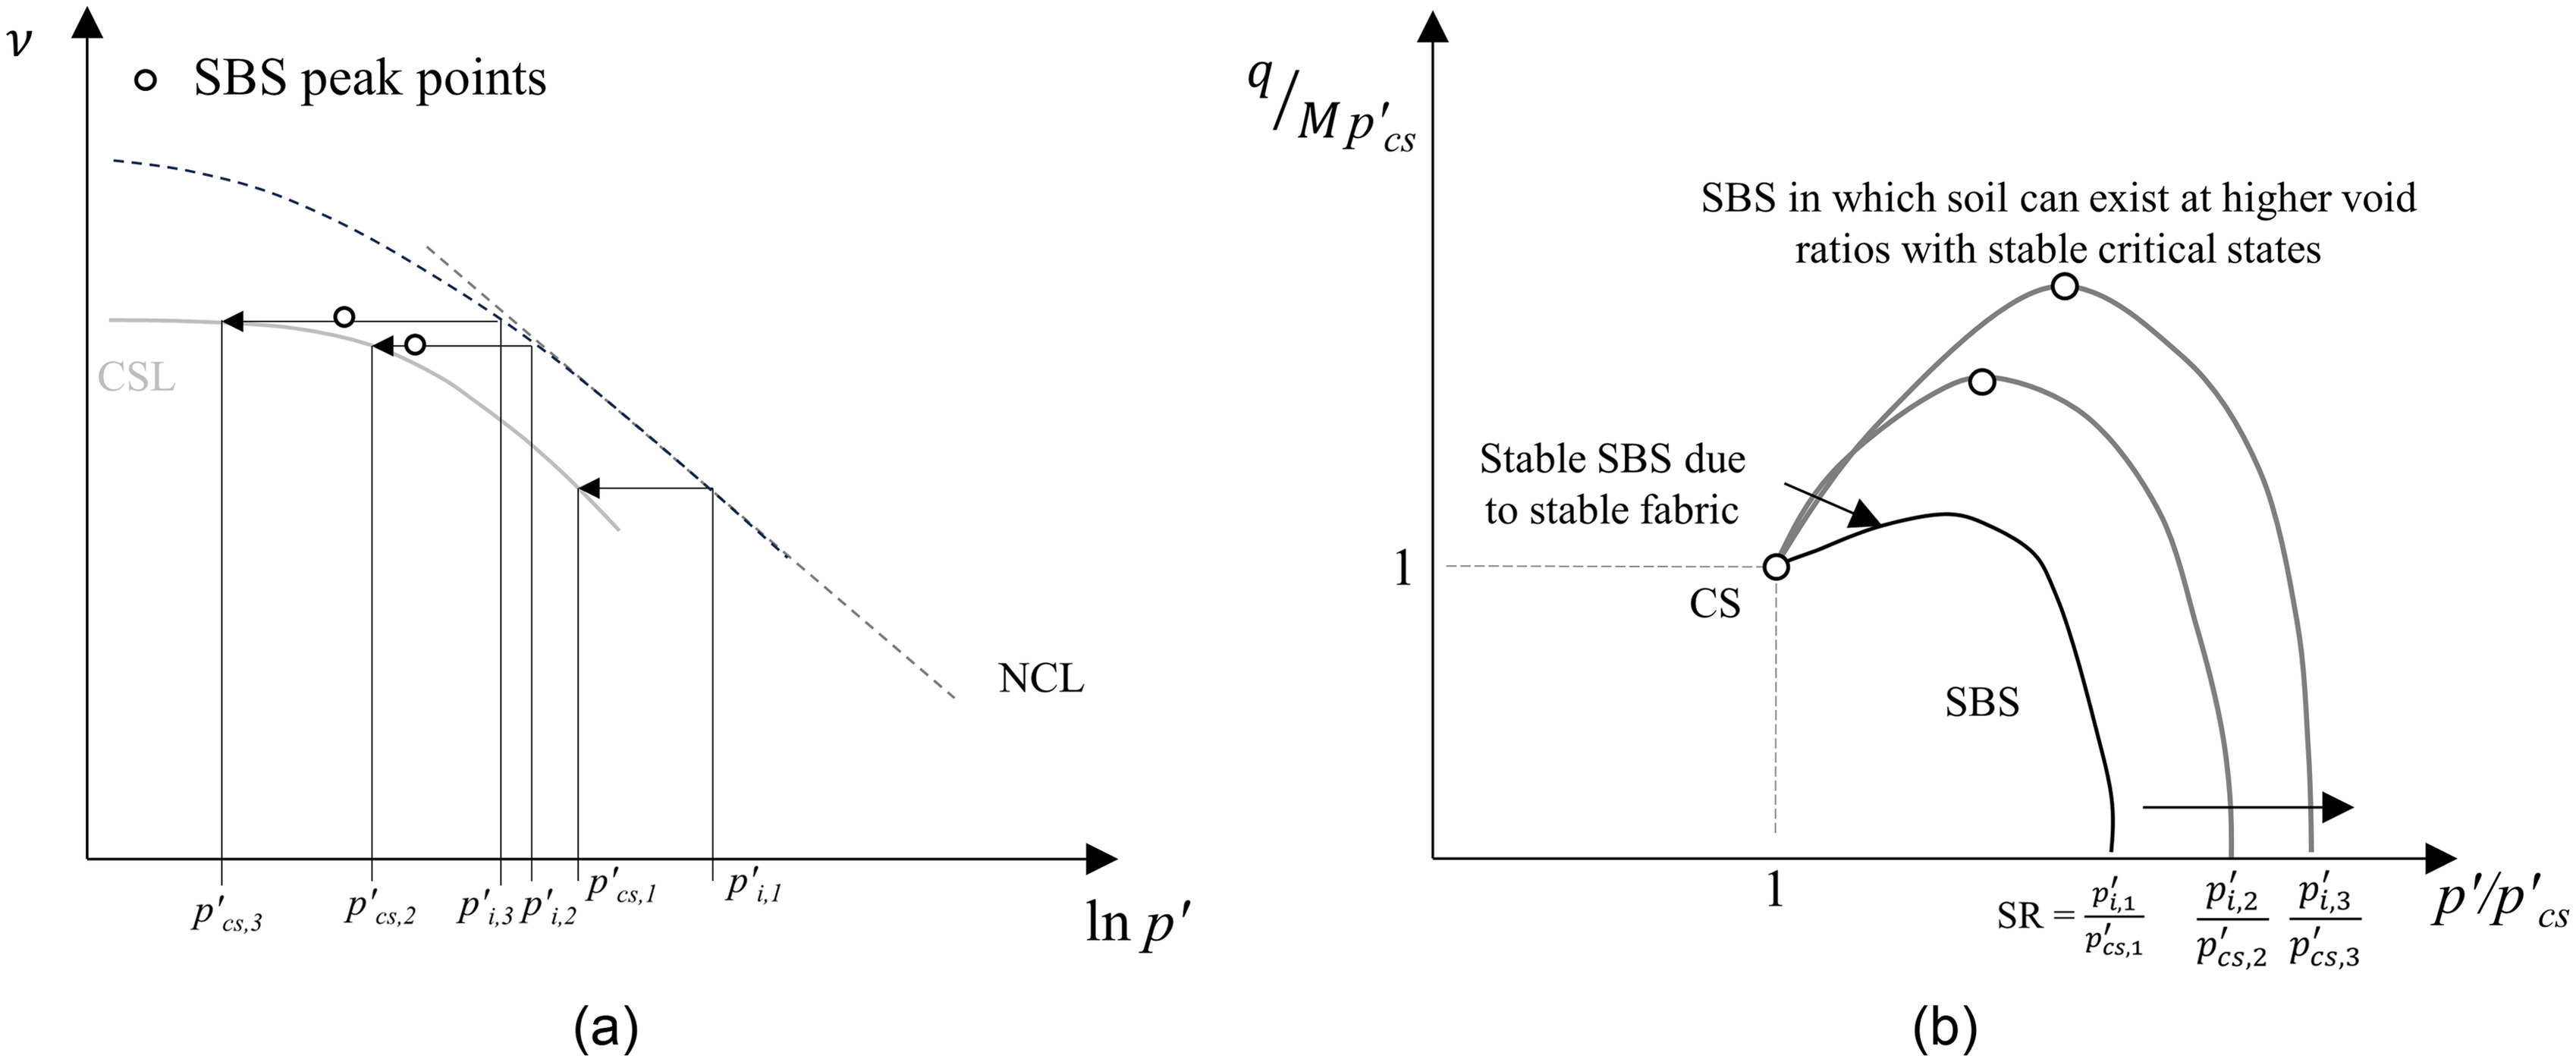
In granular cohesionless media, the effects of structure usually have been neglected. The terms structure and fabric usually are used indistinctly; however, this study adopted the definition of Mitchell and Soga (2005), in which structure is the combination of bonding (composition and interparticle forces) and fabric (particle arrangement). Tailings generally are considered to be unstructured materials due to their recent deposition history. However, the importance of their structure—specifically, their fabric—must be considered in some situations (Fourie et al. 2022). This implies that, at a given void ratio, some tailings can sustain higher stresses than could the same material without the effects of structure (Schnaid 2021). Therefore, it is proposed that the large apparent SBS (Fig. 11) obtained at the curved portion of the CSL (Fig. 7) may arise because of elements of fabric.
Accounting for fabric effects can be an arduous task, because it still is difficult to describe this property quantitatively (Collins et al. 2010; Coop 2015; Liu et al. 2021). However, the effects caused by fabric on the overall response can be accounted for indirectly, for example, by describing the evolution of the SBS (Baudet and Stallebrass 2004).
Baudet and Stallebrass (2004) presented a constitutive model for structured clays based on the sensitivity framework (Cotecchia and Chandler 2000). In their model, the structure allows the material to exist with higher void ratios than the equivalent reconstituted soils. The structure’s influence is represented by a large metastable SBS that decreases with the degree of destructuration until it reaches the intrinsic SBS or even a slightly larger SBS due to a persistent fabric element.
Following the development of Baudet and Stallebrass (2004), the large apparent SBS in Fig. 11 would be related to unstable elements of fabric that gradually would disappear according to the degree of destructuration. The SBS still did not converge to a unique surface even with pressures as high as 4,000 kPa (Fig. 11). Thus, the destructuration of the studied tailings is associated with pressures increasing to values much higher than those usually achieved in conventional laboratory testing.
Moreover, Baudet and Stallebrass (2004) represented structure using a horizontally amplified space in which the material can exist. This amplification originates from their structured samples having a NCL parallel to the intrinsic NCL, while sharing a unique CSL. However, for tailings, the structure allows them to exist in metastable states in which the CSL cannot be defined fully. This gives rise to the nonlinear CSL observed at low pressures and to the large apparent SBS observed (Fig. 15).
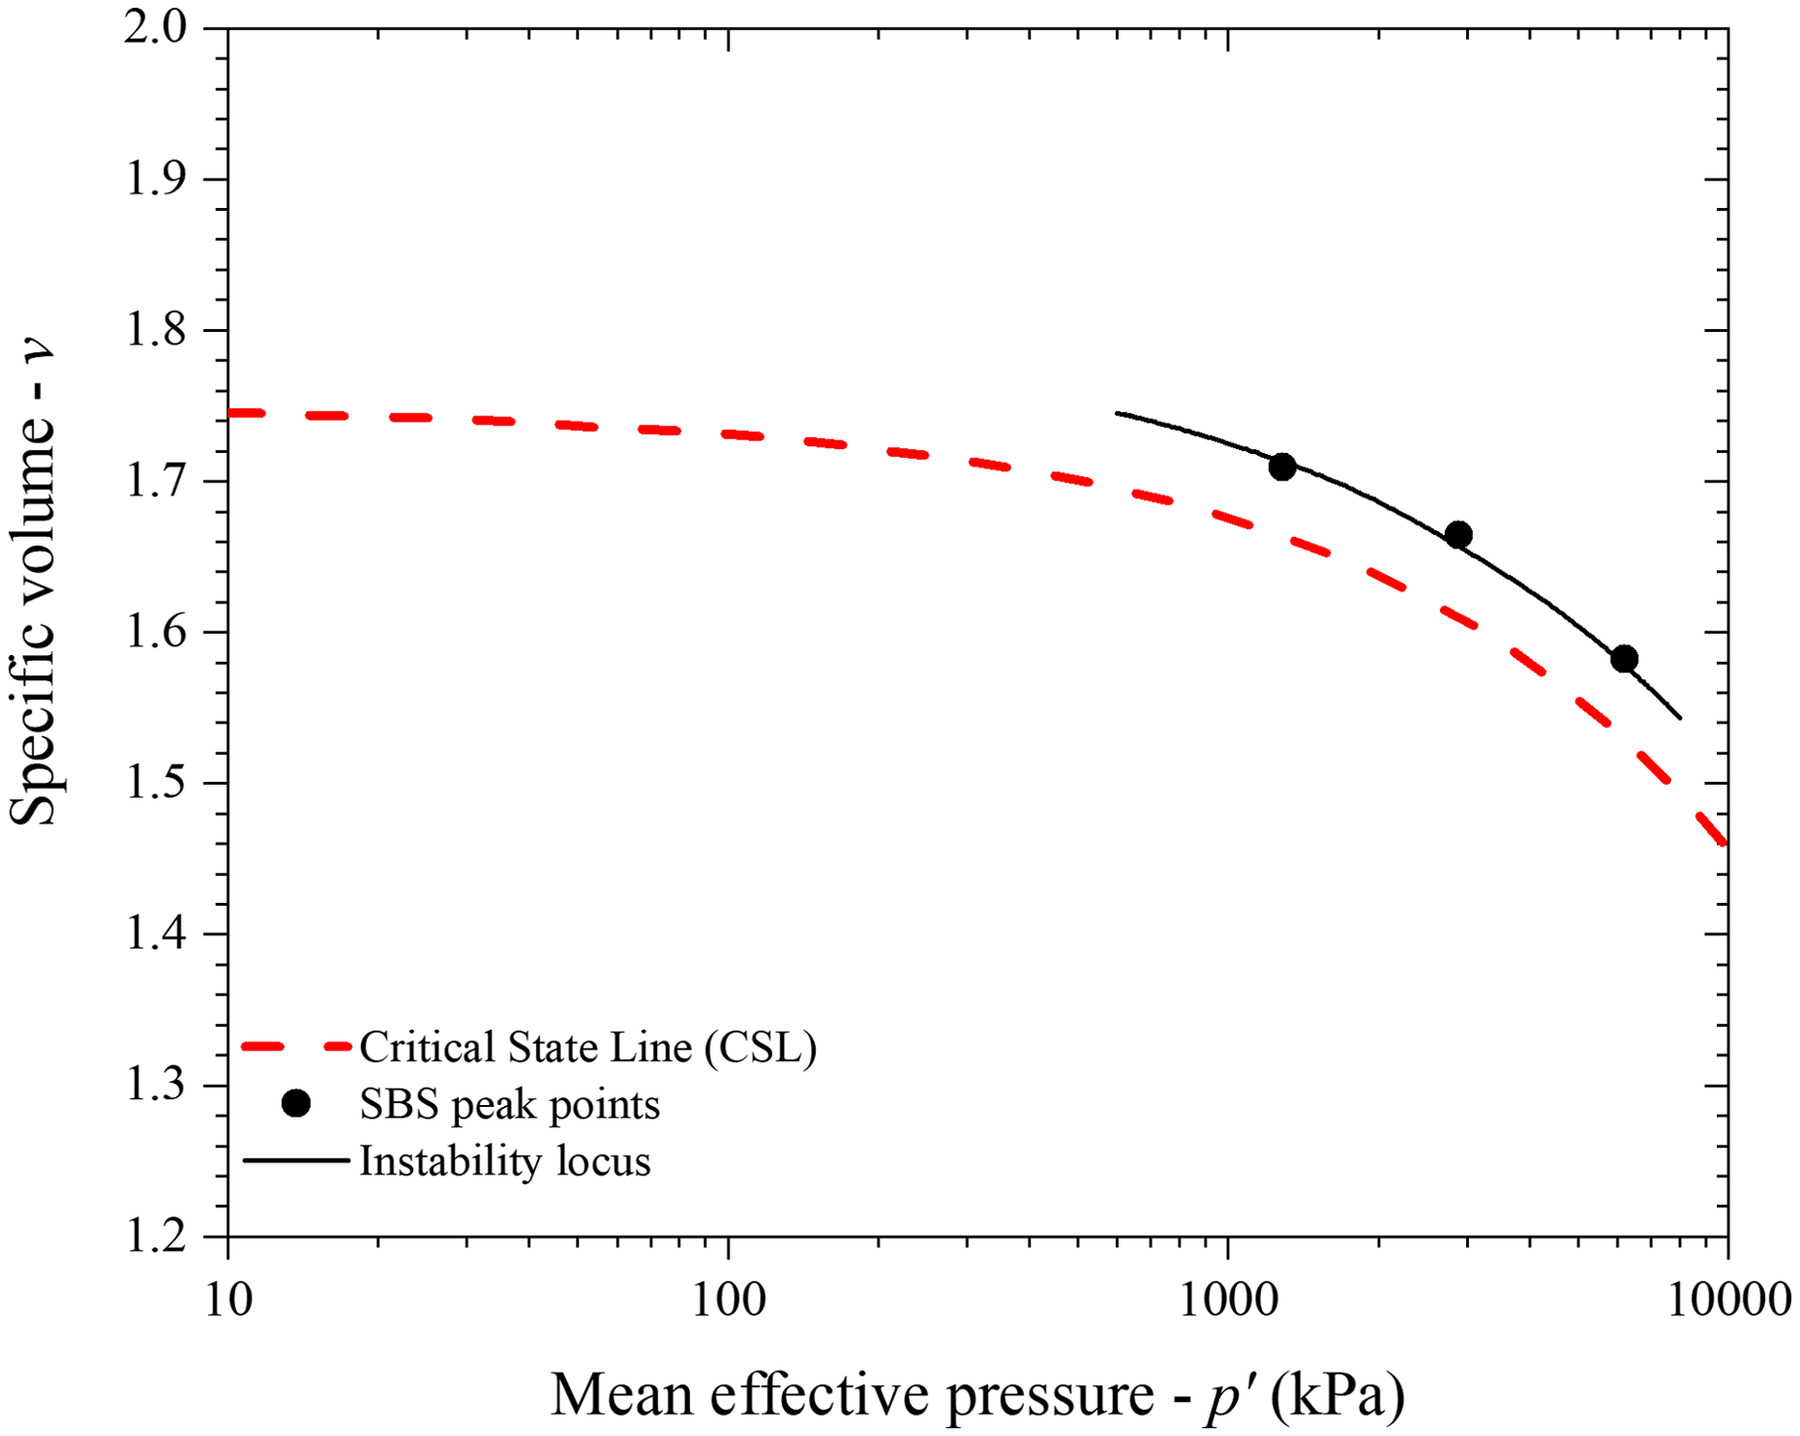
Although the state paths in Fig. 11 do not collapse into a unique SBS with the normalization adopted, they are enclosed by and have the same shape as the true SBS. Fig. 16 plots in the compression plane the peak points indicated in Fig. 11. These points define a locus of instability, similar to what Carrera et al. (2011) observed. This instability locus can be related to the break of the fabric that allowed the material to exist at these states. However, the instability does not take place in the tests conducted because the stress probe direction was in a strain-hardening direction (increasing ) rather than in a strain-softening direction (decreasing ) as in the case of undrained tests on loose samples (Sasitharan et al. 1994).
Dilatancy
The usual linear approximations of the relationship between and minimum plastic dilatancy () do not fit well the experimental data obtained (Fig. 17). This was because the commonly adopted flow rules are a function of Degree 1 of the mobilized stress ratio. To illustrate how the degree of for the flow rule influences versus , an adapted version of the flow rule for modified cam clay is adopted in this paper; the derivation is presented in the Appendix.
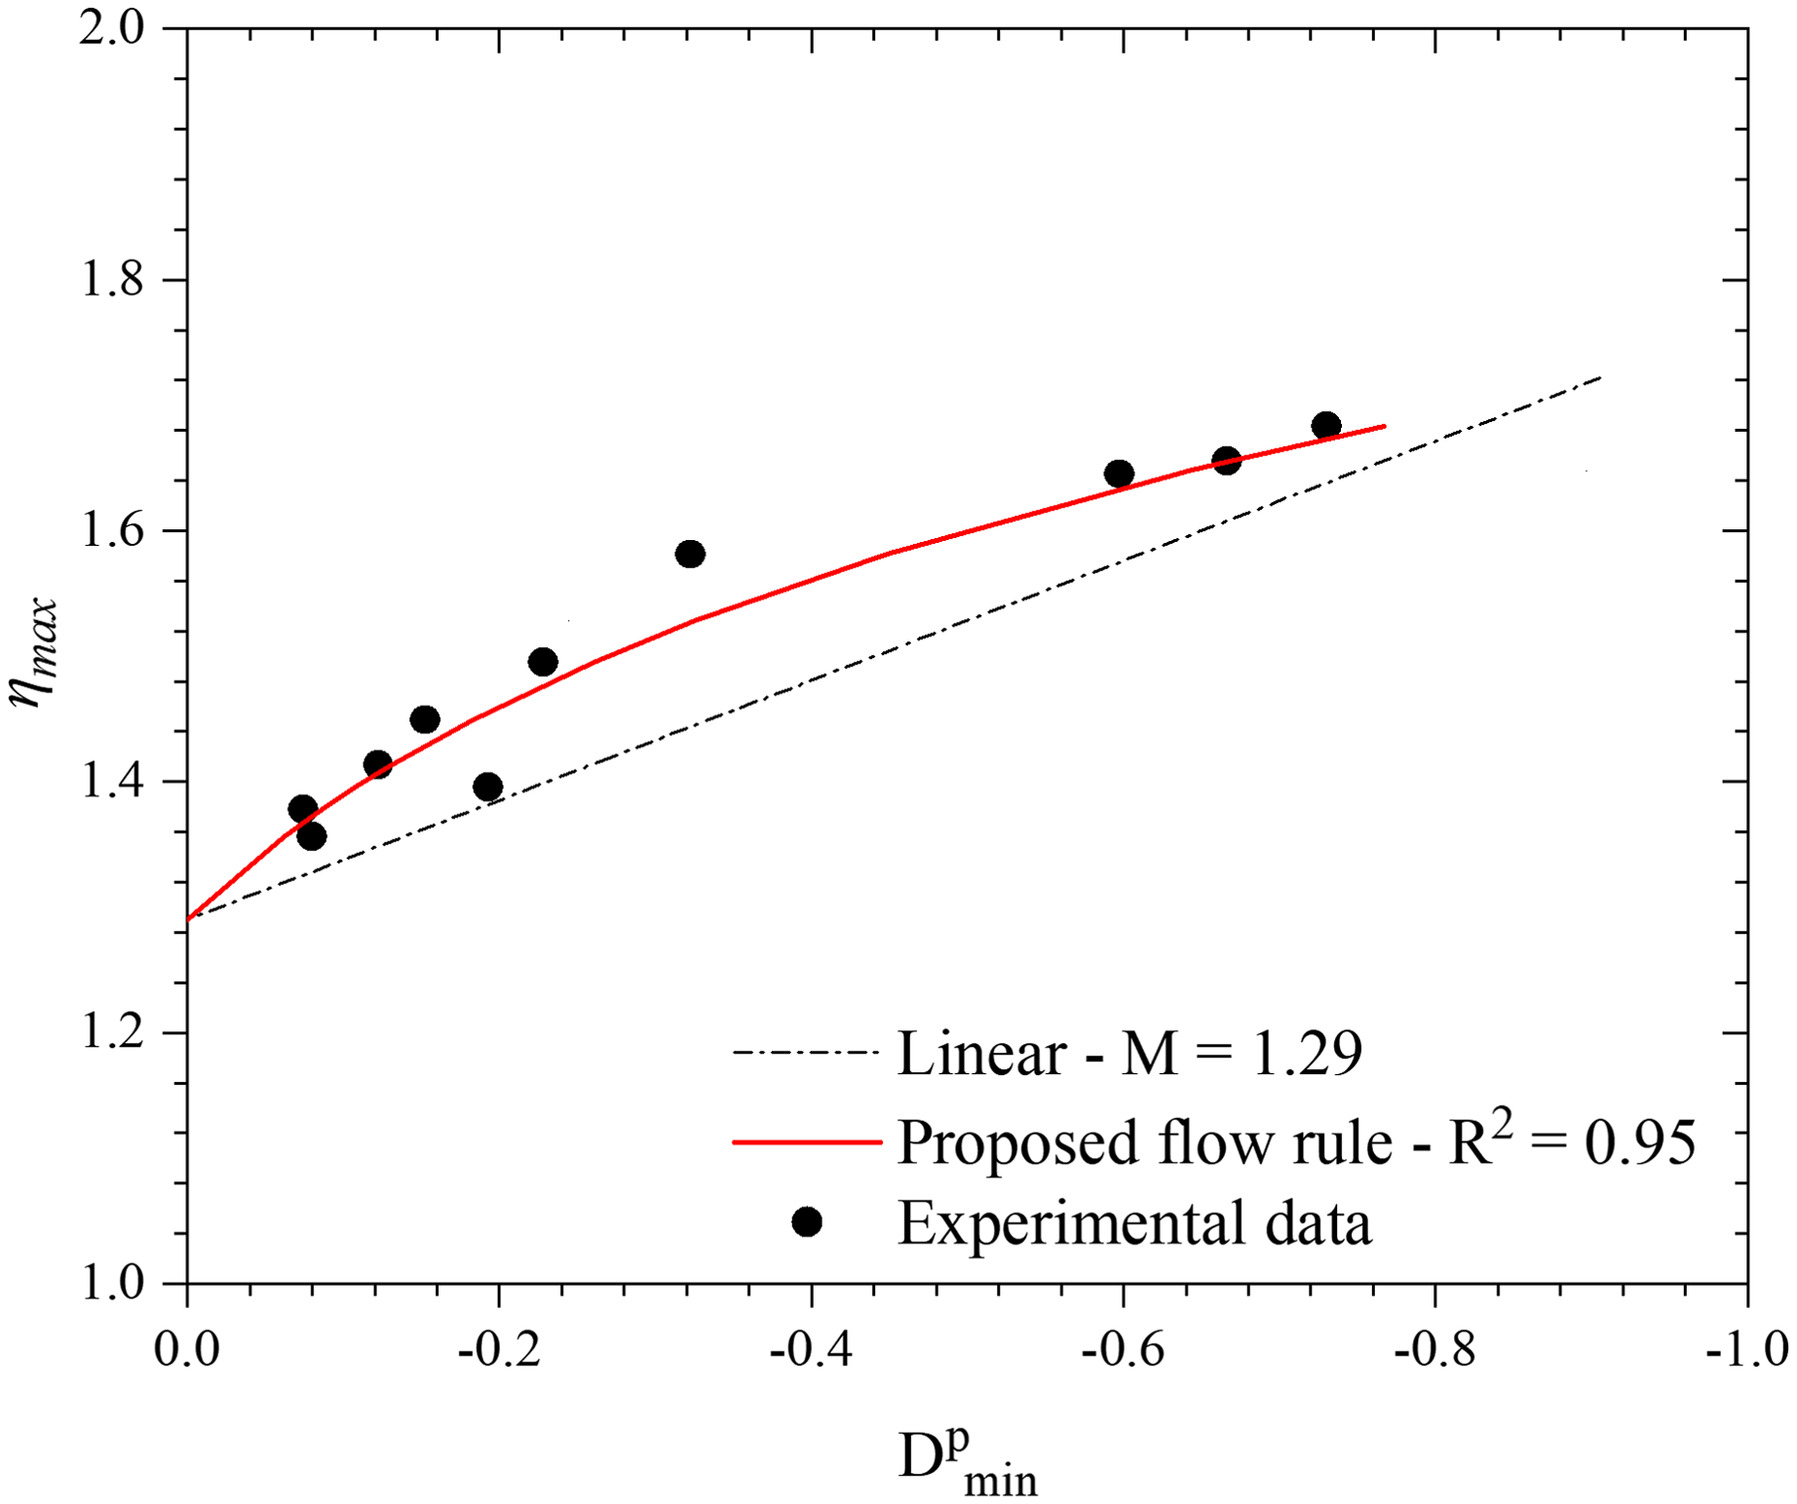
This flow rule is based on a new parameter related to the particle morphology evolution. de Bono and McDowell (2014) showed using discrete-element modeling with crushable or uncrushable particles that the change from a dilative to a compressive trend in granular materials occurs because of the balance between dilation caused by shearing and compression which originates from particle crushing. Based on this concept, the value at which the initial dense specimen begins to have contractive behavior (Fig. 7, 0.60_4000 kPa_D) is taken as the instant at which the two deformation mechanisms (dilation due to shearing and compression due to particle breakage) cancel out. Thus, is assumed to vary linearly from 0 (at which there is no influence of particle breakage) to 1 (compression due to breakage suppress dilatancy trend) from 0 kPa to the pressure at which the volumetric behavior trend changes (4,000 kPa in this case). Fig. 17 depicts the new flow rule derived in relation to the experimental data.
The modified flow rule adopted demonstrates the nonlinear nature of the relation between and . These results reinforce the relationship between plastic strains, particle breakage, stress level, and fabric.
Particle Morphology
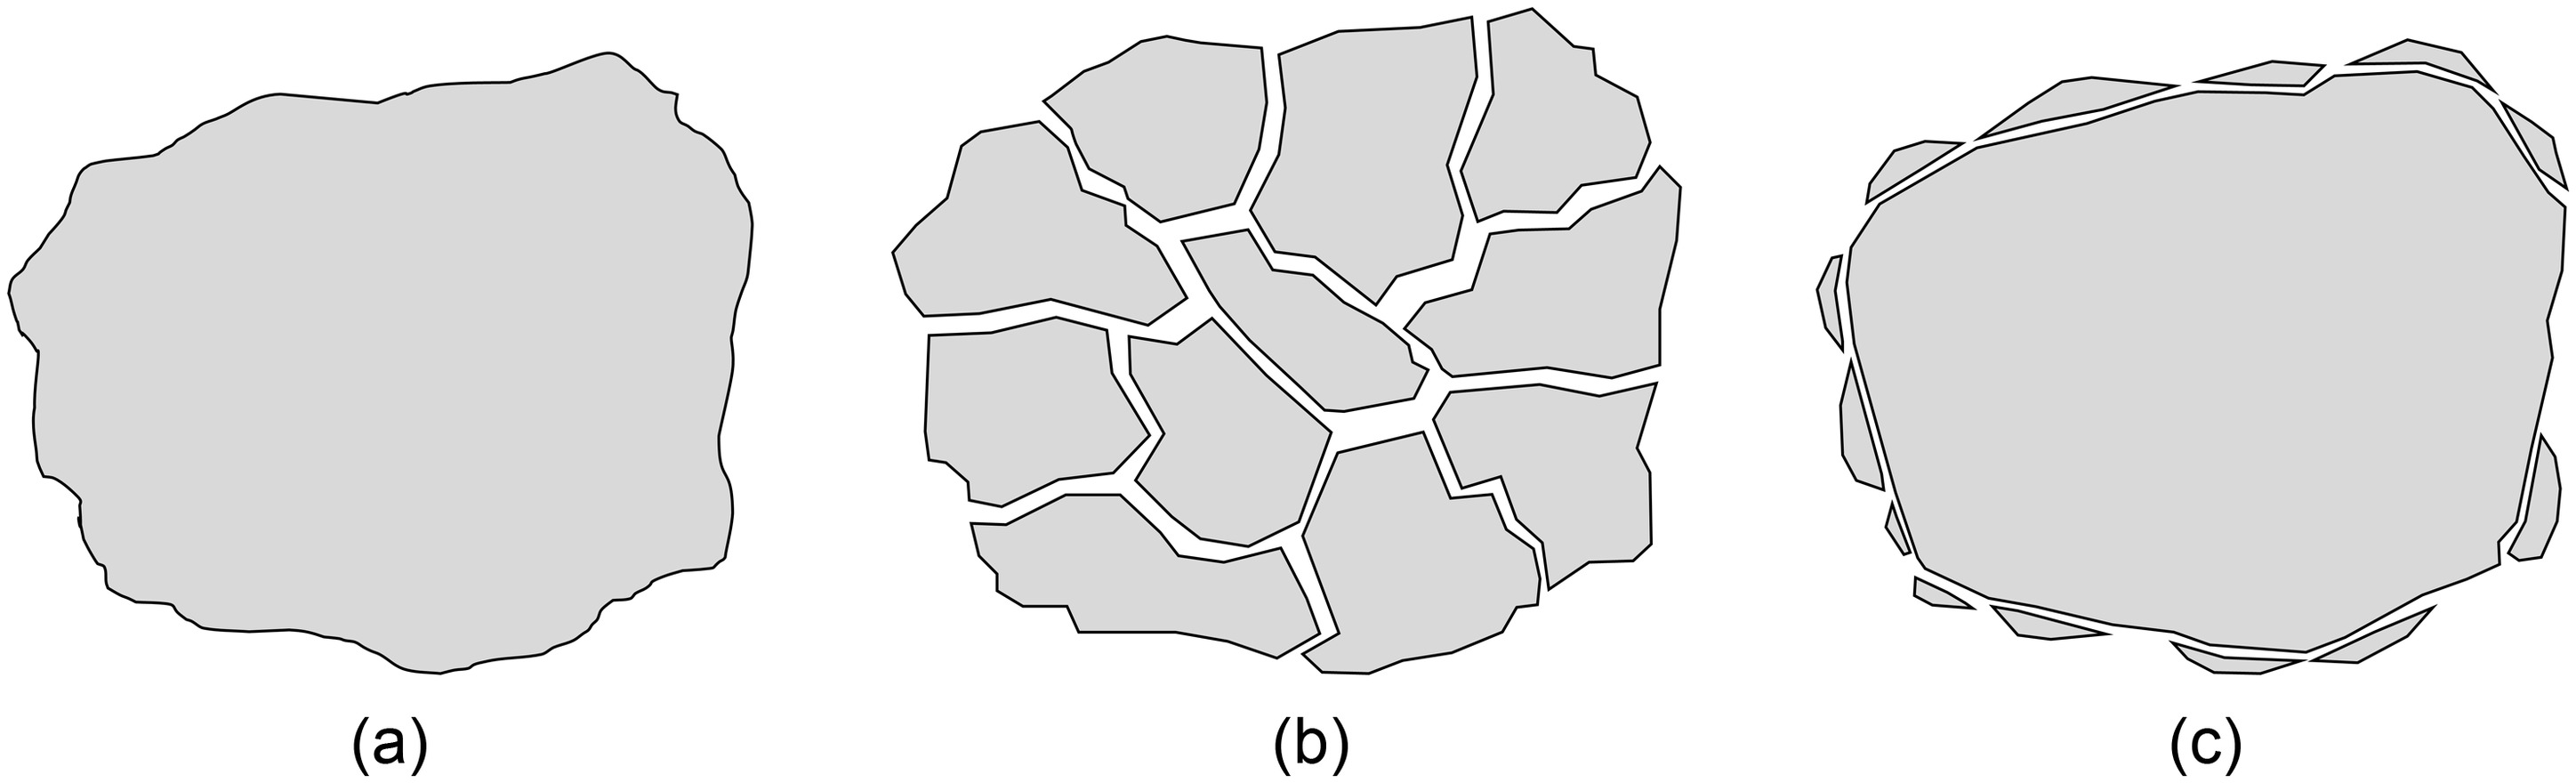
Particle breakage often is related to large volumetric deformations and very high pressures. However, there can be many types of breakage (Fig. 18). Fragmentation [Fig 18(b)] may require extremely high pressures originating from stress concentrations, whereas other types, such as chipping [Fig. 18(c)], could occur at lower stress levels. These mechanisms of particle breakage occurring at lower stress levels may not affect the soil particle-size distribution directly, but instead affect its particle morphology.
The shape of the particles determines how they arrange and interact, resulting in changes in the macroscopic response. Usually, particle shape is associated directly with interlocking effects, and more-angular particles provide increased strength and stiffness. However, particle shape may affect other fundamental properties, such as the internal friction angle (Ciantia et al. 2019) and yielding behavior (de Bono and McDowell 2020).
The iron oxide contents of the iron ore tailings studied were concentrated mainly in the smaller particles, for which the recovering processes are less efficient. Because particle strength is a combination of mineral strength and particle size (McDowell and Bolton 1998) and smaller particles usually have higher coordination numbers (and thus, less probability of stress concentrations), it is not expected that the smaller particles will break. Instead, the quartz minerals present in tailings result from industrial processes, which gives them characteristics such as high angularity, low sphericity, and high surface roughness. Thus, during loading, the smaller iron particles may act like the balls in a ball mill, degrading the larger quartz particles and changing their shape to more spherical and less rough.
The particle breakage patterns described in Fig. 18 are related directly to contact mechanics and particle morphology. Usually, particles with fewer contacts are more prone to fragmentation [Fig. 18(b)] (Artoni et al. 2019; Karatza et al. 2019; Todisco et al. 2017). Karatza et al. (2019) observed that particles with a higher coordination number usually present chipping and that less spherical particles present more breakage in general because of stress concentrations at the contacts.
Aspects of particle morphology for intact tailings were determined by analyzing SEM images aiming to confirm the mechanisms occurring. Image-based methods to determine for particle morphology have been used in soil mechanics to obtain information about the microscopic characteristics of particles and their arrangements (e.g., Bowman et al. 2001; Sun et al. 2019; Yang et al. 2019; Zheng and Hryciw 2015). The studied tailings were found to be angular [convexity ] and elongated [aspect ratio ]. Approximately 250 particles was evaluated in the calculations, following the recommendations of Bowman et al. (2001) for the statistical significance of shape descriptors. These particle characteristics provide arrangements with more contacts than do spherical particles (Adesina et al. 2023; Fang et al. 2022; Karatza et al. 2019; Tian and Liu 2019). Thus, due to the nature of the tailings—elongated, angular, and containing fines—it is expected that they have more contacts and are more susceptible to breakage modes such as chipping. This was confirmed by the analysis of posttested samples.
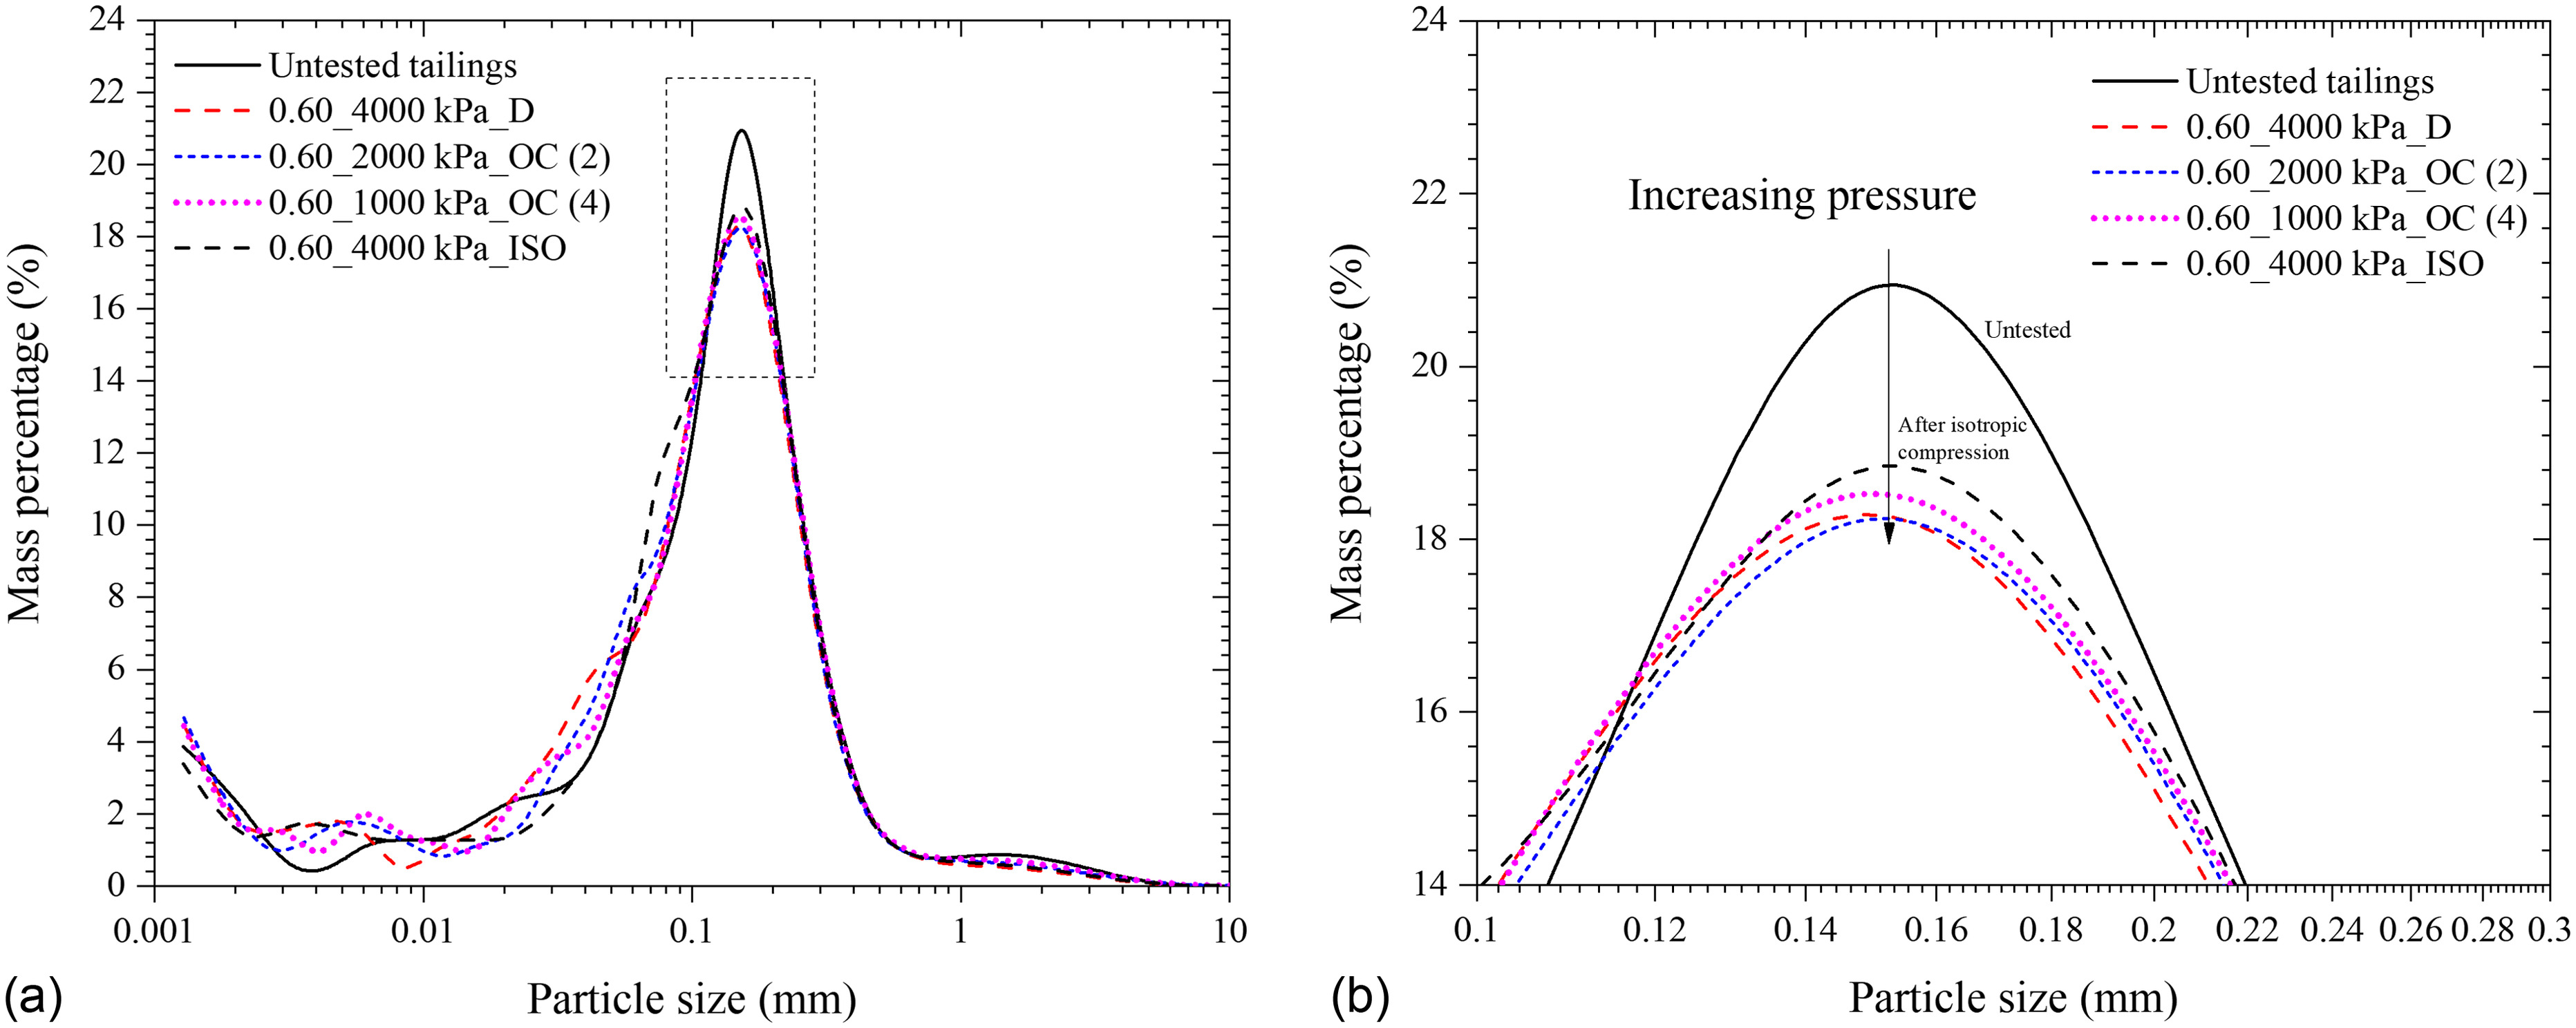
The particle-size distributions of posttest samples were plotted by mass percentage rather than the usual cumulative distribution to investigate the changes in particles due to loading. Plotting data this way allows observing some breakage patterns and investigating the effects on specific particle sizes (Dong et al. 2024; Vilhar et al. 2013; Zhang and Baudet 2014). The changes in particle-size distribution were related mainly to the mean particle size (Fig. 19). In this range (0.1–0.2 mm), the most marked difference in the curves occurred; however, these differences are not observed directly in the distribution of finer particles (). This indicates that the mechanism occurring is related more to changing particle morphology than to breaking particles and increasing fines content.
Concluding Remarks
In this paper, the mechanical behavior of an iron ore tailings was described in detail and the nontextbook features were discussed, to enhance the understanding of tailings behavior. A program of triaxial tests was conducted over a broad range of pressures and stress histories, allowing the investigation of the effects of particle morphology changes on the response. Considering the boundaries of the present research, the following conclusions are drawn:
•
The range of pressures considered in this work was not sufficient to reach the iron ore tailings normal compression line. Therefore, pressures much higher than those achieved in usual laboratory tests or in the field are necessary to reach a unique NCL.
•
The influence of overconsolidation on the stress–strain response of the studied tailings was found to be restricted to elevated stress levels at which particle breakage takes place and causes a change in particle morphology. The overconsolidation ratio did not greatly affect the behavior in the pressure range tested.
•
Particle morphology and fabric appeared to play a significant role in the behavior of iron ore tailings, allowing them to exist at larger void ratios than a nonmicrostructured material. This influence was mainly perceived in the curved critical state line obtained and the large apparent state boundary surfaces.
•
The effect of particle breakage on tailings’ mechanical behavior over the pressure range studied herein may be restricted to changes in particle morphology due to the interaction of particles with distinct mineralogy that are present in tailings (mainly iron oxide and quartz). The small iron particles degraded the larger angular quartz particles, which became rounder and less rough.
•
The industrial nature of tailings provides them with characteristics that differ from those of typical geomaterials. The mixed mineralogy and heterogeneous particle shape caused particle morphology to have a relevant influence on the behavior of these materials. In summary, it was found that tailings follow a nonassociated flow rule, that fabric allows for the existence of large apparent SBS, and that the evolving particle morphology plays a major role in their triaxial behavior.
Notation
The following symbols are used in this paper:
- minimum dilatancy;
- specific gravity;
- mean effective stress;
- pressure at critical state;
- reference mean effective pressure;
- mean effective stress at the beginning of the shearing phase;
- confining pressure at which an initially dense specimen presents compressive response;
- deviatoric stress ();
- specific ;
- specific volume at critical state;
- initial specific volume;
- water content;
- intercept of CSL at compression plane;
- specific weight;
- axial strain;
- volumetric strain;
- shear strain;
- stress ratio = ;
- maximum stress ratio;
- angle of rotation necessary to follow the new stress path; and
- state parameter.
Appendix. Derivation of Nonlinear Flow Rule
The modified cam-clay flow rule [Eq. (2)] is a common choice for the modeling of geomaterials (Baudet and Stallebrass 2004; Gajo and Muir Wood 1999; Roscoe and Burland 1968; Stallebrass and Taylor 1997; Yao et al. 2023). This flow rule gives an elliptical surface in the --plane that may or may not coincide with the yield surface depending on the type of flow rule adopted (associated or nonassociated)
(2)
This flow rule has Degree 1 in , as others such as the original cam clay flow rule (Schofield and Wroth 1968). Thus, the relationship between and also is of Degree 1, because the peak points still must obey the defined flow rule. Based on Eq. (2) and the concept that the point at which the volumetric trend changes from dilative to compressive is related to the compensation of two deformation mechanisms occurring (the dilation caused by shearing at the dry side of the critical state line, and compression due to particle breakage) a new formulation with a higher degree in is proposed to simulate the nonlinear behavior observed between and .
For this, a new parameter is defined, and is assumed to vary linearly between 0 and 1 for the pressure range from 0 kPa to the initial pressure at the inversion point (). In addition, it is postulated that when , the flow rule reduces to the modified cam-clay case. Hence the parameter can be defined aswhere = maximum stress ratio obtained considering all the analyzed tests (stress ratio at the lowest confining pressure tested); = maximum stress ratio for a given confining pressure; and = stress ratio at the inversion point, which also corresponds to the critical state strength .
(3)
To have consistency with the critical state, at which must equal zero, also must vary with . This also is consistent with theories that relate to the particle shape (e.g., Ciantia et al. 2019; de Bono and McDowell 2020; Liu et al. 2023). During increasing loading, it is considered that the occurrence of breakage may change the original particle shape observed in the material studied. Furthermore, Fig. 6 shows a trend of decreased stress ratio at the end of the test with increasing confining pressure. Therefore the parameter is defined aswhere is a fitting parameter.
(4)
Therefore the new flow rule takes the form
(5)
Data Availability Statement
Some or all data, models, or code that support the findings of this study are available from the corresponding author upon reasonable request.
Acknowledgments
The authors express their appreciation to MEC-CAPES (PROEX), CNPq, and VALE S.A. for the support of the research group.
References
Adesina, P., C. O’Sullivan, and T. Wang. 2023. “DEM study on the effect of particle shape on the shear behaviour of granular materials.” Comput. Particle Mech. 11 (1): 447–466. https://doi.org/10.1007/s40571-023-00632-8.
Altuhafi, F., B. A. Baudet, and P. Sammonds. 2006. “Particle breakage in glacial sediments.” In Geomechanics and geotechnics of particulate media, edited by M. Hyodo, H. Murata, and Y. Nakata, 21–24. London: CRC Press.
Altuhafi, F., B. A. Baudet, and P. Sammonds. 2010. “The mechanics of subglacial sediment: An example of new ‘transitional’ behavior.” Can. Geotech. J. 47 (7): 775–790. https://doi.org/10.1139/T09-136.
Artoni, R., A. Neveu, Y. Descantes, and P. Richard. 2019. “Effect of contact location on the crushing strength of aggregates.” J. Mech. Phys. Solids 122 (Jan): 406–417. https://doi.org/10.1016/j.jmps.2018.09.030.
ASTM. 2014. Standard test methods for specific gravity of soil solids by water pycnometer. ASTM D854. West Conshohocken, PA: ASTM.
ASTM. 2017. Standard practice for classification of soils for engineering purposes (Unified Soil Classification System). ASTM D2487. West Conshohocken, PA: ASTM.
ASTM. 2020a. Standard test method for consolidated drained triaxial compression test for soils. ASTM D7181. West Conshohocken, PA: ASTM.
ASTM. 2020b. Standard test method for consolidated undrained triaxial compression test for cohesive soils. ASTM D4767. West Conshohocken, PA: ASTM.
ASTM. 2021a. Standard test method for particle-size distribution (gradation) of fine-grained soils using the sedimentation (hydrometer) analysis. ASTM D7928. West Conshohocken, PA: ASTM.
ASTM. 2021b. Standard test methods for laboratory compaction characteristics of soil using standard effort ( ()). ASTM D698. West Conshohocken, PA: ASTM.
Atkinson, J. H., D. Richardson, and S. E. Stallebrass. 1990. “Effect of recent stress history on the stiffness of overconsolidated soil.” Géotechnique 40 (4): 531–540. https://doi.org/10.1680/geot.1990.40.4.531.
Baudet, B., and S. Stallebrass. 2004. “A constitutive model for structured clays.” Géotechnique 54 (4): 269–278. https://doi.org/10.1680/geot.2004.54.4.269.
Bowman, E. T., K. Soga, and W. Drummond. 2001. “Particle shape characterisation using Fourier descriptor analysis.” Géotechnique 51 (6): 545–554. https://doi.org/10.1680/geot.2001.51.6.545.
Carraro, J. A. H., M. Prezzi, and R. Salgado. 2009. “Shear strength and stiffness of sands containing plastic or nonplastic fines.” J. Geotech. Geoenviron. Eng. 135 (9): 1167–1178. https://doi.org/10.1061/(ASCE)1090-0241(2009)135:9(1167).
Carrera, A., M. R. Coop, and R. Lancellotta. 2011. “Influence of grading on the mechanical behaviour of Stava tailings.” Géotechnique 61 (11): 935–946. https://doi.org/10.1680/geot.9.P.009.
Carvalho, J. V. A. 2023. “Constitutive behaviour of filtered and compacted iron ore tailings.” Master thesis, Graduate Program in Civil Engineering, Universidade Federal do Rio Grande do Sul.
Chandler, H. W. 1985. “A plasticity theory without drucker’s postulate, suitable for granular materials.” J. Mech. Phys. Solids 33 (3): 215–226. https://doi.org/10.1016/0022-5096(85)90012-2.
Ciantia, M. O., M. Arroyo, C. O’Sullivan, A. Gens, and T. Liu. 2019. “Grading evolution and critical state in a discrete numerical model of Fontainebleau sand.” Géotechnique 69 (1): 1–15. https://doi.org/10.1680/jgeot.17.P.023.
Clayton, C. R. I., and S. A. Khatrush. 1986. “A new device for measuring local axial strains on triaxial specimens.” Géotechnique 36 (4): 593–597. https://doi.org/10.1680/geot.1986.36.4.593.
Collins, I. F., B. Muhunthan, and B. Qu. 2010. “Thermomechanical state parameter models for sands.” Géotechnique 60 (8): 611–622. https://doi.org/10.1680/geot.8.P.127.
Consoli, N. C., K. S. Heineck, M. R. Coop, A. V. da Fonseca, and C. Ferreira. 2007. “Coal bottom ash as a geomaterial: Influence of particle morphology on the behavior of granular materials.” Soils Found. 47 (2): 361–373. https://doi.org/10.3208/sandf.47.361.
Consoli, N. C., J. P. S. Silva, A. C. Wagner, J. V. D. A. Carvalho, B. A. Baudet, M. R. Coop, H. C. Scheuermann Filho, I. Carvalho, G. M. de Sousa, and P. P. Cacciari. 2023. “Critical state analysis of two compacted filtered iron ore tailings with different gradings and mineralogy at different stages of treatment.” Acta Geotech. 19 (2): 881–898. https://doi.org/10.1007/s11440-023-01963-9.
Consoli, N. C., J. C. Vogt, J. P. S. Silva, H. M. Chaves, H. C. Scheuermann Filho, E. B. Moreira, and A. Lotero. 2022. “Behaviour of compacted filtered iron ore tailings–Portland cement blends: New Brazilian trend for tailings disposal by stacking.” Appl. Sci. 12 (2): 836. https://doi.org/10.3390/app12020836.
Coop, M. R. 1990. “The mechanics of uncemented carbonate sands.” Géotechnique 40 (4): 607–626. https://doi.org/10.1680/geot.1990.40.4.607.
Coop, M. R. 2015. “Limitations of a critical state framework applied to the behaviour of natural and ‘transitional’ soils.” In Proc., 6th Int. Symp. on Deformation Characteristics of Geomaterials: Deformation Characteristics of Geomaterials, edited by Rinaldi, V. A., M. E. Zeballos, and J. J. Clariá, 115–155. Amsterdam, Netherlands: IOS Press.
Coop, M. R., and I. K. Lee. 1993. “The behaviour of granular soils at elevated stresses.” In Proc., Wroth Memorial Symp.: Predictive Soil Mechanics, 186–198. Oxford, UK: Thomas Telford.
Cotecchia, F., and R. J. Chandler. 2000. “A general framework for the mechanical behaviour of clays.” Géotechnique 50 (4): 431–447. https://doi.org/10.1680/geot.2000.50.4.431.
de Bono, J. P., and G. R. McDowell. 2014. “DEM of triaxial tests on crushable sand.” Granular Matter 16 (Aug): 551–562. https://doi.org/10.1007/s10035-014-0500-x.
de Bono, J. P., and G. R. McDowell. 2020. “The effects of particle shape on the yielding behaviour of crushable sand.” Soils Found. 60 (2): 520–532. https://doi.org/10.1016/j.sandf.2020.04.001.
Dong, Z.-L., C.-X. Tong, S. Zhang, J.-D. Teng, and D. Sheng. 2024. “A comparative study on shear behavior of uniform-, gap-, and fractal-graded carbonate soils.” J. Geotech. Geoenviron. Eng. 150 (1): 04023128. https://doi.org/10.1061/JGGEFK.GTENG-11350.
Fang, C., J. Gong, M. Jia, Z. Nie, B. Li, and A. Mohammed. 2022. “Investigating the effects of elongation and flatness on the shear behaviour of breakable granular materials via the DEM.” Granular Matter 24 (3): 78. https://doi.org/10.1007/s10035-022-01237-3.
Fourie, A. B., R. Verdugo, A. Bjelkevik, L. A. Torres-Cruz, and D. Znidarcic. 2022. “Geotechnics of mine tailings: A 2022 state of the art.” In Proc., 20th Int. Conf. on Soil Mechanics and Geotechical Engineering. Sydney, NSW, Australia: Australian Geomechanics Society.
Frost, J., and J.-Y. Park. 2003. “A critical assessment of the moist tamping technique.” Geotech. Test. J. 26 (1): 9850. https://doi.org/10.1520/GTJ11108J.
Gajo, A., and D. Muir Wood. 1999. “Severn–Trent sand: A kinematic-hardening constitutive model: The formulation.” Géotechnique 49 (5): 595–614. https://doi.org/10.1680/geot.1999.49.5.595.
He, H., W. Li, and K. Senetakis. 2019. “Small strain dynamic behavior of two types of carbonate sands.” Soils Found. 59 (3): 571–585. https://doi.org/10.1016/j.sandf.2018.11.003.
Hong, Y., C. H. Koo, C. Zhou, C. W. W. Ng, and L. Z. Wang. 2017. “Small strain path-dependent stiffness of Toyoura sand: Laboratory measurement and numerical implementation.” Int. J. Geomech. 17 (1): 04016036. https://doi.org/10.1061/(ASCE)GM.1943-5622.0000664.
Jardine, R. J. 1992. “Some observations on the kinematic nature of soil stiffness.” Soils Found. 32 (2): 111–124. https://doi.org/10.3208/sandf1972.32.2_111.
Jovicic, V., and M. R. Coop. 1997. “Stiffness of coarse-grained soils at small strains.” Géotechnique 47 (3): 545–561. https://doi.org/10.1680/geot.1997.47.3.545.
Karatza, Z., E. Andò, S.-A. Papanicolopulos, G. Viggiani, and J. Y. Ooi. 2019. “Effect of particle morphology and contacts on particle breakage in a granular assembly studied using X-ray tomography.” Granular Matter 21 (Aug): 44. https://doi.org/10.1007/s10035-019-0898-2.
Kuwano, R., and R. J. Jardine. 2007. “A triaxial investigation of kinematic yielding in sand.” Géotechnique 57 (7): 563–579. https://doi.org/10.1680/geot.2007.57.7.563.
Ladd, R. 1978. “Preparing test specimens using undercompaction.” Geotech. Test. J. 1 (1): 16. https://doi.org/10.1520/GTJ10364J.
Lade, P. V., and J. A. Yamamuro. 1997. “Effects of nonplastic fines on static liquefaction of sands.” Can. Geotech. J. 34 (6): 918–928. https://doi.org/10.1139/t97-052.
Li, W., and M. R. Coop. 2019. “The Mechanical behaviour of Panzhihua iron tailings.” Can. Geotech. J. 56 (3): 420–435. https://doi.org/10.1139/cgj-2018-0032.
Li, X. S., and Y. F. Dafalias. 2012. “Anisotropic critical state theory: Role of fabric.” J. Eng. Mech. 138 (3): 263–275. https://doi.org/10.1061/(ASCE)EM.1943-7889.0000324.
Liu, D., C. O’Sullivan, and J. A. H. Carraro. 2021. “Influence of particle size distribution on the proportion of stress-transmitting particles and implications for measures of soil state.” J. Geotech. Geoenviron. Eng. 147 (3): 04020182. https://doi.org/10.1061/(ASCE)GT.1943-5606.0002466.
Liu, Y., X. Liu, and W. Hu. 2023. “Competition mechanism between dilation and interlocking in granular soils: DEM simulation and constitutive modeling.” Acta Geotech. 18 (1): 149–169. https://doi.org/10.1007/s11440-022-01552-2.
Lo Presti, D., O. Pallara, R. Lancellotta, M. Armandi, and R. Maniscalco. 1993. “Monotonic and cyclic loading behavior of two sands at small strains.” Geotech. Test. J. 16 (4): 409. https://doi.org/10.1520/GTJ10281J.
McDowell, G. R., and M. D. Bolton. 1998. “On the micromechanics of crushable aggregates.” Géotechnique 48 (5): 667–679. https://doi.org/10.1680/geot.1998.48.5.667.
Mitchell, J. K., and K. Soga. 2005. Fundamentals of soil behavior. 3rd ed. Hoboken, NJ: Wiley.
Mróz, Z. 1967. “On the description of anisotropic workhardening.” J. Mech. Phys. Solids 15 (3): 163–175. https://doi.org/10.1016/0022-5096(67)90030-0.
Muir Wood, D. 2007. “The magic of sands: The 20th Bjerrum lecture presented in Oslo, 25 November 2005.” Can. Geotech. J. 44: 1329–1350. https://doi.org/10.1139/T07-060.
Poorooshasb, H. B. 1989. “Description of flow of sand using state parameters.” Comput. Geotech. 8 (3): 195–218. https://doi.org/10.1016/0266-352X(89)90043-8.
Roscoe, K. H., and J. B. Burland. 1968. “On the generalized stress-strain behavior of wet clays.” In Engineering plasticity, 535–608. Cambridge, UK: Cambridge University Press.
Roscoe, K. H., A. N. Schofield, and C. P. Wroth. 1958. “On the yielding of soils.” Géotechnique 8 (1): 22–53. https://doi.org/10.1680/geot.1958.8.1.22.
Salgado, R., P. Bandini, and A. Karim. 2000. “Shear strength and stiffness of silty sand.” J. Geotech. Geoenviron. Eng. 126 (5): 451–462. https://doi.org/10.1061/(ASCE)1090-0241(2000)126:5(451).
Sasitharan, S., P. K. Robertson, D. C. Sego, and N. R. Morgenstern. 1994. “State-boundary surface for very loose sand and its practical implications.” Can. Geotech. J. 31 (3): 321–334. https://doi.org/10.1139/t94-040.
Schnaid, F., 2021. The 9th James K. Mitchell lecture: On the geomechanics and geocharacterization of tailings.” In Proc., 6th Int. Conf. on Geotechnical and Geophysical Site Characterization. London: International Society for Soil Mechanics and Geotechnical Engineering.
Schofield, A., and C. P. Wroth. 1968. Critical state soil mechanics. New York: McGraw-Hill.
Shipton, B., and M. R. Coop. 2015. “Transitional behaviour in sands with plastic and non-plastic fines.” Soils Found. 55 (1): 1–16. https://doi.org/10.1016/j.sandf.2014.12.001.
Stallebrass, S. E., and R. N. Taylor. 1997. “The development and evaluation of a constitutive model for the prediction of ground movements in overconsolidated clay.” Géotechnique 47 (2): 235–253. https://doi.org/10.1680/geot.1997.47.2.235.
Sun, Q., J. Zheng, M. R. Coop, and F. N. Altuhafi. 2019. “Minimum image quality for reliable optical characterizations of soil particle shapes.” Comput. Geotech. 114 (Oct): 103110. https://doi.org/10.1016/j.compgeo.2019.103110.
Thevanayagam, S., and S. Mohan. 2000. “Intergranular state variables and stress–strain behaviour of silty sands.” Géotechnique 50 (1): 1–23. https://doi.org/10.1680/geot.2000.50.1.1.
Tian, J., and E. Liu. 2019. “Influences of particle shape on evolutions of force-chain and micro-macro parameters at critical state for granular materials.” Powder Technol. 354 (Sep): 906–921. https://doi.org/10.1016/j.powtec.2019.07.018.
Todisco, M. C., and M. R. Coop. 2016. “Normalisation techniques for slowly-converging soils.” Procedia Eng. 158 (Jan): 110–115. https://doi.org/10.1016/j.proeng.2016.08.414.
Todisco, M. C., W. Wang, M. R. Coop, and K. Senetakis. 2017. “Multiple contact compression tests on sand particles.” Soils Found. 57 (1): 126–140. https://doi.org/10.1016/j.sandf.2017.01.009.
Velten, R. Z., N. C. Consoli, H. C. Scheuermann Filho, A. C. Wagner, F. Schnaid, and J. P. R. Da Costa. 2023. “Influence of grading and fabric arising from the initial compaction on the geomechanical characterisation of compacted copper tailings.” Géotechnique 74 (5): 1–12. https://doi.org/10.1680/jgeot.22.00087.
Vilhar, G., V. Jovičić, and M. R. Coop. 2013. “The role of particle breakage in the mechanics of a non-plastic silty sand.” Soils Found. 53 (1): 91–104. https://doi.org/10.1016/j.sandf.2012.12.006.
Wagner, A. C., J. P. S. de Sousa Silva, J. V. A. de Carvalho, A. L. C. Rissoli, P. P. Cacciari, H. M. Chaves, H. C. Scheuermann Filho, and N. C. Consoli. 2023. “Mechanical behavior of iron ore tailings under standard compression and extension triaxial stress paths.” J. Rock Mech. Geotech. Eng. 15 (7): 1883–1894. https://doi.org/10.1016/j.jrmge.2022.11.013.
Yang, Y., Z. Wei, A. Fourie, Y. Chen, B. Zheng, W. Wang, and S. Zhuang. 2019. “Particle shape analysis of tailings using digital image processing.” Environ. Sci. Pollut. Res. 26: 26397–26403. https://doi.org/10.1007/s11356-019-05974-6.
Yao, T., B. A. Baudet, and S. D. N. Lourenço. 2022. “Evolution of surface roughness of single sand grains with normal loading.” Géotechnique 72 (6): 543–555. https://doi.org/10.1680/jgeot.20.P.310.
Yao, Y., G. He, and T. Luo. 2023. “Study on determining the plastic flow direction of soils with dilatancy.” Acta Geotech. 18 (5): 2411–2425. https://doi.org/10.1007/s11440-022-01770-8.
Zhang, X., and B. Baudet. 2014. “The multi-fractal nature of soil particle size distribution.” In Geomechanics from micro to macro, edited by K. Soga, K. Kumar, G. Biscontin, and M. Kuo, 1183–1188. Leiden, Netherlands: CRC Press.
Zheng, J., and R. D. Hryciw. 2015. “Traditional soil particle sphericity, roundness and surface roughness by computational geometry.” Géotechnique 65 (6): 494–506. https://doi.org/10.1680/geot.14.P.192.
Information & Authors
Information
Published In

Journal of Geotechnical and Geoenvironmental Engineering
Volume 150 • Issue 8 • August 2024
Copyright
This work is made available under the terms of the Creative Commons Attribution 4.0 International license, https://creativecommons.org/licenses/by/4.0/.
History
Received: Sep 22, 2023
Accepted: Mar 14, 2024
Published online: May 23, 2024
Published in print: Aug 1, 2024
Discussion open until: Oct 23, 2024
ASCE Technical Topics:
- Engineering materials (by type)
- Environmental engineering
- Geomaterials
- Geomechanics
- Geotechnical engineering
- Iron (material)
- Materials engineering
- Metals (material)
- Mine wastes
- Particles
- Pollutants
- Soil mechanics
- Soil properties
- Soil stress
- Stress (by type)
- Stress history
- Structural analysis
- Structural engineering
- Wastes
Authors
Metrics & Citations
Metrics
Citations
Download citation
If you have the appropriate software installed, you can download article citation data to the citation manager of your choice. Simply select your manager software from the list below and click Download.