Nanosilica Grout Permeation in Sand: Experimental Investigation and Modeling
Publication: Journal of Geotechnical and Geoenvironmental Engineering
Volume 150, Issue 1
Abstract
Low-pressure injection of nanosilica aqueous suspensions is often adopted to either waterproof or increase the liquefaction resistance of granular soils. The basic principle behind this ground improvement technique consists in filling the soil pores with a low-viscosity fluid that changes its consistency with time, first into a gel, then into a solid. From an application point of view, the simulation of the time-dependent permeation process is crucial to relate the in situ distance covered by the grout to the operational parameters. A comprehensive investigation was performed, combining laboratory experiments with theoretical approaches, to characterize the phenomenon and then derive predictive relations useful for designing treatment executions. The time-dependent rheological properties of different nanosilica aqueous suspensions were first quantified by means of rheometric tests, then described with Bingham’s law. Grout permeation in granular media was then simulated by suitably modifying Darcy’s law to incorporate the temporal evolution of Binghamian grout rheology. After validating the modified Darcy’s law employment for nanosilica grout flows with respect to laboratory experimental data, simplified analytical equations, capable of predicting the temporal evolution of the distance covered in situ by the grout and the flow rate–injection pressure relation, are provided.
Practical Applications
Nanosilica aqueous suspensions are environmentally nontoxic materials with the consistency of a low-viscosity fluid, suitable for injections into fine-graded soils, but, when mixed with a sodium-chloride solution, they transform with time into a gel of solid consistency. Thanks to these properties, they are frequently adopted to provide a fast remedial against piping induced by excavation, seal contaminants or reduce the liquefaction potential of sands. Nanosilica grout is commonly injected at low pressure, leading to filling soil pores during seepage. The previously mentioned transient evolution of the suspension rheological properties, controlled by nanosilica and sodium-chloride proportions, starts during the injection-seepage phase, playing a paramount role in affecting the geometry of the treated soil domain. The present work provides an accurate description of the time-dependent grout rheology and a predictive seepage analytical tool to simulate the diffusion of nanosilica grouts, characterized by variable compositions and injected from sources of different geometrical layouts into homogeneous soils with different grain size distributions. This tool allows tailoring of the injection parameters (pump pressure, nozzle spacing, injection time) on in situ soil hydraulic properties and rheology of the selected nanosilica suspension.
Introduction
The injection of microfine cements or chemical products to improve the hydromechanical properties of soils dates back two centuries, being one of the pioneer ground improvement methods (Karol 2003). The working principle of these methods entails a fluid-like material being injected into selected soil strata under controlled conditions via either single or multiple ports. The injection pressure cannot overcome a certain threshold related to local soil conditions in terms of both stress state and void ratio, so permeation throughout soil voids prevails upon solid grain dislocations (Boschi et al. 2020, 2022). Thanks to the low disturbance caused by the treatment to the superstructure, permeation grouting is considered particularly suitable for remediating foundations of existing buildings.
From its first use in the late 1800s until the early 1950s, all chemical grouts adopted during that time period were sodium-silicate based. The breakthrough came in the early 1950s with some advances in the polymer chemistry industry that led to the introduction in the market of a mixture of organic monomers, polymerized in situ after selected time intervals. Nowadays, nanotechnology provides geotechnical engineering with mechanically flexible and environmentally nontoxic materials, suitable for various applications. The low-pressure permeation of nanosilica aqueous suspensions is frequently adopted as a fast remedial to stop piping induced by excavations (Manassero and Di Salvo 2012), for the sealing of contaminants (Moridis et al. 1996; Persoff et al. 1999), or to reduce the liquefaction potential of sands (Gallagher and Mitchell 2002; Gallagher et al. 2007a; Liao et al. 2003; Salvatore et al. 2020). Especially to improve the mechanical response of granular soils (Spagnoli 2021), other materials, such as microfine cements (Mollamahmutoglu and Yilmaz 2011), acrylic resins (Cui et al. 2022), polyurethanes (Saleh et al. 2019), and urea-silicates (Meikle et al. 2018), are sometimes preferred.
Nanosilica products for grouting are commercialized as aqueous suspensions of submicrometric silica particles. Their initial low viscosity, similar to that of water, enables them to cover large distances when injected in relatively low-permeable soils. Immediately before injection, the nanosilica suspension is mixed with an activator salt, triggering in this way a chemical reaction that leads to the formation of a gel made of highly hydrophilic chains of silica particles. Thereafter, the gel becomes a solid and remains stable with time (Yonekura 1996). The concentration of salt and nanosilica, as well as pH and temperature, are important factors that influence the time dependency of the grout rheology (Iler 1979) and, consequently, the grout propagation throughout soils. Among them, nanosilica concentration also plays a crucial role in terms of overall costs and achieved mechanical properties of the treated soil (Persoff et al. 1999; Zhao et. al. 2019; Spagnoli et al. 2021). High percentages of solid nanosilica are required for a significant mechanical improvement of the treated soil, but the cost associated with the treatment is very often judged unacceptable. Inexpensive low solid-nanosilica concentrations (3%–5%) are anyway effective in reducing both the soil hydraulic conductivity by some orders of magnitude and the liquefaction potential of soils (Salvatore et al. 2020). These aspects are of paramount importance when designing ad-hoc grout compositions for in situ treatments.
To implement the technique on large-scale problems, it is crucial to predict the temporal evolution of the permeation process and relate the in situ distance covered by the grout to operational parameters, namely the grout composition, injection pressure and flow rate, and spatial distribution of the injection sources. The permeation process can thus be reproduced, either analytically or numerically, as long as the time dependency of the grout rheology is correctly simulated. For instance, gelling times that are too short inhibit seepage and limit the extension of the treated area, whereas values much longer than treatment times may cause the dispersion of nanosilica in the groundwater, delaying or totally inhibiting the treatment. The values of gelling time investigated in this paper, from dozens of minutes to few hours, are the ones commonly adopted in permeation grouting treatments (Bolisetti et al. 2009; Maher et al. 1994; Christopher et al. 1989). Larger values, also reaching the order of days, are assigned instead when nanosilica grouts are adopted for passive site stabilization treatments (Agapoulaki and Papadimitriou 2018; Gallagher et al. 2007b; Lin and Gallagher 2006; Gallagher and Finsterle 2004; Gallagher 2000). Also, the rheological properties of the material in the transition state from suspension to gel can significantly influence the seepage and treated area extension, so their evolution must be carefully considered.
Most of the existing research on grout injections consists of experimental studies where specific grout and injection techniques are applied to specific soil conditions. For example, Bolisetti et al. (2009), Lin and Gallagher (2006), and Christopher et al. (1989) refer to the chemical grouting of sands. Among them, a few mathematical or numerical models have been used to simulate permeation grouting applications in porous media (Han 2015). Raffle and Greenwood (1961), Tomiolo (1982), and Celik (2019) modeled grout flow assuming the convective phenomenon was dominant, governed by the standard Darcy’s law, disregarding the interstitial fluid presence and scaling soil hydraulic conductivity to water by the ratio between the viscosities of grout and water (Muller-Kirchenbauer 1972). These authors, however, did not provide a validation of this simplified approach and did not accurately discuss the method assumptions.
Bouchelaghem et al. (2001) performed a systematic analysis of all the complex chemical and physical interactions expected to take place between the different phases during injections of suspension-based grouts. The proposed model encompasses a complete mathematical description of the filtration–advection–dispersion phenomena occurring in grouts propagating through saturated deformable porous media, but it requires the assessment of a series of constitutive parameters not easy to obtain. More recently, Coskun and Tokdemir (2020) proposed a more simplified mathematical model to simulate the in situ permeation of silicate grouts, characterized by a water-based nature and initial viscosities and densities close to those of water, through a fully water-saturated rigid soil, assuming grout to be incompressible and immiscible, gravity effects and capillary phenomenon negligible. This model successfully simulates analogous numerical data based on the miscible flow theory of Honma (1984). Moreover, considering silica grout injections at constant flow rates, the numerical results were also compared with experimental observations provided by Bader (1981). The good agreement in terms of grout front advancement seems to justify the previously mentioned model assumptions (grout incompressibility, immiscibility, and negligibility of gravity and capillary effects). Conversely, the spatial and temporal distributions of pressure detected on experiments were not satisfactorily captured, due to the simplified Newtonian rheology adopted in the model.
The novelty of this work, with respect to all the previously mentioned works, lies in a more realistic description of the grout rheology, also taking into consideration the role of gelling phenomena occurring during injection. A seepage model is then developed to simulate the permeation through sands of different water conductivities of nanosilica grouts, characterized by different compositions. Hydro-chemo-mechanical coupled phenomena like adhesion and deposition, causing a change in (1) grout–soil interaction, (2) geometry at the micro scale of the porous system, and (3) flowing grout rheology, are assumed to play a negligible role.
The present study starts from the investigation of the time-dependent rheological behavior of a commonly adopted nanosilica grout carried out by performing rheometric tests at different shear strain rates and its interpretation by using a time-dependent Bingham rheological model. For the sake of completeness, rheometric tests showing the time evolution of yield stress and viscosity for variable relative proportions of solid nanosilica and salt are reported and critically discussed. Then, flows of Binghamian fluids throughout granular soils are investigated and modeled. The flow law herein proposed, based on a modified version of Darcy’s law, is validated against a series of one-dimensional seepage laboratory tests where nanosilica grouts of different compositions were injected into poorly graded sand specimens. Once validated, the modified Darcy’s law was applied, under the main assumptions of soil homogeneity (justified by the difficulty in locally characterizing porous matrix parameters and the small volume of the treated domain) and fluid immiscibility (discussed in Appendix I and Section “Experimental Tests and Results”), to derive simplified analytical equations predicting the temporal evolution of (1) the distance covered in situ by the nanosilica grout front and (2) the evolution of flow rate or injection pressure for spherical or cylindrical sources where constant injection pressure or flow rate are alternatively imposed. The reliability of each simplifying assumption was investigated referring to ad-hoc tests or more advanced numerical simulations, focusing on the common practical applications of nanosilica grout injections in water-saturated soils.
As far as the seepage process description in a porous medium is concerned, the approach herein proposed and employed for nanosilica can be generalized to a larger class of fluids whose rheology can be described according to Bingham’s law as cementitious grouts (Håkansson et al. 1992), bentonite (Luckham and Rossi 1999), laponite (Liu et al. 2018), and so on.
Rheology of Nanosilica Grouts
Nanosilica products for grouting are mainly composed of water suspensions of solid nanoparticles fabricated by precipitating a saturated solution of silicic acid (Iler 1979). The suspension is stabilized in a colloidal configuration with a pH value close to 10.5. This highly alkaline environment, indeed, causes the particles to ionize and repel each other. The equivalent Newtonian viscosity of the suspension ranges between 5 and , depending on both the size and concentration of the nanosilica particles (MBS Italia 2021). Before injection, these products are mixed with an activator consisting of sodium chloride water solutions (). At reduced pH values, then, the particle electrical charge decreases in proportion to the concentration of hydroxyl ions, and this environment triggers the formation of siloxane bonds (also called silica chains) and the coalescence of particles into a gel structure (Iler 1979; Hench 1998; Brinker and Scherer 2013; Pedrotti et al. 2017).
These chemical reactions occurring in the nanosilica grout (NSG) progressively reduce with time the mobility of particles and so of the whole grout, with a transient modification of the rheological properties, until they transform grout with a fluid nature into gel. Bolisetti et al. (2009) identified the gelling trigger as the instant of time at which the pressures necessary to inject NSGs into sand columns increase very steeply in a short duration. Analogously, Pedrotti et al. (2017) defined gelling time as the instant of time when the NSG equivalent Newtonian viscosity starts increasing exponentially.
NSGs can be prepared at different dilution ratios by adding sodium chloride water solutions to commercial nanosilica products. Both absolute and relative proportions of solid nanosilica (NS) and sodium chloride (NaCl) affect both and the temporal evolution of rheological properties. The influence of grout composition mainly in terms of was first studied by Iler (1979). This author and Yates (1990) showed that some minutes are necessary for the gelling of fluids with relatively high solid nanosilica and activator salt percentages (%NS on the order of 10%, %NaCl on the order of 10%). The value of increases to several hours for more diluted suspensions. As was recently confirmed by Salvatore et al. (2020), the dependence between NaCl concentration and for a given concentration of NS is not linear, being characterized by a minimum value corresponding to a characteristic NaCl concentration. In addition to the grout composition influence, Iler (1979) first observed a dependency in NSG rheology also on pH and temperature . The dependence on pH, with a minimum reached for , was also accurately investigated by Lin and Gallagher (2006) and Pedrotti et al. (2017), in which HCl and NaOH were used to adjust the NSG solution pH to values ranging between 3 and 9. The effect of has been more recently studied by Bergna and Roberts (2005): as increases, reduces and vice versa.
Then, shear stress for NSGs is a function of shear strain rate , , %NS, %NaCl, pH, and , and the constitutive relationship is dominated by a complex thermo-chemo-mechanical coupling. In this paper, this constitutive relationship is investigated by performing a series of rheometric tests at different , observing the temporal evolution for different NSG compositions (%NS and %NaCl). These last were assigned values for consideration typically adopted in permeation grouting applications. The dependence on pH was only indirectly taken into account (the pH values of the investigated NSGs are listed in Table 1) by dealing with different dilution ratios of the commercial nanosilica product employed and the associated activator. The dependency on was disregarded by assuming the permeation process takes place under a constant temperature of 20°C, at which the rheometric tests were performed.
| NSG | NS | NaCl | pH | |||||||||
|---|---|---|---|---|---|---|---|---|---|---|---|---|
| (%) | (–) | (min) | () | (mPa) | (–) | |||||||
| A | 3 | 2 | 9.3 | 23 | 115 | 137 | 1 | 1 | 22 | 3 | 9 | 0 |
| B | 5 | 2 | 9.5 | 37 | 60 | 65 | 1 | 9.2 | 49 | 0 | 25 | 9 |
| C | 12.7 | 1.5 | 10.2 | 7.5 | 21.6 | 24 | 1.1 | 6.4 | 24.1 | 0 | 25 | 3 |
| D | 5 | 3 | 9.5 | 6 | 9.5 | 10 | 1 | 44 | 22.7 | 0 | 80 | 10.5 |
| E | 3 | 3 | 9.3 | 1 | 7 | 8.2 | 1 | 1 | 25 | 1 | 9 | 0 |
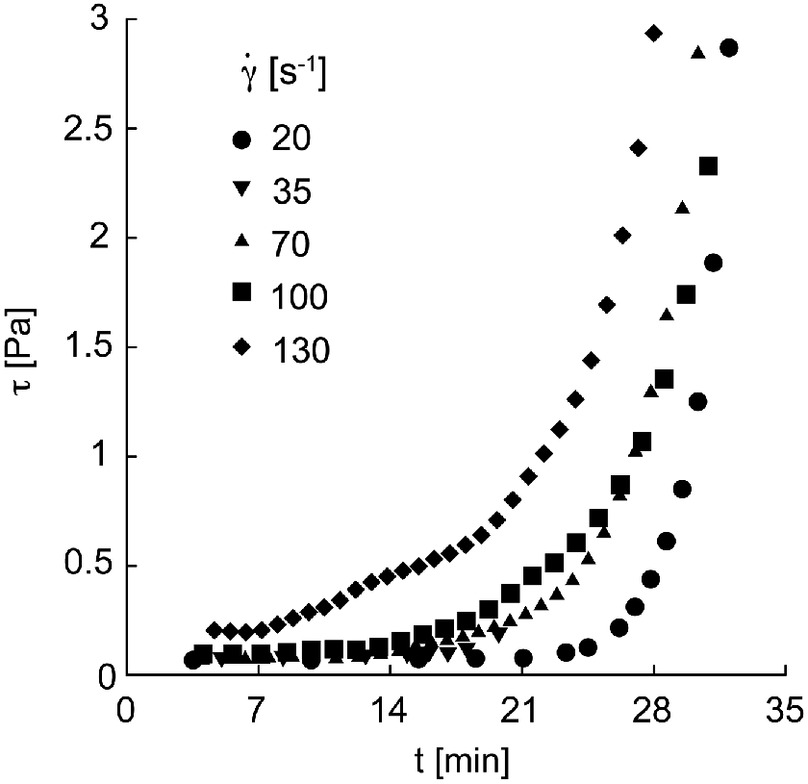
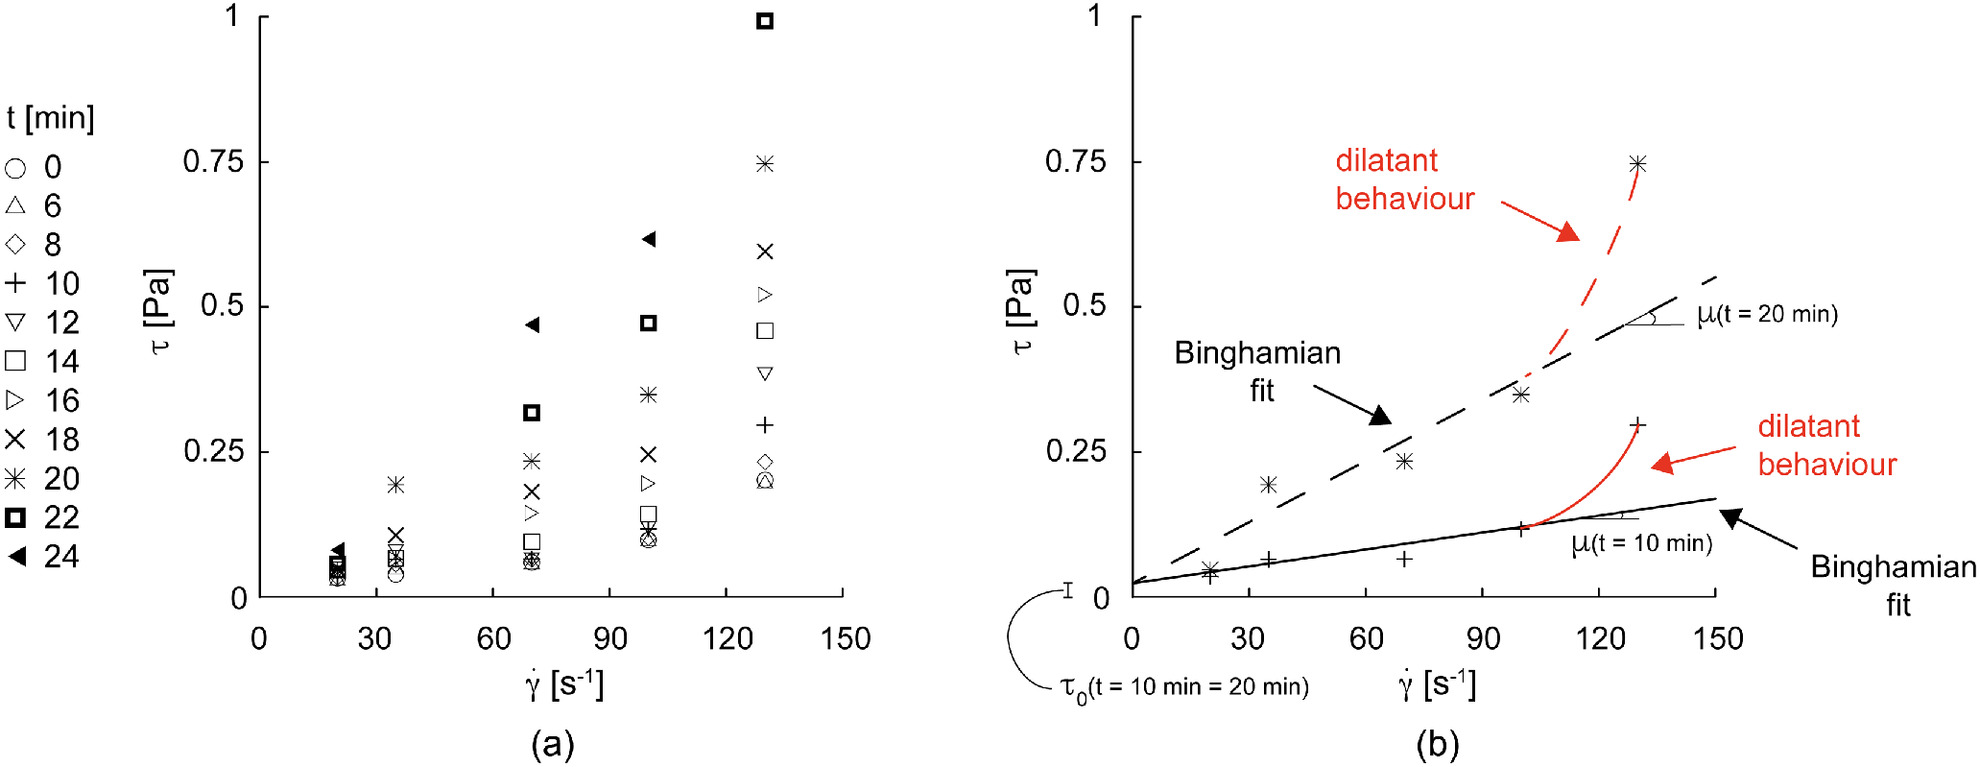
The commercial nanosilica grout hereinafter employed (MasterRoc MP325; MBS Italia 2021), widely adopted in practical applications, was characterized by particles of 15 nm, a solid concentration of 15%, and a pH of 1.4. This product was mixed with a commercial activator, first resulting in a 12.7% weight fraction of NS and 1.5% of NaCl. Indeed, the producer commonly suggests combining MP325 with a 10%–30% by volume of activator, so a 20% volume percentage of activator was first employed as a reference dilution ratio. The time-dependent relation between and of the investigated NSGs was characterized by performing a series of rheometric tests at constant , ranging between 20 and . After mixing the aqueous nanosilica and sodium chloride solutions, the fluid was energetically shaken for few seconds and tested with a Thermo Scientific HAAKE Viscotester iQ rheometer at BASF Italia S.p.A. laboratories (Villanova d’Asti, Italy). In this apparatus, the rotational velocity is impressed, whereas the torque moment is measured. This last value relates directly to shear stress , being the radii and lateral areas of the cylindrical spindle and of the containing vessel known (spindle diameter 41.42 mm and height 55 mm, gaps: spindle-vessel base 3 mm and spindle-vessel wall 1 mm, required fluid volume ; rotor type CC41/Ti–Thermo Scientific). In Fig. 1, the corresponding versus curves for the imposed values are shown for the reference NSG first investigated (characterized by imposed and ). As is evident, evolved with : the growth was initially relatively smooth, becoming more pronounced thereafter for any value. In Fig. 2, then, the correspondent versus curves are reported: different symbols refer to a chosen set of time instants.
Constitutive Relationship
For fixed time instants () in an assigned interval (), the rheological behavior of an investigated NSG (characterized by and ) was described with Bingham’s rule [Fig. 2(b), where is the so-called yield stress, whereas is the fluid viscosity]. Accordingly, the constitutive relationship may be written as
(1)
A nonlinear rheology (dilatant) would be more suitable for larger values of [Fig. 2(b)], but in permeation grouting, values of are expected only in a very small subdomain close to the injection source (Section “Application of the Model”). Moreover, dilatant models would require a larger number of constants and be associated with a nonlinear definition of the relationship between flow rate and hydraulic gradient.
Time Dependence
Once any , , and are assessed, functions and can be derived. In Fig. 3, for NSG with and , the temporal evolution of and is illustrated. The initial low viscosity of the fluid, close to that of water, is justified by the low concentrations of the solid components with respect to water. For , the grout behaved like a fluid with a constant value of both and . The value of thus represents the time at which the temporal evolution of the rheological properties started. For , then, increased, whereas remained constant (but this is not generally true for any chemical composition), with defined as the time at which gelling started, in agreement with Bolisetti et al. (2009) and Pedrotti et al. (2017). For , prevailed by rapidly increasing of orders of magnitude. The temporal evolution of the rheology suggests a phase transition of the material, behaving, according to the authors, like a “pseudo-solid” when . The time instant at which this condition is satisfied is hereafter named .
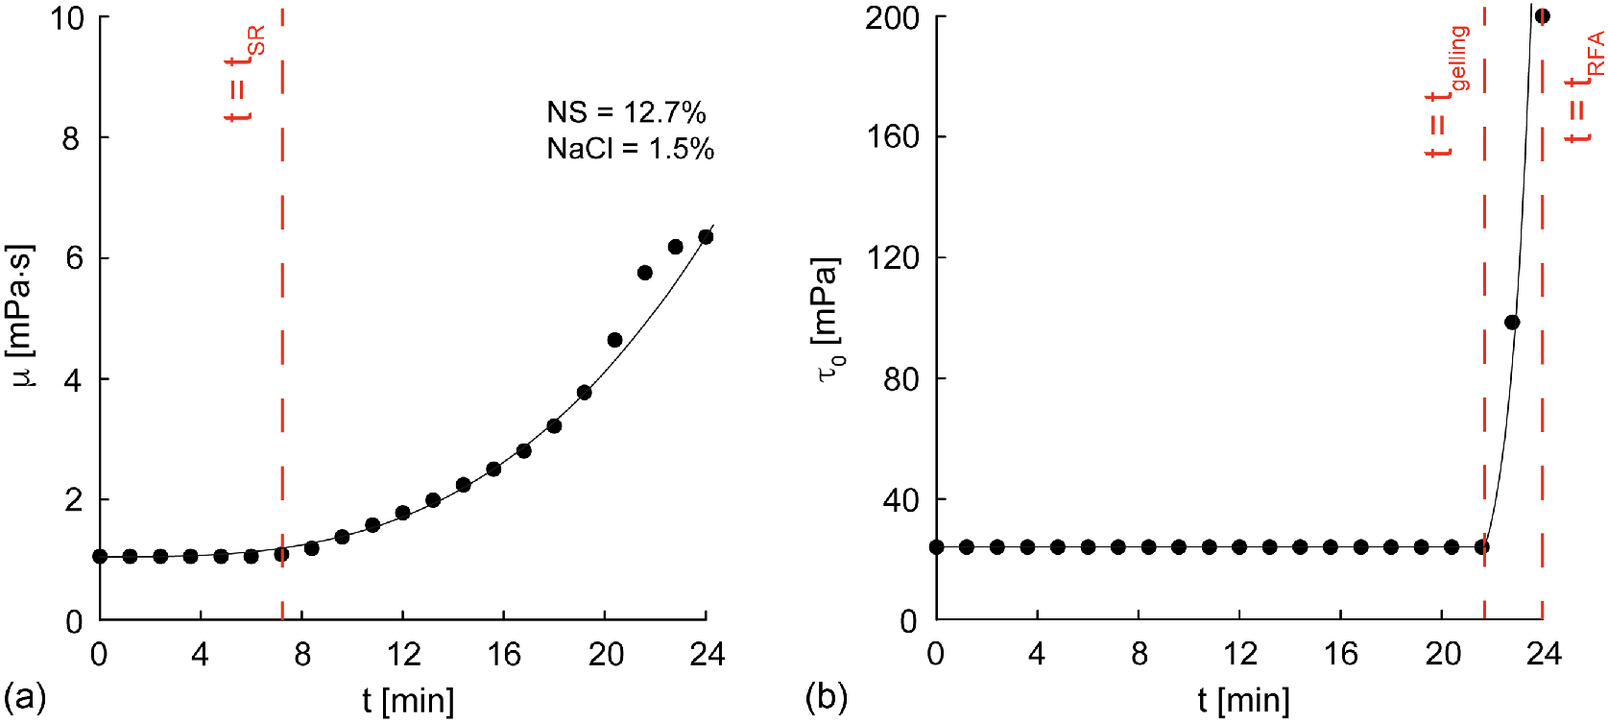
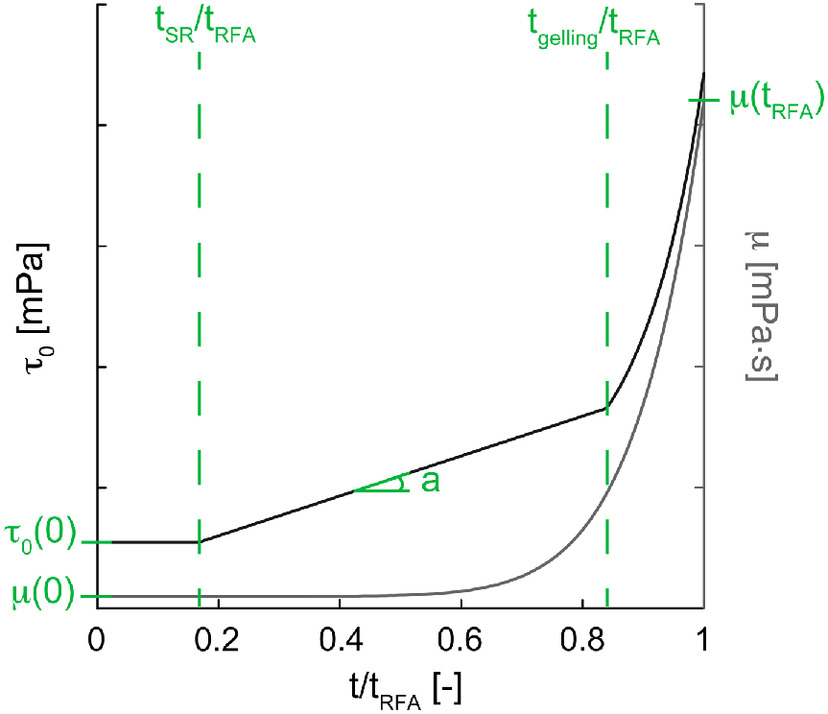
A satisfactory general fit for the temporal evolution of and is provided by the following functions (also schematically shown in Fig. 4):where , , and = nondimensional fitting parameters. The function defined by brackets (Macaulay brackets) returns a nil value in the case of a negative argument and the argument itself in the opposite case. In the case of the NSG considered previously, the nine parameters describing the temporal evolution of the material rheology are listed in Table 1 (NSG Composition C). Among them, is equal to 0 due to the fact that, in this case, remains constant for . The corresponding fitting and curves are plotted in Fig. 3 (solid lines).
(2)
(3)
As previously mentioned, the mechanical behavior of NSG depends on the occurrence of time-dependent chemical reactions: (1) the initial formation phase of the silica chains between the microscopic nanosilica particles, combined with salt, is responsible for the increase with of the rheological properties for , whereas (2) the sudden increase in after is due to the formation of structured three-dimensional networks of these silica chains (Brinker and Scherer 2013).
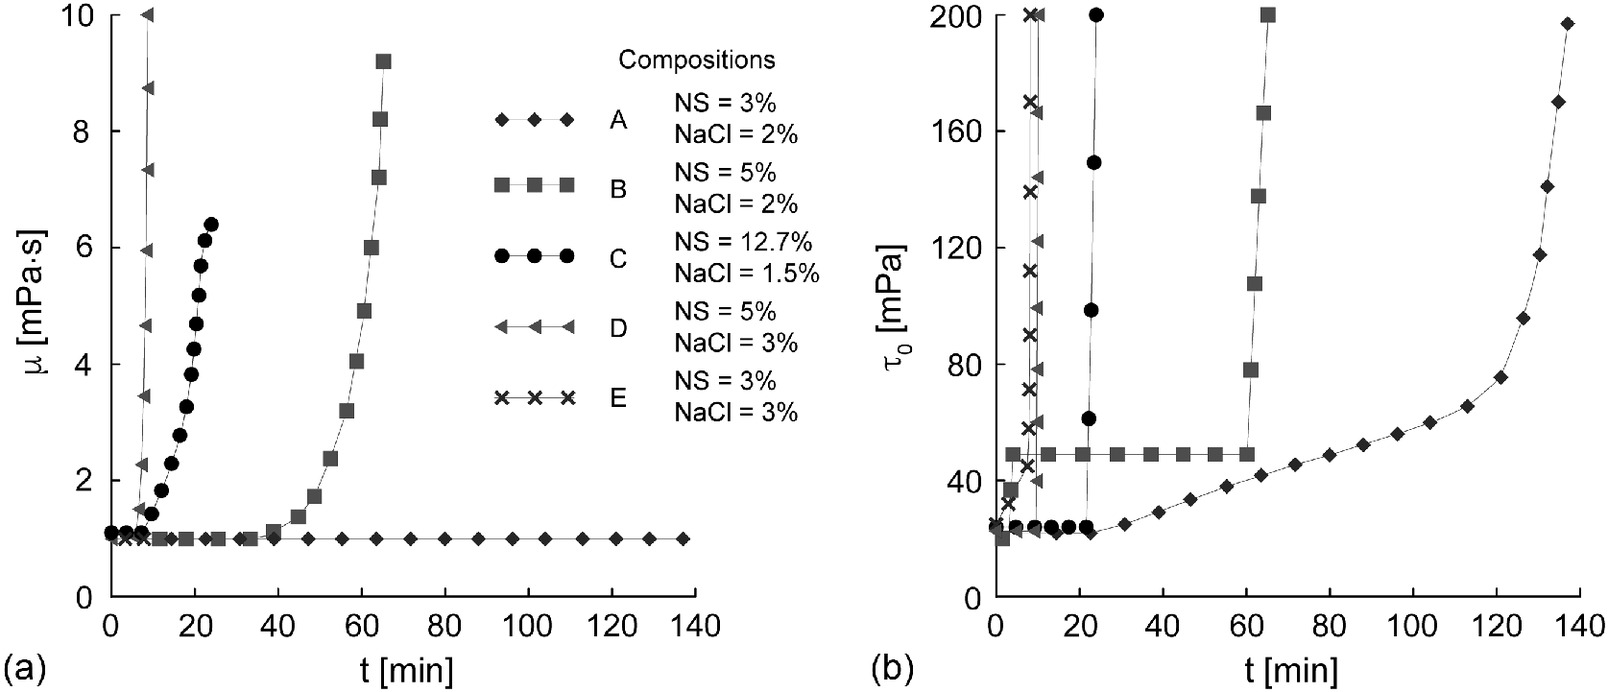
Influence of Nanosilica Grout Composition
To understand the influence of chemistry on the time dependency of the rheological properties, four concentrations of nanosilicate and activating salt (namely 3% or 5% of NS, combined with 2% or 3% of NaCl; Table 1) were tested in addition to the previously examined composition (commonly suggested by the supplier; MBS Italia 2021; Figs. 1–3). The considered range of concentrations is justified by the wide use of nanosilica to both waterproof soils and reduce their liquefaction potential. In fact, according to Salvatore et al. (2020), these low values of concentrations are sufficient to achieve these goals. Nevertheless, the theoretical approach here outlined is expected to be effective even if larger concentrations are adopted.
The time evolutions of both and for the different concentrations are compared in Figs. 5(a and b), and the correspondent fitting parameters are listed in Table 1. It seems evident that:
1.
both ) and ) seem to be weakly dependent on grout composition;
2.
both and are highly influenced from a qualitative point of view by the NS content. For , lower values of NS content (3%) are associated with a linear increase in and a constant value of (; Compositions A and E). On the other hand, higher values of NS content (Compositions B, C, and D) are associated with a constant value of () and a progressive increase in , just foreshadowing the sharp increase in for ; that is, the time period reasonably reduces with respect to lower NS content (see, for example, NSG Compositions E and D with comparable );
3.
the parameter is highly affected by both absolute and relative concentrations of NS and NaCl, whereas the parameter, when not nil, is directly proportional to %NaCl/%NS;
4.
the value of depends on both absolute and relative %NaCl and %NS. In accordance with literature findings, within this range of percentages, higher %NaCl values produce faster gelling for given %NS values. A similar effect is observed at increasing %NS values for fixed %NaCl values. For instance, small content variations in %NaCl values (Compositions A and E) induce large changes in (from 120 to 10 min).
Flows of Binghamian Fluids throughout Porous Media
The theory presented in this section aims at deriving a relation between flow rate and hydraulic gradient for a Binghamian incompressible fluid flowing in laminar regime throughout porous media, with particular attention to granular media. This goal was achieved by defining a modified version of Darcy’s law (Section “Modified Darcy’s Law”), first considering the flow of a Binghamian fluid along a circular pipe and subsequently through a system of parallel pipes (straight capillaric model). Then, this modified Darcy’s law was applied (Section “Application to Granular Porous Media”) to a granular porous medium in which a large number of ideal pipes crossing each other were present and intrinsic permeability could be assessed according to well-established literature formulas.
Modified Darcy’s Law
The problem of a Binghamian fluid flowing along a circular pipe under a laminar regime was solved by Buckingham (1921)where = overall flow rate over the pipe cross-section; = pipe radius; and the shear stress at the pipe wall, with the pressure drop along pipe length . This equation, representing the differential momentum balance, returns a value different from 0 only for . The error in omitting the fourth power term becomes less than 1.8% for . In typical grouting applications, flow rates can be reasonably assumed to be (1) sufficiently low to disregard turbulence phenomena and (2) sufficiently high to disregard the fourth power term in Eq. (4).
(4)
Eq. (4) can be extended by considering a simple straight capillaric model (Kutilek 1969), that is, a system of parallel capillary pipes of uniform diameter , and, by substituting with seepage velocity through the system (average velocity considering the flowing area as the total area and not the sum of the pore cross-section areas),where () = equivalent intrinsic permeability for the system, which is equal to , considering system porosity , where is the number of capillaries per unit area of cross-section. A modified version of Darcy’s law applicable to the flow of Binghamian fluid has thus been derived, in which the second term plays the role, depending on the considered case, of either damper or entry value.
(5)
Application to Granular Porous Media
In the case of granular porous media, Eq. (5) is applicable provided is suitably redefined and identified.
As discussed by Scheidegger (1958), intrinsic permeability of granular media depends on the complex microstructure of the porous matrix, not coinciding with the simplified one assumed in the previously mentioned straight capillaric model. The most popular equation relating to for granular media was provided by Kozeny and Carman (1937)where = constant depending on the porous geometry distribution; and = surface exposed to the fluid per unit volume of solid material, affected by both particle size distribution and particle shape. Other available empirical correlations for are listed in Chapuis (2012), in which several relations depending only on and the characteristic fine fraction diameter (easier to measure with respect to ) are reported jointly with their correspondent validity ranges.
(6)
The second term between brackets in Eq. (5) accounts for the flow plugging. In the case of a straight capillaric model, where all the pipes are characterized by the same diameter, there is no ambiguity in the definition of . In the case of granular porous media, the statistical distribution of such a diameter depends on a more complex material microstructure. An important role in plugging phenomena is played, however, by the pore throats, which are the narrowest void areas corresponding to the pore restrictions. For this reason, the authors suggest substituting in Eq. (5) with a representative measure of pore throats . Such an assumption is validated in the section “Validation of Modified Darcy’s Law for Nanosilica Grout Flows.”
In the case of low-pressure nanosilica flows in granular porous media, both and vary with time, and Eq. (5) can be written as follows:where = nondimensional seepage velocity vector; = fluid unit volume weight; = hydraulic gradient vector; = its modulus; and = minimum hydraulic gradient for the flow to be triggered, with . For Binghamian fluids flowing throughout granular porous media, four constitutive parameters need to be quantified: two of them, and , refer to the fluid, whereas and refer to the porous medium. Moreover, only depends on the evolution with time of . In contrast, the evolution of with is evident when plotting the relationship between and . In Fig. 6, the temporal evolution of the modified Darcy’s law is described in a one-dimensional flow case with reference to nanosilica grout Composition C seeping throughout a reference sand (Table 2). The different lines refer to different nondimensional times .
(7)

| NSG composition | (–) | () | ||
|---|---|---|---|---|
| , , | 11 | 0.35 | 8 |
In the oil engineering field, empirical equations similar to Eq. (7) have already proved effective for various soils and Binghamian fluids in reproducing experimental data (Mirzadjanzade et al. 1971; Wu et al. 1992). Constitutive parameters have been experimentally calibrated by these authors without passing through the microstructural interpretation suggested here. This strategy, however, cannot be followed in the case of grout injections because the grout rheology also changes with .
As was previously mentioned, to use Eq. (7), the quantification of that, according to the authors, can be identified either with mean pore throat equivalent diameter or , coincident with pore throat diameter at which the highest peak in the frequency distributions is registered, is fundamental.
Shire and O’Sullivan (2016) provided the following form to estimate :where = reducing factor, a function of both and coefficient of homogeneity ; = representative diameter of soil particles; and subscript N (lower than 15%) = weight percentage of a particle characterized by a diameter smaller than .
(8)
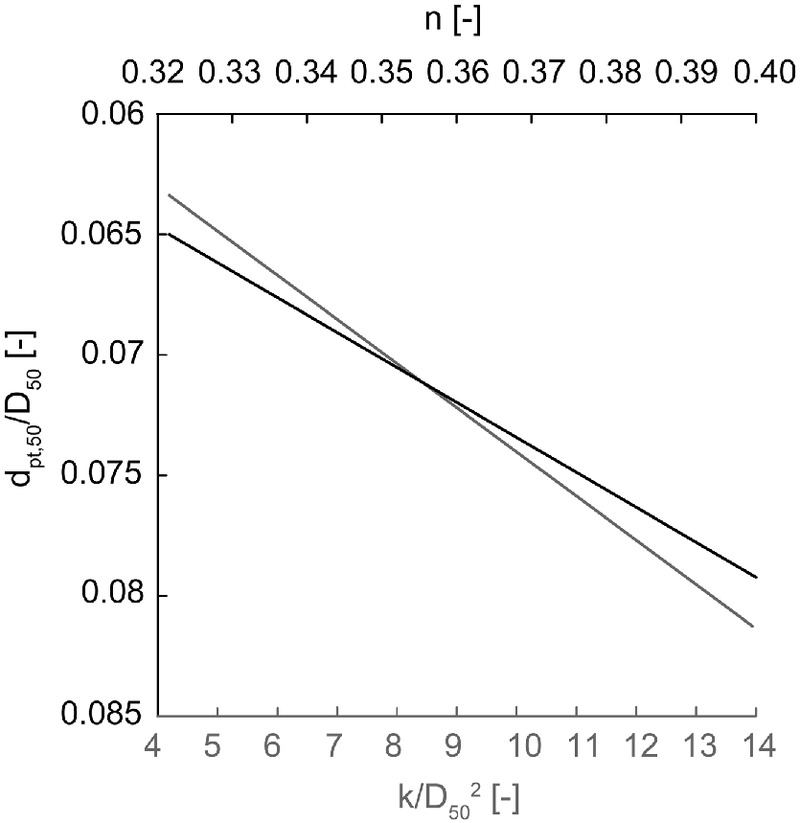
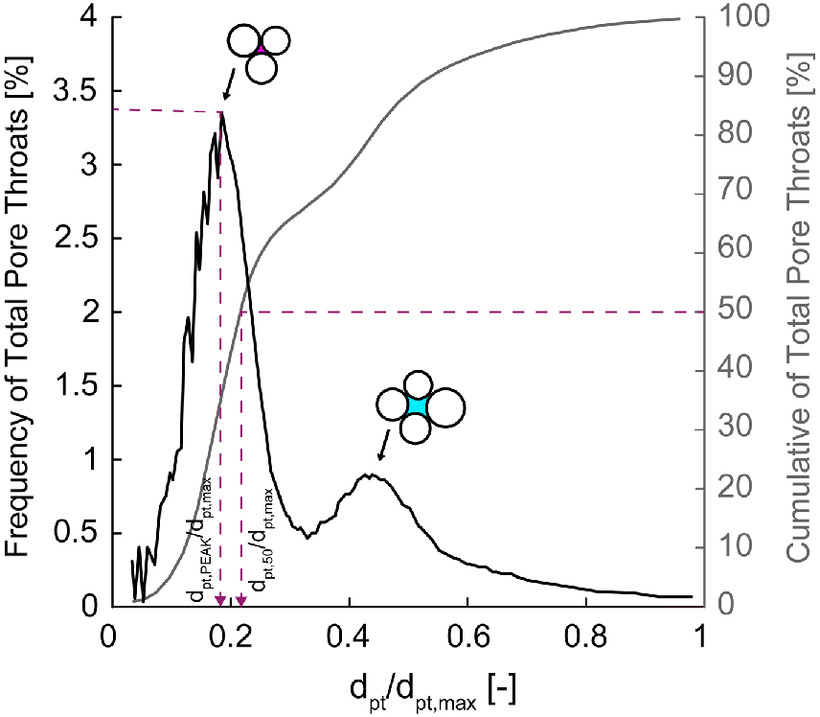
In the case of spherical and poorly graded glass beads with pore size distributions ranging from 0.4–0.6 to 1.5–2 mm, Gueven et al. (2017) (1) performed a microstructural investigation of sintered assemblies by means of high resolution X-ray computed tomography (XRCT); (2) calculated (equivalent in terms of area); (3) derived the relationships illustrated in Fig. 7 between , , and either or ; and (4) also investigated frequency distributions of (always equivalent in terms of area) and so . In Fig. 8, both frequency distribution and the cumulative curve of obtained by these authors in the case of glass beads with particle diameters ranging from 0.4 to 0.6 mm (, ) are reported. The first peak of the frequency distribution, corresponding to the smallest diameters, is determined by the pore throat areas formed by three particles, whereas the second peak, corresponding to larger diameters, is due to four-particle arrangements. As in this case, for the most-investigated specimens with poorly graded pore size distributions, Gueven et al. (2017) observed that (1) the occurrence of pore throats formed by three particles is more probable than those given by the four-particle arrangement, and (2) is much closer to the first larger peak. Finally, the authors claim that these results, accurately derived, can also be extended to the case of soils with poorly graded and regularly shaped grains.
Validation of Modified Darcy’s Law for Nanosilica Grout Flows
The modified Darcy’s law was validated against a series of laboratory experiments, where nanosilicate grouts of different compositions (A, B, and E) were injected into specimens of a homogenous sand, applying hydraulic gradients analogous to the ones typically registered in situ during permeation grouting treatments.
Experimental Tests and Results
The experimental setup illustrated in Fig. 9 shows that seepage was activated in a cylindrical specimen (height and internal diameter ) of homogenous sand, from top to bottom to avoid piping. The adopted specimen dimensions are justified by both the sand grain size distribution (the specimen diameter was 230 times the mean value of the grain size) and the boundary conditions imposed (Darcy’s laminar flow assumption can be held true almost throughout the whole specimen, with side walls smooth and turbulence extinguishing at a short distance, few grains, near the entrance and exit bases).
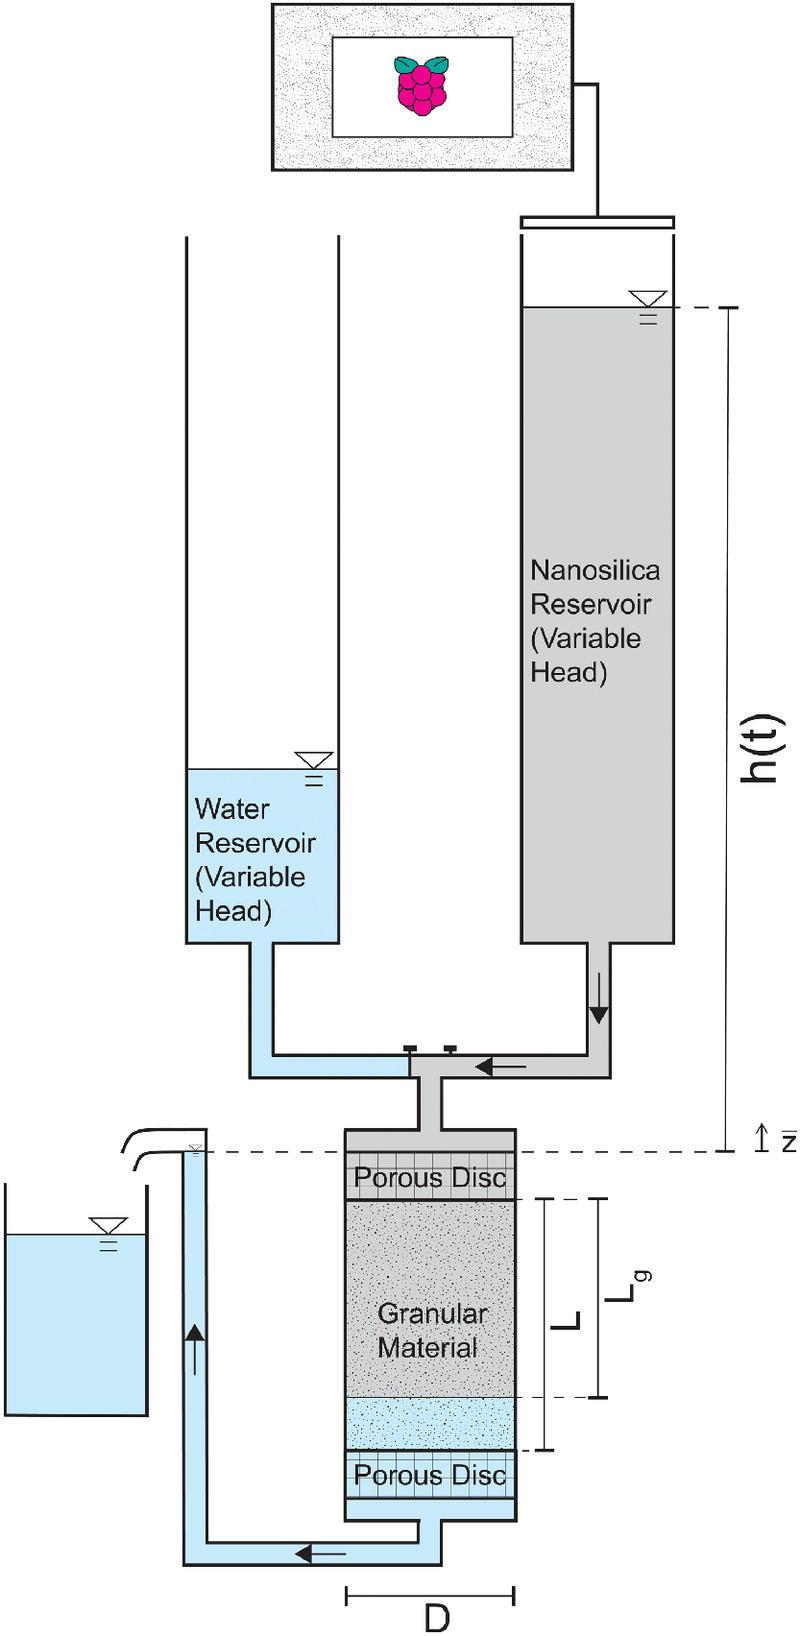
The hydraulic gradient ruling the motion of the fluid was variable during the test, with the overall hydraulic head losses given by the level in the feeding reservoir with respect to the level of the exit hose, both connected with the atmospheric pressure. In order to impose seepage of nanosilica grouting into the saturated soil, the equipment had two feeding tanks, one containing water, the other nanosilica grout (Salvatore et al. 2020).
The sand employed, extracted from a quarry in Fossanova (Italy) and characterized by regularly shaped grains, had the characteristics listed in Table 3. The specimens were prepared by means of dry tamping of five subsequent layers with a falling mass equal to 1 kg dropped from a height equal to 1 m. Two porous stones were placed at the ends of the specimen to provide a homogeneous flux into the material. After its preparation, the specimen was saturated (Phase 0) with water and subsequently with nanosilica grout (Phases 1 and 2). During each phase, the amounts of both seeping fluid and hydraulic head were continuously recorded by measuring the level in the tanks by means of ultrasonic sensors.
| (mm) | (mm) | (–) | (–) | (–) | (–) |
|---|---|---|---|---|---|
| 0.2 | 0.275 | 1.5 | 2.65 | 0.476 | 0.821 |
During the first phase (water seepage, Phase 0), the values of the three specimens employed in the tests performed (Tests 1, 2, and 3) were obtained (Table 4).
| Test | () |
|---|---|
| 1 | |
| 2 | |
| 3 |
During Phase 1 (starting at time 0 and ending at time ), the nanosilica grout started seeping and progressively replaced water in the specimen. The two portions of the specimen occupied by water and grout can be seen as forming a serial system, but the process was progressively more dominated by the Binghamian fluid, also characterized by a higher viscosity. Regarding the interaction between water and nanosilica aqueous suspensions, according to Coskun and Tokdemir (2020), it is reasonable to identify the viscous forces playing a dominant role (imposed initial hydraulic gradients about ) and to assume capillarity effects are negligible (dealing with water and aqueous suspensions, which are highly hydrophilic and characterized by both low viscosity and concentration). To discuss the role of water–NSG miscibility, in Appendix I, the results of a specific laboratory test campaign exploiting the markedly different electric conductance of water and nanosilica suspension and detecting the gradient with time around a static front created between the two fluids are reported. More precisely, these experimental results allow quantification of the diffusive coefficient and therefore calculation of a macroscopic Peclet number Pe, according to what was done by Van Genuchten and Parker (1984) and Guida et al. (2021). For the case considered here, the minimum Pe value () is given bywhere = minimum registered value of seepage velocity within (around ) and characteristic length . These results justify the previously mentioned hypothesis of immiscibility (Van Genuchten and Parker 1984; Guida et al. 2021).
(9)
During Phase 2 (starting at time ), the specimen is fully saturated by nanosilica grout, and seepage is highly dependent on the time evolution of the grout rheology.
In both phases, dealing with low-pressure nanosilica flows in quite poorly graded homogeneous isotropic media, assumptions of (1) a void ratio that is constant with time (Tomiolo 1982), so (2) suffusion does not occur (Zhong et al. 2018), and (3) nanosilica physical and chemical deposition is absent, in contrast to what was experimentally observed by Bouchelaghem et al. (2001) in the case of microfine cement injections, found experimental validation and so were employed in the subsequent seepage model implementation.
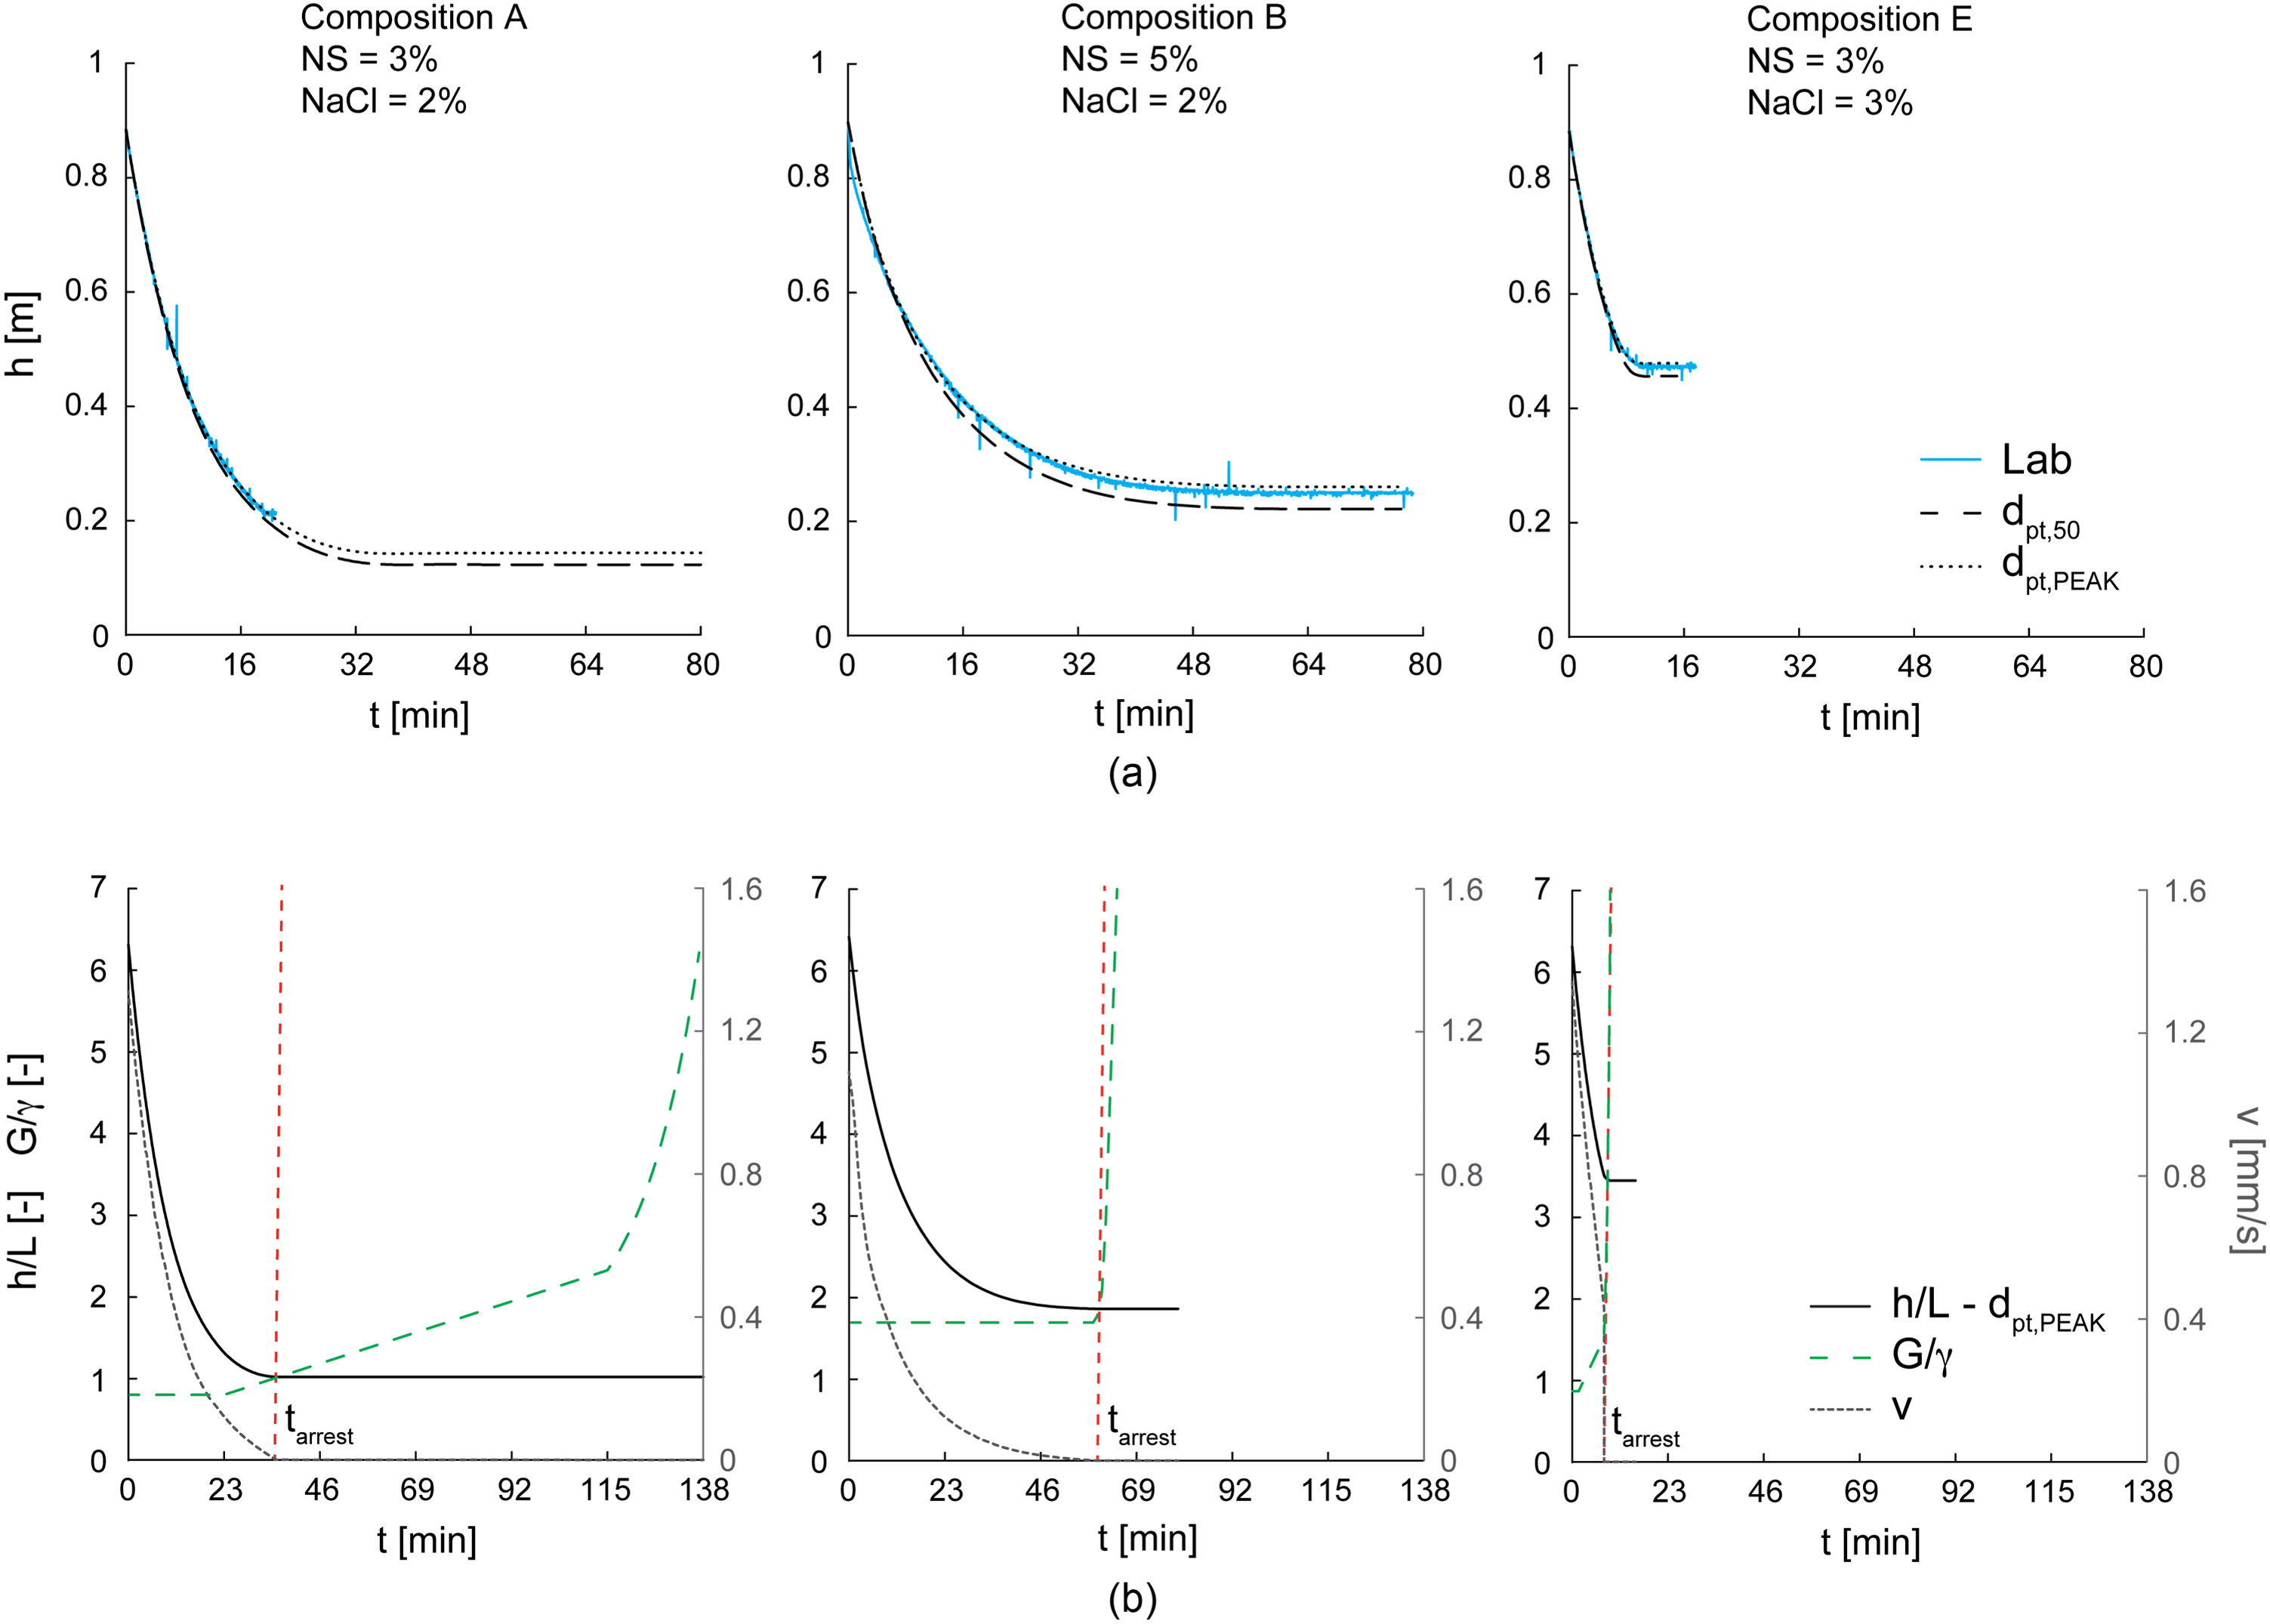
In Fig. 10(a) (solid lines), the evolution with of hydraulic head evaluated at the top of the sand specimen (Fig. 9) is reported for the three different adopted grouts. These experimental curves mainly describe the evolution with of corresponding to Phase 2 because Phase 1 stopped very soon (). As far as Test 1 is concerned, the experimental curve did not reach a plateau, unlike the others, because the test stopped before , and the imposed hydraulic gradients were always higher than the corresponding entry values [Eq. (7)].
Numerical Simulations
The illustrated experimental test results are hereinafter employed to validate the approach proposed in the section “Flows of Binghamian Fluids throughout Porous Media.” To this aim, by using the assumptions discussed in the section “Experimental Tests and Results” and imposing the balance for both grout and water masses, the authors have written the following equations:where the three unknows are (coincident with both overall hydraulic losses and hydraulic head imposed on the grout at the top of the specimen evaluated considering the coordinate in Fig. 9), (representing the distance of the grout front from the upper boundary; Fig. 9), and (representing the hydraulic losses occurring in the subdomain). During Phase 2, the problem simplifies because , , and Eq. 10(a) is sufficient for solving the problem. These governing equations were thus numerically integrated with by employing (1) for any tested grout composition, both the correspondent and functions and , previously calibrated on the rheometric test results (Fig. 5); (2) both the and values of any tested sand specimen; and (3) the initial value of both and its time derivative equal to the experimental values. The input parameters are listed in Tables 4 and 5. As far as is concerned, two columns are present because this parameter may be assumed to be coincident with either (simulation ) or (simulation ). More precisely, being the Fossanova sand in exam characterized by both regularly shaped particles and a low value, equal to the one of the glass beads to which the results reported in Fig. 8 are associated, the authors calculate (1) directly from Fig. 7 and (2) from the relation (derived from Fig. 8).
(10a)
(10b)
(10c)
| Test | NSG composition | (–) | (μm) | (μm) | |
|---|---|---|---|---|---|
| 1 | , , | 10.13 | 0.34 | 18 | 15 |
| 2 | , , | 10.28 | 0.32 | 17 | 14.4 |
| 3 | , , | 10.19 | 0.34 | 18 | 15 |
In Fig. 10(a), the numerical decays of with time related to simulations both (dashed lines) and (dotted lines) are reported, and the agreement with the experimental results turns out to be satisfactory in both cases. However, the perfect agreement between simulation with experimental data seems to suggest that better describes the grout seepage from a microstructural point of view. From the comparison between the two numerical curves with different values, it is worth observing how the dependence on the soil microstructure is significant and that must be accurately evaluated, as well as .
As is clear in Eq. 10(a) and shown in Fig. 10(b) (for simulation ), the final plateau is reached when the hydraulic gradient , decreasing with time due to the experimental conditions imposed, is equal to , which in turn increases with time due to the time dependence of the grout rheology.
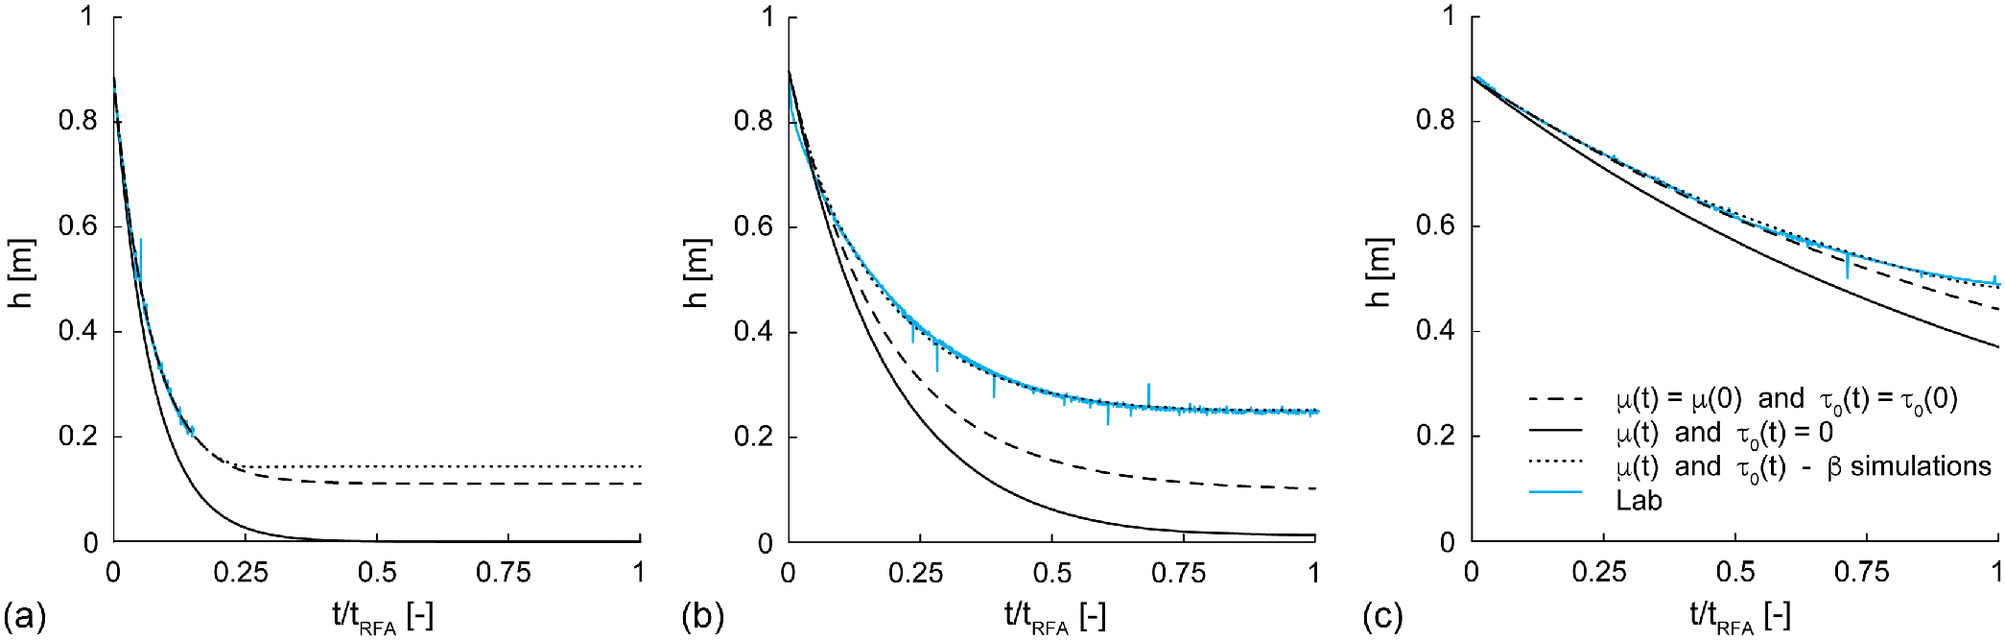
To emphasize the role of grout rheology, in Fig. 11, for each grout composition, laboratory test results were compared with three different numerical simulations (in all cases ): dotted lines refer to the adoption of the rheological relations of Fig. 5, solid lines to Newtonian rheologies () whose dependence on time corresponds to the curves of Fig. 5(a), and dashed lines to time-independent Binghamian rheologies [ and , with and the initial values in Figs. 5(a and b)]. As is evident, the unique rheology capable of satisfactorily reproducing the experimental data corresponding to the three chemical compositions is the Binghamian one, where the evolution with time of both and is considered.
Nanosilica Grouting Treatments in an Infinite Spatial Domain
After discussing the main peculiarities of permeation grouting in situ treatments (Section “In Situ Applications”), the authors define a model (Section “Theoretical Model: Derived Governing Equations”), based on a certain number of simplifying assumptions (Section “Theoretical Model: Simplifying Assumptions”), capable of relating (according to the case) either injection pressure or flow rate to grouted domain radius and injection time. A practical application of the model is finally discussed in the section “Application of the Model.”
In Situ Applications
The injection of nanosilica grouts according to the permeation grouting technique is characterized by three main peculiarities concerning: (1) the saturation conditions of the soil about to be injected, (2) the seepage geometry, and (3) the pressure imposed at the injection source.
1.
Accounting for the objectives of nanosilica grouting treatments reported in the introduction, it is possible to state that NSGs are mainly injected into water-saturated soils.
2.
In practical applications of permeation grouting in soils, the tubes-a-manchette technique (Warner 2004) is commonly employed. A sleeve port pipe is installed in a drilled hole and the injection takes place from several port holes (usually 6 to 9 mm in diameter) drilled at regularly spaced intervals, typically within a range of 0.3 to 0.6 m. Nozzle clogging is prevented by the presence of external rubber sleeves. The injected geometry can be modeled as a series of spheres, injected one after the other, starting from the deeper zone toward the top. Alternatively, though less commonly, if either slightly spaced injection openings are simultaneously employed or pipes microfissured in a significant portion of their length are adopted, the injected geometry is better approximated by using a cylindrical seepage geometry. In both cases, however, during injection, the imposed hydraulic gradients prevail upon gravity, giving rise to a radial seepage geometry (Han 2015; Boschi 2022; Boschi et al. 2023). After injection, in the case where gelling times are significantly higher than injection ones (that is, when the permeation grouting is not correctly designed), gravity may become not negligible and a vertical direction preferential.
3.
The hydraulic gradients induced by the injections in soil determine an effective stress redistribution around the injection source (Boschi 2022). The consequent soil deformation may turn into (1) hydraulic fracturing, also called “claquage,” when yielding under tension is attained and (2) grout cavity expansions when yielding under shear instead takes place, followed by ground surface heaves. To practically prevent these undesired effects on site and so enhance the grout permeation phenomenon, the injection pressure must be limited by either imposing or carefully monitoring it (Han 2015). Park and Oh (2018) have suggested, as a safe threshold for this phenomena, upper bound values of injection pressures given by a linear function of depth multiplied by a constant dimensional coefficient (equal to ). This is in accordance with the limit injection pressure values adopted by Gallagher et al. (2007a) and Packer et al. (2018) for nanosilica permeation grouting treatments.
To obtain satisfactory effectiveness of the treatment and not exceed the mentioned limit values, in situ injection pressures often range between 0.5 and 10 bar. In this range of pressure, Gallagher et al. (2007a) experimentally confirmed the effectiveness of nanosilica grouting treatment and observed the absence of evident gel bond breakages (Gallagher and Mitchell 2002). In any case, for in situ geometrical injection conditions, the values of pressure cited previously are expected in very small soil domains as pressure sharply drops with the distance from the injection source (Boschi 2022; Boschi et al. 2023).
Theoretical Model: Simplifying Assumptions
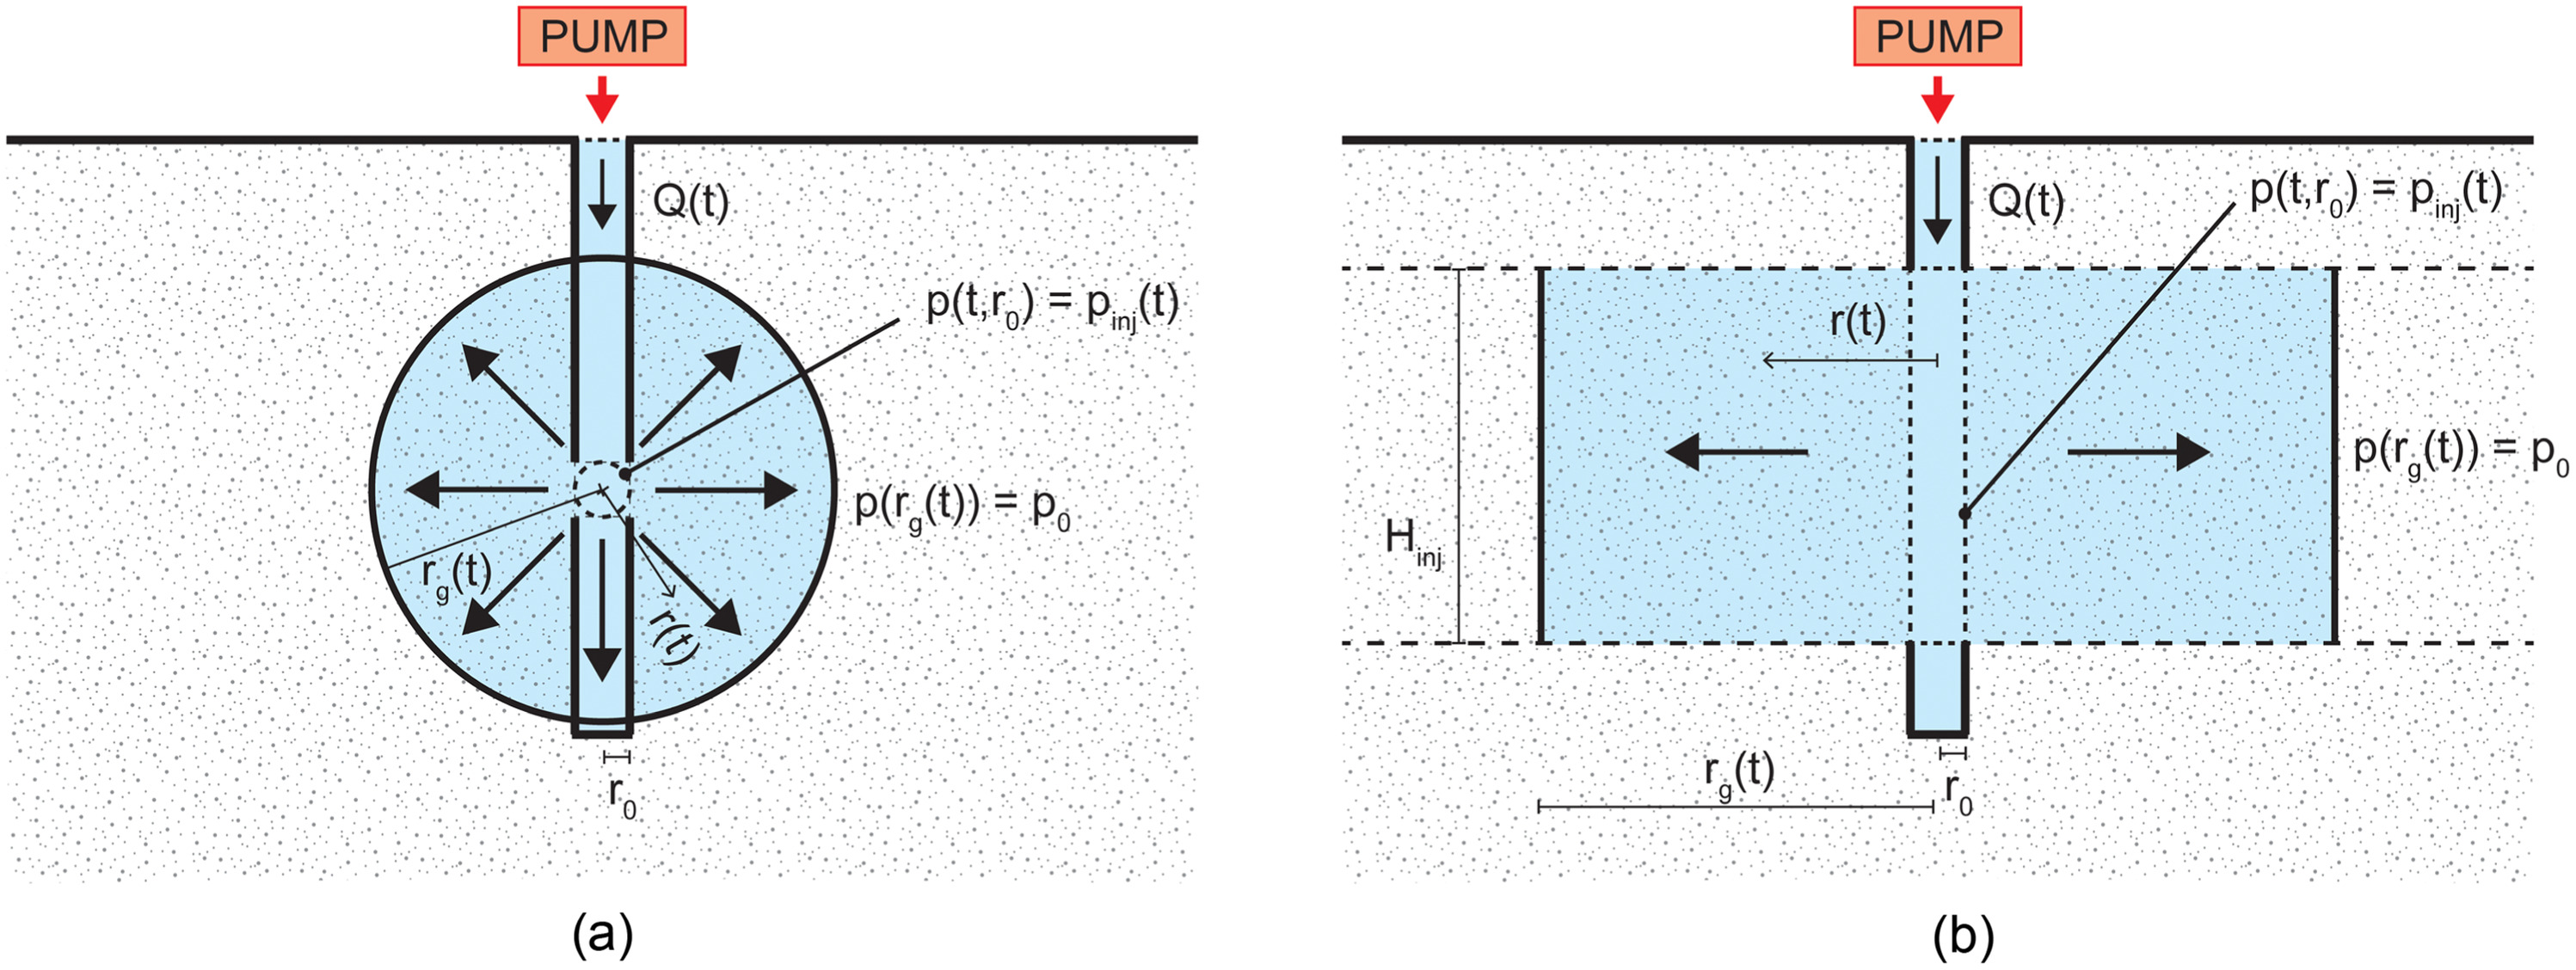
The flow model, described in the section “Flows of Binghamian Fluids throughout Porous Media” and experimentally validated in the section “Validation of Modified Darcy’s Law for Nanosilica Grout Flows,” is adopted hereafter to predict the temporal evolution of the distance covered by the NSG in case either flow rate or injection pressure is imposed. Two different geometries are considered, according to what observed in the section “In Situ Applications”: in one case [Fig. 12(a)], the boundary condition is imposed along a spherical injection source, whereas, in the other one [Fig. 12(b)], along the lateral surface of a cylindrical injection source, generating in this way either spherical or cylindrical seepages in an infinite spatial domain. Although the approach proposed is general (an application to dry soils does not imply significant modifications), hereinafter only treatments in water-saturated soils are considered. To solve this boundary value problem, the authors have thus assumed:
1.
constant and not only in space but also with time (Tomiolo 1982);
2.
the fluids (injected and interstitial ones) are immiscible. In this case, by using Eq. (9), with (corresponding to a typical value for half spacing among drilling holes in practical applications and for the final grouted radius) and (a lower boundary for seepage velocity in the case of (1) low imposed injection flow rates of and (2) measured velocity at a 1-m distance far from the injection source), ;
3.
capillarity effects are negligible;
4.
gravity effects are negligible (Appendix II);
5.
the grout seepage takes place under a laminar regime; and
6.
head losses are concentrated in the injected grout, with the injected fluid more viscous than the interstitial one.
Hypotheses 2, 3 and 4 imply the use of a sharp-front approach (Tomiolo 1982) is acceptable, whereas Boschi (2022) and Boschi et al. (2023) have already demonstrated that Hypotheses 4 and 6 are verified for injection flow rate values commonly employed in permeation grouting treatments.
Theoretical Model: Derived Governing Equations
Owning to the symmetry of the geometries taken into consideration (Fig. 12), one spatial coordinate (radial distance ) is sufficient for describing the solution of the problem. In Fig. 12, is the injection source radius, whereas is the injection source height in the cylindrical case, and indicates the position with time of the grout sharp front.
Under the previously listed hypotheses, both grout phase mass balance and a modified Darcy’s law [Eq. (7)] are imposed in the spatial subdomain assumed to be fully saturated by the nanosilica grout, whose geometry is evolving with time (). Once imposed boundary conditions and spatially integrated, a “constitutive law,” valid for each time instant , is derived between generalized variables and where:is independent of the seepage domain geometry, whereas:with Eq. (13a) valid for spherical and Eq. (13b) for cylindrical seepages. The function stands for the area of a sphere of radius in the first case and for the lateral area of a -high cylinder of radius in the second one.
(11)
(12)
(13a)
(13b)
The internal variable in Eq. (11) can be directly derived from grout phase mass balance
(14)
This relation can be easily integrated analytically if is the control variable (because in this case is known). For instance, when is imposed to be constant and equal to where if the seepage domain is spherical and 2 if cylindrical.
(15)
Application of the Model
The numerical results illustrated here in the following concern four distinct cases: (1) spherical seepage geometry under constant , (2) spherical seepage geometry under constant , (3) cylindrical seepage geometry under constant , and (4) cylindrical seepage geometry under constant . In all cases, is made equal to 50.5 mm, is nil, and the constitutive parameters already listed in Table 2 are adopted. In the cylindrical injection source case, .
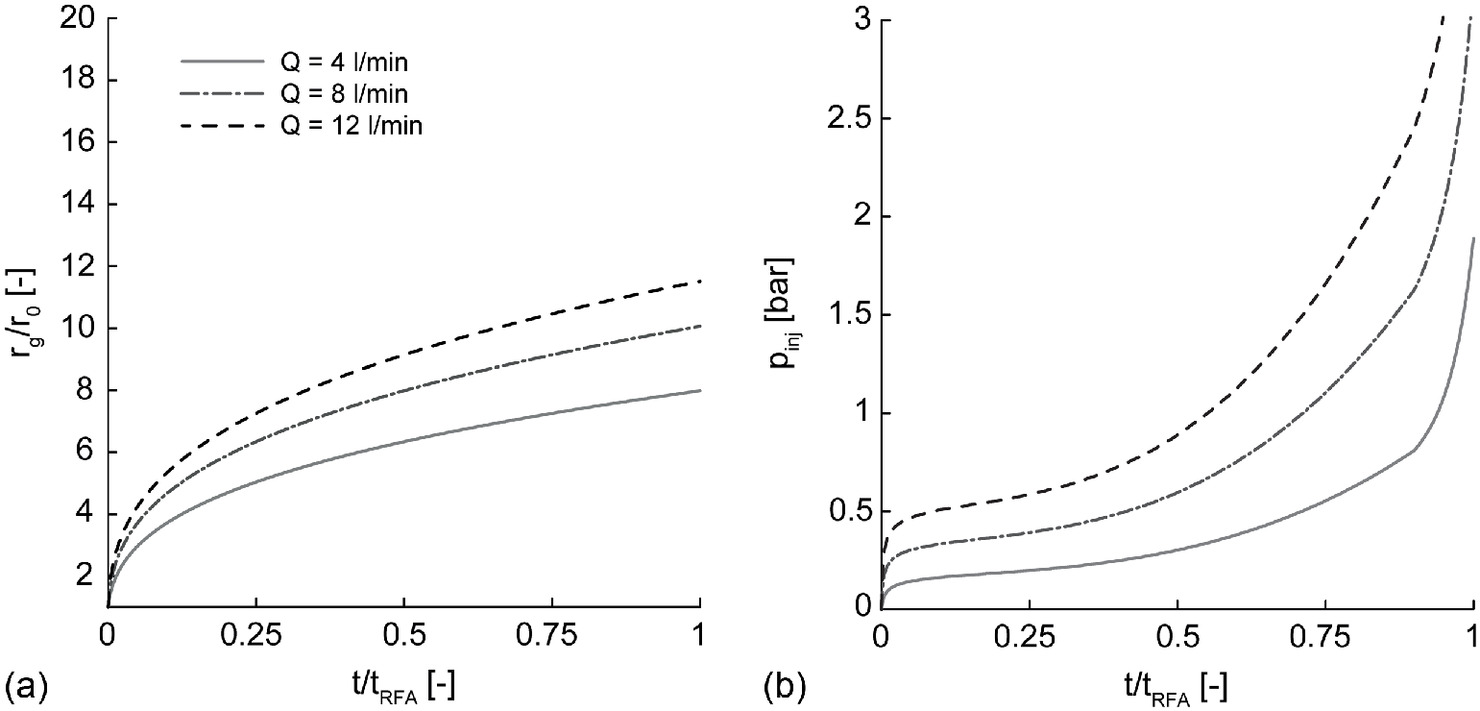
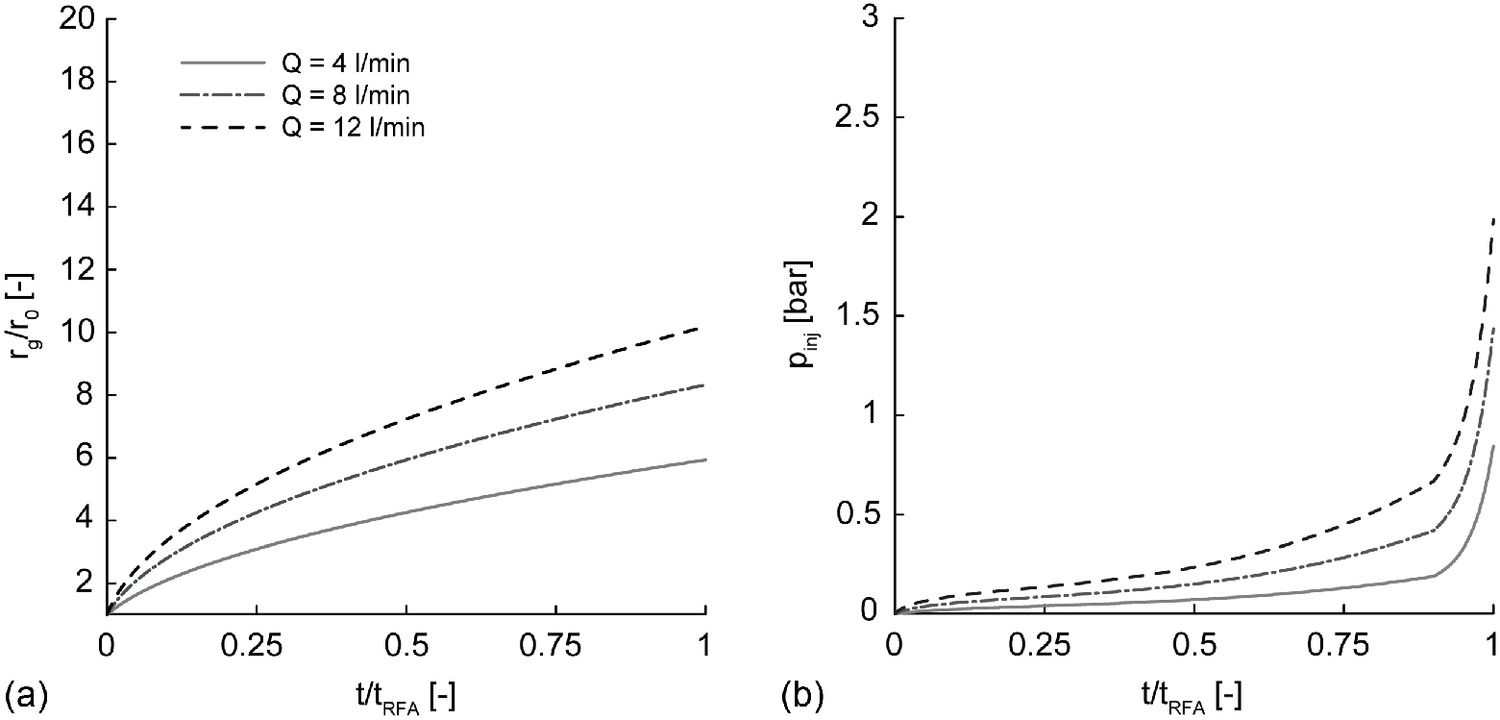
The curves in Fig. 13 (Case 1) are obtained by imposing , and , common values in permeation grouting applications. The higher is, the higher the radius reached by the grout front at a fixed time [Fig. 13(a)]. To guarantee a fixed while is increasing, increases with time too [Fig. 13(b)], and its increase is also enhanced by the time-dependent grout rheology. In practical applications, these temporal evolutions can be used as design tools. For instance, once imposed, the maximum value to be accepted, , and injection time become a function of the value imposed.
In Fig. 14, the temporal evolutions of both [Fig. 14(a)] and [Fig. 14(b)] in Case 2 are shown. The imposed are equal to 0.5, 0.75, and 1 bar. These low values of are justified by the high value of employed: to maintain these imposed values, ranges between 12 and , which are quite large flow rate values.
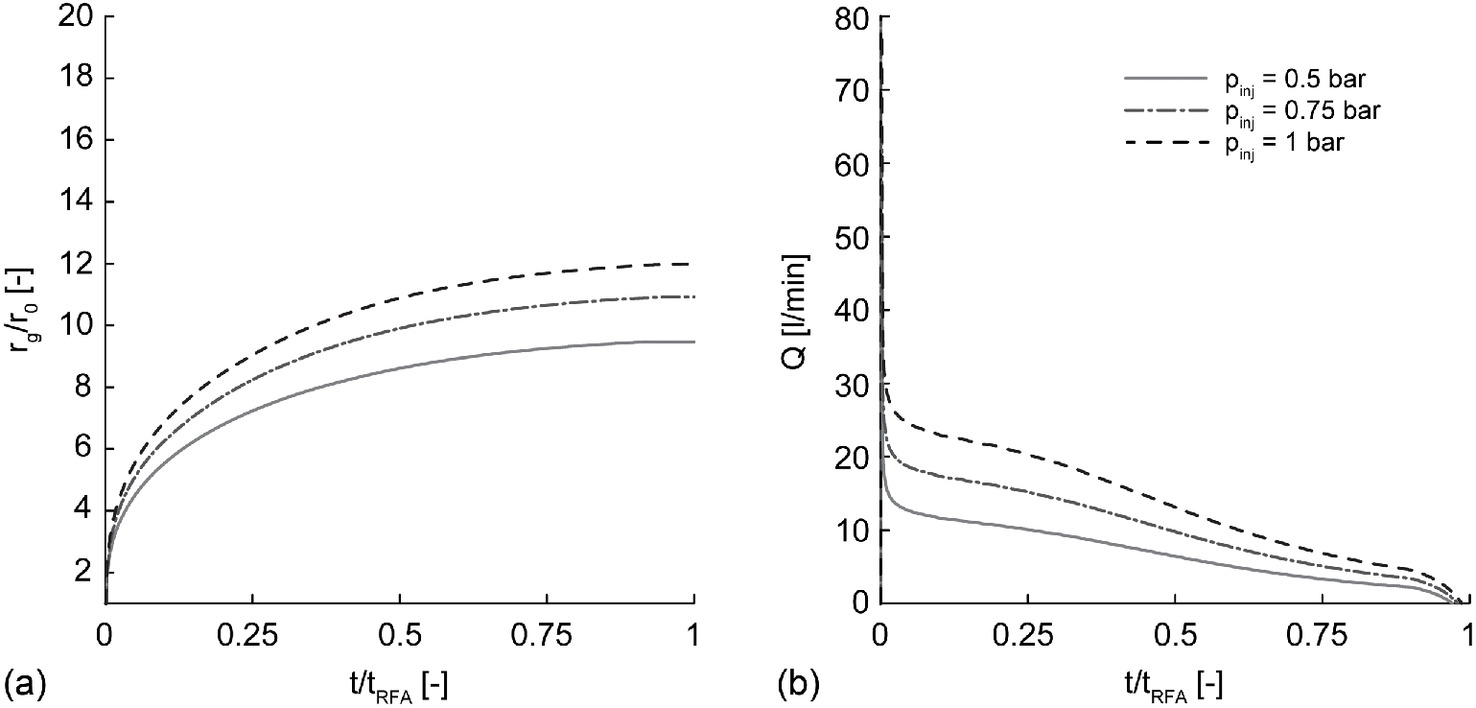
In these cases, in contrast with what observed in Case 1, both and are influenced by the grout time-dependent rheology. In practical applications, these curves allow the optimization of the procedure: the injection can be stopped at time when 90% of the maximum is reached.
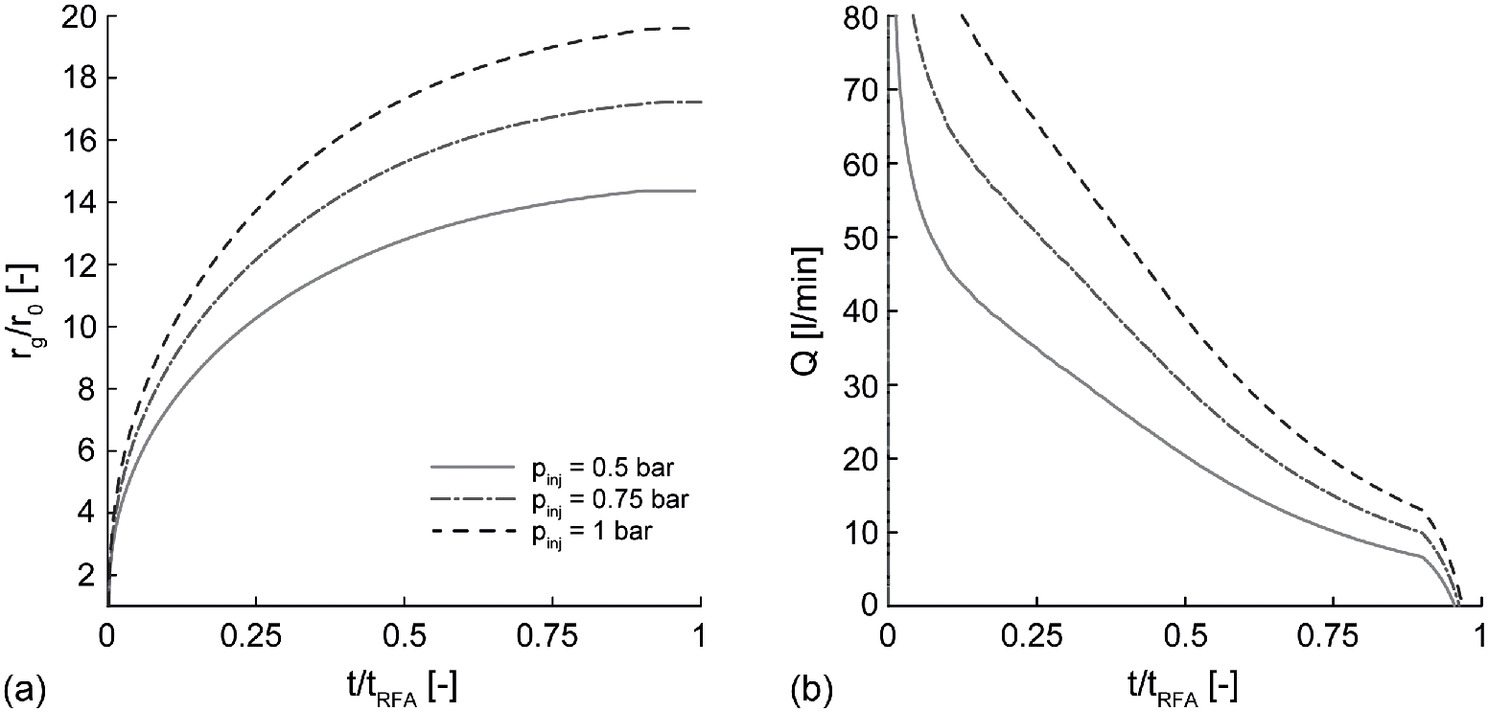
Figs. 15 and 16 correspond to Figs. 13 and 14 but refer to a cylindrical seepage domain (Cases 3 and 4). Considering equal imposed and (Figs. 13 and 15), a cylindrical seepage geometry guarantees an increase in with time less pronounced with respect to the spherical seepage geometry. Considering equal imposed and (Figs. 14 and 16), analogously, higher values at a fixed time are achieved.
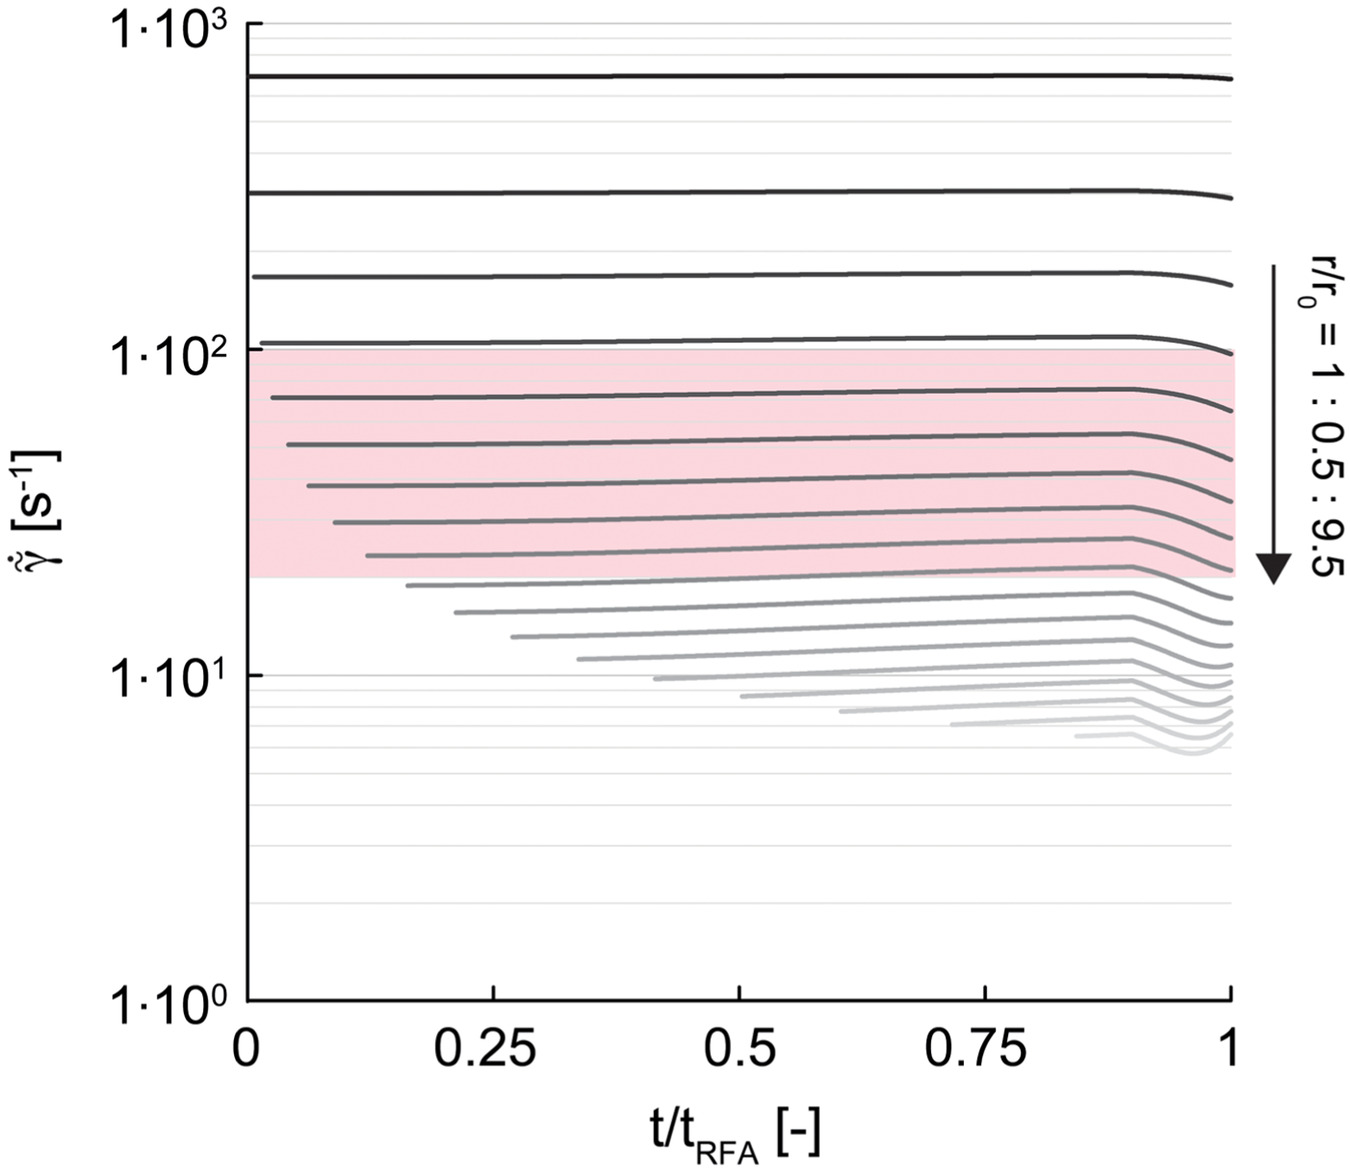
The numerical results illustrated in Figs. 13–16 are obtained by assuming the grout flow is laminar (Hypothesis 5) and considering the grout rheological description provided (Section “Rheology of Nosilica Grouts”) for the range . These aspects are herein further justified by using a down-scaling approach, that is, by passing from local seepage velocity and hydraulic gradient (obtained by imposing grout phase mass balance and modified Darcy’s law) to both mean fluid velocity and mean expected at the pore scale.
By assuming soil voids as circular pipes of uniform diameter equal to the characteristic dimension directed parallel to the radial coordinate and so by adopting the momentum flux distribution for Binghamian flows through circular pipeswhere is the plug flow region radius (Buckingham 1921). The temporal evolution of for different values is illustrated in Fig. 17 for an injection under spherical seepage conditions with an imposed of (the constitutive parameters employed are listed in Table 2). As is evident, for and for any , the values either belong to or are close to the range experimentally investigated and modeled in the section “Rheology of Nanosilica Grouts.”
(16)
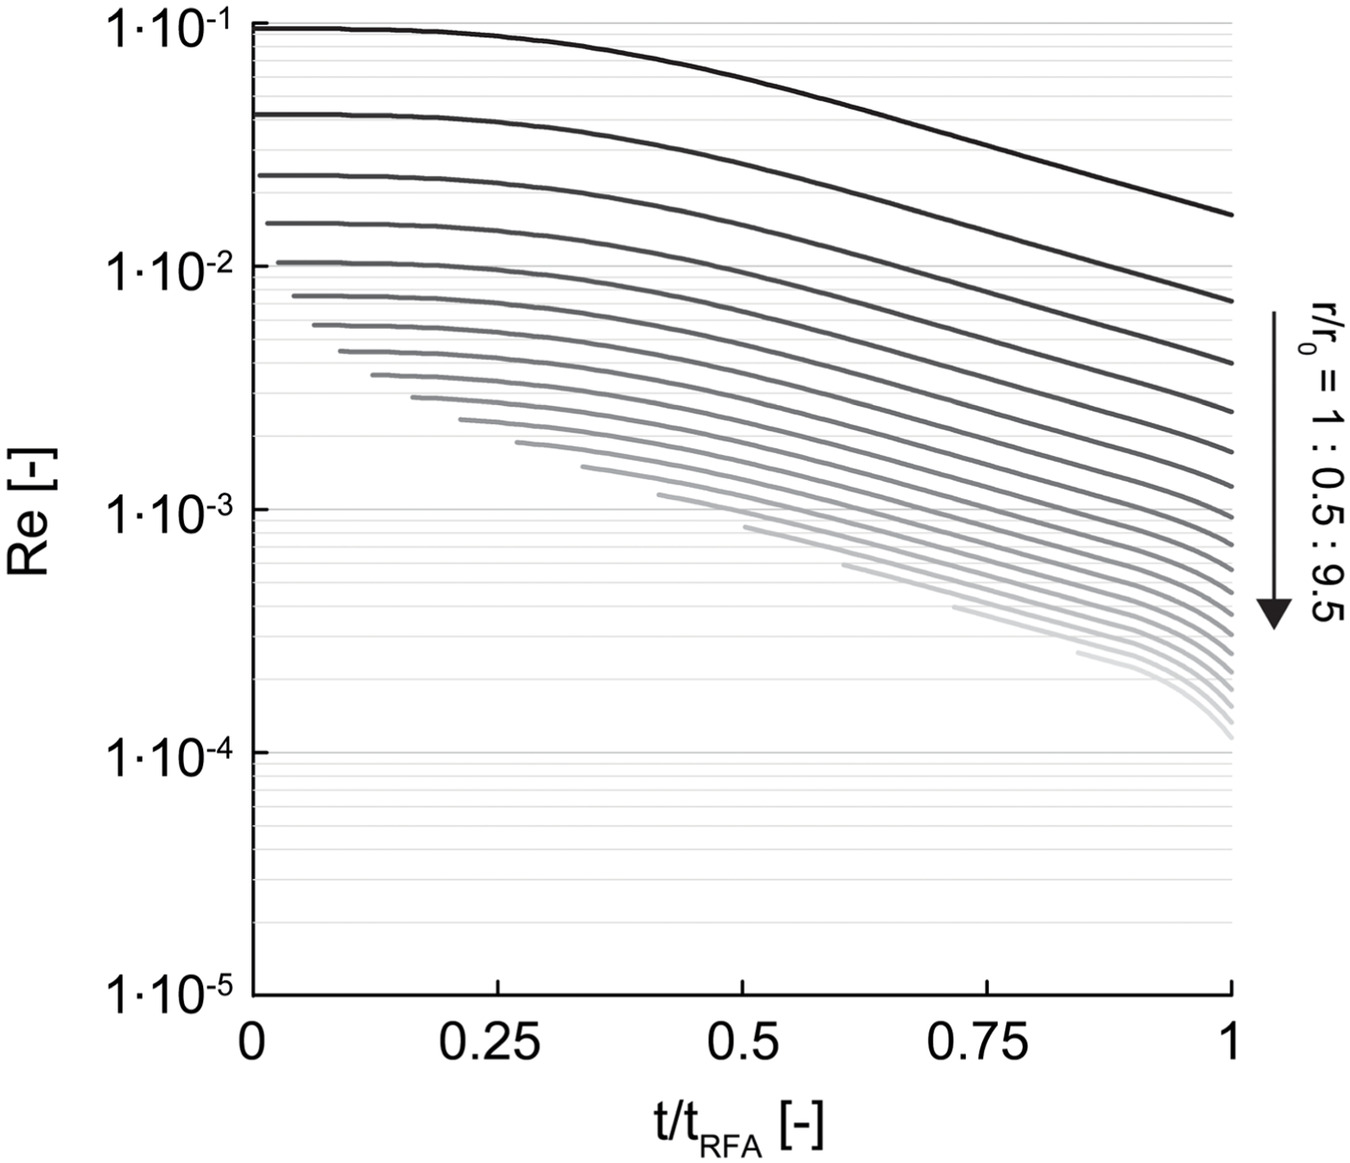
For the same case, to assess the flow regime at the pore scale, the temporal evolution of the Reynolds number Re, as proposed by Madlener et al. (2009), at various distances from the injection source has also been calculatedwhere = the fluid density; (known as the Dupuit–Forchheimer assumption); and . As is evident in Fig. 18, Re values are quite small, and the assumption of laminar flow seems to be acceptable for any and .
(17)
Conclusions
The paper presents an analytical model conceived to simulate the permeation grouting process of nanosilica suspensions throughout water-saturated sands, the most common condition in practical applications.
The suspension rheological response was described by using a Binghamian model, whereas the correspondent constitutive parameters were calibrated on rheometric experimental test results. Their time dependence was derived for different nanosilica grouts differing for chemical composition, observing that viscosity and yield stress are strongly affected by the proportions of both nanosilica and activator salt.
The grout seepage was modeled with a modified Darcy’s law, that is assuming the flow is laminar and the fluid incompressible. The modified Darcy’s law, accounting for the Binghamian rheology of the fluid, is severely affected not only by the time evolutions of the fluid constitutive parameters but also by the microstructure of the permeated granular medium. Intrinsic permeability can represent soil response only partially because the entry value for the gradient, under which seepage does not activate, is a function of a characteristic dimension of the pore matrix. This latter has been identified as a reference value for the pore throat diameter distribution: either the mean pore throat diameter or the pore throat diameter corresponding to the highest peak in the frequency distribution.
Both the rheological nanosilica grout rule and the modified Darcy’s law were successfully validated by using the results of a set of laboratory experiments where grouts of different compositions were seeped through a cylindrical specimen of uniform sand consisting of regularly shaped particles.
Once validated, the two ingredients were employed to derive a predictive model either to rationally optimize and design the injection process in terms of nozzle spacing, injection time, grout compositions, and pump pressure or to interpret the experimental results obtained from trial in situ tests, always recommended before grouting.
To this aim, the model was applied to the typical in-field conditions, that is constant pressure or flow rate injections, imposed according to a spherical or cylindrical geometry. In all cases, the evolution with time of the grouted zone was modeled assuming a sharp-front advancement due to convection in an infinite spatial domain. General solving equations, meant to provide the permeated domain extension without overcoming values of injection pressure, above which phenomena like cavity expansion and claquage are expected, were provided. Obviously, the application of this predictive model to solve in situ boundary value problems, indeed a next step of the ongoing research, should consider the natural variability of the subsoil, which could force seepage through potential heterogeneities and preferential directions due to the anisotropy of the subsoil layers. If the in situ conditions are severely heterogenous and anisotropic, the previously conceived approach must be implemented in a numerical code and the solution obtained incrementally.
Finally, it is worth highlighting that the approach proposed herein and validated for nanosilica grout seepage in soils can actually be generalized to a larger class of fluids whose rheology can be described according to Bingham’s law, as long as its rheology is accurately provided and both adhesion and deposition play a secondary role, as herein verified in the case of permeation grouting with nanosilica grouts.
Notation
The following symbols are used in this paper:
- cylindrical or spherical area;
- nondimensional fitting parameter to derive ;
- nondimensional fitting parameter to derive ;
- constant depending on porous geometry distribution in Kozeny and Carman correlation;
- homogeneity coefficient;
- laboratory specimen diameter;
- diffusive coefficient;
- diameter such that in weight of soil particles is characterized by diameters smaller than ;
- representative measure of pore throats;
- pore throat equivalent diameter;
- maximum pore throat diameter;
- pore throat diameter corresponding to higher peak in frequency distribution;
- mean pore throat diameter;
- minimum void ratio;
- maximum void ratio;
- minimum pressure gradient;
- specific gravity;
- electrical conductance;
- relative electrical conductance;
- injection source thickness;
- hydraulic head difference between specimen extremities;
- hydraulic head losses occurring in subdomain;
- hydraulic gradient modulus;
- hydraulic gradient vector;
- intrinsic permeability;
- laboratory specimen height;
- distance of grout front from upper boundary;
- pipe length (in straight capillaric model application);
- characteristic length for Peclet number evaluation;
- number of capillaries per unit area of cross-section;
- nondimensional parameter to obtain Re for Binghamian fluids;
- prescribed nanosilica percentage;
- prescribed sodium chloride percentage;
- porosity;
- macroscopic Peclet number;
- minimum macroscopic Peclet number;
- nondimensional fitting parameter to derive ;
- injection pressure;
- interstitial fluid pressure;
- overall flow rate;
- overall flow rate imposed to be constant;
- pipe radius;
- Reynolds number;
- radial spatial coordinate;
- grout sharp-front radius;
- plug flow region radius;
- injection source radius;
- surface exposed to fluid per unit volume of solid material;
- temperature;
- time instant;
- arrest time from which seepage velocity nullifies in lab tests;
- gelling time;
- injection time;
- time of flow arrest throughout soil pores due to increasing rheological property values;
- time of starting reaction;
- seepage velocity vector;
- nondimensional seepage velocity vector;
- seepage velocity modulus;
- nondimensional seepage velocity modulus;
- distance from initial position of front among grout and water;
- vertical upward coordinate;
- grout-front distance from injection source derived by disregarding gravity effects;
- grout-front distance from injection source by considering gravity directed favorable to injection;
- grout-front distance from injection source by considering gravity directed disadvantageous to injection;
- simulations by employing ;
- simulations by employing ;
- grout unit volume weight;
- water unit volume weight;
- shear strain rate;
- average shear strain rate at pore scale;
- pressure drop;
- time interval;
- diameter of parallel capillary pipes (in straight capillaric model application);
- seepage nondimensional parameter;
- reducing factor to derive from soil fine fraction diameters;
- grout dynamic viscosity;
- water dynamic viscosity;
- grout density;
- shear stress;
- grout yield stress; and
- shear stress at the pipe wall.
Appendix I. NSG-Water Miscibility Tests
Miscibility of the injected nanosilica suspension with pore water would induce a reduction of nanosilica concentration and might thus affect seepage and gelling rates, undermining the final properties of the grouted material. Therefore, the phenomenon of diffusion was experimentally studied by means of the apparatus shown in Fig. 19(a). It consisted of a 60-cc plastic syringe with a diameter of 29 mm initially containing 30 cc of water and subsequently filled with a further 30 cc of nanosilica suspension, previously admixed with a red dye, injected from the bottom with a rising rate of about . Tap water was used to replicate the salt concentration of in situ conditions, whereas the highest available concentration of silica ( by weight, corresponding to the concentration of the undiluted commercial product employed) was adopted to maximize the miscibility. At prescribed time intervals, fluid specimens with a volume of 10 cc were each progressively sucked up from top to bottom, measuring their electrical conductance . The gradient of near the front was assumed as an indicator of miscibility between the two fluids. Considering the initial values of , equal to for the nanosilica suspension () and for the tap water (), gradients were reconstructed at time intervals equal to 30 min, 3 and 6 h.
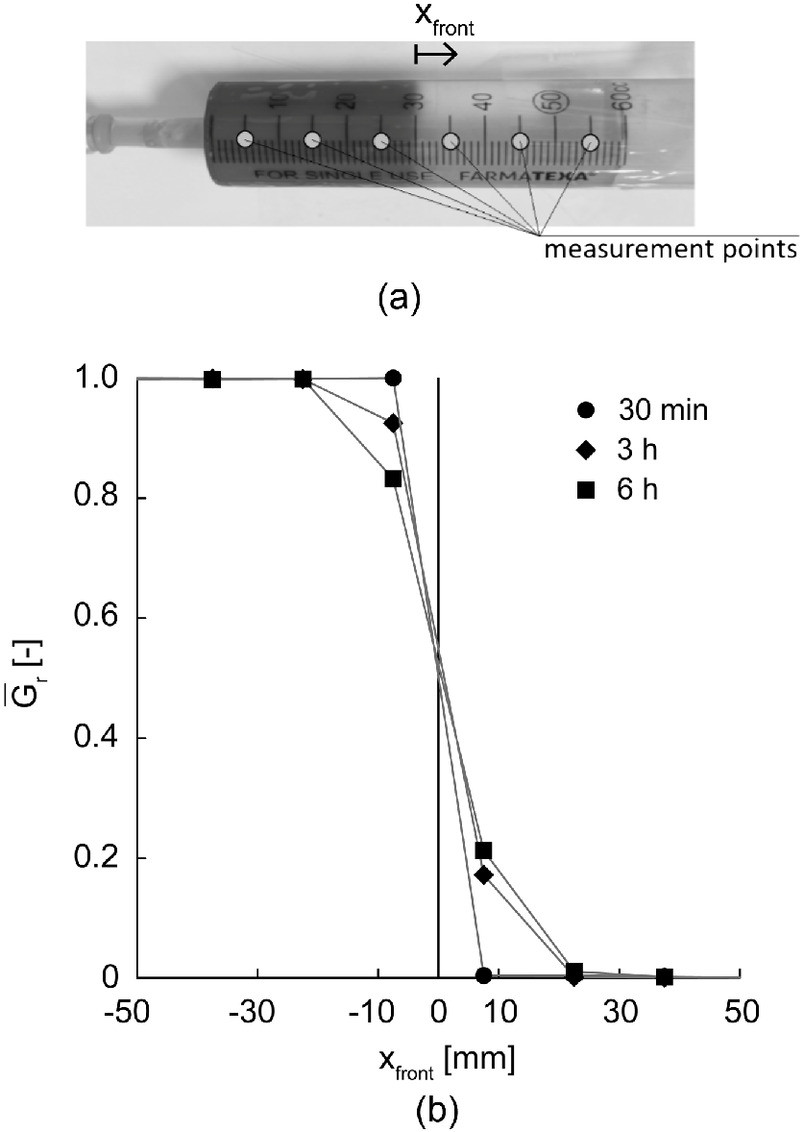
In Fig. 19(b), relative values , obtained scaling the measured values with respect to the extreme values versus the distance from the center of the sucked volumes, are reported
(18)
The isochrones were quite symmetrical across the initial front position, and a limited influence of gravity was observed. Given that in this experiment, nanosilica transport was uniquely caused by diffusion, the experimental results can be interpreted with Fick’s equation. The nanosilica transport in water turned out to be characterized by a diffusive coefficient equal to .
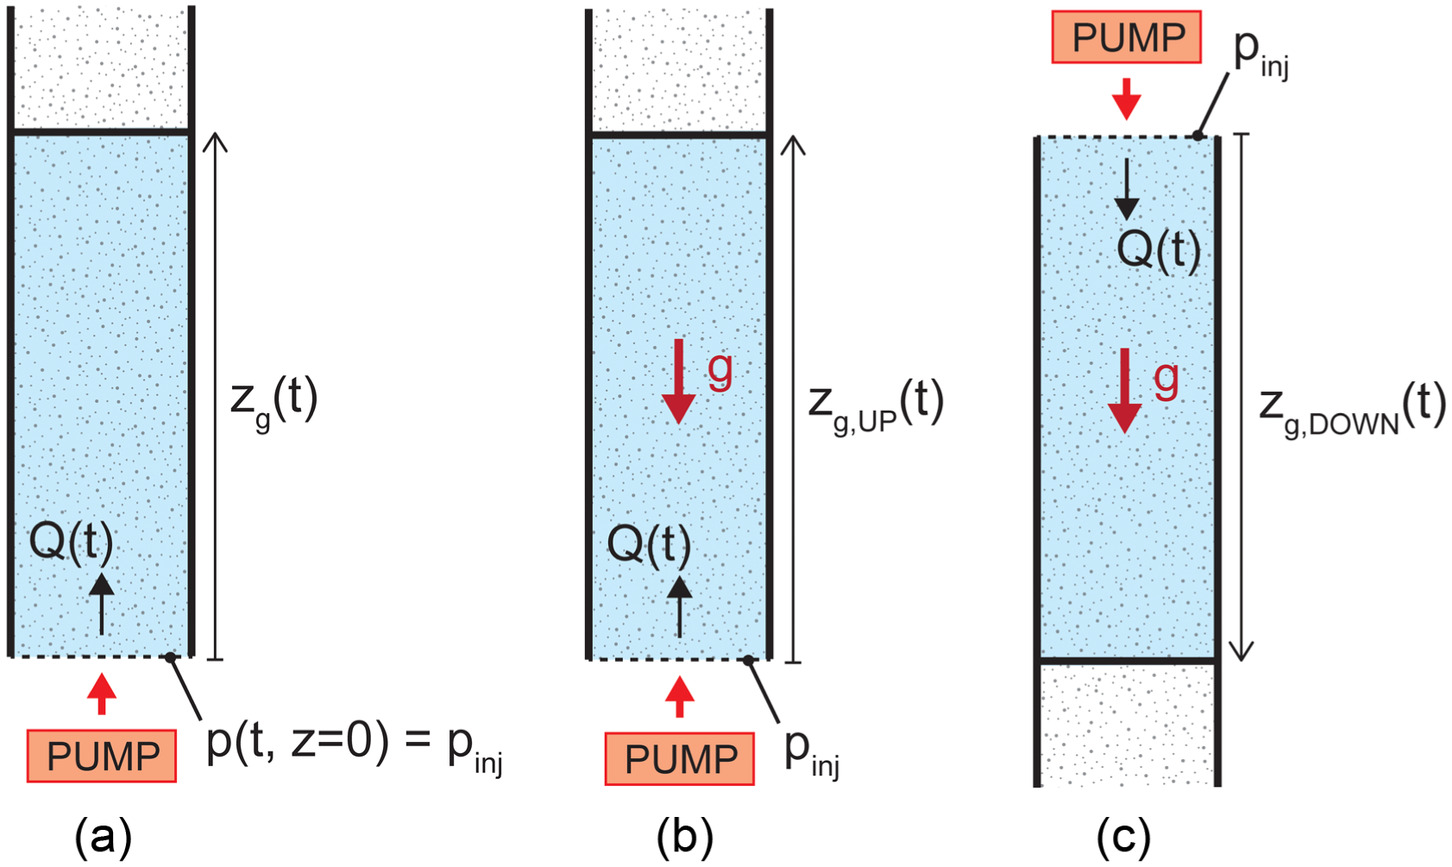
Appendix II. Effect of Gravity in Column Injections
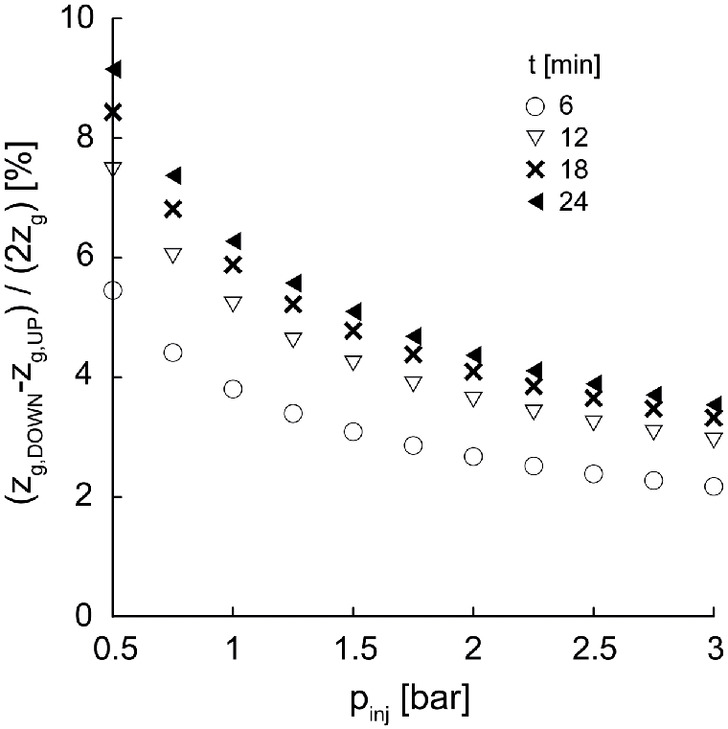
To quantify the error derived from the hypotheses of neglecting gravity (Section “Nanosilica Grouting Treatments in an Infinite Spatial Domain”), the one-dimensional column injection case (Fig. 20) is discussed here. In this case, when the gravity term is neglected [Fig. 20(a)], Eq. (19) is obtained, whereas when gravity is taken into account, Eqs. (20) and (21) are obtained in the case where the injection is directed downward or upward [Figs. 20(b and c)], respectivelywhere = spatial coordinate, starting from the injection source directed as the flow; = imposed constant value of injection pressure; , , and detect the grout sharp-front advancements in a dry porous medium of intrinsic permeability by disregarding gravity, considering gravity directed favorable and disadvantageous to injection, respectively. Then, in Fig. 21, considering the constitutive parameters listed in Table 2, the error committed in disregarding gravity in the grout sharp-front advancement prediction, expressed in terms of , is shown as a function of the imposed . Gravity turns out not to play a primary role when dealing with ranges commonly employed in permeation grouting applications, even if, in principle, the vertical column case is expected to be the case where gravity highly influences the solution.
(19)
(20)
(21)
Data Availability Statement
Data, models, or code that support the findings of this study are available from the corresponding author upon reasonable request.
Acknowledgments
The research leading to these results has been funded by MBS Master Builders Solutions Italia S.p.A. within a research program aimed at both investigating and modeling the coupled hydromechanical processes governing grout injections. This research has also received funding from Project “Ecosistema dell’innovazione—Rome Technopole” financed by the EU in the NextGenerationEU plan through MUR Decree n. 1051 23.06.2022—CUP H33C22000420001. The authors would also like to thank Alberto Verdoja and Massimo Berta of BASF Italia S.p.A. for their invaluable help in performing the rheometric tests.
References
Agapoulaki, G. I., and A. G. Papadimitriou. 2018. “Rheological properties of colloidal silica grout for passive stabilization against liquefaction.” J. Mater. Civ. Eng. 30 (10): 04018251. https://doi.org/10.1061/(ASCE)MT.1943-5533.0002377.
Bader, T. A. 1981. “Injection and distribution of silicate grout in sand.” Ph.D. thesis, Field of Civil Engineering, North-western Univ.
Bergna, H. E., and W. O. Roberts. 2005. Colloidal silica: Fundamentals and applications. Boca Raton, FL: CRC Press.
Bolisetti, T., S. Reitsma, and R. Balachandar. 2009. “Experimental investigations of colloidal silica grouting in porous media.” J. Geotech. Geoenviron. Eng. 135 (5): 697–700. https://doi.org/10.1061/(ASCE)GT.1943-5606.0000007.
Boschi, K. 2022. “Permeation grouting in granular materials. From micro to macro, from experimental to numerical and vice versa.” Ph.D. thesis, Dept. of Civil and Environmental Engineering, Politecnico di Milano.
Boschi, K., M. O. Ciantia, and C. G. di Prisco. 2022. “Pressure grouting of microfine cements in soils: Micromechanical processes.” In Proc., 20th Int. Conf. on Soil Mechanics and Geotechnical Engineering, 621–626. Sydney, NSW, Australia: Australian Geomechanics Society.
Boschi, K., C. G. di Prisco, and M. O. Ciantia. 2020. “Micromechanical investigation of grouting in soils.” Int. J. Solids Struct. 187 (Mar): 121–132. https://doi.org/10.1016/j.ijsolstr.2019.06.013.
Boschi, K., D. Grassi, R. Castellanza, and C. G. di Prisco. 2023. “Permeation grouting in soils: Numerical discussion of a simplified analytical approach.” In Proc., Institution of Civil Engineers-Ground Improvement, 1–9. New Delhi, India: Institution of Civil Engineers. https://doi.org/10.1680/jgrim.22.00019.
Bouchelaghem, F., L. Vulliet, D. Leroy, L. Laloui, and F. Descoeudres. 2001. “Real-scale miscible grout injection experiment and performance of advection–dispersion–filtration model.” Int. J. Numer. Anal. Methods Geomech. 25 (12): 1149–1173. https://doi.org/10.1002/nag.171.
Brinker, C. J., and G. W. Scherer. 2013. Sol-gel science: The physics and chemistry of sol-gel processing. Cambridge, MA: Academic Press.
Buckingham, E. 1921. “On plastic flow through capillary tubes.” In Proc., Am. Soc. Testing Materials, 1154–1156. Tokyo: CiNii Research.
Carman, P. C. 1937. “Fluid flow through granular beds.” Trans. Inst. Chem. Eng. London 15: 150–156.
Celik, F. 2019. “The observation of permeation grouting method as soil improvement technique with different grout flow models.” Geomech. Eng. 17 (4): 367–374. https://doi.org/10.12989/gae.2019.17.4.367.
Chapuis, R. P. 2012. “Predicting the saturated hydraulic conductivity of soils: A review.” Bull. Eng. Geol. Environ. 71 (3): 401–434. https://doi.org/10.1007/s10064-012-0418-7.
Christopher, B. R., D. K. Atmatzidis, and R. J. Krizek. 1989. “Laboratory testing of chemically grouted sand.” Geotech. Test. J. 12 (2): 109–118. https://doi.org/10.1520/GTJ10685J.
Coskun, S. B., and T. Tokdemir. 2020. “Modelling of permeation grouting through soils.” J. Appl. Eng. Sci. 10 (1): 11–16. https://doi.org/10.2478/jaes-2020-0003.
Cui, Y., Z. Tan, and C. An. 2022. “Research and application of multi-functional acrylic resin grouting material.” Constr. Build. Mater. 359 (Dec): 129381. https://doi.org/10.1016/j.conbuildmat.2022.129381.
Gallagher, P. M. 2000. “Passive site remediation for mitigation of liquefaction risk.” Ph.D. thesis, Dept. of Civil Engineering, Virginia Polytechnic Institute and State Univ.
Gallagher, P. M., C. T. Conlee, and K. M. Rollins. 2007a. “Full-scale field testing of colloidal silica grouting for mitigation of liquefaction risk.” J. Geotech. Geoenviron. Eng. 133 (2): 186–196. https://doi.org/10.1061/(ASCE)1090-0241(2007)133:2(186).
Gallagher, P. M., and S. Finsterle. 2004. “Physical and numerical model of colloidal silica injection for passive site stabilization.” Vadose Zone J. 3 (3): 917–925. https://doi.org/10.2136/vzj2004.0917.
Gallagher, P. M., and J. K. Mitchell. 2002. “Influence of colloidal silica grout on liquefaction potential and cyclic undrained behavior of loose sand.” Soil Dyn. Earthquake Eng. 22 (9–12): 1017–1026. https://doi.org/10.1016/S0267-7261(02)00126-4.
Gallagher, P. M., A. Pamuk, and T. Abdoun. 2007b. “Stabilization of liquefiable soils using colloidal silica grout.” J. Mater. Civ. Eng. 19 (1): 33–40. https://doi.org/10.1061/(ASCE)0899-1561(2007)19:1(33).
Gueven, I., S. Frijters, J. Harting, S. Luding, and H. Steeb. 2017. “Hydraulic properties of porous sintered glass bead systems.” Granular Matter 19 (2): 28. https://doi.org/10.1007/s10035-017-0705-x.
Guida, G., G. Musso, G. Sanetti, C. di Prisco, and G. Della Vecchia. 2021. “A procedure to estimate cutoff wall transport properties from monitoring wells.” Int. J. Numer. Anal. Methods Geomech. 45 (9): 1282–1299. https://doi.org/10.1002/nag.3201.
Håkansson, U., L. Hässler, and H. Stille. 1992. “Rheological properties of microfine cement grouts.” Tunnelling Underground Space Technol. 7 (4): 453–458. https://doi.org/10.1016/0886-7798(92)90076-T.
Han, J. 2015. Principles and practice of ground improvement. New York: Wiley.
Hench, L. L. 1998. Sol-gel silica: Properties, processing and technology transfer. Westwood, NJ: Noyes Publications.
Honma, S. 1984. “Finite element analysis of the injection and distribution of chemical grout in soils.” Ph.D. thesis, Dept. of Civil and Environmental Engineering, The Univ. of Wisconsin-Milwaukee.
Iler, K. R. 1979. The chemistry of silica. Solubility, polymerization, colloid and surface properties and biochemistry of silica. New York: Wiley.
Karol, R. H. 2003. Vol. 12 of Chemical grouting and soil stabilization, revised and expanded. Boca Raton, FL: CRC Press.
Kutilek, M. 1969. Trans. 1969 Haifa symposium on fundamentals of transport phenomena in porous media. Ed. IAHR. Amsterdam, Netherlands: Elsevier.
Liao, H. J., C. C. Huang, and B. S. Chao. 2003. “Liquefaction resistance of a colloid silica grouted sand.” In Grouting and ground treatment, 1305–1313. Reston, VA: ASCE.
Lin, Y., and P. M. Gallagher. 2006. “Three-meter column testing of colloidal silica transport through porous media.” In Ground modification and seismic mitigation, 417–424. Reston, VA: ASCE.
Liu, F., G. C. Jiang, K. Wang, and J. X. Wang. 2018. “Laponite nanoparticle as a high performance rheological modifier in water-based drilling fluids.” In Vol. 917 of Materials science forum, 134–139. Aedermannsdorf, Switzerland: Trans Tech Publications.
Luckham, P. F., and S. Rossi. 1999. “The colloidal and rheological properties of bentonite suspensions.” Adv. Colloid Interface Sci. 82 (1–3): 43–92. https://doi.org/10.1016/S0001-8686(99)00005-6.
Madlener, K., B. Frey, and H. K. Ciezki. 2009. “Generalized Reynolds number for non-Newtonian fluids.” Prog. Propul. Phys. 1 (Sep): 237–250. https://doi.org/10.1051/eucass/200901237.
Maher, M. H., K. S. Ro, and J. P. Welsh. 1994. “Cyclic undrained behavior and liquefaction potential of sand treated with chemical grouts and microfine cement (MC-500).” Geotech. Test. J. 17 (2): 159–170. https://doi.org/10.1520/GTJ10088J.
Manassero, V., and G. Di Salvo. 2012. “Two difficult tunnelling problems solved by using permeation grouting: The excavation of submerged large size tunnels for Roma and Napoli metro projects.” In Grouting and deep mixing 2012, 1972–1984. Reston, VA: ASCE.
MBS Italia. 2021. “Technical datasheet of MasterRoc MP 325.” Accessed May 29, 2023. https://assets.master-builders-solutions.com/it-it/tds-masterroc-mp325-it.pdf.
Meikle, T., R. Hawker, C. Grubb, S. Tadolini, and P. Mills. 2018. “Development, trials and testing of a two component rapid set cement grouting system.” In Proc., 18th Coal Operators’ Conf., 353–362. Wollongong, Australia: Mining Engineering, Univ. of Wollongong.
Mirzadjanzade, A. K. H., A. D. Amirov, Z. M. Akhmedov, G. I. Barenblatt, R. S. Gurbanov, V. M. Entov, and Y. U. V. Zaitsev. 1971. “On the special features of oil and gas field development due to effects of initial pressure gradient.” In Proc., 8th World Petroleum Congress. London: Elsevier.
Mollamahmutoglu, M., and Y. Yilmaz. 2011. “Engineering properties of medium-to-fine sands injected with microfine cement grout.” Mar. Georesour. Geotechnol. 29 (2): 95–109. https://doi.org/10.1080/1064119X.2010.517715.
Moridis, G., J. Apps, P. Persoff, L. Myer, S. Muller, K. Pruess, and P. Yen. 1996. A field test of a waste containment technology using a new generation of injectable barrier liquids. Berkeley, CA: Lawrence Berkeley National Lab.
Muller-Kirchenbauer, H. 1972. “Stability of slurry trenches.” In Proc., 5th European Conf. on Soil Oil Mechanics and Foundation Engineering, 543–553. Madrid, Spain: Sociedad Española de Mecánica del Suelo y Cimentaciones.
Packer, M., R. Newman, C. Prangley, and I. Heath. 2018. “Permeation grouting and excavation at Victoria station, London.” Proc. Inst. Civ. Eng. Geotech. Eng. 171 (3): 267–281. https://doi.org/10.1680/jgeen.17.00115.
Park, D., and J. Oh. 2018. “Permeation grouting for remediation of dam cores.” Eng. Geol. 233 (Jan): 63–75. https://doi.org/10.1016/j.enggeo.2017.12.011.
Pedrotti, M., C. Wong, G. El Mountassir, and R. J. Lunn. 2017. “An analytical model for the control of silica grout penetration in natural groundwater systems.” Tunnelling Underground Space Technol. 70 (Nov): 105–113. https://doi.org/10.1016/j.tust.2017.06.023.
Persoff, P., J. Apps, G. Moridis, and J. M. Whang. 1999. “Effect of dilution and contaminants on sand grouted with colloidal silica.” J. Geotech. Geoenviron. Eng. 125 (6): 461–469. https://doi.org/10.1061/(ASCE)1090-0241(1999)125:6(461).
Raffle, J. F., and D. A. Greenwood. 1961. “The relationship between the rheological characteristics of grouts and their capacity to permeate soils.” In Vol. 2 of Proc., 5th Int. Conf. on Soil Mechanics and Foundation Engineering, 789. Paris: International Society for Soil Mechanics and Geotechnical Engineering.
Saleh, S., N. Z. M. Yunus, K. Ahmad, and N. Ali. 2019. “Improving the strength of weak soil using polyurethane grouts: A review.” Constr. Build. Mater. 202 (Mar): 738–752. https://doi.org/10.1016/j.conbuildmat.2019.01.048.
Salvatore, E., G. Modoni, M. C. Mascolo, D. Grassi, and G. Spagnoli. 2020. “Experimental evidence of the effectiveness and applicability of colloidal nanosilica grouting for liquefaction mitigation.” J. Geotech. Geoenviron. Eng. 146 (10): 04020108. https://doi.org/10.1061/(ASCE)GT.1943-5606.0002346.
Scheidegger, A. E. 1958. “The physics of flow through porous media.” Soil Sci. 86 (6): 355. https://doi.org/10.1097/00010694-195812000-00015.
Shire, T., and C. O’Sullivan. 2016. “Constriction size distributions of granular filters: A numerical study.” Géotechnique. 66 (10): 826–839. https://doi.org/10.1680/jgeot.15.P.215.
Spagnoli, G. 2021. “A review of soil improvement with non-conventional grouts.” Int. J. Geotech. Eng. 15 (3): 273–287. https://doi.org/10.1080/19386362.2018.1484603.
Spagnoli, G., W. Seidl, E. Romero, M. Arroyo, R. Gómez, and J. López. 2021. “Unconfined compressive strength of sand-fines mixtures treated with chemical grouts.” In Geotechnical aspects of underground construction in soft ground, 829–835. Boca Raton, FL: CRC Press.
Tomiolo, A. 1982. “Principles of grouting.” In Short course on soil and rock improvement, techniques including geotextiles, reinforced earth and modern piling method. Khlong Luang, Thailand: Asian Institute of Technology.
Van Genuchten, M. T., and J. Parker. 1984. “Boundary conditions for displacement experiments through short laboratory soil columns 1.” Soil Sci. Soc. Am. J. 48 (4): 703–708. https://doi.org/10.2136/sssaj1984.03615995004800040002x.
Warner, J. 2004. Practical handbook of grouting: Soil, rock, and structures. Hoboken, NJ: Wiley.
Wu, Y.-S., K. Pruess, and P. A. Witherspoon. 1992. “Flow and displacement of Bingham non-Newtonian fluids in porous media.” SPE Reservoir Eng. 7 (3): 369–376. https://doi.org/10.2118/20051-PA.
Yates, P. C. 1990. “Kinetics of gel formation of colloidal silica sols.” In Vol. 200 of Abstracts of papers of the American chemical society, 164. Washington, DC: American Chemical Society.
Yonekura, R. 1996. “The developing process and the new concepts of chemical grout in Japan.” In Proc., 2nd Int. Conf. on Ground Improvement Geosystems, 889–901. Tokyo and London: Japanese Society of Soil Mechanics and Foundation Engineering and International Society for Soil Mechanics and Geotechnical Engineering.
Zhao, M., G. Liu, C. Zhang, W. Guo, and Q. Luo. 2019. “State-of-the-art of colloidal silica-based soil liquefaction mitigation: An emerging technique for ground improvement.” Appl. Sci. 10 (1): 15. https://doi.org/10.3390/app10010015.
Zhong, C., V. T. Le, F. Bendahmane, D. Marot, and Z. Y. Yin. 2018. “Investigation of spatial scale effects on suffusion susceptibility.” J. Geotech. Geoenviron. Eng. 144 (9): 04018067. https://doi.org/10.1061/(ASCE)GT.1943-5606.0001935.
Information & Authors
Information
Published In

Journal of Geotechnical and Geoenvironmental Engineering
Volume 150 • Issue 1 • January 2024
Copyright
This work is made available under the terms of the Creative Commons Attribution 4.0 International license, https://creativecommons.org/licenses/by/4.0/.
History
Received: Oct 22, 2022
Accepted: Jun 29, 2023
Published online: Nov 7, 2023
Published in print: Jan 1, 2024
Discussion open until: Apr 7, 2024
Authors
Metrics & Citations
Metrics
Citations
Download citation
If you have the appropriate software installed, you can download article citation data to the citation manager of your choice. Simply select your manager software from the list below and click Download.