Cost Comparison of Highway Rest Area Operations: In-House Workforce versus Outsourcing Methods
Publication: Journal of Construction Engineering and Management
Volume 149, Issue 8
Abstract
State departments of transportation (DOTs) typically use one of three approaches to operate highway rest areas (RAs): in-house workforce, method-based contracting (MBC), and performance-based contracting (PBC). State DOTs spend over $600 million annually to maintain their facilities and often outsource their work to save costs. Although some studies have calculated the annual cost of facilities operated by the three approaches, their findings are not directly comparable. The primary objective of this study is to compute and compare the average annual operating cost of individual RA facilities and the cost of RA data samples (average annual operating cost of a group of facilities in a specific year under a specific approach in a state) produced from these three approaches to achieve a cost-effective alternative. To achieve the objectives, research hypotheses were developed which state there are significant differences in the average annual costs produced by these three approaches. For data analysis, 6,248 cost data were collected from 29 states. From those individual cost data, 198 data samples were generated. Data sets were not normally distributed; thus, nonparametric tests were conducted to determine the group differences. The results show that outsourcing costs under the MBC are significantly less, followed by in-house and the PBC in both cases. The difference between in-house and PBC is also statistically significant. As the primary contribution, this paper investigated the MBC approach as the cost-effective option, and DOT engineers can utilize this approach in operating regular RA facilities to save costs. Caution should be taken when using the study findings in other types of facilities.
Practical Applications
This study suggests that state DOTs can use a cost-effective approach to operate their highway RA facilities for future planning. This study identified MBC as the cost-effective approach when operating regular RA facilities. Transportation professionals can directly implement the study findings to regular RA facilities; however, they should take caution when utilizing the findings in the other two types of RA facilities––welcome center and seasonal facilities––which were not considered in this study because their key features (square footage, annual visitors, and full-time employees) are not comparable to regular facilities. If the agencies have key feature data and they can normalize these features when calculating the average annual cost of facilities, then they can implement the findings for welcome center and seasonal RA facilities as well. In addition, the agencies should be aware of adjusting for inflation and location. Using the cost-effective approach may also reduce RA facility closures in the future, which assists in reducing the shortage of national truck parking issues and decreasing fatigue-related highway accidents.
Introduction
State departments of transportation (DOTs) operate over 2,000 highway rest areas (RAs) in the US (Feldman 2009). After the Interstate National Highway System (NHS) construction started in 1956, RA facilities were constructed and became essential infrastructures for safety and comfort where road users, particularly fatigued and weary drivers, could take a rest before resuming their journeys (Cardone 1965). A typical RA facility offers a variety of services such as restrooms, parking, water fountains, picnic tables, tourist information, free coffee, and so on. To run these facilities, state DOTs use three approaches: in-house workforce, traditional or method-based contracting (MBC), and performance-based contracting (PBC).
When utilizing the in-house workforce approach, states operate their RA facilities using their own internal labor force and resources (Shrestha 2016). This approach allows states to run RA facilities in their own ways. The total operational costs are made up of labor, materials, equipment rentals, utility charges, supply costs, and so on. This approach is appropriate for operation works, small-scale maintenance projects, and urgent nature management tasks such as snow plowing (Kuprenas and Nasr 2007; Shrestha 2016).
Two outsourcing approaches state DOTs use to operate RA facilities are the MBC and the PBC methods (NCHRP 2003; Shrestha and Shrestha 2022). The MBC method requirements give the contractor instructions on what, when, and how to perform work (Stankevich et al. 2009; NCHRP 2003); further, they provide procedures for materials used along with specific qualities of the material. With this approach, a contract is awarded to the lowest bidder who meets the law requirements (Shrestha et al. 2012). PBC is a comparatively newer contracting method for most transportation asset management projects, such as RA facilities. This approach employs result-oriented requirements, placing more emphasis on the outcomes of the work (Stankevich et al. 2009). The adoption of this method is primarily motivated by improved work quality, cost savings, a secured medium-to-long-term budget, higher user satisfaction levels, the consolidation of numerous contracts into a single contract, and risk transfer from the state to the contractor (NCHRP 2003, 2009; Shrestha 2016; Shrestha et al. 2017a, b; Anastasopoulos et al. 2014, 2009, 2010; Shrestha and Shrestha 2014; Zietlow 2004; Ribreau 2003).
Over the last two decades, it has been increasingly common for most states to struggle with financial support. The cost of operating the facilities depends on various factors, such as amenities provided at facilities, the type of RA facilities (regular, welcome center, seasonal, or commercial RAs), the location (interstate or other highway, urban, or rural), the size and age of the facility building, the cost of labor, the cost of sewage disposal service, the cost of utilities, and the number of parking spaces (Shrestha and Powers 2018; Carson et al. 2011; Garder and Bosonetto 2002; NCHRP 1989). These facilities also serve the needs of truck drivers for fatigue-rest and safety inspections, and the shortage of truck parking is a national issue.
The cost of operating RA facilities and managing expenses are important factors contributing to the continual operation of these sites. Often, when states experience funding deficits, they decide to shut down sizable numbers of facilities as the best course of action. For instance, to reduce costs, the Arizona DOT closed 13 of 18 RA facilities (Pedersen 2009; Eaves 2010), Virginia DOT closed 19 of 42 facilities (Hochberg 2009; Utt 2009; NBC 2009), and South Dakota DOT shut down four facilities (Bergal 2017). Studies showed at least 19 state DOTs, including Arizona, Arkansas, California, Colorado, Connecticut, Florida, Georgia, Indiana, Louisiana, Maine, Maryland, Michigan, Michigan, New Jersey, North Carolina, Ohio, South Dakota, Vermont, and Virginia, shut down some of their RA facilities due to funding issues (Berendt 2020; Polansky and Galal 2019; Bergal 2017; Lynds 2010; Eaves 2010; Hochberg 2009; Mckeown 2009; NBC 2009; Pedersen 2009; AP 2008; Feldman 2009).
Alternatively, to address their funding issues or save funds, states have also changed their RA operation approaches (Shrestha and Powers 2018) by shifting from the in-house workforce to outsourcing strategies (Prouty 1993; Garcia-Diaz and Cediel-Franco 1988). For example, Iowa DOT switched from an in-house workforce to the MBC method for an estimated cost saving of $221,417 per year in 1993 (Prouty 1993). Additionally, some states have investigated if the commercialization of these facilities is feasible (EarthTech 2008; Euritt et al. 1992; Kress and Dornbusch 1991).
Studies showed that it is necessary to determine the most cost-effective way to operate these facilities to keep them running in the future (Marvel and Marvel 2007; LADSM 2002). Some states computed typical operating costs of RAs (AECOM 2016; Prouty 1993; Garcia-Diaz and Cediel-Franco 1988); however, and these studies did not provide findings that can be directly compared, and no study has compared the costs of facilities produced by the three alternatives in one study. The findings of this study will assist state DOT maintenance division engineers and managers in selecting a cost-effective approach for operating their RA facilities in the future. The study’s main goals are as follows:
•
compute the average annual operating costs of individual RA facilities from the three approaches: in-house workforce, MBC, and PBC methods;
•
compare the costs of individual RA facilities produced by the three alternatives; and
•
compute and compare the costs of RA data samples (groups of RA facilities maintained using a typical approach in a specific year in a typical state to reduce variability) produced by the three alternatives to identify a cost-effective approach to be utilized in the future.
Literature Review
Initiatives to Commercialize RA Facilities
Poole (2021) study examined the federal agency’s prohibition of interstate RA facility commercialization. The author emphasized that a shortage of commercial truck parking slots, insufficient funds to operate RA facilities, and the requirement of additional funds to add new services, such as electric vehicle (EV) passenger vehicle charging services, at RA facilities would subside with the aid of commercialization.
To eliminate funding for RA facilities, some states including California and Texas studied whether the commercialization of RA facilities was feasible in the early 1990s (Kress and Dornbusch 1991; Euritt et al. 1992). However, for most states, the federal agency did not allow for the commercialization of RA facilities along interstate rights-of-way (Euritt et al. 1992). Therefore, most states faced funding challenges in operating their facilities, and they explored new strategies to reduce their operating costs.
Outsourcing is becoming more popular, and cost is the most crucial consideration in privatization decisions (Martin 1993). This guide showed how to calculate the true cost of services delivered for both in-house and outsourced services.
Operation Cost of RA Facilities
AECOM (2016) carried out a study for statewide RA facilities in the state of New Hampshire DOT (NHDOT). The NHDOT used the in-house workforce approach to operate their 12 RA facilities (eight regular facilities and four other types of facilities) and calculated the operation cost of RA facilities from 2011 to 2015. The average annual costs were $183,227, $190,554, $203,691, $208,282, and $225,616 per RA facility, respectively. These costs were adjusted to 2022 costs using the Engineering News Record (ENR) cost index. Washington state also used an in-house workforce to operate their facilities, and the Washington costs were lower than those of New Hampshire (Shrestha et al. 2022).
To reduce costs, some states have changed their operation strategies (Shrestha and Powers 2018) from the in-house workforce method to outsourcing methods (Prouty 1993; Garcia-Diaz and Cediel-Franco 1988). Prouty (1993) conducted a study on why the Iowa DOT outsourced RA operation work to a private contractor and then calculated its operation costs. As of 1993, Iowa DOT outsourced all 47 RA facility operation works to a private contractor for the first time in their history to reduce costs. Based on past expenditures, the total expected expenditure for 1993–1994 using an in-house workforce was $2,165,229 and the total cost of outsourcing (including monitoring and supervision costs) was $1,943,812. With outsourcing, the estimated cost saving was $221,417 per year in 1993–1994, excluding estimated revenues from selling equipment, which was $376,000 (estimated).
Sultana et al.’s (2012) study on the effectiveness of employing the PBC method for highway assets showed that the PBC method can reduce maintenance costs, enhance job quality, and shift agency risks to contractors in highway projects. In addition, this study discussed and assessed the challenges to adopting the PBC contracts, such as government support, reliance on external funding, political influence, lack of expertise with PBC, lack of planning, fear of losing a job, loss of competitiveness, loss of network control, contractor performance and attitude, and cost estimation challenges. Anastasopoulos et al. (2009) revealed that the contract duration and prolongation of a PBC project varies with key factors like the contract size and scope of work.
In Virginia, Virginia DOT (VDOT) used a combination of in-house workforce and traditional contracting approaches to operate their 37 RA facilities (Perfater 1989). VDOT and VED (1998) estimated the operating cost of a truck only RA facility in Virginia as $52,000 in 1998. Perfater’s (1989) study calculated the average annual operating cost to be $109,261 per RA facility (1987 cost). Out of the 37 facilities, 23 were operated by the in-house workforce approach and 14 by private contractors. Perfater (1989) did not calculate the operating cost produced by the two approaches.
Some states shifted from the in-house workforce method to the newer contracting method––the PBC approach––primarily to save costs (Shrestha and Powers 2018). By switching to the PBC method, some state DOTs saved up to 10% in cost; however, the cost increased by up to 10% in other states (Shrestha and Powers 2018). Indiana, Michigan, Missouri, North Carolina, and Pennsylvania saved between 1% and 10%; however, the cost was increased by 5%–10% in Nebraska when the state switched from an in-house workforce to the PBC approach. Some studies showed that when the PBC approach was used for the first time, the cost may increase due to the transitioning phase (Shrestha and Powers 2018; Shrestha and Shrestha 2022).
Switching to the PBC approach, Shrestha and Powers (2018) surveyed states and reported which states saved costs and which did not. However, this study did not reveal how many facilities were contracted out to the PBC contractor and the contract durations. For example, the Montana Department of Transportation (MDT) launched the PBC approach, but the PBC approach was only utilized in 7 of the 38 locations (Shrestha and Powers 2018). The study revealed that when states utilized the PBC method for highway assets for longer contract duration (over 3 years), they saved costs (Shrestha and Shrestha 2022); however, if states utilized the PBC approach for a shorter time (fewer than 3e years), most agencies did not save costs or their costs went up compared with the in-house workforce approach (Shrestha and Powers 2018; Shrestha and Shrestha 2022).
Shrestha et al. (2022) collected data from RA facility operations in Washington state that used the in-house workforce approach and then calculated the average annual operational costs of RA facilities. That study also collected RA facility operation data through a survey with Arizona, Texas, and Virginia about facilities that used the PBC approach and then calculated and compared the average annual operational cost of those facilities. The study claimed that the in-house workforce approach had lower costs than the PBC approach. However, the costs produced by the in-house workforce and PBC methods could not be generalized because the claim was based on very limited data. The average annual cost produced by the in-house workforce was from Washington state only, and the average annual cost of the PBC approach was produced from just three states.
Gaps in the Literature
States typically use the in-house workforce, MBC, or PBC method to operate RA facilities. However, a limited number of studies have calculated the operating cost of RA facilities, and these studies do not provide findings that can be directly compared to identify the most cost-effective method. To compare cost data from different methods, they must be adjusted for inflation (time) and location, and the findings must be derived from a fair number of data samples to ensure the comparison is reliable. The AECOM (2016) study calculated annual costs using an in-house workforce for New Hampshire DOT from 2011 to 2015, and Prouty (1993) calculated annual costs for Iowa DOT using an in-house workforce and MBC methods in 1993 from 1-year cost data. To compare costs from these two studies, the differences in years and locations do not allow direct comparison.
Furthermore, the number of data samples used in these studies was limited, which can also affect the reliability and generalizability of the results. AECOM (2016) computed cost data for only eight regular RA facilities in New Hampshire, whereas Prouty (1993) used cost data from 47 facilities during a single year, which may not be a good basis for cost comparison. Similarly, Perfater (1989) presented the combined annual cost produced from in-house workforce and MBC methods, which is not a suitable basis for comparing costs with other methods. Shrestha et al. (2022) calculated the costs for the in-house workforce and PBC methods. However, the study findings were based on a limited number of facilities, and the authors did not compare the costs based on statistical analysis due to insufficient data.
Because the findings of the existing studies do not provide a strong basis for comparing cost data, this study fills the gap by calculating the costs produced from these three alternatives and comparing them statistically to identify a cost-effective option for future use and documentation. This study uses a larger data set spanning multiple decades to provide a more comprehensive and reliable basis for comparing the costs produced by the in-house workforce, MBC, and PBC approaches to identify the best option. The statistical analysis of this study allows for a more accurate and meaningful comparison of the operating costs of the three approaches, producing more robust findings to help inform state decision makers.
Research Methodology
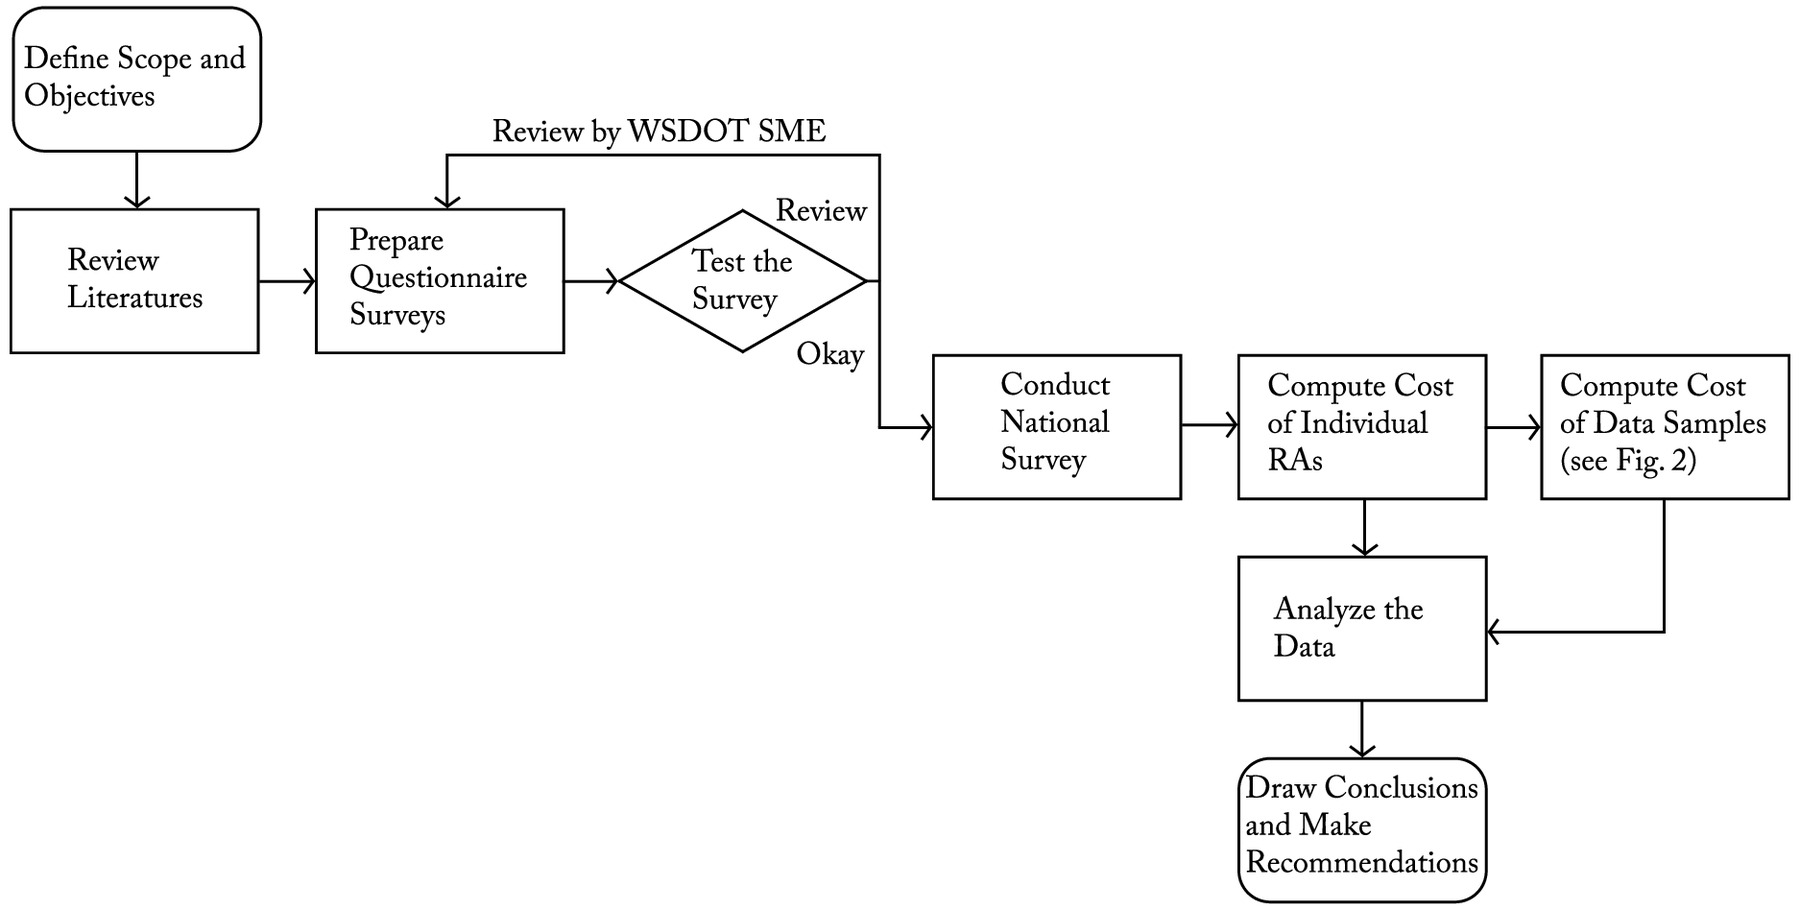
Fig. 1 illustrates the overall research approach. The scope and objectives were first defined, and a literature survey was carried out to compile information on the operating cost analysis of RA facilities. By conducting a national survey (series of survey questionnaires), detailed information on RA facilities was gathered from state DOTs. With the collected data, the average annual costs of operating facilities were calculated. The costs were adjusted for inflation (time) and location using the ENR cost index and the city cost index (ENR 2022; Gordian 2022). The adjusted cost data under each approach utilized (in-house workforce and outsourcing under MBC and PBC approaches) were analyzed using statistical analysis to draw conclusions and recommendations. The steps involved in this study are presented next.
Data Collection
The author prepared a two-phase national survey to gather states’ cost data for operating RA facilities. A survey was first performed to determine the eligible states interested in taking part in this study. States that employ at least one of the three operative strategies were considered eligible (in-house workforce, MBC, or PBC). The second-phase survey was conducted to gather detailed data regarding the RA facilities. The data included the cost of RA operations, the number of facilities they were operating, the number of visitors, the total contract cost and contract period for outsourced projects, and the total site area of facilities from 1990 to 2020. In the survey, separate tables were provided for each method state DOTs utilized to operate their facilities. The author provided detailed notes to help them understand the terms used and to avoid potential misunderstandings so that the collected data were accurate as intended. Some main survey questions were as follows:
1.
How many facilities did your state operate between 1990 and 2020?
2.
What were the labor, material, equipment, and other costs of operating the RA facilities between 1990 and 2020?
3.
What was the number of visitors to RA facilities between 1990 and 2020?
4.
Please provide the area of facilities in square feet that your state operated from 1990 to 2020.
Each state operated a differing number of RA facilities between 1990 and 2020, and responding states did not track cost data similarly. Thus, customized tables were prepared to collect data from the states.
In November 2020, the first-phase survey was dispersed to the 40 maintenance divisions in states, and their answers were gathered. Out of 40 invitations, a total of 29 states responded to the survey and showed interest in the outcome of this research. In February 2021, the second-phase survey was distributed to the states who responded to the first-phase survey, and their responses were gathered by June 2022. All 29 respondents (73% response rate) completed the second-phase survey. The research team provided extended time to the respondents because the amount of work needed to gather information was significant and time-consuming. The author understands that most state DOTs were falling through lower full-time employees (FTEs) due to the COVID-19 pandemic. The survey questionnaires were reviewed by the Washington State DOT (WSDOT) subject matter expert (SME) before they were dispatched to the states to make sure the state DOTs received them well. The survey questionnaires are available upon written request.
Determination of the Average Annual Cost of RA Operations
After data were collected, the annual operating cost of each RA facility was computed. First, the annual cost was determined by summing up the charges under Materials, Labors, Equipment, and Others if a facility was maintained utilizing an in-house workforce method. Although states owned the equipment they utilized, the ownership costs were considered. This study collected the total costs of Materials, Labors, and Equipment from state DOTs using the survey; the author did not calculate them. Per state engineers, they calculated the annual ownership cost of equipment considering depreciation cost and investment cost and then equally dispersed equipment to RA facilities regardless of whether they used the equipment or not. The cost of utilities, equipment fuel, rubbish collection, testing services, general repair, and other services were all included under the Others category. The mathematical formula [Eq. (1)] utilized to determine the annualized operating cost of RA facilities is as follows:
(1)
If a facility was maintained using outsourcing methods (MBC or PBC), the annual cost per facility was calculated from the total contract cost, the duration of the contract, and the number of RA facilities. Some states provided their annual costs directly in the survey. The contract period for the MBC method was usually 1 year; however, for the PBC method, it was over 1 year. The mathematical formula [Eq. (2)] utilized to calculate the annual cost per facility maintained by MBC and PBC methods is as follows:
(2)
After calculating the annualized cost of each RA facility, this study adjusted the annual costs (sum of material, labor, equipment, and other costs) for inflation/time (converted into the 2022 base cost) using the ENR construction cost index. The highway construction cost index is suitable for most heavy civil construction works that involve earthwork, concrete work, pavement work, and so on; however, the ENR index is suitable to use when the proportion of labor cost is high as compared with total costs (ENR 2022; Jeong et al. 2017). The proportion of labor costs for the RA facility operations is approximately 60% of the total cost, which is similar to other studies (Shrestha et al. 2022; NCHRP 1989). The City Cost Index (CCI) of Olympia, Washington, was used for the location adjustment (Gordian 2022). The adjusted annual costs were utilized for data analysis (Scenario 1).
Generating Data Samples
By analyzing the individual cost data (in Scenario 1), it was observed that the data were a bit spread out or the coefficient of variation was relatively high (0.47–0.64). To reduce the impact of variations in individual cost data, this study generated data samples for Scenario 2 data analysis. The key difference between data samples compared with individual cost data is the lowered range of the coefficient of variation, which was 0.44–0.55. Zach (2021) recommended lowering the coefficient of variation for data analysis because it reflects less dispersion around the mean. Fig. 2 presents the overview of how data samples were generated from the adjusted annual cost of individual RA facilities.
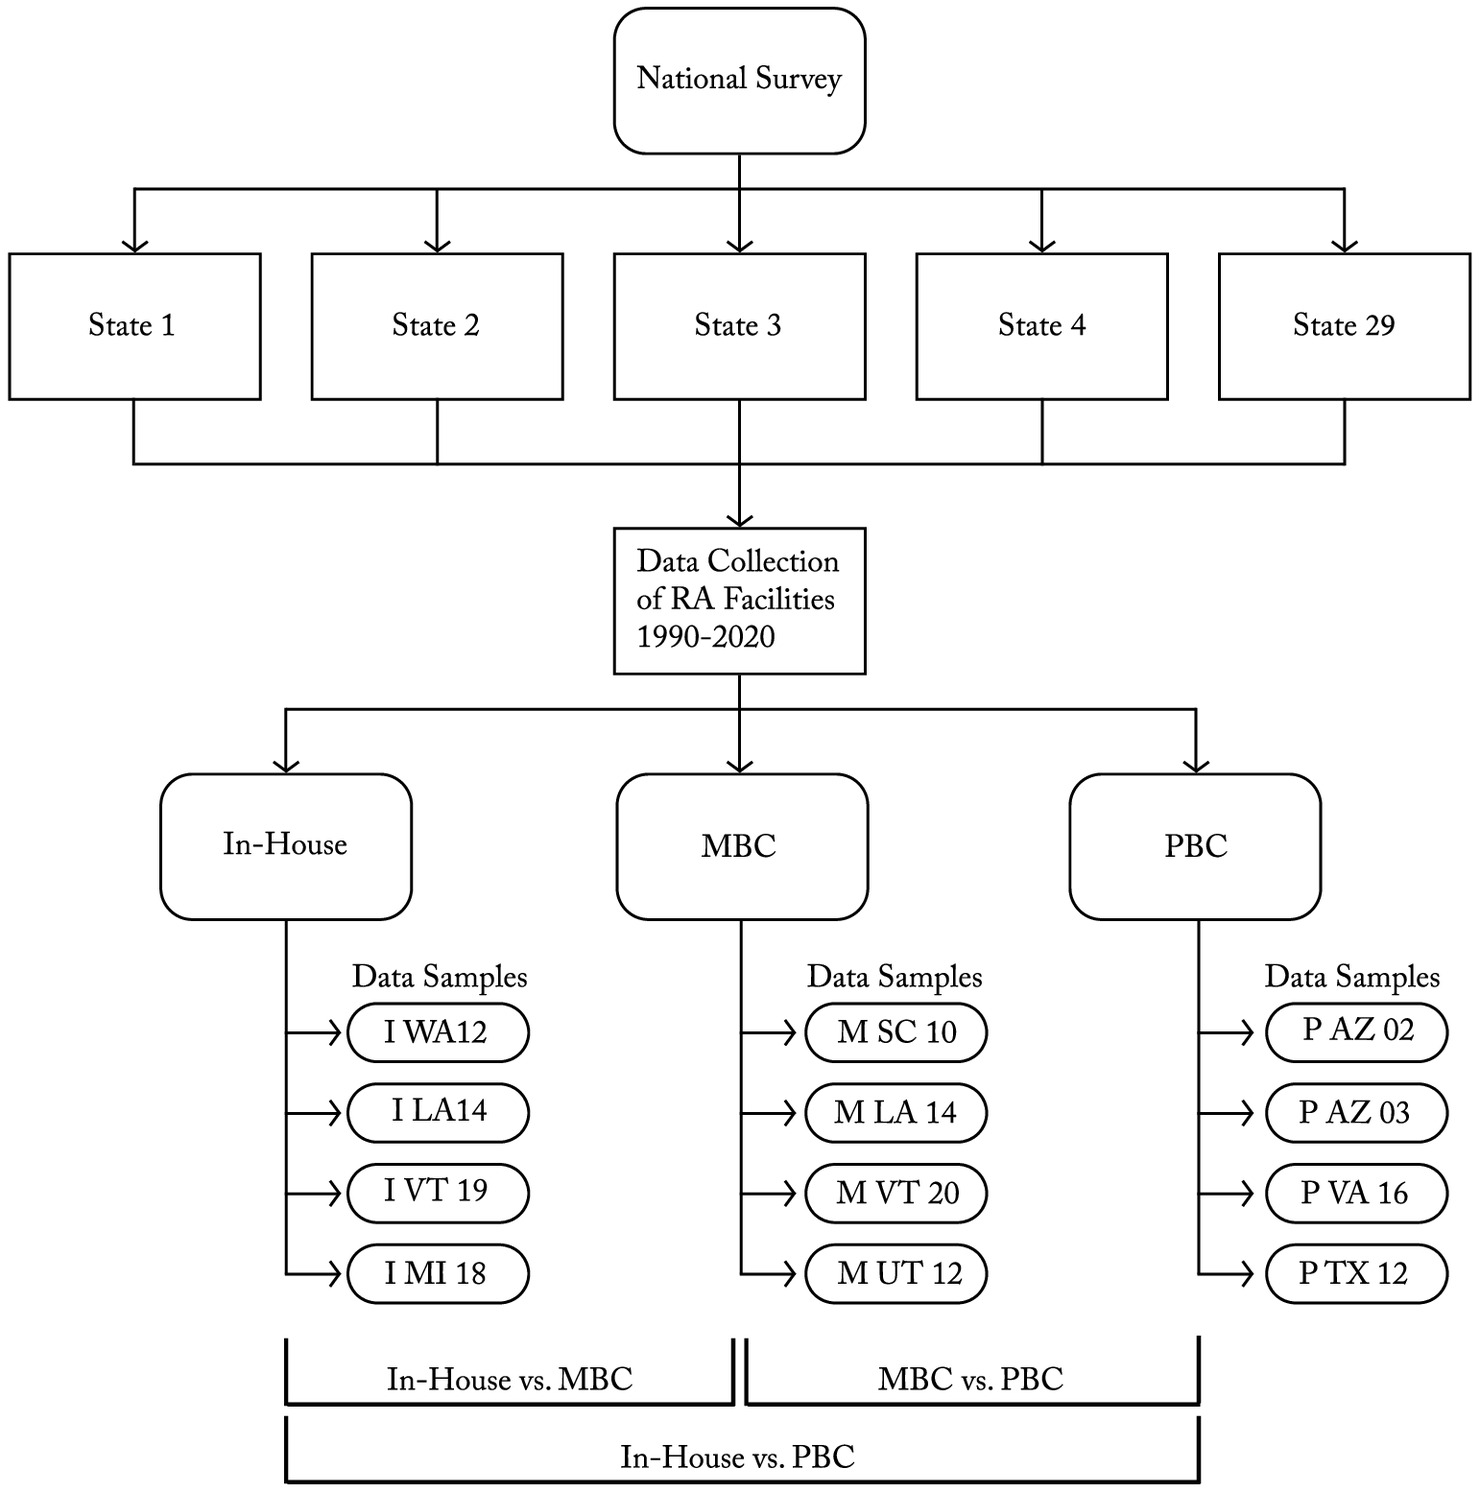
If a state DOT maintained a group of RA facilities under a typical method (in-house, MBC, or PBC) in a specific year, the average operating cost of that group of facilities was considered as one data sample to normalize variation. Thus, in this study, one data sample indicates the average annual cost for a number of RA facilities maintained in a group under a specific approach in a state in a specific year. For example, this study collected data from 39 regular RA facilities maintained using the in-house workforce method from 2011 to 2020 in Washington state. Ten data samples were generated from the Washington data, and each data sample represents the average annual cost of 39 RA facilities. From 6,248 cost data in different years from 976 RA facilities in 29 states, 198 data samples were generated. There are 67, 91, and 40 data samples for in-house, MBC, and PBC methods, respectively.
Fig. 2 also presents the identification numbers (IDs) of data samples. The first letter of the ID indicates the approach used (I indicates in-house workforce, M indicates MBC, and P indicates PBC). The following two letters indicate the standard two-letter code of states. For instance, AZ means Arizona and TX means Texas. Then, the last two numbers indicate the year of cost data. For example, IWA12 indicates a data sample for the in-house workforce method in Washington state in 2012. The PBC data sample is limited in this study because this approach is new to state DOTs, thus implementation and utilization of this approach for RA facilities is relatively low. The data samples were used for descriptive and statistical analyses in Scenario 2.
Research Hypotheses
To achieve the objectives, six research hypotheses were developed in this paper. These hypotheses considered the cost efficiency of three approaches in operating individual RA facilities. Hypotheses 1, 2, and 3 claim that the average annual costs of individual RA facilities produced by the in-house workforce, MBC, and PBC approaches differ significantly from one another. Three additional hypotheses claim that the average annual costs of the RA data samples produced by the three approaches differ significantly from one another. Shrestha et al. (2019) also developed a similar additional scenario to strengthen the findings of their study, and the author conducted a similar statistical analysis.
Null Hypotheses
Null hypotheses were created from the research hypotheses. The Null hypotheses 1, 2, and 3 claim that the average annual costs of individual RA facilities maintained by the in-house workforce, MBC, and PBC techniques are not significantly different from one another. In this study, only regular RA facilities (all-season) were considered for data analysis. Other types of welcome center facilities and seasonal facilities were excluded to reduce the impact of differences in facility sizes, of visitor numbers, and FTEs on facility costs. The null hypotheses are represented mathematically as follows:
•
Null hypothesis 1:
•
Null hypothesis 2:
•
Null hypothesis 3:
Another three null hypotheses regarding data samples were also created from the research hypotheses. They claim that the average annual costs of RA data samples maintained by in-house workforce, MBC, and PBC approaches are not significantly different from one another. They are represented mathematically as follows:
•
Null hypothesis 4:
•
Null hypothesis 5:
•
Null hypothesis 6:
Statistical Tests
The Kolmogorov-Smirnov and Shapiro-Wilk tests were carried out to determine whether the data were normally distributed. The null hypothesis is that the sample population is normally distributed. This test rejects the null hypothesis if the -value is less than 0.05, indicating that the sample population is skewed. The findings demonstrated that the sample populations for all groups are not normally distributed. As a result, the Kruskal-Wallis -tests (nonparametric) were performed to determine whether the costs of these groups differ statistically from one another. The median costs in these three groups are significantly different if the -value is below 0.05 and are very significantly different if the -value is less than 0.01 (Maharjan et al. 2022).
Results
For data analysis, the adjusted average annual costs of individual RA operations were calculated. There were a total of 6,248 costs of individual RA facilities (2,059 in-house, 2,552 MBC, and 1,637 PBC) for the Scenario 1 data analysis. For Scenario 2 data analysis, as explained in the “Research Methodology” section, a total of 198 data samples (67 in-house, 91 MBC, and 40 PBC) were generated from the individual costs. Then, these cost groups were compared using statistical analysis to determine which approach is most cost-effective. The following sections provide a detailed description of the findings.
Descriptive Statistics
Table 1 presents a simple summary [sample size, mean, median, coefficient of variation, and standard deviation (SD)] of the operation cost of RA facilities performed by the in-house workforce, MBC, and PBC methods for both scenarios (individual data and data samples). The results show that the mean and median costs of the work carried out by the MBC method were lower compared with the costs of private contractors under PBC and in-house workforce methods for both scenarios. The average annual mean cost per facility performed by the MBC was at least 20% less than the cost performed by an in-house workforce and at least 40% less than the cost carried out by the PBC method. Additionally, the average annual median cost per facility performed by the MBC was at least 10% less than the cost performed by the in-house workforce and at least 45% less than the cost carried out by the PBC method for both scenarios.
| Unit cost | Contracting methods | Sample size | Mean ($) | Median ($) | SD ($) | Coefficient of variation |
|---|---|---|---|---|---|---|
| Scenario 1: Individual data | ||||||
| Average annual operation costs | In-house | 2,059 | 267,621 | 174,227 | 172,035 | 0.64 |
| MBC | 2,552 | 191,707 | 157,220 | 97,551 | 0.51 | |
| PBC | 1,637 | 398,214 | 318,860 | 185,532 | 0.47 | |
| Scenario 2: Data sample | ||||||
| Average annual operation costs | In-house | 67 | 284,435 | 281,257 | 124,743 | 0.44 |
| MBC | 91 | 226,315 | 169,229 | 108,574 | 0.48 | |
| PBC | 40 | 374,183 | 307,198 | 207,589 | 0.55 | |
The mean cost produced by the in-house workforce approach in Scenario 1 was $267,621, which is more than the cost computed by AECOM (2016) for the New Hampshire DOT using the same approach and by Prouty (1993) for Iowa DOT; however, the mean cost is less than the cost computed by Perfater (1989) for Virginia DOT. The mean cost produced by the MBC approach in Scenario 1 is $191,707, which is more than the cost computed by Prouty (1993) for Iowa DOT; however, the mean cost is less than the cost computed by Perfater (1989) for Virginia DOT. Similarly, the mean cost produced by the PBC approach in Scenario 1 is $398,214, which is more than the cost computed by Shrestha et al. (2022) for three states (Arizona, Virginia, and Texas); however, the mean cost computed by Shrestha et al. (2022) was calculated from very limited data.
Results of the Kolmogorov-Smirnov and Shapiro-Wilk Tests
Table 2 presents the results of the Kolmogorov-Smirnov and Shapiro-Wilk normality tests. The results demonstrate that all six groups (three in Scenario 1 and three in Scenario 2) were not normally distributed. Therefore, the Kruskal-Wallis -tests were carried out to determine if the cost data performed by the three methods in Scenario 1 and Scenario 2 were statistically different.
| Unit cost | Methods | Kolmogorov-Smirnov | Shapiro-Wilk | ||
|---|---|---|---|---|---|
| Statistic | Significance | Statistic | Significance | ||
| Scenario 1: Individual data | |||||
| Average annual operation costs | In-house | 0.281 | 0.744 | ||
| MBC | 0.339 | 0.700 | |||
| PBC | 0.192 | 0.904 | |||
| Scenario 2: Data sample | |||||
| Average annual operation costs | In-house | 0.190 | 0.875 | ||
| MBC | 0.206 | 0.888 | |||
| PBC | 0.155 | 0.866 | 0.003 | ||
Note: Significant at level 0.05.
Results of the Kruskal-Wallis -Test
The Kruskal-Wallis -tests were conducted to compare the medians of the average annual expenses produced by the in-house workforce, MBC, and PBC approaches because none of the data sets are normally distributed. The results of the Kruskal-Wallis -tests showed that the -value is below 0.01 for both scenarios, which indicates that the difference is highly significant. To determine which groups or groups are significantly different from other groups, the Mann-Whitney -tests have been conducted pairwise: in-house workforce versus MBC, in-house workforce versus PBC, and MBC versus PBC. Table 3 presents the test results, which show that the average annual operation cost using the MBC method was significantly lower compared with the in-house workforce and PBC methods for both scenarios, followed by in-house workforce and PBC methods. The difference in median costs between the in-house workforce and the PBC methods was also highly significant. For other highway assets (chip seals and striping), the unit cost and life-cycle cost of these assets produced by the in-house workforce method were significantly lower compared with private contractors (Shrestha et al. 2019).
| Unit cost | Methods | Mean rank | Sig. | |
|---|---|---|---|---|
| Scenario 1: Individual data | ||||
| Average annual operation costs | In-house | 2,059 | 2,830.76 | |
| MBC | 2,552 | 1,882.61 | ||
| Average annual operation costs | MBC | 2,552 | 1,480.47 | |
| PBC | 1,637 | 3,053.02 | ||
| Average annual operation costs | In-house | 2,059 | 1,441.26 | |
| PBC | 1,637 | 2,360.72 | ||
| Scenario 2: Data sample | ||||
| Average annual operation costs | In-house | 67 | 93.48 | |
| MBC | 91 | 69.21 | ||
| Average annual operation costs | MBC | 91 | 56.09 | |
| PBC | 40 | 88.55 | ||
| Average annual operation costs | In-house | 67 | 48.15 | 0.012 |
| PBC | 40 | 63.80 | ||
Note: Significant at level 0.05.
Discussion
Rest area facilities are a vital part of highway safety. It is the responsibility of state DOTs to operate, maintain, and rehabilitate them. To operate RA facilities, in-house workforce and MBC are the most frequently utilized approaches; however, there are limited RA PBC contracts and subsequent data on the method. This paper identifies the most cost-effective approach for operating RA facilities.
This study calculates the average annual operating costs of RA facilities that were maintained by one of three approaches: in-house workforce, MBC, and PBC. If states used the in-house workforce method, the average annual cost was calculated by adding four core cost components: Materials, Labors, Equipment, and Others. The National Cooperative Highway Research Program (NCHRP) (NCHRP 1989) also used these four cost components to calculate the total cost of RA facility operation costs. Of these four cost components, Labors was the highest expenditure at 59.63% of the total cost, followed by Others (22.21%), Materials (9.18%), and Equipment (8.98%). These components were comparable to the study conducted by NCHRP (1989) except for the Equipment (6.40%) component; this may be because more equipment is used today compared with 3 decades ago.
If states used the MBC and PBC methods, the average annual cost was calculated by dividing the total contract cost by the contract duration and the number of RA facilities. Most MBC contracts were for 1-year periods whereas the PBC contracts were over 1 year; thus, the author carefully investigated the cash flow during the contract period. With the PBC contracts, the cash flows were almost linear (approximately similar dollar amounts paid over the contract period); therefore, the average annual cost was calculated simply by dividing the total contract cost by the contract period in years and the number of RA facilities. For culvert cleaning and sweeping projects when the contract periods were over 1 year, Shrestha and Shrestha (2014) also used the same methodology to compute annual costs.
The data analysis showed that the PBC costs and the standard deviation (variation) are were high. This may be because state DOTs used the PBC method, a comparatively newer approach, for the first time. This study collected cost data for 976 facilities, out of which 342, 443, and 208 facilities were operated using the in-house workforce, MBC, and PBC approaches, respectively, and the number of facilities operated by the PBC approach is the lowest among the three. The sum of facilities operated by these three approaches does not equal 976 because several facilities were operated using in-house workforce and MBC methods in different years.
Higher costs and higher standard deviation may be due to the amount of state risks transferred to the contractors. Studies showed that when state risks are transferred to the contractor, their costs went up (Shrestha and Powers 2018; Shrestha et al. 2019); however, studies also showed that the amount of risk transferred to the contractor varied from project to project and state to state, which is very difficult to quantify and compare. The higher the risk transferred, the higher the pay. However, the risks transferred (if any) to the PBC contractors were not normalized in this paper because that is not the objective of this study; the author is interested in how such project risks might be quantified and considered in similar future studies.
RA facilities maintained using approaches other than the aforementioned three were not included in this study. Other methods include a portion of work done using nonprofit organizations or any specific group of people (disadvantaged individuals, women, older people, specific community), and so on. Some state DOTs used a hybrid approach with both in-house workforce and MBC approaches––facility operation works were done by one party and another party did janitorial works. The key objective of this study is to compare operation costs of the in-house workforce, MBC, and PBC approaches. Other approaches do not align with any of the three approaches; therefore, this study did not consider the RA facilities operated using other methods. The main reason for excluding data from the other methods is to make sure the findings of this study are appropriate for drawing conclusions and making recommendations. The number of facilities operated using the other methods was limited and insufficient to conduct statistical analysis as a separate approach, and thus this study did not consider them within its scope.
In addition to the operating costs and the number of RA facilities in this study, the author also sought to provide data on other features that may have affected the operation costs. Examples of these are the square footage of the facility, visitor information (number of visitors per RA per year), and staffing FTEs. Some states provided the other features’ data, but the majority of the states do not have these data on their record. When data analysis was conducted with only the limited collected data, the results showed that the other feature data are correlated with the operating cost––an increase in the square footage, visitors, and staffing FTEs increased the operational costs. Because the other feature data were not available for all facilities, this study excluded the welcome center facilities (which have large square footage, visitors, and FTEs) and seasonal facilities (which have small square footage, visitors, and FTEs) in order to limit their impacts on the cost of facilities. Only the regular RA facilities were included in this study.
When only regular RA facilities are considered, the average square footage, visitors, and FTEs within the three approaches are comparable, with less than 5% variation among them. Thus, the other feature data did not impact the reliability of the study findings because the results showed that the average annual median cost per facility maintained by the MBC approach was at least 10% less expensive than the in-house workforce and at least 45% less expensive than the PBC approach for both scenarios. The square footage and the number of visitors were significantly less for seasonal RA facilities and significantly higher for welcome center RA facilities compared with the regular RA facilities; thus, the operating costs of these facilities are not comparable to those the regular RA facilities.
For example, in New Hampshire, the square footage of welcome center buildings, regular facilities, and seasonal facilities was 465–3,345 (5,000–36,000), 134–192 (1,440–2,064), and under 93 m2square meter (1,000 sq ft) per facility, respectively, and the average annual visitors in welcome centers, regular facilities, and seasonal facilities were 1,024,719, 203,831, and 57,500 per facility in 2015, respectively (AECOM 2016). Due to scale economies and facility size, a larger facility (welcome center) may have a lower operating cost compared with a smaller RA (seasonal facility) (Savage 1997; Irfan et al. 2012). Therefore, this study excluded welcome centers and seasonal facilities and considered only the regular RA facility operation cost data to yield reasonable findings.
To compare the costs, two scenarios were developed: Scenario 1 which compares groups of individual cost data and Scenario 2 which compares data samples. The Scenario 1 individual cost data were spread out or the coefficients of variation (standard deviation/mean) were high (0.64 for in-house workforce, 0.51 for MBC, and 0.47 for PBC) (Table 1). A coefficient of variance over 1.0 is considered quite high, whereas a smaller coefficient of variance indicates that the findings are more reliable. (Zach 2021). Thus, this study also generated data samples to limit the influence of the high coefficient of variations in data and potentially strengthen the findings of this study. The data samples were generated from the cost of individual facilities maintained by the same approach and in the same year in a state.
First, normality tests were carried out to see if the cost groups were normally distributed. Because all the data were not normally distributed, a nonparametric Kruskal-Wallis -test was utilized. The study findings from both scenarios show that the average annual operating cost of RA facilities produced by the MBC method was significantly low compared with both the in-house workforce and the PBC methods, followed by the in-house and PBC methods.
One of the key reasons state DOTs outsource their work to private contractors (usually through traditional contracting, MBC) is to save costs (Shrestha and Shrestha 2014; NCHRP 2003; Martin 1993), which was reinforced by several studies (NCHRP 2003; Martin 1993). Studies also reported that state DOTs saved costs through outsourcing to the PBC contractors as well; however, some state DOTs also reported that cost saving was not achieved or costs increased when they used the PBC approach (Shrestha and Powers 2018). Shrestha et al. (2022) also showed that the average annual cost of facilities using the PBC method was significantly higher compared with the in-house workforce method. Studies showed that when the PBC approach is utilized for the first time, the cost may increase (Shrestha et al. 2022); another reason for increased PBC costs may be due to the state DOT risks transferred to the contractor (Segal et al. 2003; NCHRP 2003; Martin 1993). A study also showed that when the PBC contract duration is short (fewer than 3 years), this approach may increase the cost (Shrestha et al. 2022). The costs produced by the in-house workforce and PBC methods are also significantly different for both scenarios, in alignment with Shrestha et al.’s (2022) findings.
Because the numbers of data samples for all three approaches were over 30, it can also be assumed that the data set is normally distributed and parametric tests can be conducted (Ganti 2022). When a parametric test of ANOVA and -tests was conducted, the findings of the test aligned with the findings of nonparametric tests. That means state DOTs should use the MBC method as the cost-effective alternative in operating their RA facilities.
Limitations of This Study
There were comparatively fewer data samples for the PBC data set. This limitation resulted from comparatively fewer states utilizing the PBC approach for their RA operations. In this study, a total of 1,637 PBC individual cost data and 40 data samples were collected for data analysis.
To calculate the annual cost of RAs, four cost components, namely, Materials, Labors, Equipment, and Others, were totaled. The annual ownership cost of equipment was collected from states through the national survey. Although state engineers calculated the annual ownership cost of equipment considering depreciation, they might not have used the same depreciation method. However, it might not have significantly impacted the findings of this study because the equipment cost component was the smallest expenditure (8.98% of total annual cost of facilities). Some costs, such as RA facility building depreciation and the cost of security provided by highway patrol and local law enforcement agencies, were not included in this study because these data were not available for all the RA facilities. This study also has a limitation in that the individual cost components were not adjusted for time and location separately, but the total annual costs (sum of Materials, Labors, Equipment, and Others costs) were adjusted for time using the ENR construction cost index and for location using the City Cost Index. Future studies are recommended to adjust individually for improved accuracy.
To adjust the scale factor (square footage of buildings), this study excluded welcome centers and seasonal facilities because welcome centers are too large and seasonal facilities are too small compared with regular facilities. The author asked states to provide the size of each of the facilities in the survey, but due to a lack of data, this study indirectly adjusted the scale factor excluding the welcome center and seasonal facilities.
Conclusions and Recommendations
RAs are envisioned to improve highway safety by providing a break to users with basic services such as restrooms, parking spaces, and other amenities like water fountains, paid telephone services, vending machines, picnic tables, and RV dumping services. A minimum of 19 state DOTs have closed some of their RA facilities due to funding issues in the last 2 decades (Berendt 2020; Bergal 2017; Hochberg 2009; Pedersen 2009; Eaves 2010; Feldman 2009). This became a severe issue for state DOTs and highway users, and thus investigating a cost-effective approach is crucial to avoid future RA facility closures. The primary objective of this paper is to calculate and compare the average annual cost of operating RA facilities using three commonly used approaches to identify the most cost-effective option.
To achieve the objectives, this study collected 6,248 cost data of 976 RA facilities through a national survey with state DOTs and from their reports. The survey was divided into three sections for the three approaches used to maintain their RA facilities: in-house workforce, MBC, and PBC methods. Out of the 40 states invited, a total of 29 states showed their interest and responded. The RA facility data for each approach were collected separately in these three sections. If state DOTs were using the in-house workforce method, the annual cost was calculated by adding the costs of Material and Supplies, Labor, Equipment, and Other Categories for each RA facility. If state DOTs used outsourcing methods, the annual cost was calculated from the total contract cost, contract period, and the number of RA facilities. Once the annual cost of each facility was calculated, they were adjusted for inflation (time) and location using the ENR construction cost index and city cost index. With this process, 6,248 individual cost data were calculated and used for data analysis in Scenario 1.
To limit the impact of the coefficient of variation with the individual cost dataset, this study also generated 198 data samples from the 6,248 individual cost of facilities that were maintained by the same approach in a typical year in a typical state. The data sample costs represent the combined average annual cost of facilities maintained under a typical approach in the same year. These 198 data samples were used for data analysis in Scenario 2.
Three research hypotheses were created to compare the average annual operating cost of individual RA facilities and RA data samples produced from the three approaches. For data analysis, descriptive statistics were carried out to find the mean, median, coefficient of variation, and standard deviation of the RA operation works run by the three approaches. The results showed that the median costs produced by the MBC approach are between 10% and 45% less than the costs produced by the in-house workforce and PBC approaches, respectively, for both scenarios. With Scenario 1, the median costs of the in-house workforce, MBC, and PBC methods were $174,227, $157,220, and $318,860, respectively. With Scenario 2, the median costs of in-house workforce, MBC, and PBC methods were $281,257, $169,229, and $307,198, respectively.
The Kolmogorov-Smirnov and Shapiro-Wilk tests were carried out to find if the data sets were normally distributed. The test results showed that all six data sets were not normally distributed; thus, Kruskal-Wallis -tests were conducted to determine if there is a statistical difference among the three approaches. The test results showed that there is a significant difference among groups and that the median average annual cost of RA facilities performed by the MBC approach was significantly less compared with the other two approaches for both scenarios, followed by the in-house workforce and the PBC methods. The costs produced by the in-house workforce and the PBC approaches were also significantly different.
Therefore, the major contribution of this study found the traditional contracting approach (MBC) to be the cost-effective option among the three approaches discussed for operating regular RA facilities. State DOT engineers can plan to use this approach to save costs when operating the regular RA facilities. Other studies also showed that outsourcing under the traditional contracting method is the most cost-effective option compared the in-house workforce approach (DOWL HKM 2014; Prouty 1993; Garcia-Diaz and Cediel-Franco 1988).
The findings of this study are limited to use for regular RA facilities, so transportation professionals should take caution when utilizing the findings for welcome center and seasonal facilities. Using the MBC approach may also help stop RA facility closures in the future, which assists in reducing the shortage of national truck parking issues and fatigue-related highway accidents. The author suggests carrying out similar research for other roadway assets.
Data Availability Statement
Some or all data, models, or code that support the findings of this study are available from the corresponding author upon reasonable request.
Acknowledgments
The author would like to acknowledge the Washington Department of Transportation (WSDOT) and the Pacific Northwest Transportation Consortium (PacTrans) for funding this study (Contract No. 69A355174110). The author also would like to thank transportation engineers and managers from several state DOTs who contributed to and provided data for this study.
References
AECOM. 2016. NHDOT statewide rest area and welcome center study. Final Rep. Dallas, TX: North Hampshire DOT.
Anastasopoulos, P. C., R. J. G. M. Florax, S. Labi, and M. G. Karlaftis. 2010. “Contracting in highway maintenance and rehabilitation: Are spatial effects important?” Transp. Res. Part A Policy Pract. 44 (3): 136–146. https://doi.org/10.1016/j.tra.2009.12.002.
Anastasopoulos, P. C., J. E. Haddock, and S. Peeta. 2014. “Cost overrun in public-private partnerships: Toward sustainable highway maintenance rehabilitation.” J. Constr. Eng. Manage. 140 (6): 04014018. https://doi.org/10.1061/(ASCE)CO.1943-7862.0000854.
Anastasopoulos, P. C., S. Labi, and B. G. McCullouch. 2009. “Analyzing the duration and prolongation of performance-based contracts through hazard-based duration and zero-inflated random parameters Poisson models.” Transp. Res. Rec. 2136 (1): 11–19. https://doi.org/10.3141/2136-02.
AP (Associated Press). 2008. “Plan to close rest areas.” Accessed October 3, 2022. https://www.benningtonbanner.com/stories/plan-to-close-rest-areas,59021.
Berendt, C. 2020. “U.S. 421 rest area closed.” Accessed October 3, 2022. https://www.clintonnc.com/news/46875/u-s-421-rest-area-closed.
Bergal, J. 2017. “Why old-fashioned highway rest stops are disappearing.” Accessed October 3, 2022. https://www.usatoday.com/story/news/nation/2017/04/01/highway-rest-stops-disappearing/99868368/.
Cardone, S. M. 1965. “Maintenance cost of rest areas in Michigan.” Accessed May 9, 2023. https://onlinepubs.trb.org/Onlinepubs/hrr/1965/93/93-011.pdf.
Carson, J. L., V. J. Pezoldt, N. Koncz, and K. O. Boampong. 2011. Benefits of public roadside safety rest areas in Texas: Technical report. Austin, TX: Texas Transportation Institute.
DOWL HKM. 2014. Montana rest area plan. Helena, MT: Montana DOT.
EarthTech. 2008. CT statewide rest area and service plaza study. Volume I—Administrative Report—Recommended Improvement Program. Newington, CT: Connecticut DOT.
Eaves, A. 2010. “As some states close highway rest stops, others see roadside revenue.” Accessed October 3, 2022. https://www.pewtrusts.org/en/research-and-analysis/blogs/stateline/2010/07/28/as-some-states-close-highway-rest-stops-others-see-roadside-revenue.
ENR (Engineering News-Record). 2022. “Using ENR Indexes.” Accessed May 9, 2023. https://www.enr.com/economics/faq.
Euritt, M. A., R. Harrison, and S. Grant. 1992. Feasibility of safety rest area commercialization in Texas. Transportation Planning Division (D-10 Research), Final Research Rep. 1269-1F. Austin, TX: Texas DOT.
Feldman, C. 2009. “No rest available for the weary as rest areas close.” Accessed October 3, 2022. https://poststar.com/lifestyles/travel/no-rest-available-for-the-weary-as-rest-areas-close/article_41cc12e8-d0d7-11de-82f2-001cc4c03286.amp.html.
Ganti, A. 2022. “Central limit theorem (CLT): Definition and key characteristics.” Accessed May 9, 2023. https://www.investopedia.com/terms/c/central_limit_theorem.asp#:∼:text=A%20sample%20size%20of%2030,representative%20of%20your%20population%20set.
Garcia-Diaz, A., and F. Cediel-Franco. 1988. Evaluation of in-house maintenance and maintenance contract costs for guardrail, rest areas, pavement marker, striping and seal coats. College Station, TX: Texas A&M University System.
Garder, P. E., and N. Bosonetto. 2002. Quantifying roadside rest area usage. Hartford, CT: Univ. of Connecticut.
Gordian. 2022. Heavy construction costs with RSMeans data. 36th ed. Greenville, SC: Construction Publishers and Consultants.
Hochberg, A. 2009. “For half of Virginia rest areas, it’s no go.” Accessed October 3, 2022. https://www.npr.org/2009/07/22/106880794/for-half-of-virginia-rest-areas-its-no-go.
Irfan, M., M. B. Khurshid, A. Ahmed, and S. Labi. 2012. “Scale and condition economies in asset preservation cost functions: Case study involving flexible pavement treatments.” J. Trans. Eng. 138 (2): 218–228. https://doi.org/10.1061/(ASCE)TE.1943-5436.0000323.
Jeong, D. H., D. D. Gransberg, and K. J. Shrestha. 2017. Advanced methodology to determine highway construction cost index (HCCI). Helena, MT: Montana DOT.
Kress, E. N., and D. M. Dornbusch. 1991. “Commercialization of rest areas in California.” Transp. Res. Rec. 1326 (Apr): 1–5.
Kuprenas, J. A., and E. B. Nasr. 2007. “Cost performance comparison of two public sector project procurement techniques.” J. Manage. Eng. 23 (3): 114–121. https://doi.org/10.1061/(ASCE)0742-597X(2007)23:3(114).
Legislative Audit Division. 2002. Performance audit, rest area program, Montana department of transportation. State of Montana, Report to Legislature. Helena, MT: Legislative Audit Division.
Lynds, J. 2010. “DOT makes cost-cutting changes to rest areas.” BDN News. Accessed October 3, 2022. https://bangordailynews.com/2010/02/11/news/dot-makes-costcutting-changes-to-rest-areas/.
Maharjan, S., P. P. Shrestha, and M. Karakouzian. 2022. “Correlating disadvantaged business enterprises’ participation with highway project performance.” J. Leg. Aff. Dispute Resolut. Eng. Constr. 14 (4): 04522021. https://doi.org/10.1061/(ASCE)LA.1943-4170.0000557.
Martin, L. 1993. “How to compare costs between in-house and contracted services.” Accessed May 9, 2023. https://reason.org/wp-content/uploads/files/ba9b149031669883385db8c2ff63b9ef.pdf.
Marvel, M. K., and H. P. Marvel. 2007. “Outsourcing oversight: A comparison of monitoring for in-house and contracted services.” Public Administrative Rev. 67 (3): 521–530. https://doi.org/10.1111/j.1540-6210.2007.00734.x.
Mckeown, B. 2009. “Hold it! Rest areas closing lids.” The Gazette. Accessed May 9, 2023. https://gazette.com/news/hold-it-rest-areas-closing-lids/article_c3f690d2-ccf2-5329-94d2-f209cf03fad9.html.
NBC (National Broadcasting Company). 2009. “No rest for the weary as rest areas close.” NBC News. Accessed October 3, 2022. http://www.nbcnews.com/id/33917782/ns/travel-news/t/no-rest-weary-rest-areas-close/#.XlJGWihKg2w.
NCHRP (National Cooperative Highway Research Program). 1989. “Evaluation of safety rest areas.” Accessed October 3, 2022. http://onlinepubs.trb.org/Onlinepubs/nchrp/nchrp_rpt_324.pdf.
NCHRP (National Cooperative Highway Research Program). 2003. State DOT outsourcing and private-sector utilization, a synthesis of highway practice. Washington, DC: Transportation Research Board.
NCHRP (National Cooperative Highway Research Program). 2009. Performance-based contracting for maintenance. Washington, DC: Transportation Research Board.
Pedersen, B. J. 2009. “13 of 18 state run rest stops to be shut.” Accessed October 3, 2022. https://tucson.com/news/local/govt-and-politics/of-state-run-rest-stops-to-be-shut/article_6aa59a30-b6b0-5f2a-a4b1-2807755832e4.html.
Perfater, M. A. 1989. “Operation and motorist usage of interstate rest areas and welcome centers in Virginia.” Transp. Res. Rec. 1224 (May): 46–53.
Polansky, R., and A. Galal. 2019. “State’s highway rest stops now completely open.” Accessed October 3, 2022. https://www.wfsb.com/news/state-s-highway-rest-stops-now-completely-open/article_4caaab8a-9be7-11e9-b887-23fe9624e085.html.
Poole, R. W. 2021. Rethinking interstate rest areas. Los Angeles: Reason Foundation.
Prouty, D. 1993. “Privatization of rest area maintenance.” In Iowa Department of Transportation. Des Moines, Iowa: Legislative Fiscal Bureau.
Ribreau, N. 2003. “Synopsis of WSDOT’s review of highway maintenance ‘outsourcing’ experience.” In Proc., Annual Conf. Transportation Research Board. Washington, DC: Transportation Research Board.
Savage, I. 1997. “Scale economies in United States rail transit systems.” Transp. Res. Part A Policy Pract. 31 (6): 459–473. https://doi.org/10.1016/S0965-8564(97)00003-7.
Segal, G. F., A. T. Moore, and S. McCarthy. 2003. “Contracting for road and highway maintenance.” In How—to Guide no. 21. Los Angeles: Reason Foundation.
Shrestha, K. 2016. “Framework of performance-based contracting for chip seal and striping maintenance activities.” Ph.D. dissertation, Dept. of Civil and Environmental Engineering and Construction, Univ. of Nevada.
Shrestha, K., A. Berg, T. Mohammadsoroush, and K. Kisi. 2022. “Comparing the operation cost of Washington safety rest areas with other states using performance-based method.” In Proc., 9th Int. Conf. on Construction Engineering and Project Management, 640–648. Seoul, Republic of Korea: International Consortium of Construction Engineering and Project Management.
Shrestha, K., and M. Powers. 2018. “Performance-based contracting for maintaining rest area stops.” In Proc., 54th ASC Annual Int. Conf., Associated Schools of Construction, 577–584. Cheyenne, WY: Associated Schools of Construction.
Shrestha, K., and P. P. Shrestha. 2014. “An evaluation of current practices of road maintenance contracting methods.” In Proc., Construction Research Congress 2014: Construction in a Global Network. Reston, VA: ASCE.
Shrestha, K., and P. P. Shrestha. 2022. “Framework to implement performance-based contracting for chip-seal road maintenance.” J. Constr. Eng. Manage. 148 (1): 04021183. https://doi.org/10.1061/(ASCE)CO.1943-7862.0002207.
Shrestha, K., P. P. Shrestha, and M. Lidder. 2019. “Life-cycle cost comparison of chip seal and striping: In-house workers versus private contractors.” Eng Constr. Archit. Manage. 26 (6): 927–944. https://doi.org/10.1108/ecam-07-2018-0314.
Shrestha, P. P., K. Shrestha, and V. Joshi. 2012. “Investigation of unbalanced bidding for economic sustainability.” In Proc., 2nd Int. Conf. on Sustainable Design, Construction, and Engineering, Construction Institute. Reston, VA: ASCE.
Shrestha, P. P., K. Shrestha, and M. Lidder. 2017a. “Factors affecting the selection of in-house and outsourcing road maintenance methods and assessment of their benefits.” J. Infrastruct. Syst. 23 (1): 06016001. https://doi.org/10.1061/(ASCE)IS.1943-555X.0000315.
Shrestha, P. P., K. Shrestha, and M. Lidder. 2017b. “Quality of road maintenance work performed by state force versus private contractors in Nevada.” Pract. Period. Struct. Des. Constr. 22 (4): 04017012. https://doi.org/10.1061/(ASCE)SC.1943-5576.0000326.
Stankevich, N., N. Qureshi, and C. Queiroz. 2009. “Performance-based contracting for preservation and improvement of road assets.” Accessed October 3, 2022. http://www.esd.worldbank.org/pbc_resource_guide/Docslatest%20edition/PBC/trn_27_PBC_Eng_final_2005.pdf.
Sultana, M., A. Rahman, and S. Chowdhury. 2012. “Performance based maintenance of road infrastructure by contracting—A challenge for developing countries.” J. Serv. Sci. Manage. 5 (2): 118–123. https://doi.org/10.4236/jssm.2012.52015.
Utt, R. D. 2009. “Privatizing rest stops allows states to serve motorists and increase revenues.” Accessed October 3, 2022. http://thf_media.s3.amazonaws.com/2009/pdf/wm2724.pdf.
VDOT and VED (Virginia DOT and Virginia Economic Development). 1998. “The upgrade of rest areas on Virginia’s interstate highways.” Accessed May 9, 2023. https://rga.lis.virginia.gov/Published/1998/HD16/PDF.
Zach. 2021. “What is considered a good standard deviation?” Accessed May 9, 2023. https://www.statology.org/what-is-a-good-standard-deviation/.
Zietlow, G. 2004. “Implementing performance-based road management and maintenance contracts in developing countries—An instrument of German technical cooperation.” Accessed May 9, 2023. http://zietlow.com/docs/pbmmc-gtz.pdf.
Information & Authors
Information
Published In

Journal of Construction Engineering and Management
Volume 149 • Issue 8 • August 2023
Copyright
This work is made available under the terms of the Creative Commons Attribution 4.0 International license, https://creativecommons.org/licenses/by/4.0/.
History
Received: Oct 7, 2022
Accepted: Mar 22, 2023
Published online: May 23, 2023
Published in print: Aug 1, 2023
Discussion open until: Oct 23, 2023
ASCE Technical Topics:
- Benefit cost ratios
- Business management
- Comparative studies
- Contracts and subcontracts
- Data analysis
- Employees
- Employment
- Engineering fundamentals
- Financial management
- Highway and road management
- Highway transportation
- Highways and roads
- Infrastructure
- Methodology (by type)
- Personnel management
- Practice and Profession
- Research methods (by type)
- Transportation engineering
Authors
Metrics & Citations
Metrics
Citations
Download citation
If you have the appropriate software installed, you can download article citation data to the citation manager of your choice. Simply select your manager software from the list below and click Download.