The Anisotropy of Rock Drilling in Marble Quarry Mining Based on the Relationship between Vertical and Horizontal Drilling Rates
Publication: International Journal of Geomechanics
Volume 24, Issue 10
Abstract
There is a high correlation between rock engineering behavior and the anisotropy index, which is crucial for the safety assessment of rock properties. In rock drilling, rock anisotropy significantly affects the cost and efficiency of the drilling project. Therefore, the anisotropy during the rock drilling process is investigated in this study. First, measurements of horizontal and vertical drilling rates were conducted at a marble quarry. Then, experimental tests were conducted to measure the physical and mechanical properties of collected minor rock blocks corresponding to the major under-drilling marble blocks. Through this process, a total of 40 data sets comprising vertical and horizontal drilling rates and 12 different rock properties were provided. The results showed that the vertical drilling rate correlates more with rock mechanical properties, while the horizontal drilling rate is associated more with physical characteristics. Also, sensitivity analysis confirmed that porosity and dry density are the most and least effective variables on both vertical and horizontal drilling rates, respectively. Based on the analysis of variance, the polynomial equation was found to be the optimum relationship between vertical and horizontal drilling rates. Based on the comparative analysis and using actual data sets, the accuracy of the proposed equation was proved. Finally, a drilling anisotropy index was proposed based on the ratio of vertical to horizontal drilling rates. The results showed that the drilling anisotropy index is more prominent in rock blocks with high-strength properties. Also, it was proved that the drilling anisotropy index has an inverse relation with vertical and horizontal drilling rates. As the vertical and horizontal drilling rates are inherently affected by different rock properties, it can be concluded that the suggested relationship between vertical and horizontal drilling rates and the proposed drilling anisotropy index could be effectively applied to assessing the interaction of drilling rates with rock properties in anisotropic rocks.
Practical Applications
This study investigated the relationships between rock properties and vertical and horizontal drilling rates, which is one of the main issues in rock drilling operations. According to the field and laboratory results, the correlation between the physical and mechanical properties of rocks with vertical and horizontal drilling rates was achieved, which can be considered during the drilling operation to enhance the drilling efficiency. Also, a new drilling anisotropy index was proposed, which can help identify a good interaction between drilling tools and the rock environment in anisotropic rocks. In addition, a new relation was proposed between vertical and horizontal drilling rates, which can be applied in practice to predict one of them based on the other. Generally, the outputs of this research could be applied to specifying the relationship between rock properties and vertical and horizontal drilling rates, emphasizing the drilling anisotropy index. In practice, the study outputs can lead to enhanced drilling efficiency and mine productivity in marble quarry mining by providing a deep knowledge of rock interaction with drilling tools while drilling in both the vertical and horizontal directions and choosing proper drilling tools for the under-drilling rock type.
Introduction
Rock drilling is one of the most important processes in open pit and quarry mining operations. In the drilling process, the estimation of an equipment’s drilling rate (DR) is essential for the cost assessment, so that, increasing the drilling efficiency decreases a mine’s operational costs. Conversely, understanding the parameters contributing to DR is essential to successfully planning the drilling process. Hence, the rock drillability index of different rocks has been studied by numerous researchers, who evaluated the relationship between different rock properties and DR for an accurate estimation of this parameter (Kahraman 2003; Kahraman et al. 2003; Hoseinie et al. 2008; Bilim 2011; Yasar et al. 2011; Hoseinie et al. 2014).
In quarry mines, rock drilling is a time-consuming task that affects downstream processes, that is, cutting, slabbing, and polishing operations. Therefore, optimizing the drilling operation based on the accurate estimation of the equipment’s DR is one of the most important issues in quarry mining because of its effect on subsequent activities. Rotary, diamond, and percussive drilling systems are usually used in surface mining, such as open-pit and quarry mining operations. A better knowledge of the interaction of the drilling tools with rock mass properties can help in a precise prediction of the drilling rate, appropriate selection of the drilling system, and determination of the type and number of required drilling tools. In fact, a broader goal is an accurate evaluation of the mine’s drilling efficiency and production capacity to increase the mining productivity (Stavropoulou 2006; Hoseinie et al. 2009; Yarali and Soyer 2011, 2013; Demirdag et al. 2014; Saeidi et al. 2014; Ataei et al. 2015; Capik et al. 2017; Krúpa et al. 2018; Derdour et al. 2018; Yenice et al. 2018; Shangxin et al. 2020; Kolapo 2021; Rezaei and Nyazyan 2023).
Generally, controllable and uncontrollable factors affect the DR in the rock drilling process. The characteristics of drilling tools and operational parameters [e.g., thrust load, rotations per minute (RPM)] are the controllable factors, whereas rock properties (lithological, physical, mechanical, and structural characteristics) are categorized as uncontrollable variables in rock drilling (Shangxin et al. 2020). In practice, optimizing the influence of uncontrollable factors (i.e., rock properties) is necessary through the selection of suitable drilling tools and the optimization of operational parameters. The anisotropy index (AI) is an important index that presents the influence of uncontrollable factors on the vertical drilling rate (VDR) and horizontal drilling rate (HDR), which is investigated in the current study.
Rock anisotropy is commonly deduced from the rock’s lithological, physical, and structural characteristics, i.e., weathering, porosity, mineral composition, grains size, and presence of macro- and microstructures (Kim et al. 2012; Khanlari et al. 2014; Wong et al. 2015). Diverse physical and mechanical characteristics can be observed in rocks containing foliation-based anisotropy (Cho et al. 2012; Heng et al. 2015). For instance, rock anisotropy affects the stability of surface and underground excavations, rock cutting, drilling, and blasting (Özbek et al. 2018). Several studies have been conducted to calculate rocks’ AI. To determine the AI in sedimentary and foliated rocks, it was commonly recommended that the rock properties be measured perpendicular and parallel to the bedding/foliation structure (Femiak et al. 2022). Moreover, experimental and theoretical studies have investigated anisotropic rock behavior (Thomsen 1986; Khanlari et al. 2015). The aforementioned studies have shown that the physical and mechanical properties of anisotropic rocks are variable as the specimens are prepared in different sampling directions. Also, it has been demonstrated that depending on the degree of anisotropy, some effective errors may occur in the measured rock properties when the anisotropic rock behavior is not considered in rock engineering projects (Cho et al. 2012).
Reviewing the related studies indicates that they primarily addressed the anisotropy of deformation, elastic modulus, compressive, shear, and tensile strengths, as well as point load index and wave velocity (Thomsen 1986; Singh et al. 1989; Tsidzi 1990; Ramamurthy 1993; Tsidzi 1997; Saroglou and Tsiambaos 2007; Gurevich et al. 2011; Shen et al. 2015; Ma et al. 2018; Femiak et al. 2022). However, there have been a few studies of the anisotropy of rock drilling rates, also called the drilling anisotropy index (DAI) (Boualleg et al. 2007; Thuro and Schormair 2008; Abugharara 2019). The DAI can be applied to evaluate the effect of rock anisotropy on rock drilling rates, which inherently indicates the effects of all possible rock properties, including mineralogical, structural, physical, and mechanical characteristics. Nevertheless, measurement of the DAI in the field drilling operation is very challenging in practice since determining the rock anisotropy is also required (Zheng et al. 2018; He et al. 2023).
To cover the aforementioned gaps, the anisotropy index is investigated in this study based on the combination of VDR and HDR while taking into consideration all possible rock properties. The most important advantage of this research is that the effects of all possible physiomechanical properties of the rock are concurrently considered during measurement of VDR and HDR. Also, a novel DAI and a new VDR–HDR relation are proposed while considering the effect of rock anisotropy. The main innovation of the current research is that the anisotropy of the physical properties of a rock is intrinsically regarded in the proposed DAI, which was ignored in most previous studies. Finally, the outputs of this study can ultimately improve the drilling efficiency in anisotropic rocks.
Materials and Methods
In this study, a suitable database was prepared based on the field and laboratory measurements. For this purpose, the time and length of drilling were first recorded during the drilling operation of the Malawi marble quarry mine to measure VDR and HDR. After the field study, sufficient minor blocks corresponding to the underdrilling major marble blocks were collected and transferred to the laboratory for preparing sufficient core specimens and conducting required experiments.
Studied Mine Site
The Malawi marble quarry mine is located in the Islamabad-e-Gharb, Kermanshah province, Iran. This mine consists of a measured reserve of 1,250,000 t with annual extraction of 8,000 t. The studied mine is located at the latitude of 46° 36′ 35.033″ and the longitude’ of 34° 3′ 53.41″ in the southeast of Islamabad-e-Gharb city, at the left side of Islamabad-e-Gharb-Homeil way. The quarry mining method is also used for rock extraction in this mine. Fig. 1 shows the mine area along with one of the working bench faces, indicating the considerable horizontal lamination/bedding and a slight vertical stratification. The dominant rock of the mine is dolomite, which involves some vertical and horizontal laminations and bedding, as demonstrated in Fig. 1. The presence of bedding/laminations can cause anisotropies during drilling operations, which is the main focus of this study.
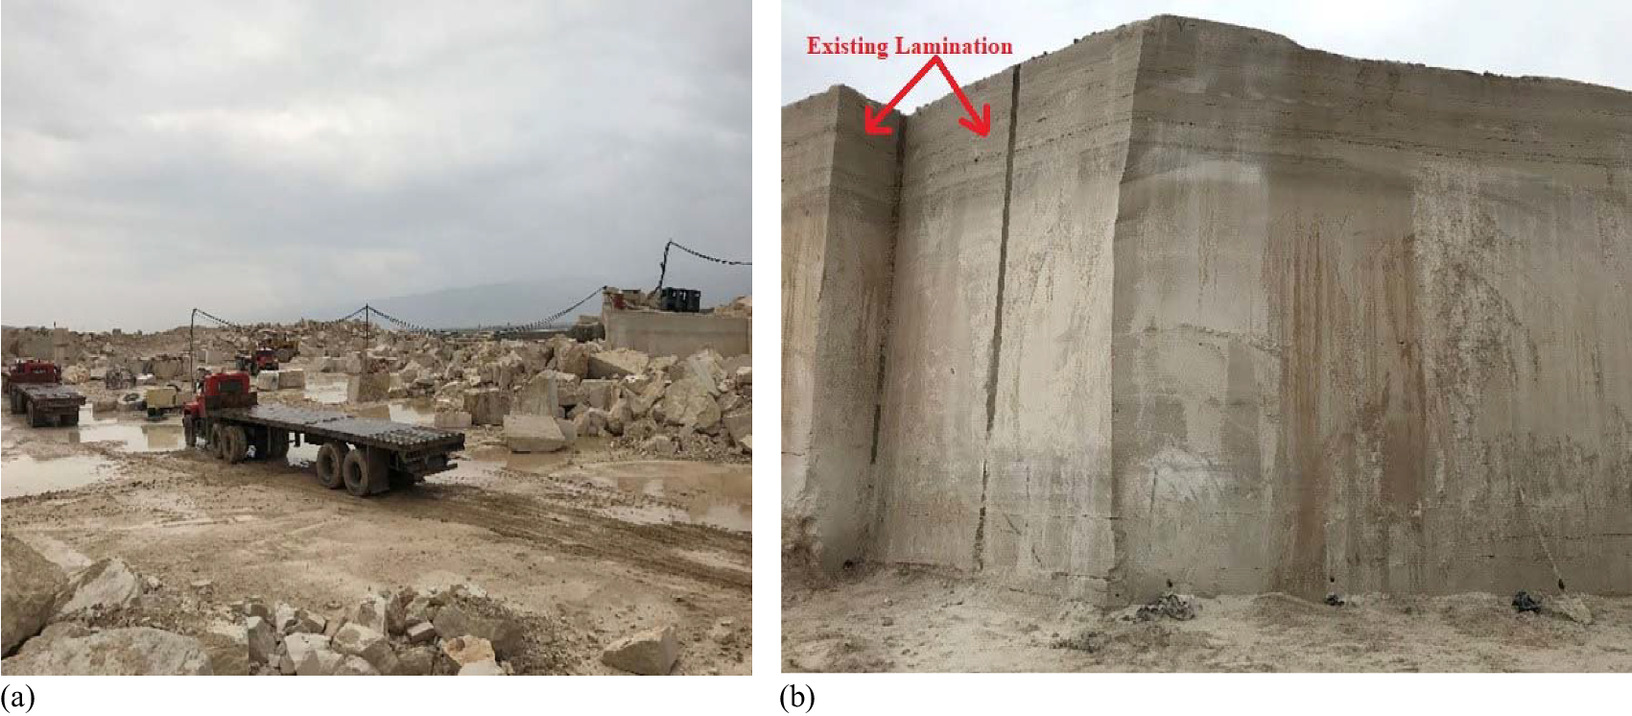
Fig. 1. View of (a) Malawi marble quarry mine along with a (b) working face, indicating lamination/beddings.
(Images by authors.)
It is important to note that the mine blocks investigated in this study displayed no open joints (as shown in Fig. 1), a common feature in quarry mine settings. When conducting a comparable investigation in other jointed rock formations, it is recommended to map all types of discontinuities, including open joints, using the methods suggested by the International Society for Rock Mechanics (ISRM).
From the geological viewpoint, the studied area is located in the folded Zagros zone. The general trend of this zone in Iran’s geological map is approximately northwest–southeast. In general, the Malawi mine environment is a sedimentary area and its sediments are mainly chemical in which marl and shale are also seen partially. Hence, there are chemical sediments in the mine area and no magmatism activity is seen in this basin. In terms of geological age, the area of study belongs to the upper Eocene and its dominant constituent rocks are mostly Shahbazan type with the dolomite rocks.
As previously mentioned, horizontal stratified structures are more dominant than the vertical stratified structures in the studied marble quarry mine. That means, there are both horizontal and vertical laminations (not just horizontal) in the mine, but the intensity of horizontal stratification is greater and it is clearly visible, as demonstrated in Fig. 1. However, field surveys showed that bedding thickness in this case study varies from 0.5 to 4 m. Because both vertical and horizontal drillings were conducted on a rock block, it was possible to consider the effect of the anisotropy index on the VDR and HDR even if only one of the aforementioned stratified structures exists. Conversely, the considerable difference between VDR and HDR values in a same marble block can prove the existence of at least one lamination (vertical or horizontal) in that block.
Field Investigations
A field investigation was conducted to measure VDR and HDR during the drilling operation of the Malawi marble quarry mine. For the field measurements, numerous marble blocks and working faces were investigated. In blocks with horizontal lamination/beddings, both VDR and HDR parameters were measured. Conversely, these drilling rates were also recorded in blocks with vertical lamination/beddings. This leads to determining drilling rates in different directions. As the mine working faces are jointless, a joint study was ignored in this research. Therefore, only the effect of bedding/laminations on drill rate anisotropy was investigated rather than the joints.
In this mine, the pneumatic RASOL device was used for drilling in both vertical and horizontal directions [Fig. 2(a)]. Low-capacity compressors of up to 12 bars with low consumption were used to supply the thrust load of the drilling machine, as shown in Fig. 2(a). The used pneumatic RASOL can drill holes with a diameter in the range of 70–152 mm; however, holes with a diameter of 90 mm are frequently drilled in this mine. This hole diameter size is preferred in Iranian quarry mines due to the easier accessibility of its related drilling tools in Iran. Hence, holes with a diameter of 90 mm are commonly drilled in quarry mines. A diamond wire saw machine [Fig. 2(b)] was also used to cut and separate the marble blocks from the bench face and create the desired cubes and slates. Finally, water was utilized for cooling objects during the rock drilling and cutting processes.
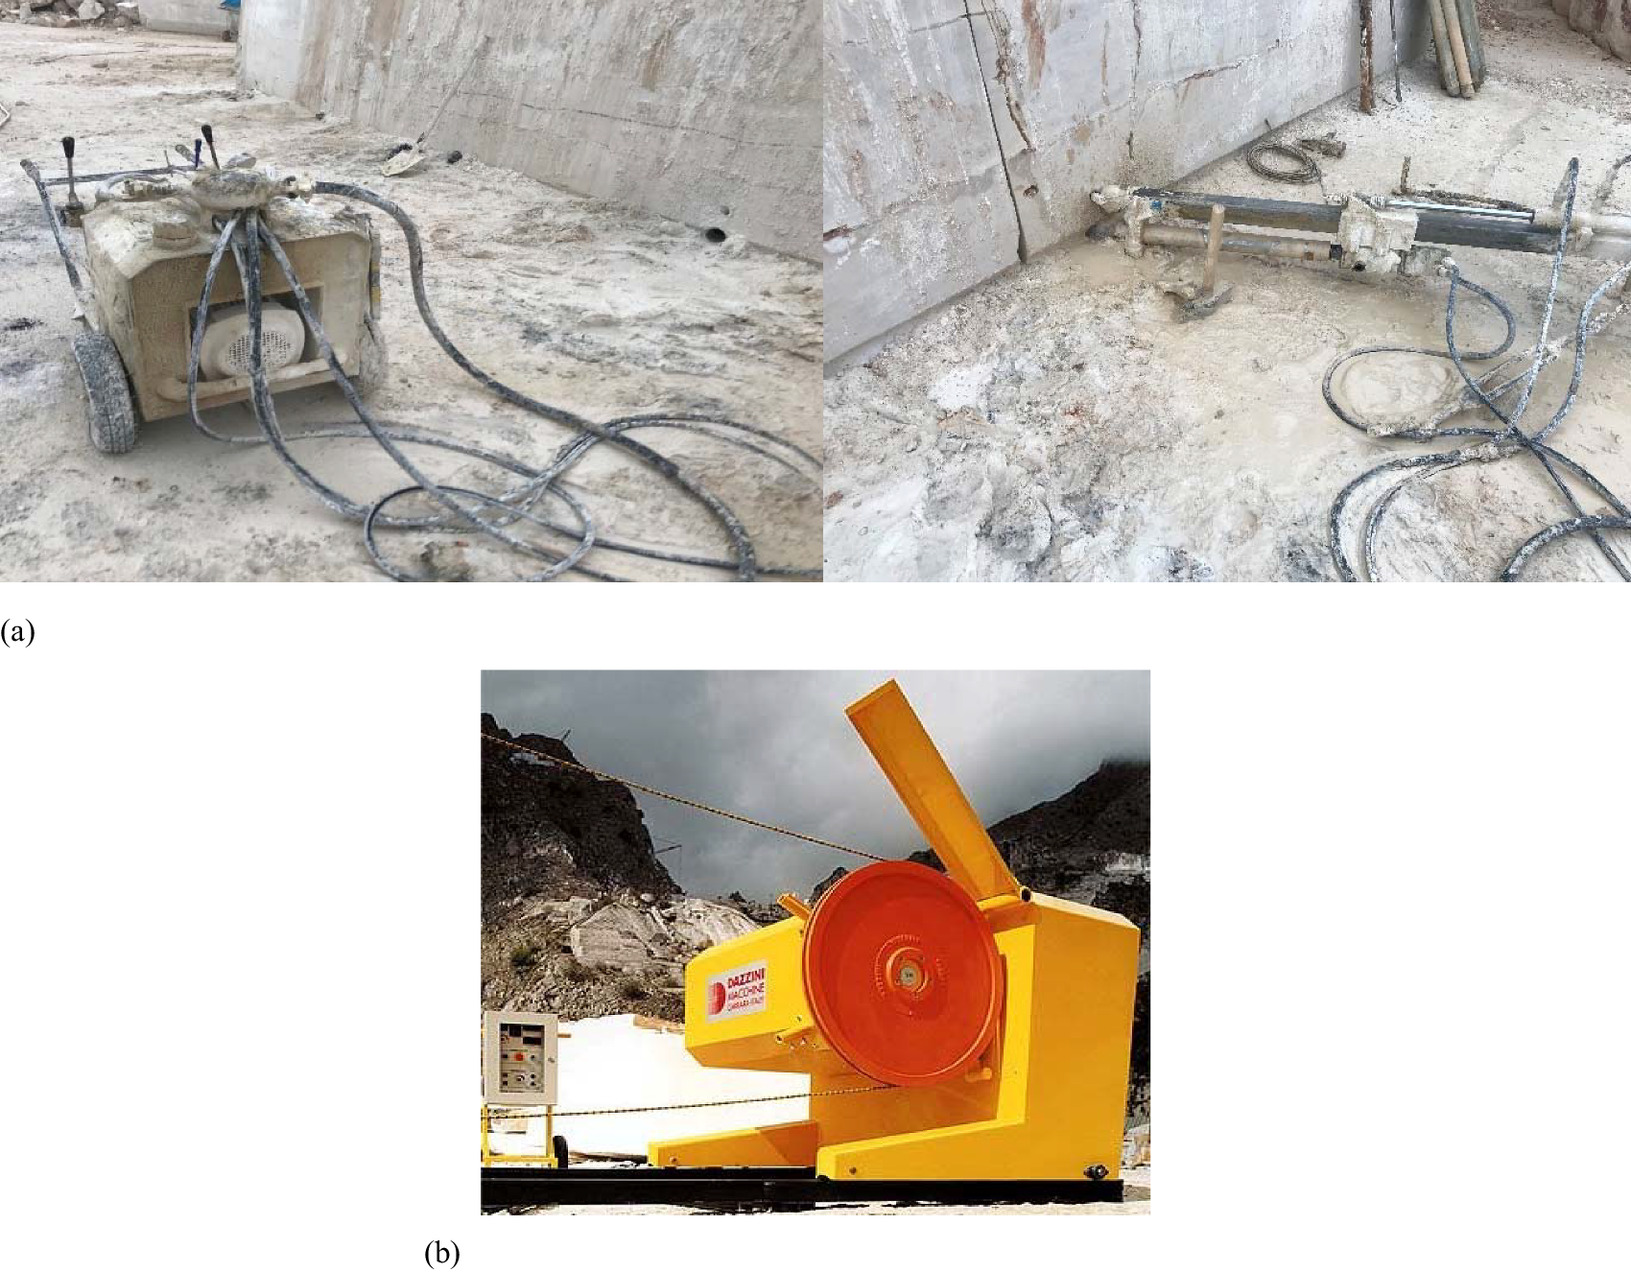
Fig. 2. (a) Pneumatic RASOL device and thrust load tools; and (b) diamond wire saw machine.
(Images by authors.)
From the field measurements, the drilling time and depth of the drilled holes were recorded in both vertical and horizontal conditions. Since the drill bit condition can influence the drilling rate, relatively new drill bits with constant conditions were used for both horizontal and vertical drillings. Thus, this parameter was kept constant for VDR and HDR measurements. A total of 40 field measurements (20 separate records for each VDR and HDR) were conducted in the drilling operations of the Malawi marble quarry mine. These records were conducted in 20 under-drilling major blocks in which VDR and HDR were measured for each block. Ten samples of field measurements and their related geological conditions are given in Table 1. After field measurements, some minor marble blocks corresponding to the under-drilling major blocks were collected to prepare sufficient core specimens and perform required laboratory experiments.
| No. | Drilling type | Drilling length (m) | Drilling time (h) | Drilling direction versus beddings/lamination |
|---|---|---|---|---|
| 1 | Vertical | 15 | 3 | Parallel |
| 2 | Vertical | 14 | 5 | Perpendicular |
| 3 | Vertical | 13 | 2.45 | Parallel |
| 4 | Vertical | 12 | 3 | Perpendicular |
| 5 | Vertical | 9 | 3 | Parallel |
| 6 | Horizontal | 6 | 2.5 | Parallel |
| 7 | Horizontal | 10 | 2 | Perpendicular |
| 8 | Horizontal | 6 | 3 | Parallel |
| 9 | Horizontal | 5 | 1 | Perpendicular |
| 10 | Horizontal | 6 | 3 | Parallel |
Laboratory Experiments
After the field measurements were taken to calculate VDR and HDR, sufficient minor blocks corresponding to the under-drilling major blocks were collected and transferred to the laboratory to prepare the core specimens and conduct the required experiments. Since some of the laboratory experiments may have failed during testing, sufficient minor blocks were collected and adequate core specimens were prepared to conduct the required tests. Therefore, the prepared core samples correspond to the drilled location, and they are representative of the actual location of the drilled rock block. The collected minor blocks and the core samples taken from them had the same lamination/bedding as the under-drilling major blocks. Therefore, tested core specimens in the laboratory are representative of under-drilling major marble blocks in the mine and are representative of their existing lamination property.
To measure the rock’s physiomechanical properties, laboratory experiments were performed on cylindrical core specimens (for mechanical tests, P-wave velocity, density), minor blocks [for Schmidt hammer rebound (SHR) test], and small irregular samples [for porosity, water absorption, durability index, and Los Angeles abrasion (LAA) tests]. The core specimens were prepared from the collected minor blocks corresponding to the major marble blocks of the studied mine with dimensions of 20 × 25 cm. The coring device and some of the prepared core samples are represented in Fig. 3. The two ends of the cores and their outer surfaces are polished based on the ISRM (2007) suggested method. However, core samples were prepared in a diameter of 90 mm to match the diameter of the drilled holes in the studied mine as it is obvious in Fig. 3. To cover the anisotropy effects of all possible rock properties on the VDR and HDR, 12 rock characteristics were measured in the laboratory. The parameters are ρn, ρd, n, wa, Id, SHR, Vp, LAA, point load index (PLI), uniaxial compressive strength (UCS), E, and ν, which were measured based on the ISRM (2007) suggested procedures. The testing equipment and tools used in this study are shown in Fig. 4. However, in this study, point load index tests were conducted on both core and lump rock samples. The samples were loaded in axial and diametral directions (for core samples) and block or lump tests. For each rock block, up to 10 tests were conducted, and the average of the obtained values was considered as the point load index value of that block.
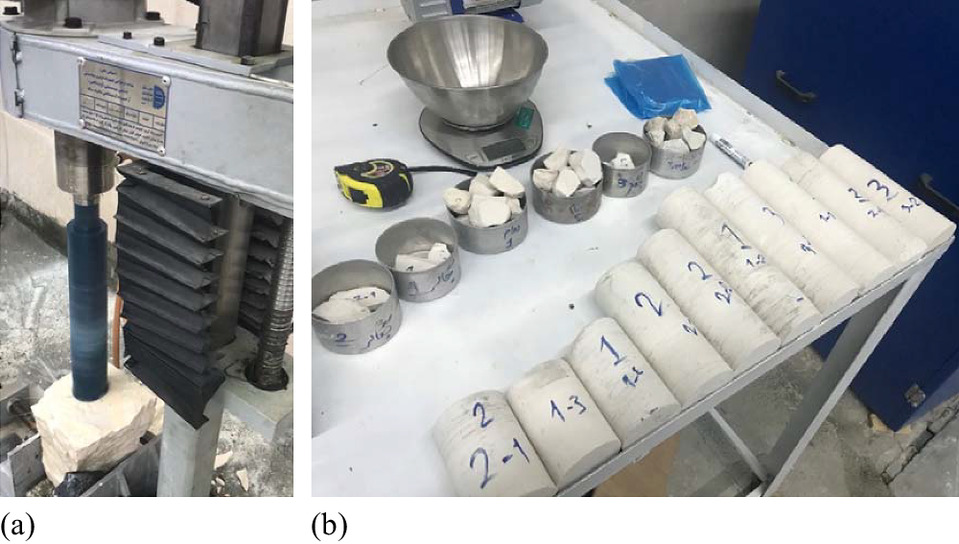
Fig. 3. (a) Used coring device; and (b) some of the prepared core specimens and irregular samples.
(Images by authors.)
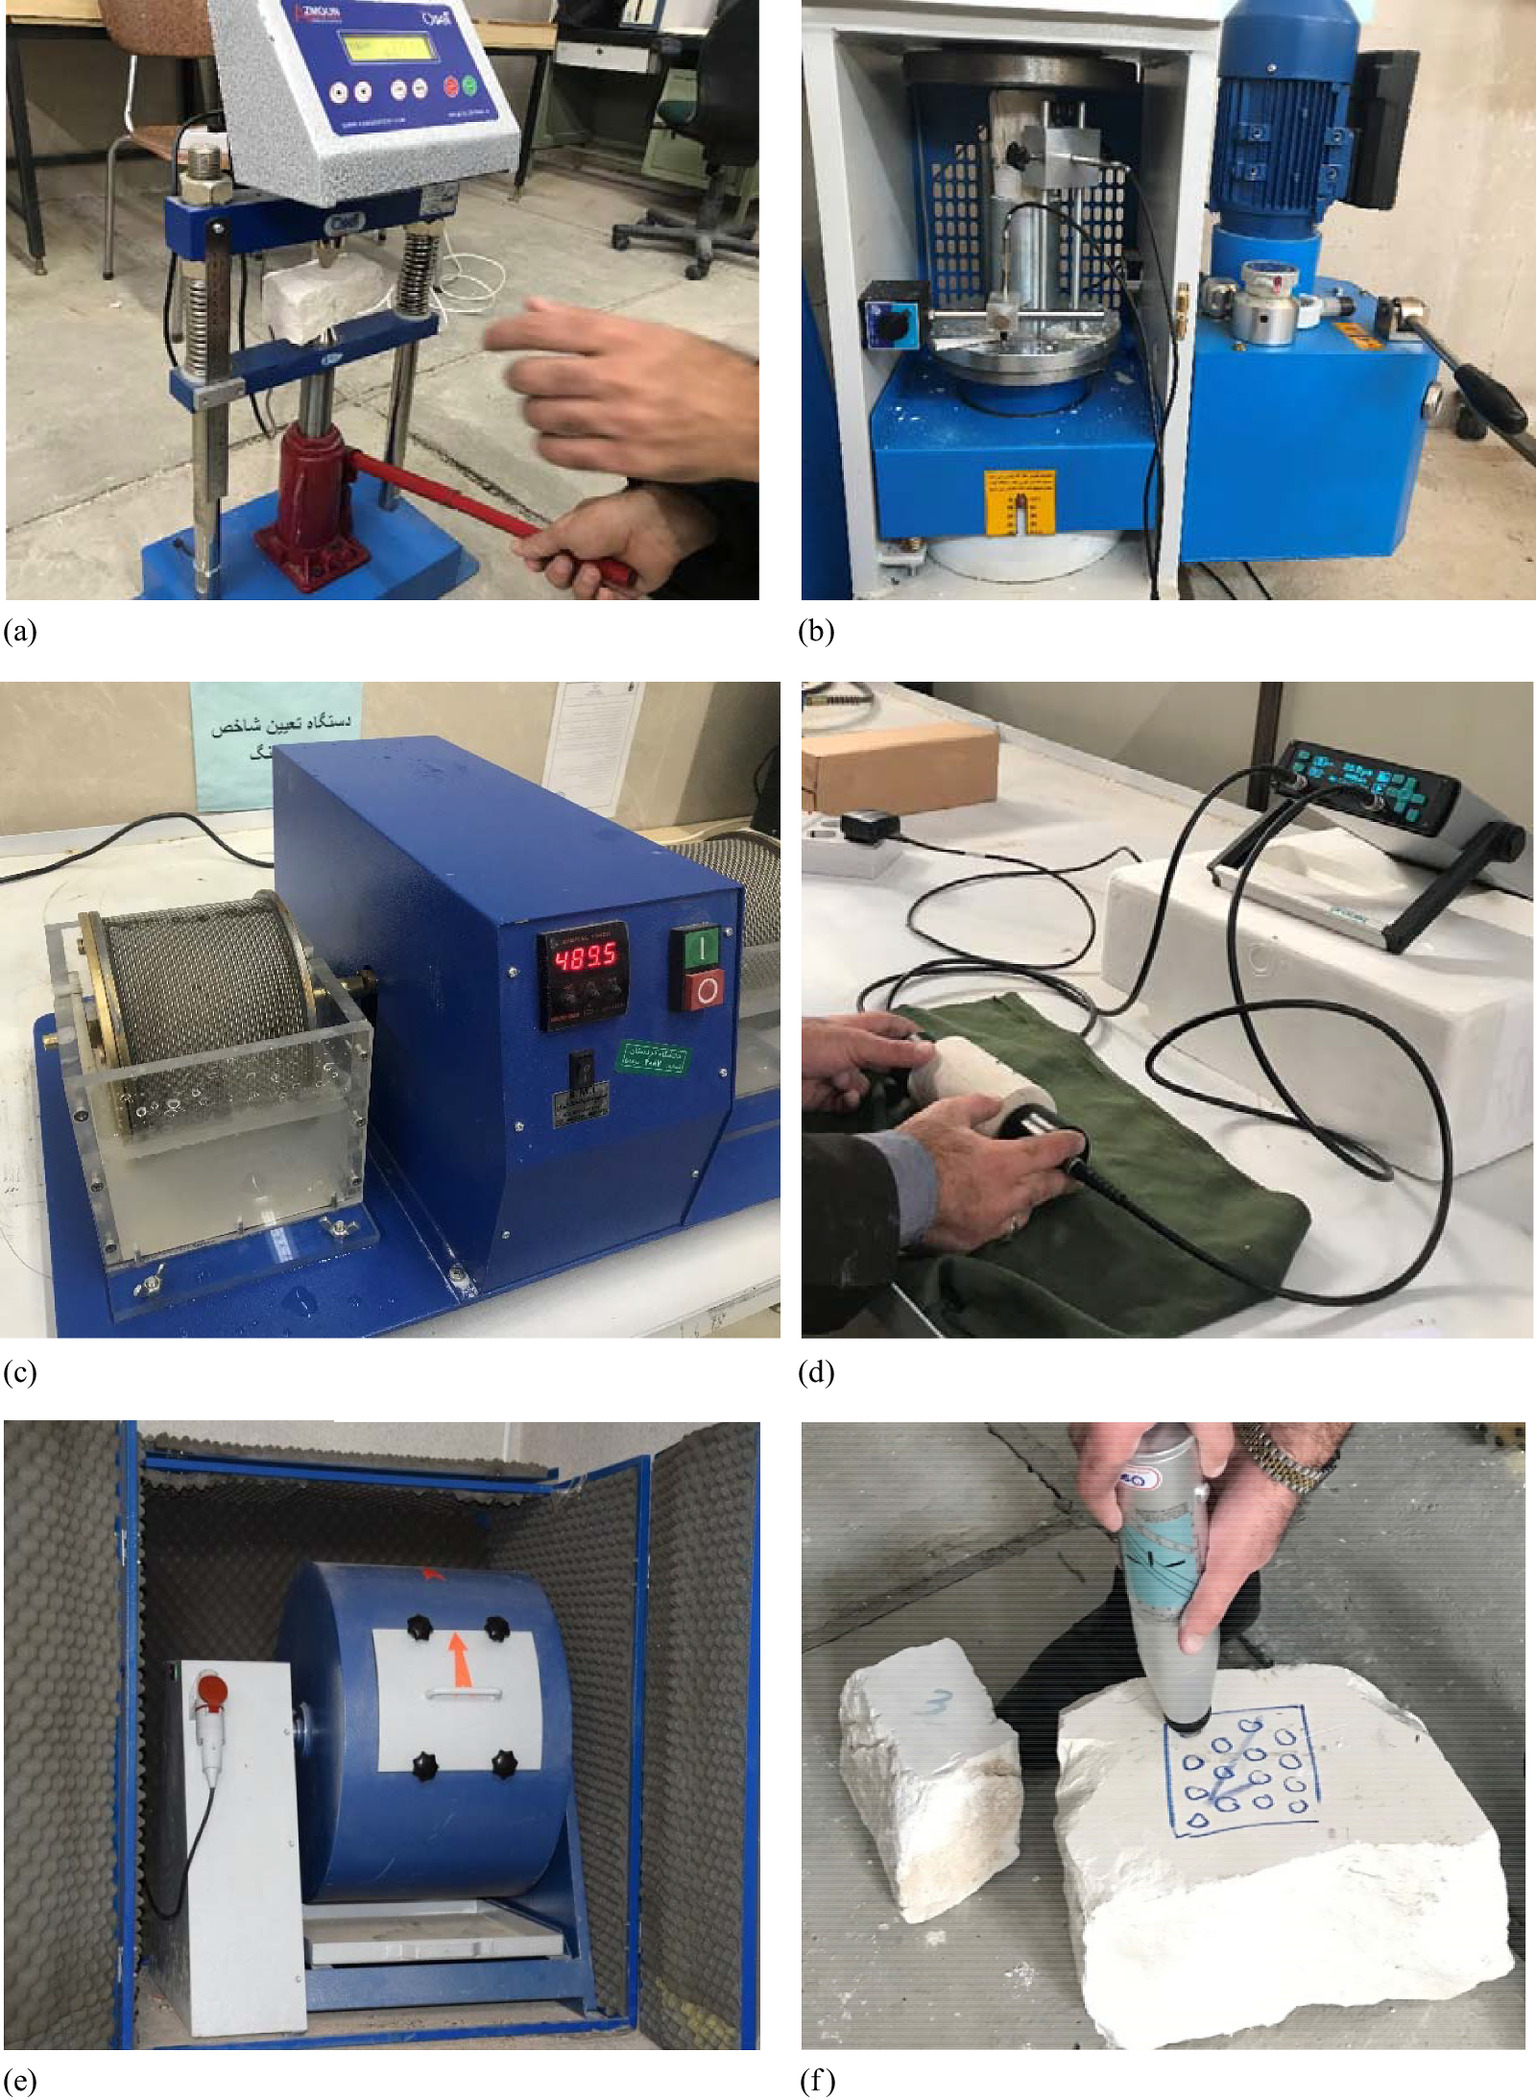
Fig. 4. Utilized tools to implement laboratory tests: (a) applied tools for PLI measurement; (b) uniaxial compression machine to determine UCS, E, and ν; (c) Id measurement tool; (d) PUNDIT tool to determine Vp; (e) LAA test device; and (f) Proceq tool to measure SHR.
(Images by authors.)
As mentioned previously, in this study laboratory tests were conducted based on the ISRM (2007) suggested standards. However, for the index tests (i.e., Vp, SHR, and PLI), 10 repetitions were conducted for each test. The outlier and out-of-line values (very high and very low values that were very different from the others) were removed in these tests and the average of the remaining values was considered as the final value of the tested parameter. However, for the physical and mechanical tests (including density, porosity, water absorption, Los Angeles abrasion, and UCS tests), only one test was conducted for a rock block unless the test result was unacceptable due to operator error or a defect of the used devices. For example, if the specimen failure after loading was not relatively parallel to the loading axis in the UCS test, the test was considered a failure and repeated. This methodology was used for all other conducted tests.
For considering the lamination-induced anisotropy in the laboratory experiments, coring operation was first conducted both parallel and perpendicular to the existing lamination in the under-drilling minor blocks. Accordingly, the prepared rock samples involved some lamination corresponding to the under-drilling blocks. Hence, rock specimens in PLI and UCS tests were separately loaded in both conditions i.e., parallel and perpendicular to the lamination/bedding and the effect of rock anisotropy in these tests was attained consequently. Besides, based on the existing longitudinal or transverse lamination in the specimens, the effect of anisotropy was also achieved in the P-wave velocity test.
Through performing the aforementioned tests in conjunction with field investigations, a suitable database of 20 trustworthy data, including 12 different rock properties, was prepared for analyzing the VDR and HDR. These data sets are related to the 20 separate field records of VDR and HDR. Table 2 presents the statistical analysis of the tested rock samples along with their corresponding VDR and HDR values measured in the field.
| Parameter | Symbol | Max | Min | Var. | Std. dev. |
|---|---|---|---|---|---|
| Poisson’s ratio (−) | ν | 0.39 | 0.2 | 0.002652 | 0.0515 |
| Durability index (%) | Id | 0.993 | 0.96 | 7.91 × 10⁻⁵ | 0.008893 |
| Natural density (g/cm3) | ρn | 2.517 | 2.22 | 0.00838 | 0.09155 |
| Elastic modulus (GPa) | E | 35.1 | 10.11 | 38.2837 | 6.1873 |
| Porosity (%) | n | 2.11 | 0.43 | 0.1459 | 0.3820 |
| Point load index (MPa) | PLI | 4.6 | 1.09 | 0.90528 | 0.95146 |
| Dry density (g/cm3) | ρd | 2.45 | 2.21 | 0.00588 | 0.07671 |
| Uniaxial compressive strength (MPa) | UCS | 65.12 | 12.96 | 197.7189 | 14.0612 |
| Water absorption (%) | wa | 6.84 | 1.91 | 2.0112 | 1.4181 |
| P-wave velocity (m/s) | Vp | 4,321 | 3,651 | 38,411.08 | 195.987 |
| Los Angeles abrasion (%) | LAA | 68.74 | 28.23 | 114.5243 | 110.7016 |
| Schmidt hammer rebound (−) | SHR | 73 | 46 | 45.7493 | 6.7838 |
| Horizontal drilling rate (cm/min) | HDR | 8.23 | 2.88 | 2.5985 | 1.61201 |
| Vertical drilling rate (cm/min) | VDR | 9.12 | 3.84 | 2.4526 | 1.56608 |
Results and Discussion
Dependency of DRs on Rock Properties
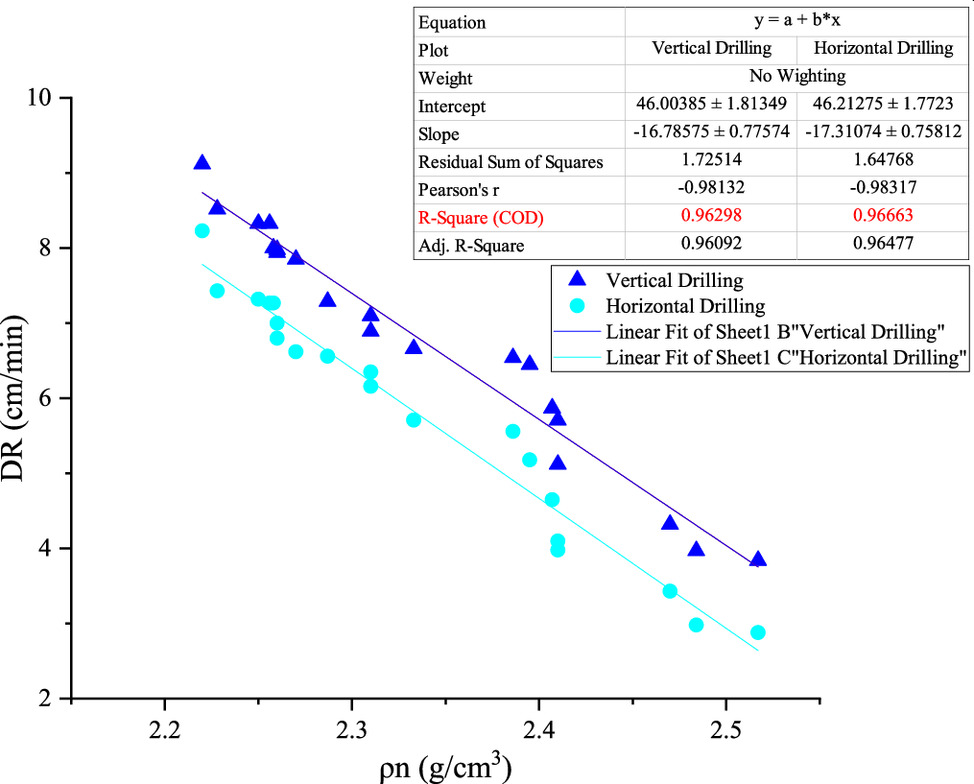
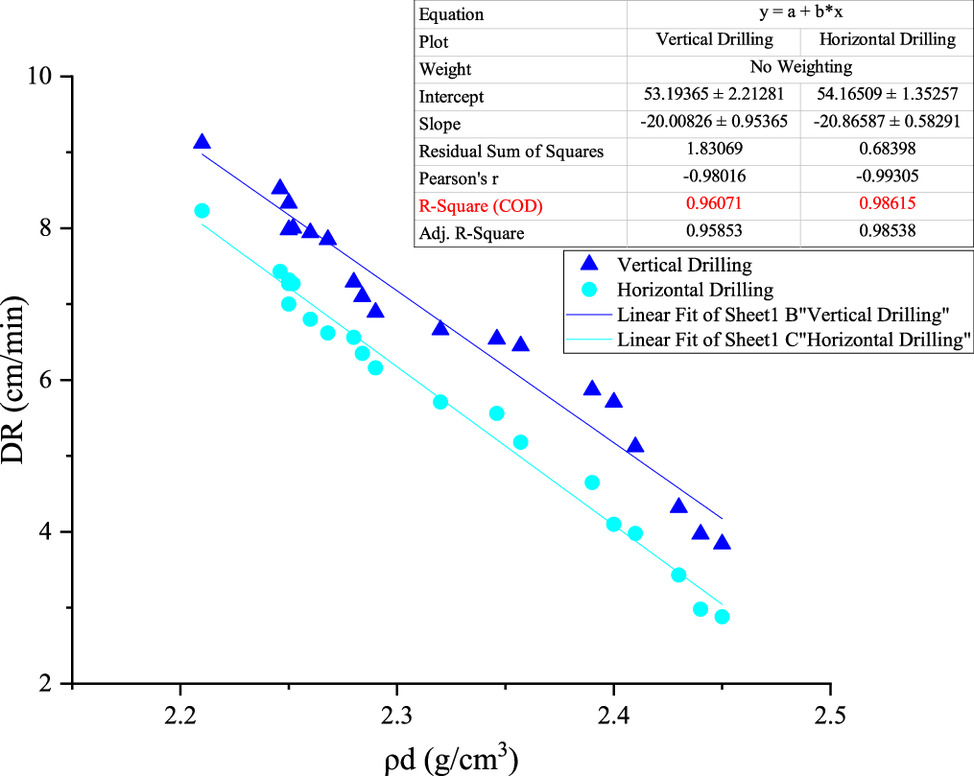
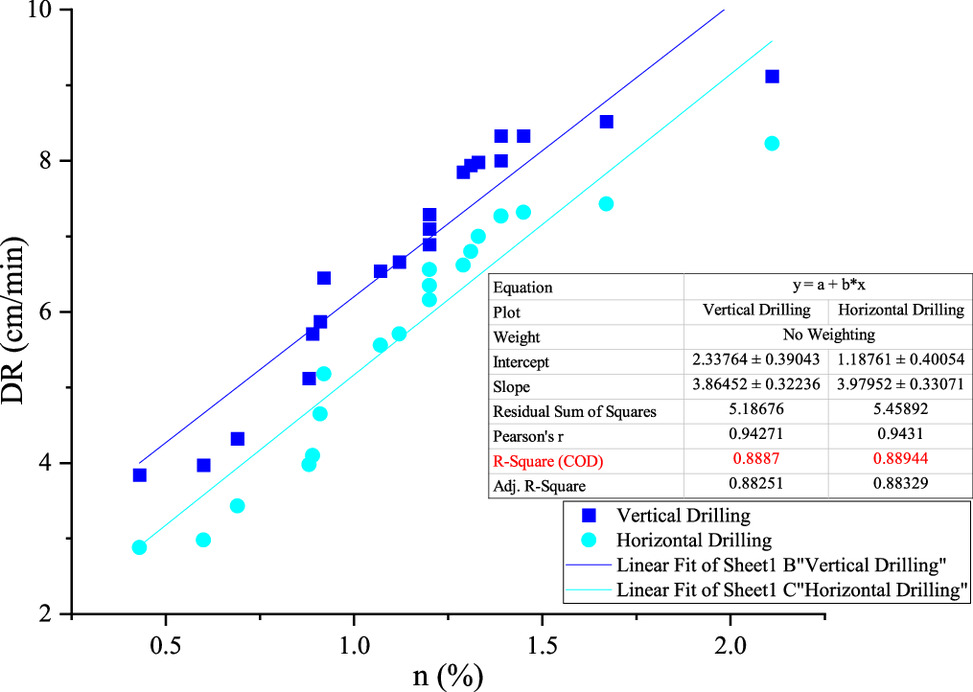
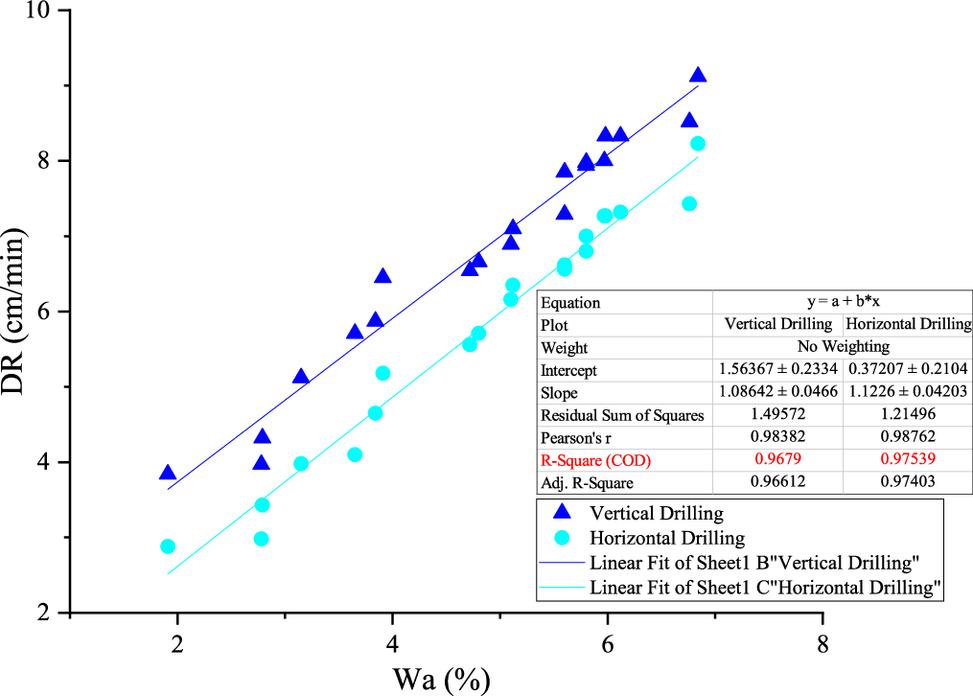
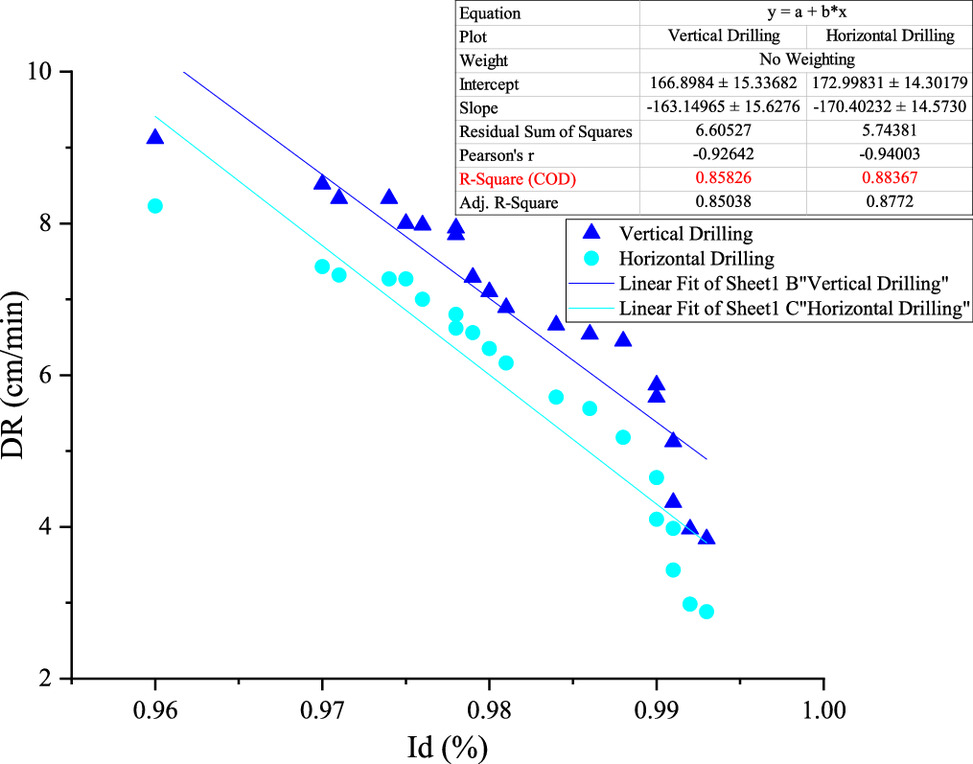
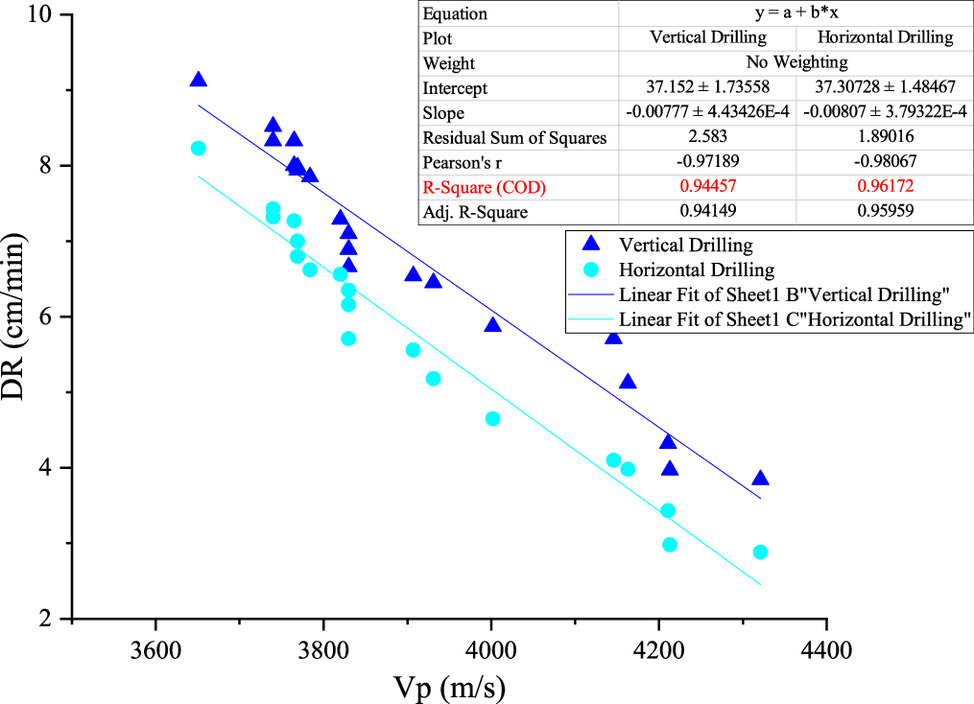
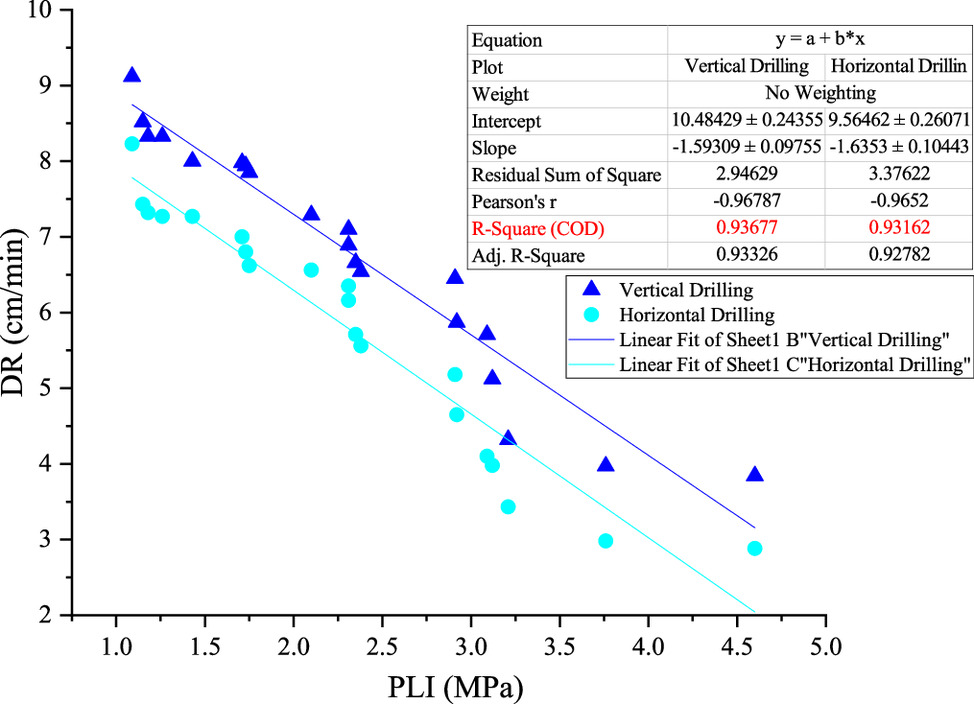
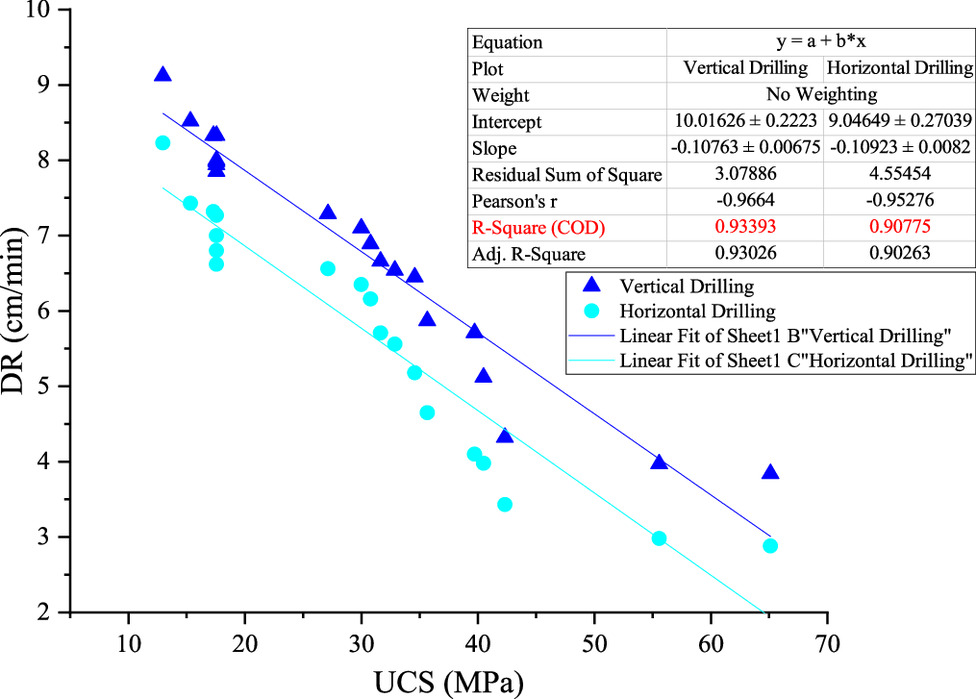
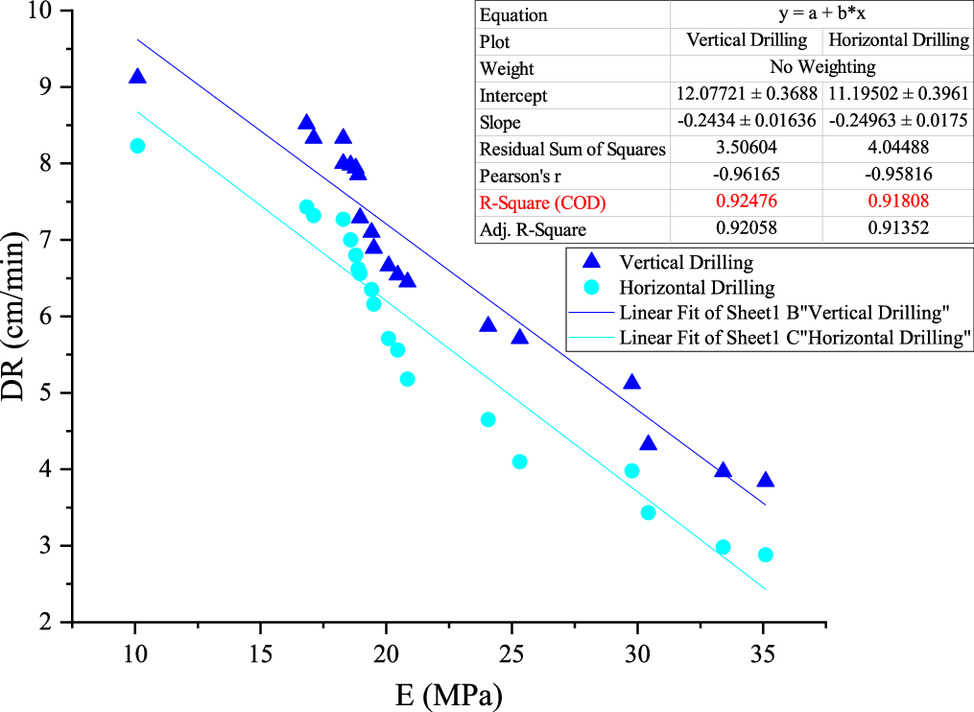
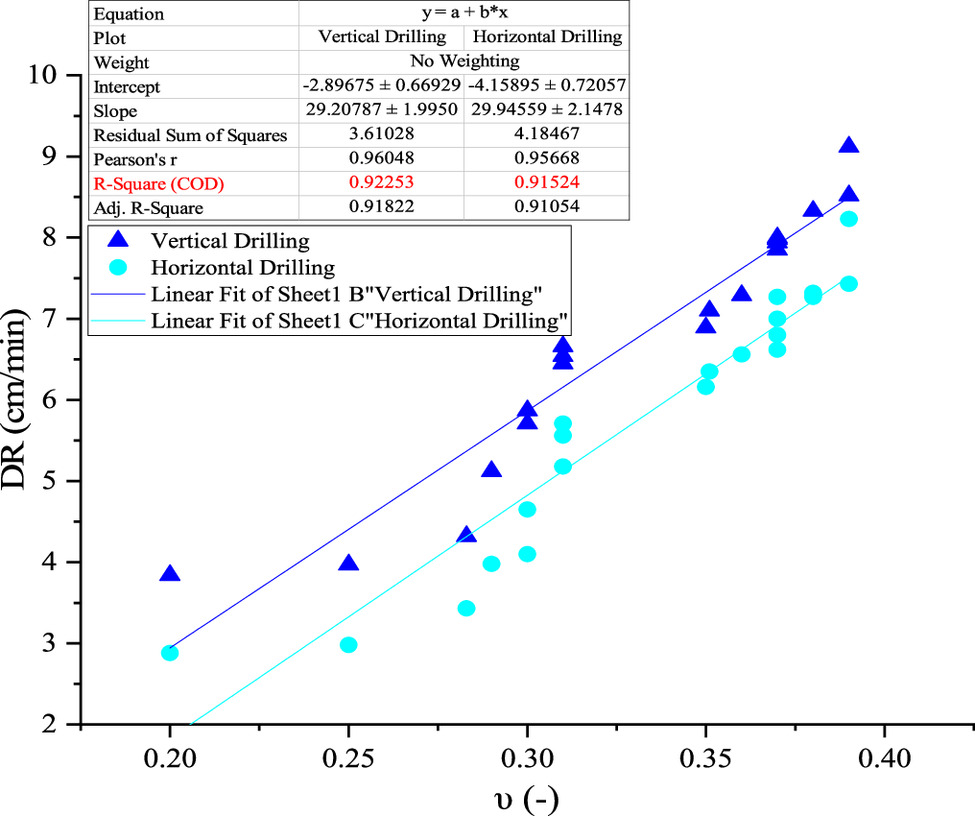
This section examines the relationship between VDR and HDR as a function of rock properties. Accordingly, the relation type (direct or inverse) of rock properties with DR in both vertical and horizontal conditions is defined. The insight achieved from this analysis can assist in better understanding the relationship between rock properties and DR in both vertical and horizontal directions. Also, the effect of rock anisotropy can be assessed by comparing the VDR and HDR values. The relationships between all 12 studied variables and the DR in vertical and horizontal conditions are plotted in Figs. 5–16. A linear correlation between the DR and rock properties is demonstrated in these figures. It can be concluded from Figs. 5–12, that ρn, ρd, n, Wa, Id, SHR, Vp, and LAA variables correlate more with HDR (by comparing the obtained R2 in horizontal and vertical drillings). In constant conditions, Figs. 13–16 showed that PLI, UCS, ν, and E parameters are more correlated with VDR. Moreover, the results demonstrate that ρn, ρd, Id, SHR, Vp, PLI, UCS, and E parameters are inversely correlated to the drilling rate in both vertical and horizontal conditions. Conversely, n, Wa, LAA, and ν variables have a direct relation with both VDR and HDR indexes.
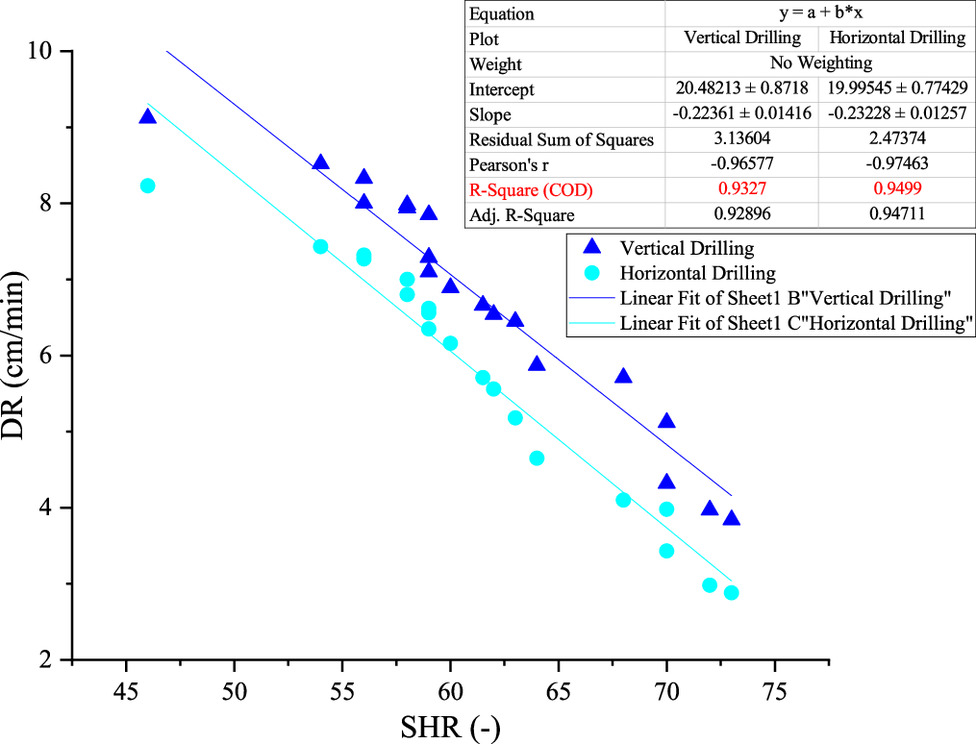
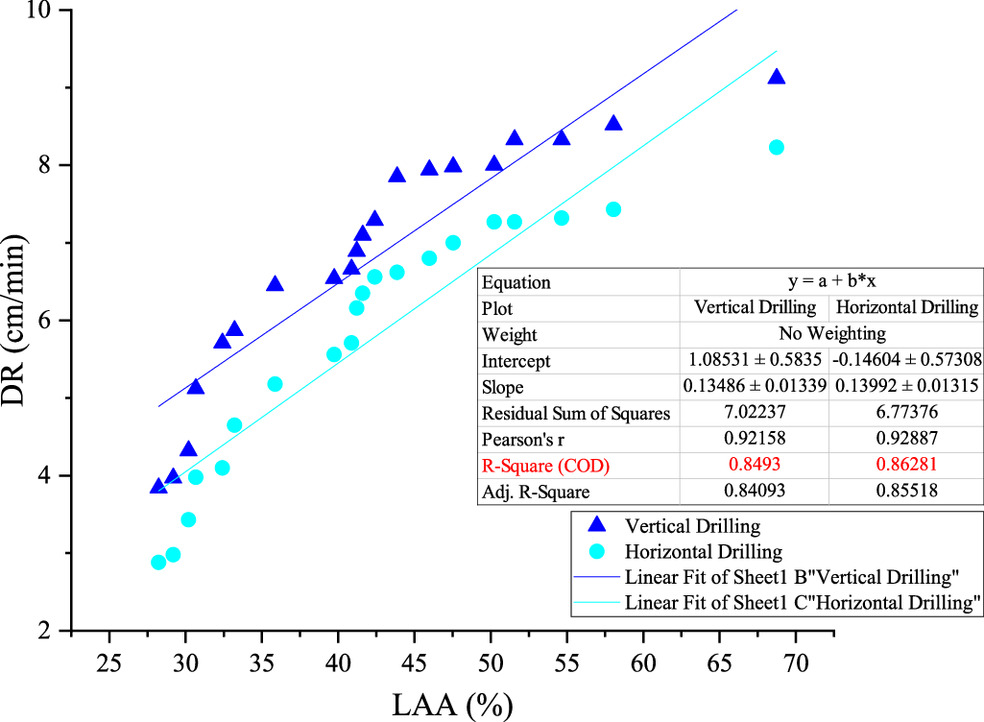
As mentioned in the previous sections, the studied marble rock mass is rather jointless and somewhat intact but contains laminations/bedding structures. In these rock types, drilling rates can be influenced by the rock hardness characteristics. Accordingly, the SHR test was conducted in this study to obtain the effect of rock hardness on the VDR and HDR, as shown in Fig. 10. Conversely, the abrasion characteristics of the rock can affect both VDR and HDR due to its interaction with bit and cutting tools. However, the aim of conducting the LLA test in this study is to determine the abrasion correlation with the drilling rate in vertical and horizontal conditions during drilling operations. According to the obtained results in Fig. 12, it was concluded that LLA is more correlated with the HDR compared with the VDR. Indeed, HDR can be more influenced by rock abrasion. The higher dependency of HDR on rock hardness and abrasion may be attributed to the insufficient thrust load in horizontal drilling to deal with these rock properties.
As the influence of rock properties on the drilling rate in both vertical and horizontal directions is studied in this research, it seems that simultaneous consideration of the results of PLI and UCS tests better reflects the effect of mechanical properties on the VDR and HDR. The obtained results in Figs. 13 and 14 also confirmed that these two parameters have different correlations with the HDR while they have similar correlations with the VDR. Indeed, PLI is more correlated with the HDR compared with the VDR. This might be attributed to conducting the PLI test in different conditions, i.e., axial, diametral, and block or lump, which can better reflect its influence on the HDR and achieve a higher correlation.
A new remarkable finding that can be drawn from Figs. 5–16 is that the VDR is more correlated with the rock's mechanical properties, whereas the HDR is more correlated with the physical properties of the rock. There is no definite geological evidence for these correlations; however, it might be attributed to the direction of thrust load and cutting with respect to the bedding/lamination. Investigating the effects of geological features in micro- and macroscales on horizontal and vertical drilling rates can be an attractive topic for future studies in this field.
Sensitivity Analysis
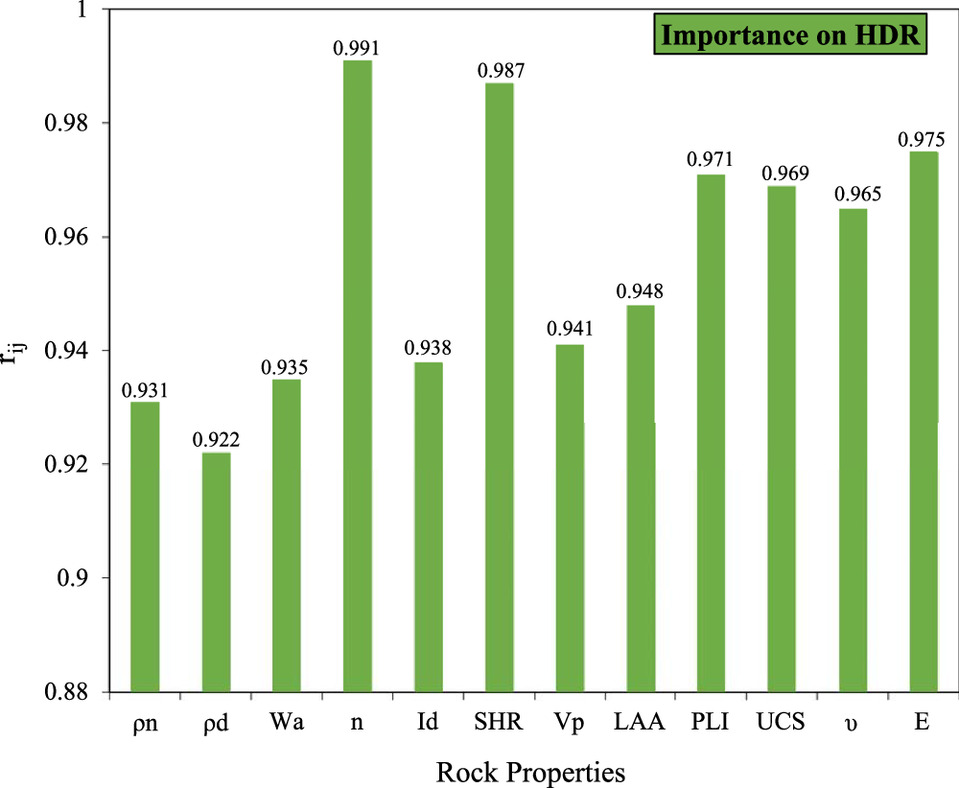
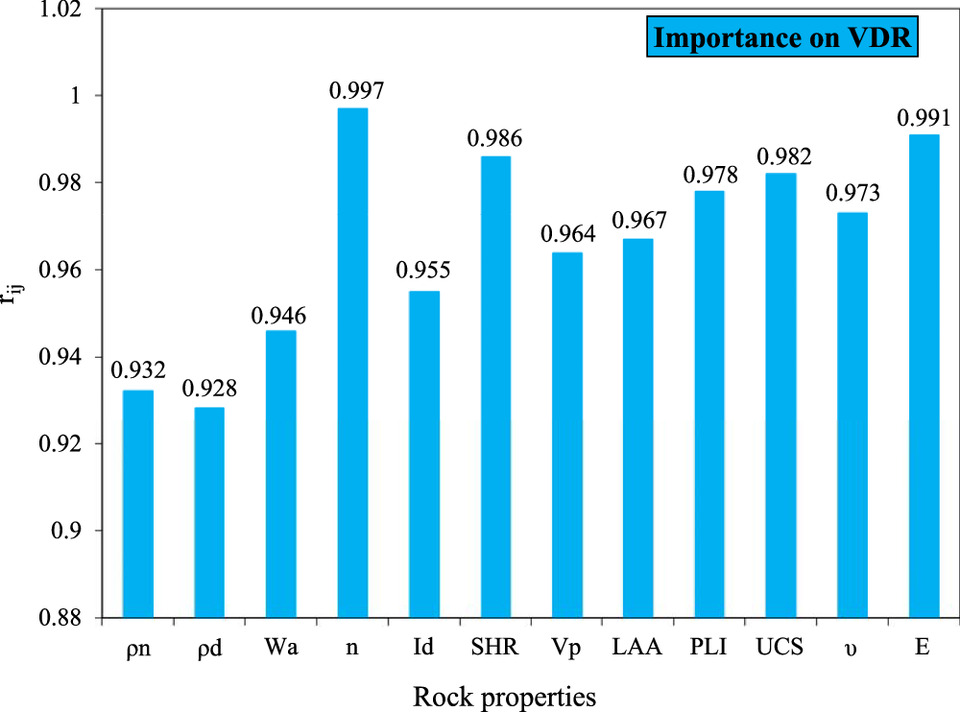
Sensitivity analysis is generally conducted to determine the effect of an input variable on an output parameter. The sensitivity analysis is commonly implemented through two general approaches, including conventional and novel methods. In the conventional method, the influence of an input on an output is recorded according to the variations of input–output relation while the other inputs are kept constant (Rezaei 2018, 2020; Mohammad et al. 2018; Rezaei and Asadizadeh 2020; Wang et al. 2023). In the novel approaches i.e., the cosine amplitude method (CAM), developed analytical equations are usually applied for the sensitivity analysis (Rezaei and Rajabi 2018, 2021; Rezaei and Koureh Davoodi 2021; Asadizadeh and Rezaei 2021). Here, the effect of inputs on the VDR and HDR values (rij) is obtained based on the CAM using the following equation:where yik and yok stand for the input and output variables, respectively. The amounts of rij indicate the effect of an input on the output.
(1)
Based on Eq. (1), the importance values of all 12 inputs on VDR and HDR are computed in the interval of 0 and 1. When the importance value is 1 or close to 1, it indicates more influence of an input on the output. According to this approach, the importance values of 12 rock properties on the HDR and VDR are calculated separately and presented in Figs. 17 and 18, respectively. As can be seen from Figs. 17 and 18, the sensitivity analysis demonstrated that porosity (n) is the most important parameter and dry density (ρd) is the least important variable for both HDR and VDR. However, the importance of all studied variables on the HDR and VDR (up to 0.92) is also considerable and should be noticed in drilling operations.
Relationship between VDR and HDR
In this study, the analysis of variance (ANOVA) is used to develop the best possible relation between VDR and HDR. In the ANOVA test, determination coefficient (R2), Fisher-test constant (F), and statistical significance (Sig.) indexes are applied for selecting the best VDR–HDR relationship among different relations, i.e., linear, logarithmic, quadratic polynomial, power, and exponential equation types. An equation with Sig. value below 0.05 and higher R2 and F values can be selected as an optimum equation between two variables. Here, the ANOVA test is conducted to specify the optimum relation between VDR and HDR, and the obtained results are presented in Table 3. According to the achieved values of R2, F, and Sig. criteria in Table 3, the quadratic polynomial equation can be considered as the optimum relationship between VDR and HDR, as presented in Fig. 19 and given in the following equation:
(2)
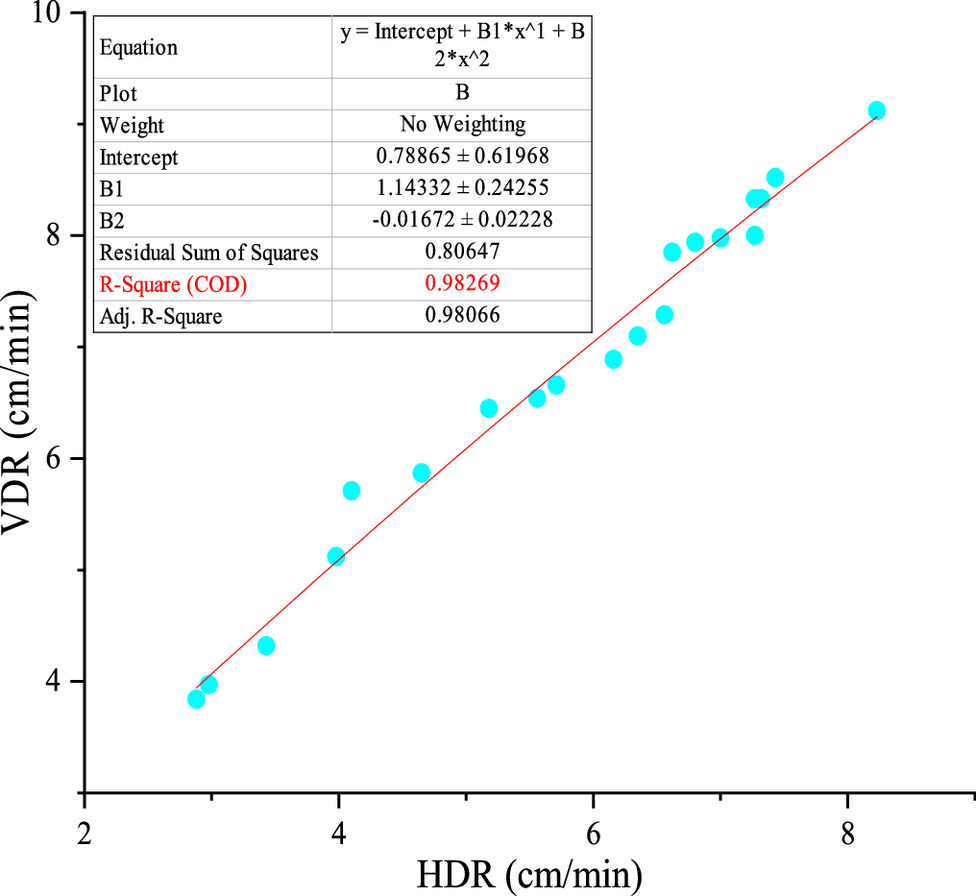
| Model type | Degree of freedom | R2 | F | Sig. |
|---|---|---|---|---|
| Linear | 1 | 0.9821 | 988.73 | 0.00 |
| Logarithmic | 1 | 0.974 | 666.239 | 0.00 |
| Quadratic polynomial | 2 | 0.9827 | 1,097.998 | 0.00 |
| Power | 1 | 0.9826 | 962.184 | 0.00 |
| Exponential | 1 | 0.961 | 447.45 | 0.00 |
For further evaluation, the proposed VDR–HDR equation was contrasted with the only comparable equation (VDR = 1.0981HDR + 2.4855), suggested by Demirdag et al. (2014), with an R2 value of 0.94. To do this evaluation, four new data sets that were not used in developing the proposed VDR–HDR equation were measured and applied for this comparative analysis. The mean relative error (MRE) criterion was used to evaluate the performance of both equations. Normally, the lower the value of the MRE, the more accurate the equation. Along with the MRE, the R2 index is also applied to compare both equations. Generally, the higher the R2 value, the more precise the equation. The values achieved for MRE and R2 are given in Table 4. It can be seen in Table 4 that the MRE and R2 values of the proposed equation are lower and higher than those of the Demirdag et al. (2014) equation, respectively (0.98269 versus 0.8836 R2 and 4.56 versus 27.17 MRE). As a further validation of the proposed equation [Eq. (2)], its results are contrasted against the outputs of the Demirdag et al. (2014) equation based on the four new data sets and shown in Fig. 20. This figure shows that the estimated VDR values from the proposed equation in this study are in close agreement with the actual amounts and somewhat have better accuracy than the Demirdag et al. (2014) equation.
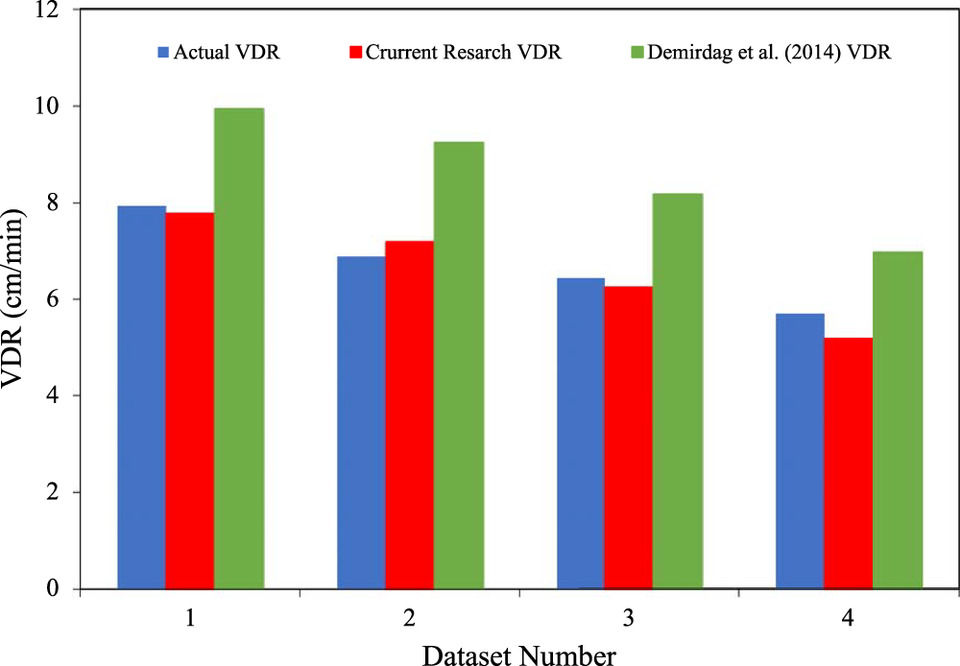
Considering the comparison results in Table 4 and Fig. 19, it can be concluded that the proposed VDR–HDR equation in this research is relatively more accurate than the proposed equations by Demirdag et al. (2014). Even though this comparison should be done in similar conditions, it is impossible due to the lack of access to the measured data of Demirdag et al. (2014). Although the suggested VDR–HDR equation by Demirdag et al. (2014) has been proven to be an accurate and valid relation, the relatively higher accuracy and somewhat lower error of the proposed relationship in this research can be attributed to two reasons. First, Demirdag et al. (2014) carried out their study on different types of marbles, while another marble type was studied in the present work. Second, Demirdag et al. (2014) revealed a linear relationship between VDR and HDR and calculated its related correlation coefficients. On the contrary, this relationship is expressed in the present study as a polynomial type. It is expected that the relationship expressed in the polynomial form may give a relatively higher correlation for the relevant data set. This does not mean that the proposed relation in this research is absolutely better than the Demirdag et al. (2014) relation, it just shows that it gives better results for the
Drilling Anisotropy Index
The anisotropy ratio is normally used to demonstrate the extent of anisotropy, which differs based on the rock type, fabric, and alignment of minerals (Thomsen 1986; Ramamurthy 1993; Gurevich et al. 2011; Shen et al. 2015; He et al. 2023). This ratio is commonly defined as a ratio of any properties in the direction parallel to the foliation at the anisotropy angle of 90° to its minimum value at other anisotropy angles (Tsidzi 1990; Ramamurthy 1993; Tsidzi 1997; Saroglou and Tsiambaos 2007; Kim et al. 2012; Cho et al. 2012; Özbek et al. 2018). The anisotropy index is variable based on the rock characteristics (Kim et al. 2012). The UCS anisotropy proposed by Ramamurthy (1993) is specified as the ratio of maximum compressive strength to its minimum value. According to Ramamurthy (1993), maximum compressive strength occurs when loading is perpendicular to the foliation planes (β = 90), and its minimum value is achieved at β = 30, as shown in Fig. 21. Other studies have reported the rock strength anisotropy based on the PLI test as the ratio of PLI value perpendicular and parallel to the bedding/foliation (Bhuiyan et al. 2016). The rock strength anisotropy index was also reported based on the Brazilian tensile strength (BTS), defined as the ratio of maximum to minimum BTS values (Singh et al. 1989). The Vp anisotropy index was also proposed by some researchers (Thomsen 1986; Tsidzi 1997; Saroglou and Tsiambaos 2007). However, the Vp-based anisotropy index can only be applied to determine the anisotropy in aggregate/dense rocks and cannot describe the anisotropy of noncondensed formations. Generally, the aforementioned anisotropy indexes indicate different classification scales, as they refer to different properties of intact rock rather than the rock mass. Indeed, these properties are affected by a varying extent of the anisotropic texture of the intact rock and cannot reflect the rock mass anisotropy practically.
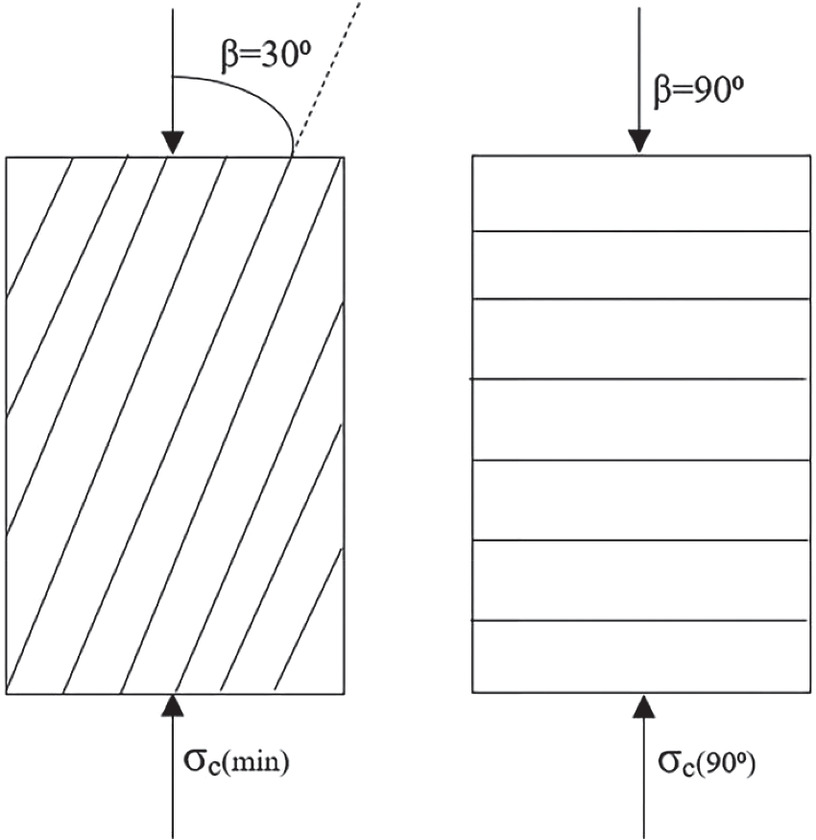
Fig. 21. Orientations of minimum and maximum compressive strengths of anisotropic intact rock.
(Data from Saroglou and Tsiambaos 2007.)
Inspired by previous studies, the present study proposes a new drilling-based anisotropy based on the calculated VDR and HDR values in a marble quarry mine. The suggested DAI is defined using the following equation:
(3)
As previously clarified, the understudied marble rock is rather jointless and contains lamination/bedding structure (demonstrated in Fig. 1). In addition, the presence of anisotropy in the present study was demonstrated based on the calculated drilling rates in the vertical and horizontal directions with respect to the lamination/bedding, which leads to a significant effect on the drilling rates. Commonly, there is a slight difference between the drilling rate values in vertical and horizontal directions. However, in this research, both vertical and horizontal drilling operations were carried out parallel and perpendicular to the beddings/laminations (as presented in Table 1) to derive the influence of anisotropy on VDR and HDR, and suggest a new DAI. In this condition, the drilling operation was carried out under the same drilling direction (vertical or horizontal) but in different directions relative to the beddings/lamination (i.e., parallel or perpendicular). Therefore, drilling rates are definitely influenced by the beddings/lamination. This idea leads to the proposal of a new DAI based on the ratio of the VDR to the HDR. Similar to this case, it has already been presented in the literature to determine the point load anisotropy index (Bhuiyan et al. 2016). The PLI anisotropy was defined as the ratio of PLI value perpendicular to the lamination/bedding to its value parallel to the lamination/bedding. Based on a similar inference, it can be concluded that the presence of drilling anisotropy while considering the existence of bedding/laminations in the rock could be meaningful and also useful for drilling evaluation.
The main advantage of the proposed DAI is that it is a representative index of all possible rock properties. Unlike the previously presented AIs, which are based on one rock property, the proposed DAI is an index that inherently considers multiple rock properties. A number of rock characteristics, including their lithological, structural, physical, and mechanical properties, are implicitly considered when calculating the drilling rates and subsequently calculating the proposed DAI. Thus, it can represent the effect of rock anisotropy in the drilling operation more accurately and reliably. According to the proposed DAI, a rock is isotropic when its VDR and HDR have equal values and anisotropic when its VDR and HDR values are different.
Table 5 shows the measured quantities of rock properties and their related VDR, HDR, and DAI values based on the field and experimental measurements performed on 20 marble blocks of the quarry mine. As indicated in this table, the mean DAI of the marble rock blocks is 1.2. However, in dense blocks with high mechanical properties and low drilling rates, the DAI value is greater than its value in blocks with low mechanical characteristics. Moreover, these measurements indicate that DAI increases with increasing rock strength properties. This means that the DAI is more prominent in rock blocks with high strength parameters, noticeably so in the drilling operation, and especially in marble rocks. Finally, Table 5 depicts that DAI is relatively high in the blocks with low drilling rates. Therefore, it can be concluded that DR has an inverse relation with DAI.
| No. | pn (gr/cm3) | pd (gr/cm3) | Wa (%) | n (%) | Id2 (%) | SHR (−) | Vp (m/s) | LAA (%) | PLI (MPa) | UCS (MPa) | υ (−) | E (GPa) | VDR (cm/min) | HDR (cm/min) | DAI |
|---|---|---|---|---|---|---|---|---|---|---|---|---|---|---|---|
| 1 | 2.22 | 2.21 | 2.11 | 6.84 | 0.96 | 46 | 3,651 | 68.74 | 1.09 | 12.96 | 0.39 | 10.11 | 9.12 | 8.23 | 1.11 |
| 2 | 2.228 | 2.246 | 1.67 | 6.76 | 0.97 | 54 | 3,740 | 58.06 | 1.15 | 15.32 | 0.39 | 16.84 | 8.52 | 7.43 | 1.15 |
| 3 | 2.25 | 2.25 | 1.45 | 6.12 | 0.971 | 56 | 3,740 | 54.65 | 1.18 | 17.29 | 0.38 | 17.12 | 8.33 | 7.32 | 1.14 |
| 4 | 2.256 | 2.25 | 1.39 | 5.98 | 0.974 | 56 | 3,765 | 51.56 | 1.26 | 17.56 | 0.38 | 18.29 | 8.33 | 7.27 | 1.15 |
| 5 | 2.258 | 2.252 | 1.39 | 5.97 | 0.975 | 56 | 3,765 | 50.23 | 1.43 | 17.56 | 0.37 | 18.29 | 8 | 7.27 | 1.10 |
| 6 | 2.26 | 2.25 | 1.33 | 5.8 | 0.976 | 58 | 3,769 | 47.54 | 1.71 | 17.56 | 0.37 | 18.59 | 7.98 | 7.00 | 1.14 |
| 7 | 2.26 | 2.26 | 1.31 | 5.8 | 0.978 | 58 | 3,769 | 45.98 | 1.73 | 17.56 | 0.37 | 18.79 | 7.94 | 6.80 | 1.17 |
| 8 | 2.27 | 2.268 | 1.29 | 5.6 | 0.978 | 59 | 3,784 | 43.86 | 1.75 | 17.56 | 0.37 | 18.89 | 7.85 | 6.62 | 1.19 |
| 9 | 2.287 | 2.28 | 1.2 | 5.6 | 0.979 | 59 | 3,820 | 42.4 | 2.1 | 27.12 | 0.36 | 18.96 | 7.29 | 6.56 | 1.11 |
| 10 | 2.31 | 2.284 | 1.2 | 5.12 | 0.98 | 59 | 3,830 | 41.6 | 2.31 | 29.98 | 0.351 | 19.42 | 7.1 | 6.35 | 1.12 |
| 11 | 2.31 | 2.29 | 1.2 | 5.1 | 0.981 | 60 | 3,830 | 41.22 | 2.31 | 30.79 | 0.35 | 19.51 | 6.89 | 6.16 | 1.12 |
| 12 | 2.333 | 2.32 | 1.12 | 4.8 | 0.984 | 61.5 | 3,830 | 40.87 | 2.35 | 31.65 | 0.31 | 20.1 | 6.66 | 5.71 | 1.17 |
| 13 | 2.386 | 2.346 | 1.07 | 4.72 | 0.986 | 62 | 3,907 | 39.74 | 2.38 | 32.87 | 0.31 | 20.46 | 6.54 | 5.56 | 1.18 |
| 14 | 2.395 | 2.357 | 0.92 | 3.91 | 0.988 | 63 | 3,931 | 35.86 | 2.91 | 34.58 | 0.31 | 20.85 | 6.45 | 5.18 | 1.25 |
| 15 | 2.407 | 2.39 | 0.91 | 3.84 | 0.99 | 64 | 4,002 | 33.21 | 2.92 | 35.66 | 0.3 | 24.06 | 5.87 | 4.65 | 1.26 |
| 16 | 2.41 | 2.4 | 0.89 | 3.65 | 0.99 | 68 | 4,146 | 32.41 | 3.09 | 39.71 | 0.3 | 25.32 | 5.71 | 4.10 | 1.39 |
| 17 | 2.41 | 2.41 | 0.88 | 3.15 | 0.991 | 70 | 4,163 | 30.67 | 3.12 | 40.48 | 0.29 | 29.78 | 5.12 | 3.98 | 1.29 |
| 18 | 2.47 | 2.43 | 0.69 | 2.79 | 0.991 | 70 | 4,211 | 30.19 | 3.21 | 42.32 | 0.283 | 30.43 | 4.32 | 3.43 | 1.26 |
| 19 | 2.484 | 2.44 | 0.6 | 2.78 | 0.992 | 72 | 4,213 | 29.19 | 3.76 | 55.56 | 0.25 | 33.41 | 3.97 | 2.98 | 1.33 |
| 20 | 2.517 | 2.45 | 0.43 | 1.91 | 0.993 | 73 | 4,321 | 28.23 | 4.6 | 65.12 | 0.2 | 35.1 | 3.84 | 2.88 | 1.33 |
| Mean | 2.336 | 2.319 | 1.153 | 4.81 | 0.981 | 61.22 | 3,909 | 42.31 | 2.318 | 29.96 | 0.331 | 21.71 | 6.79 | 5.77 | 1.2 |
Conclusions
The relationships between VDR and HDR in marble rocks were studied in this paper to evaluate the effect of rock anisotropy during drilling operations. For this purpose, HDR and VDR were recorded during the drilling operation of the Malawi marble quarry mine. This was followed by conducting laboratory experiments on the drilled rock blocks to measure their physical and mechanical properties. Overall, 20 separate field records were collected, including VDR, HDR, and 12 different rock properties. Analyzing the database revealed several key findings. First, HDR is correlated with the rock's physical properties, while VDR is correlated with the mechanical characteristics. The rock porosity was identified as the most important variable for both HDR and VDR, while the dry density had the least impact. Second, the ANOVA results indicated that a quadratic polynomial equation provides the best relationship between VDR and HDR. The proposed VDR–HDR equation in this study was confirmed to be relatively more accurate than the previous equation suggested by Demirdag et al. (2014). Finally, a new anisotropy index called the DAI, defined as the ratio of VDR to HDR, was introduced. The results demonstrated that DAI increases with higher rock strength properties and is more noticeable in stronger rocks than in weak rocks. Furthermore, it was observed that drilling rates have an inverse relationship with DAI.
In conclusion, the proposed VDR–HDR equation and the newly suggested DAI provided valuable insights into the practical aspects of rock drilling, as well as the rock anisotropy index and its impact on drilling rates. Given the aforementioned results, it can be concluded that the findings of the present study can improve the effectiveness of rock drilling and optimize the drilling costs. However, further studies are required to verify the generalizability of outputs as the study only focused on drilling operations at the Malawi marble quarry mine, and the influence of drill bit conditions was constant. Accordingly, it is suggested that the DAI should be studied in different rock types with various physical and mechanical properties to fully capture the rock drilling anisotropy.
Data Availability Statement
All data and models that support the findings of this study are available from the corresponding author upon reasonable request.
Acknowledgments
The authors gratefully acknowledge the support of the Malawi marble quarry mine management and mine technical team for their support in data preparation.
Notation
The following symbols are used in this paper:
- E
- elastic modulus;
- F
- Fisher-test constant;
- Id
- durability index;
- n
- porosity;
- R2
- determination coefficient;
- rij
- influence value of input on output;
- Sig.
- statistical significance;
- Vp
- P-wave velocity;
- wa
- water absorption;
- β
- angle of loading with the foliation plane;
- ν
- Poisson’s ratio;
- ρd
- dry density; and
- ρn
- natural density.
References
Abugharara, A. N. A. 2019. “Influence of formation anisotropy and axial Compliances on drilling performance.” Ph.D. thesis, Faculty of Engineering and Applied Science, Memorial Univ. of Newfoundland.
Asadizadeh, M., and M. Rezaei. 2021. “Surveying the mechanical response of non-persistent jointed slabs subjected to compressive axial loading utilising GEP approach.” Int. J. Geotech. Eng. 15 (10): 1312–1324. https://doi.org/10.1080/19386362.2019.1596610.
Ataei, M., R. KaKaie, M. Ghavidel, and O. Saeidi. 2015. “Drilling rate prediction of an open pit mine using the rock mass drillability index.” Int. J. Rock Mech. Min. Sci. 73: 130–138. https://doi.org/10.1016/j.ijrmms.2014.08.006.
Bhuiyan, M., K. Esmaeili, and D. Eden. 2016. “The influence of rock Foliation on the correlation between the point load strength index and comminution indices at Kinross Tasiast mine.” In Proc., 50th U.S. Rock Mechanics/Geomechanics Symp., ARMA-2016-791. Houston, TX: The American Rock Mechanics Association.
Bilim, N. 2011. “Determination of drillability of some natural stones and their association with rock properties.” Sci. Res. Essays 6 (2): 382–387. https://doi.org/10.5897/SRE10.878.
Boualleg, R., H. Sellami, A. Rouabhi, S. Menand, and C. Simon. 2007. “Effect of Rocks anisotropy on deviation tendencies of drilling systems.” In Vol. 1 of Proc., 11th ISRM Congress, SRM-11CONGRESS-2007-266. London, UK: Taylor & Francis.
Capik, M., A. O. Yilmaz, and S. Yasar. 2017. “Relationships between the drilling rate index and physicomechanical rock properties.” Bull. Eng. Geol. Environ. 76 (1): 253–261. https://doi.org/10.1007/s10064-016-0991-2.
Cho, J.-W., H. Kim, S. Jeon, and K.-B. Min. 2012. “Deformation and strength anisotropy of Asan gneiss, Boryeong shale, and Yeoncheon schist.” Int. J. Rock Mech. Min. Sci. 50 (3): 158–169. https://doi.org/10.1016/j.ijrmms.2011.12.004.
Demirdag, S., N. Ugur, T. Efe, D. Akbay, and R. Altindag. 2014. “Variation of vertical and horizontal drilling rates depending on some rock properties in the marble quarries.” Int. J. Min. Sci. Technol. 24 (2): 269–273. https://doi.org/10.1016/j.ijmst.2014.01.020.
Derdour, F. Z., M. Kezzar, and L. Khochemane. 2018. “Optimization of penetration rate in rotary percussive drilling using two techniques: Taguchi analysis and response surface methodology (RMS).” Powder Technol. 339 (3): 846–853. https://doi.org/10.1016/j.powtec.2018.08.030.
Femiak, Y. M., Y. M. Kochkodan, A. I. Vasko, L. R. Yurych, and K. A. Vasko. 2022. “Influence of the rock anisotropy index on the regime and technological parameters of drilling.” In Proc., 16th Int. Scientific Conf. on Monitoring of Geological Processes and Ecological Condition of the Environment. Utrecht, The Netherlands: European Association of Geoscientists & Engineers.
Gurevich, B., M. Pervukhina, and D. Makarynska. 2011. “An analytic model for the stress-induced anisotropy of dry rocks.” Geophysics 76 (3): WA125–WA133. https://doi.org/10.1190/1.3567950.
He, M., H. Wang, C. Ma, Z. Zhang, and N. Li. 2023. “Evaluating the anisotropy of drilling mechanical characteristics of rock in the process of digital drilling.” Rock Mech. Rock Eng. 56: 3659–3677. https://doi.org/10.1007/s00603-023-03242-1.
Heng, S., Y. Guo, C. Yang, J. J. K. Daemen, and Z. Li. 2015. “Experimental and theoretical study of the anisotropic properties of shale.” Int. J. Rock Mech. Min. Sci. 74: 58–68. https://doi.org/10.1016/j.ijrmms.2015.01.003.
Hoseinie, S. H., H. Aghababaei, and Y. Pourrahimian. 2008. “Development of a new classification system for assessing of rock mass drillability index (RDi).” Int. J. Rock Mech. Min. Sci. 45 (1): 1–10. https://doi.org/10.1016/j.ijrmms.2007.04.001.
Hoseinie, S. H., M. Ataei, and A. Aghababaie. 2014. “A laboratory study of rock properties affecting the penetration rate of pneumatic top hammer drills.” J. Min. Environ. 5 (1): 25–34. https://doi.org/10.22044/JME.2014.216.
Hoseinie, S. H., M. Ataei, and M. Osanloo. 2009. “A new classification system for evaluating rock penetrability.” Int. J. Rock Mech. Min. Sci. 46 (8): 1329–1340. https://doi.org/10.1016/j.ijrmms.2009.07.002.
ISRM (International Society for Rock Mechanics). 2007. “The complete ISRM suggested methods for rock characterization, testing and monitoring: 1974–2006.” In Suggested methods prepared by the commission on testing methods, edited by R. Ulusay and J. A. Hudson. Ankara, Turkey: ISRM Turkish National Group.
Kahraman, S. 2003. “Performance analysis of drilling machines using rock modulus ratio.” J. South Afr. Inst. Min. Metall. 103 (8): 515–522. https://doi.org/10.17159/2411-9717/17/155/2019.
Kahraman, S., N. Bilgin, and C. Feridunoglu. 2003. “Dominant rock properties affecting the penetration rate of percussive drills.” Int. J. Rock Mech. Min. Sci. 40 (5): 711–723. https://doi.org/10.1016/S1365-1609(03)00063-7.
Khanlari, G., B. Rafiei, and Y. Abdilor. 2015. “An experimental investigation of the Brazilian tensile strength and failure patterns of laminated sandstones.” Rock Mech. Rock Eng. 48 (2): 843–852. https://doi.org/10.1007/s00603-014-0576-y.
Khanlari, G.-R., M. Heidari, A.-A. Sepahigero, and D. Fereidooni. 2014. “Quantification of strength anisotropy of metamorphic rocks of the Hamedan province, Iran, as determined from cylindrical punch, point load and Brazilian tests.” Eng. Geol. 169: 80–90. https://doi.org/10.1016/j.enggeo.2013.11.014.
Kim, H., J.-W. Cho, I. Song, and K.-B. Min. 2012. “Anisotropy of elastic moduli, P-wave velocities, and thermal conductivities of Asan Gneiss, Boryeong Shale, and Yeoncheon Schist in Korea.” Eng. Geol. 147–148: 68–77. https://doi.org/10.1016/j.enggeo.2012.07.015.
Kolapo, P. 2021. “Investigating the effects of mechanical properties of rocks on specific energy and penetration rate of borehole drilling.” Geotech. Geol. Eng. 39: 1715–1726. https://doi.org/10.1007/s10706-020-01577-y.
Krúpa, V., M. Kruľáková, E. Lazarová, M. Labaš, K. Feriančiková, and L. Ivaničová. 2018. “Measurement, modeling and prediction of penetration depth in rotary drilling of rocks.” Measurement 117: 165–175. https://doi.org/10.1016/j.measurement.2017.12.007.
Ma, T., N. Peng, Z. Zhu, Q. Zhang, C. Yang, and J. Zhao. 2018. “Brazilian tensile strength of anisotropic rocks: Review and new insights.” Energies 11 (2): 304. https://doi.org/10.3390/en11020304.
Mohammad, R., M. Abbas, F. H. Mohammad, and N. Iraj. 2018. “Study of the roof behavior in longwall gob in long-term condition.” J. Geol. Min. Res. 10 (2): 15–27. https://doi.org/10.5897/JGMR2017.0284.
Özbek, A., M. Gül, E. Karacan, and Ö Alca. 2018. “Anisotropy effect on strengths of metamorphic rocks.” J. Rock Mech. Geotech. Eng. 10 (1): 164–175. https://doi.org/10.1016/j.jrmge.2017.09.006.
Ramamurthy, T. 1993. “Strength and modulus responses of anisotropic rocks.” In Compressive rock engineering, Vol. 1, edited by J. A. Hudson, 313–329. Pergamon, Turkey, Oxford.
Rezaei, M. 2018. “Long-term stability analysis of goaf area in longwall mining using minimum potential energy theory.” J. Min. Environ. 9 (1): 169–182. https://doi.org/10.22044/JME.2017.5950.1408.
Rezaei, M. 2020. “Feasibility of novel techniques to predict the elastic modulus of rocks based on the laboratory data.” Int. J. Geotech. Eng. 14 (1): 25–34. https://doi.org/10.1080/19386362.2017.1397873.
Rezaei, M., and M. Asadizadeh. 2020. “Predicting unconfined compressive strength of intact rock using new hybrid intelligent models.” J. Min. Environ. 11 (1): 231–246. https://doi.org/10.22044/JME.2019.8839.1774.
Rezaei, M., and P. Koureh Davoodi. 2021. “Determining the relationship between shear wave velocity and physicomechanical properties of rocks.” Int. J. Min. Geo-Eng. 55 (1): 63–70. https://doi.org/10.22059/IJMGE.2019.275851.594782.
Rezaei, M., and N. Nyazyan. 2023. “Assessment of effect of rock properties on horizontal drilling rate in marble quarry mining: Field and experimental studies.” J. Min. Environ. 14 (1): 321–339. https://doi.org/10.22044/jme.2023.12595.2287.
Rezaei, M., and M. Rajabi. 2018. “Vertical displacement estimation in roof and floor of an underground powerhouse cavern.” Eng. Fail. Anal. 90: 290–309. https://doi.org/10.1016/j.engfailanal.2018.03.010.
Rezaei, M., and M. Rajabi. 2021. “Assessment of plastic zones surrounding the power station cavern using numerical, fuzzy and statistical models.” Eng. Comput. 37 (6): 1499–1518. https://doi.org/10.1007/s00366-019-00900-3.
Saeidi, O., S. R. Torabi, M. Ataei, and J. Rostami. 2014. “A stochastic penetration rate model for rotary drilling in surface mines.” Int. J. Rock Mech. Min. Sci. 68: 55–65. https://doi.org/10.1016/j.ijrmms.2014.02.007.
Saroglou, H., and G. Tsiambaos. 2007. “Classification of anisotropic rocks.” In Proc., 11th ISRM Congress, SRM-11CONGRESS-2007-266, Vol. 1, 191–196. London, UK: Taylor & Francis.
Shangxin, F., W. Yujie, Z. Guolai, Z. Yufei, W. Shanyong, C. Ruilang, and X. Enshang. 2020. “Estimation of optimal drilling efficiency and rock strength by using controllable drilling parameters in rotary non-percussive drilling.” J. Pet. Sci. Eng. 193: 107376. https://doi.org/10.1016/j.petrol.2020.107376.
Shen, B., T. Siren, and M. Rinne. 2015. “Modelling fracture propagation in anisotropic rock mass.” Rock Mech. Rock Eng. 48 (3): 1067–1081. https://doi.org/10.1007/s00603-014-0621-x.
Singh, J., T. Ramamurthy, and G. V. Rao. 1989. “Strength anisotropies in rocks.” Indian Geotech. J. 19: 147–166.
Stavropoulou, M. 2006. “Modeling of small-diameter rotary drilling tests on marbles.” Int. J. Rock Mech. Min. Sci. 43 (7): 1034–1051. https://doi.org/10.1016/j.ijrmms.2006.03.008.
Thomsen, L. 1986. “Weak elastic anisotropy.” Geophysics 51 (10): 1954–1966. https://doi.org/10.1190/1.1442051.
Thuro, K., and N. Schormair. 2008. “Fracture propagation in anisotropic rock during drilling and cutting.” Geomech. Tunnelling 1 (1): 8–17. https://doi.org/10.1002/geot.200800001.
Tsidzi, K. E. N. 1990. “The influence of foliation on point load strength anisotropy of foliated rocks.” Eng. Geol. 29 (1): 49–58. https://doi.org/10.1016/0013-7952(90)90081-B.
Tsidzi, K. E. N. 1997. “Propagation characteristics of ultrasonic waves in foliated rocks.” Bull. Int. Assoc. Eng. Geol. 56: 103–113.
Wang, Y., M. Rezaei, R. A. Abdullah, and M. Hasanipanah. 2023. “Developing two hybrid algorithms for predicting the elastic modulus of intact rocks.” Sustainability 15 (5): 4230. https://doi.org/10.3390/su15054230.
Wong, L. N. Y., V. Maruvanchery, and N. N. Oo. 2015. “Engineering properties of a low-grade metamorphic limestone.” Eng. Geol. 193: 348–362. https://doi.org/10.1016/j.enggeo.2015.05.009.
Yarali, O., and E. Soyer. 2011. “The effect of mechanical rock properties and brittleness on drillability.” Sci. Res. Essays 6 (5): 1077–1088. https://doi.org/10.5897/SRE10.1004.
Yarali, O., and E. Soyer. 2013. “Assessment of relationships between drilling rate index and mechanical properties of rocks.” Tunnelling Underground Space Technol. 33: 46–53. https://doi.org/10.1016/j.tust.2012.08.010.
Yasar, E., P. G. Ranjith, and D. R. Viete. 2011. “An experimental investigation into the drilling and physico-mechanical properties of a rock-like brittle material.” J. Pet. Sci. Eng. 76 (3–4): 185–193. https://doi.org/10.1016/j.petrol.2011.01.011.
Yenice, H., M. V. Ozdogan, and M. K. Ozfırat. 2018. “A sampling study on rock properties affecting drilling rate index (DRI).” J. Afr. Earth. Sci. 141: 1–8. https://doi.org/10.1016/j.jafrearsci.2018.01.015.
Zheng, J., X. Yang, Q. Lü, Y. Zhao, J. Deng, and Z. Ding. 2018. “A new perspective for the directivity of Rock Quality Designation (RQD) and an anisotropy index of jointing degree for rock masses.” Eng. Geol. 240 (4): 81–94. https://doi.org/10.1016/j.enggeo.2018.04.013.
Information & Authors
Information
Published In

International Journal of Geomechanics
Volume 24 • Issue 10 • October 2024
Copyright
© 2024 American Society of Civil Engineers.
History
Received: Sep 10, 2023
Accepted: Apr 29, 2024
Published online: Aug 9, 2024
Published in print: Oct 1, 2024
Discussion open until: Jan 9, 2025
ASCE Technical Topics:
- Analysis (by type)
- Anisotropy
- Construction engineering
- Construction methods
- Continuum mechanics
- Deformation (mechanics)
- Drilling
- Engineering fundamentals
- Engineering materials (by type)
- Engineering mechanics
- Geology
- Geomechanics
- Geotechnical engineering
- Marble
- Material mechanics
- Material properties
- Materials engineering
- Mechanical properties
- Rock mechanics
- Rock properties
- Rocks
- Sensitivity analysis
- Solid mechanics
- Stones
- Structural mechanics
Authors
Metrics & Citations
Metrics
Citations
Download citation
If you have the appropriate software installed, you can download article citation data to the citation manager of your choice. Simply select your manager software from the list below and click Download.