A Model Study of Water Inrush in Underground Roadways
Publication: International Journal of Geomechanics
Volume 24, Issue 12
Abstract
Groundwater is one of the key problems that must be faced and solved in underground engineering. Under special conditions, large-scale water damage accidents will occur. Therefore, it is of great engineering significance to study the stability of the surrounding rock of water-inrush roadways. In this paper, a laboratory model test is used to simulate the actual project. First, similar material and the similarity ratio of the test are determined, and the relationship between the ratio of the similar material and its physical parameters is analyzed through an orthogonal test, the multiple linear regression equation of the two is established, and the optimal ratio of the model similar material is determined. Then, the model test of tunnel water inrush is carried out. Through the orthogonal test, the influence of roadway depth, water-inrush height and water-inrush time on the stability of surrounding rock during and after tunnel water inrush is analyzed, and the numerical simulation is used to verify and extend the conclusion. The test results show that the sensitivity of each factor to roadway stability is as follows: water-inrush height > water-inrush time > roadway depth. In the test within 24 h after water inrush (7 days in actual engineering), the sensitivity of each factor to roadway stability is also water-inrush height > water-inrush time > roadway depth. This conclusion can provide an important basis for the rescue work after tunnel water inrush and enrich the relevant test simulation after tunnel water inrush.
Practical Applications
In this paper, a laboratory modeling test is used to emulate the actual project where groundwater exists. Similar materials used in the model test and their optimal ratios are determined by similarity ratios and multiple linear regression equations. The effects of roadway depth, water-inrush height, and water-inrush time on the stability of the tunnel’s surrounding rock are investigated by orthogonal tests, and finally the results are verified by numerical simulation. The test results show that the sensitivity of each factor to the stability of the roadbed is as follows: water-inrush height > water-inrush time > roadway depth. In the test within 24 h after water influx (7 days in the actual project), the sensitivity of each factor to the stability of the tunnel is also water-inrush height > water-inrush time > roadway depth. This conclusion can provide an important basis for the rescue work after the tunnel water influx and can provide suggestions for the early reinforcement support of the project in the presence of groundwater.
Introduction
The safety of underground engineering has always been the focus of scientific research in order to achieve the safety and sustainability of underground engineering, especially coal mining. After the end of mining, the hollow roadway destroys the stress state of the original surrounding rock, and the deformation of the surrounding rock of the roadway will be aggravated with the passage of time and eventually lead to various accidents (Cui et al. 2022). Among them, the safety hazards caused by underground water inrush remain high, and the water immersion of rock mass promotes the development of internal cracks in the surrounding rock, increases the degree of softening, and increases the safety hazards (Ma et al. 2018a; Kim and Changani 2016). However, the current studies mostly focus on the warning before water inrush, while the research achievements during and after water inrush are relatively few. For underground projects with long service life, we should not only pay attention to the safety warning before water inrush but also study the stability during the water inrush and during the subsequent operation of underground projects after water inrush, so as to guide the rescue work of underground projects and reduce unnecessary casualties and property losses.
Luo et al. (2022) investigated the effect of water on the damage of tunnels, took the real rock of tunnels as the research object, conducted a number of mechanical property tests including triaxial compression test, explored the form of damage and the principle of damage, and concluded that water would weaken the relevant mechanical properties of the rock body. Zhang et al. (2020) took the reservoir as the research object and investigated the mechanical properties of the rock body of the slope of the reservoir in the water-saturated state. Through onsite sampling tests, it was concluded that the shear strength of the main rock body was significantly greater than that of the bedding level, and a quantitative analysis method was used to conclude that the reservoir tunnels could remain stable even under saturated conditions. The stability of the tunnel perimeter rock has always been a key concern for scholars, especially in the secondary mining process where the stability of the perimeter rock will be smaller than in the primary mining. The damage range of the tunnel perimeter rock in the actual working conditions and stress state was studied using numerical simulation and in situ observation in order to obtain the damage form and provide theoretical guidance for the underground roadway support (Yang et al. 2021; Zhang et al. 2018). Field tests and numerical simulations are mainly used for the stability of roadway surrounding rock, while indoor studies are relatively few. Through theoretical analysis, field experiments, indoor physical model simulation, and numerical simulation, the mechanical properties, failure mechanism, and prediction forms of roadways are studied. Conclusions such as surrounding-rock instability mechanisms and support methods are obtained, which provide a theoretical basis and guidance for related similar roadways. Indoor model experiments have irreplaceable advantages, and many scholars have carried out research on the selection of similar materials needed for indoor model experiments, and on the various mechanical properties of model experiments, the relationship ratios related to the mechanical properties, the established intrinsic model, and the proposed methods for collecting and monitoring model experiments (Xiong et al. 2021; Liu et al. 2020; Zhao et al. 2020; Li et al. 2017; Zhang et al. 2019a). With the increase of disaster events in deep buried tunnels, researchers (Wu et al. 2021; Li et al. 2021) have increased their study of such events, and the stability of deep buried tunnels subjected to high geopathic stresses and strong dynamic disturbances has been investigated through numerical simulations. It is concluded that horizontal stress has a greater degree of deformation, displacement monitoring, and damage forms than vertical stress of the tunnel enclosure, which provides theoretical guidance for the siting of deeply buried tunnels and the occurrence of tunnel disasters. Under the premise of high similarity ratio and low strength of mechanical property parameters, Shi et al. (2021) established the relationship between the similarity material ratio and mechanical property parameters in model tests and fitted a multiple linear regression equation. According to the required mechanical properties, the similar material ratio can be inverted by this equation, and the error of mechanical properties is within 1.6%. With an actual project as the research object, the tunnel model equation was established, and the deformation and stress distribution mechanism of the tunnel were analyzed, and an improved formula was proposed. The research results provide theoretical guidance for tunnel deformation (Zheng et al. 2020; Song et al. 2016; Gao et al. 2016; Ma et al. 2013). Ji and Guo (2020) carried out actual measurement and statistics on a roadway of an ancient city. The displacement and stress variation laws of the surrounding rock were obtained, and the plastic area was calculated according to Mohr-Coulomb criterion, which optimized the roadway support parameters. Guo et al. (2020) faced with the problem of water influx in underground engineering, used physical model simulation and numerical simulation to study the effect of wet and dry cycles on the degree of deformation of the model specimen, and analyzed the changes of stress, displacement, and pore water pressure of the roadway surrounding rock, and the results obtained showed that with the increase in the number of wet and dry cycles, the main stress of the roadway surrounding rock gradually increased, and the degree of deformation also gradually increased. This agrees well with the numerical simulation results.
In most of the existing experimental studies, small cylindrical rock and soil specimens are used for physical and mechanical tests, and the test results derived from the tests are then used in actual geotechnical engineering (Zhou et al. 2021), which cannot simulate the actual engineering stage in a more comprehensive way. In the study of surrounding rock stability of water-related roadways, problems such as roof water inrush, deformation, and failure caused by roadway excavation in water-rich sections or roof water seepage are usually studied (Zhang et al. 2019b; Guo et al. 2021; Zhao et al. 2017; Xu et al. 2020; Li and Wu 2019). However, there are few studies on surrounding rock stability during and after roadway water inrush (Noorian Bidgoli and Jing 2015; Ji et al. 2023; Ma et al. 2018b; Guo et al. 2022; Meng et al. 2019). Li et al. (2016) took the high-risk karst tunnel in the Qiyue Mountain as the background and used FLUENT software to conduct a numerical simulation on five cases of water inrush from the floor of the tunnel. The results show that in the face of water inrush in different directions, the construction personnel should choose different escape routes, which is of great significance to ensure the safety of the tunnel. Chen et al. (2014) used a series of research methods, such as empirical formula, numerical simulation, and theoretical analysis, to study the fractures and excess pore water pressure in overlying rock during coal mining. A study by Zhao et al. (2022) captured microfractures within the rock mass using the MS system to reveal potential high-risk damage areas. The mechanism of the mechanical behavior of the rock mass is elucidated, that is, the macroscopic deformation or damage characteristics of the surrounding rock are directly related to the evolution of microfractures. Zhao et al. (2023) conducted an in-situ microseismic monitoring experiment to study the microseismic activity and the seismic source mechanism of rock fall in an underground cross-hole caused by blasting and excavation. In this paper, the orthogonal analysis method and the physical model simulation method were used to obtain the relationship between the similar material ratio and the main parameters of the physical model, to predict the change law of the physical model during and after the water inrush, and to verify the rationality of the preceding conclusion by comparing and analyzing with the numerical simulation. At the same time, the multiple regression equations were analytical rather than numerical solutions with good correlation and generalization. On the other hand, the model test was a direct similar simulation of the actual roadway water inrush, instead of extrapolating the conclusion to the actual project, which can provide results closer to the real situation.
Based on the aforementioned, the innovation points of this paper can be divided into two points. First, the optimal ratio of similar materials in the model test is determined through orthogonal experiment, and the multiple regression equation between the ratio of similar materials and its physical parameters is established. The equation is a good fit with results. The physical parameters of the model can be calculated by using different ratios of similar materials. Physical model parameters can also be used to solve the ratio of similar materials. Second, the model test is the simulation of the actual working condition, namely the water-inrush roadway, and the research results involved in this aspect are few, and a set of devices needed to simulate the water-inrush roadway is designed independently. Finally, the reasonableness of the preceding conclusions is verified by numerical simulation and generalized.
Test Procedure
Similar Material Proportioning Section
The physical and mechanical properties and hydrological properties of L16(43) fluid–solid coupling similar materials are tested, and the test data of compressive strength, modulus of elasticity, water absorption, softening coefficient, permeability coefficient, tensile strength, and density of similar materials under different combinations are obtained, which reveals the influence of quartz sand content, cement gypsum ratio, and silicone concentration on the mechanical properties of the materials and derives the multiple linear regression equations of the fluid–solid coupling similar materials. The multivariate linear regression equations combined with the dimensions of the model frame, the similarity three theorems and Matlab super-definite system of equations solving, and the similar material ratios of the test were determined as follows: quartz sand = 81.32%, cement:gypsum = 1.38:1, and organosilicon concentration = 31.6%.
Model Test Section
In the over-water roadway, rock stability modeling tests were carried out to discover the design of the roadway buried depth, the over-water height and over-water time of the three influencing factors of the L9 (33) orthogonal test, the roadway excavation of the stress and displacement change rule, as well as the influencing factors in the roadway during the over-watering and the roadway over-watering at a certain period of time after the change of the stress and displacement rule. Finally, the test results are obtained that show the influence of the roadway over-water height on the stability of the roadway perimeter rock is greater than the time of the roadway over-water and greater than the depth of the roadway.
Model Configuration and Creep Test of Water Inrush Roadway
Selection of Similar Materials and Determination of Similar Ratio
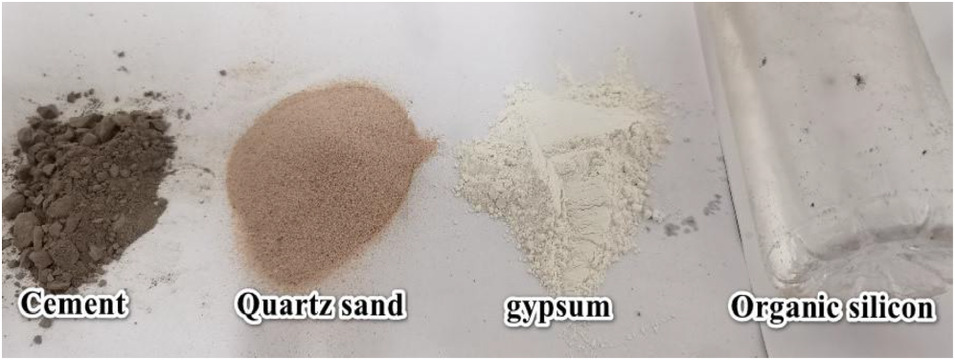
Li et al. (2012) derived a similar relationship based on the equations of elastodynamics or the method of magnitude analysis combined with the theory of fluid–solid coupling. Before the similar material ratio test in the model experiment, the similar material and the similar ratio should be determined, and the similar ratio and the similar material should be determined according to the geometric size, physical and mechanical characteristics, hydrologic characteristics of the target rock mass, as well as the experimental conditions. To ensure that the main performance indicators are similar (e.g., compressive strength, elastic modulus, tensile strength, permeability, water absorption, softening coefficient), the secondary performance indicators should be ignored. Through pre-experiments and relevant references, the similar materials are finally determined as quartz sand, cement, gypsum, and silicone. The cement is composite Portland cement (P.C42.5), the gypsum is glue-free white plaster, and the silicone aqueous solution is HCA 120, as shown in Fig. 1.
The similarity ratio is selected as follows:
Geometric similarity ratio
(1)
Bulk density similarity ratio
(2)
Then, it can be deduced aswhere Cσ = stress similarity constant; Cμ = Poisson’s ratio similarity constant; Cε = strain similarity constant; CE = elastic modulus constant; Ck = permeability coefficient similarity constant; and Ct = time similarity constant.
(3)
The parameter range of actual rock mass was obtained by referring to books related to rock mechanics, and the ideal parameter range of similar materials was determined according to the preceding similarity ratio, as presented in Table 1.
| Materials | Characterization | ||||||
|---|---|---|---|---|---|---|---|
| Compressive strength (MPa) | Modulus of elasticity (GPa) | Water absorption (%) | Softening coefficient | Coefficient of permeability (10−4cm/s) | Tensile strength (MPa) | Density (g/cm−3) | |
| Actual rock mass | 58.8–98.1 | 5–80 | 10–20 | 75–85 | 1.341–11.175 | 3.92–12.7 | 1.8–2.8 |
| Similar material | 1.176–1.962 | 0.1–1.6 | 10–20 | 75–85 | 0.19–1.58 | 0.0784–0.254 | 1.8–2.8 |
Orthogonal Experimental Analysis and Multiple Regression Equation
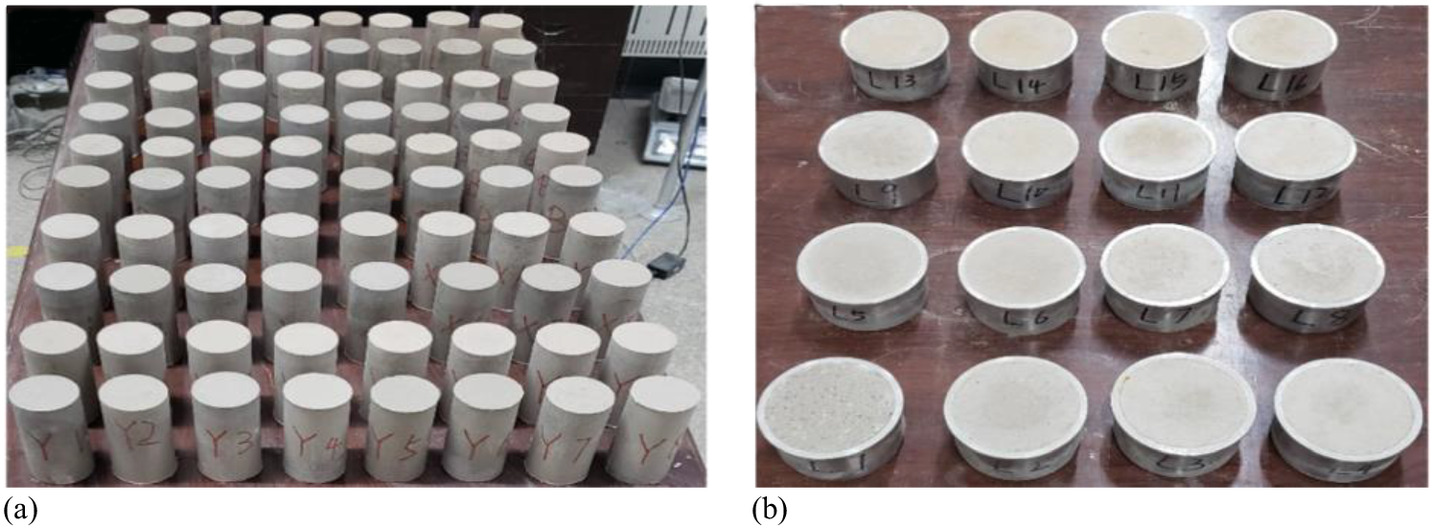
The L16(43) orthogonal test was designed using quartz sand, cement gypsum ratio, and silicone concentration as control factors Table 2. Four representative levels of each factor were determined (the water consumption of each group of specimens was about 10% of the time mass to ensure sufficient hydration reaction of the binder; silicone concentration is the mass fraction of silicone solution in water). A total of seven parameters for the physical and hydraulic properties required six orthogonal tests with 16 specimens each, for a total of 96 specimens. Specimens of similar materials are shown in Fig. 2.
| No. | Quartz sand content (%) | Cement:gypsum | The concentration of silicone |
|---|---|---|---|
| 1 | 60 | 1.5:1 | 10 |
| 2 | 65 | 1:1 | 15 |
| 3 | 75 | 1:1.5 | 20 |
| 4 | 80 | 1:2 | 25 |
Analysis of Orthogonal Experimental Results
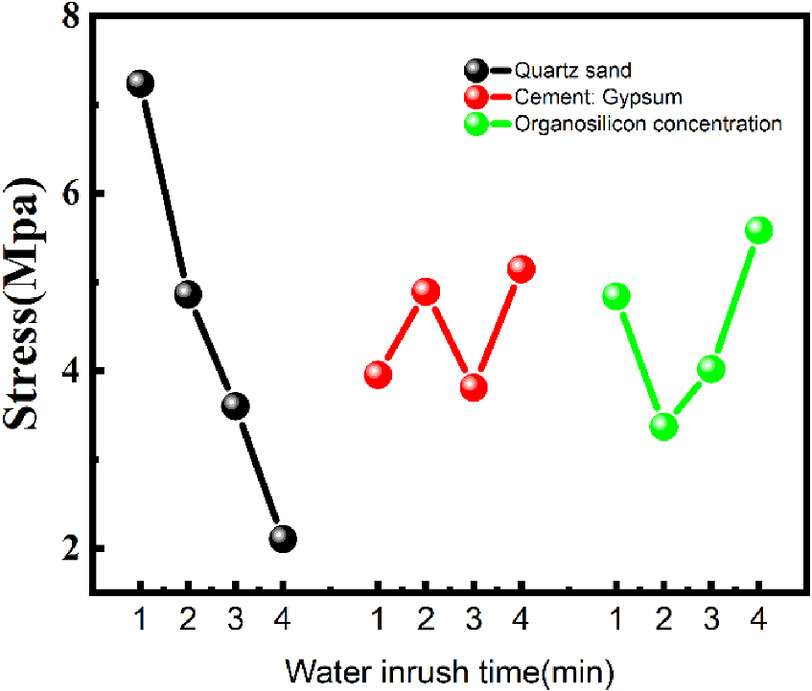
The orthogonal analysis of the experimental results is presented in Table 3. The orthogonal analysis shows that, taking the compressive strength as an example, the compressive strength of similar materials ranges from 1.689 to 10.861 MPa. The compressive strength sensitivity analysis is illustrated in the Fig. 3. The influence factor of quartz sand is 5.138, the influence factor of organosilicon concentration is 2.214, and the influence factor of cement:gypsum is 1.33, which is the smallest. The sensitivity of each factor to compressive strength was quartz sand > organosilicon concentration > cement:gypsum.
| No. | Quartz sand content (%) | Cement: gypsum | Silicone concentration (%) | Compressive strength (MPa) | Modulus of Elasticity (GPa) | Water absorption (%) | Softening coefficient | Coefficient of permeability (10−4cm/s) | Tensile strength (MPa) | Density (g/cm−3) |
|---|---|---|---|---|---|---|---|---|---|---|
| 1 | 65 | 1.5:1 | 10 | 7.257 | 1.501 | 16.095 | 46.46 | 1.700 | 1.233 | 1.89 |
| 2 | 65 | 1:1 | 15 | 4.714 | 1.324 | 17.048 | 92.86 | 1.889 | 0.523 | 1.85 |
| 3 | 65 | 1:1.5 | 20 | 6.132 | 1.397 | 18.452 | 48.48 | 3.258 | 0.662 | 1.87 |
| 4 | 65 | 1:2 | 25 | 10.861 | 1.179 | 15.826 | 37.33 | 1.947 | 0.415 | 1.91 |
| 5 | 70 | 1.5:1 | 15 | 3.207 | 0.710 | 14.497 | 63.28 | 0.509 | 0.571 | 1.94 |
| 6 | 70 | 1:1 | 10 | 7.523 | 1.306 | 16.634 | 59.64 | 1.802 | 0.548 | 1.87 |
| 7 | 70 | 1:1.5 | 25 | 4.506 | 0.539 | 16.019 | 64.29 | 0.554 | 0.572 | 1.91 |
| 8 | 70 | 1:2 | 20 | 4.217 | 0.895 | 16.933 | 84.80 | 0.328 | 0.457 | 1.85 |
| 9 | 75 | 1.5:1 | 20 | 3.026 | 0.824 | 14.503 | 60.87 | 1.038 | 0.310 | 1.87 |
| 10 | 75 | 1:1 | 25 | 4.639 | 0.772 | 15.444 | 95.42 | 0.665 | 0.388 | 1.85 |
| 11 | 75 | 1:1.5 | 10 | 2.893 | 0.789 | 14.898 | 51.31 | 2.048 | 0.376 | 1.86 |
| 12 | 75 | 1:2 | 15 | 3.833 | 0.895 | 17.749 | 65.22 | 1.590 | 0.305 | 1.84 |
| 13 | 80 | 1.5:1 | 25 | 2.317 | 0.723 | 16.190 | 77.68 | 5.148 | 0.191 | 1.84 |
| 14 | 80 | 1:1 | 20 | 2.695 | 0.543 | 16.243 | 56.26 | 1.261 | 0.080 | 1.76 |
| 15 | 80 | 1:1.5 | 15 | 1.712 | 0.298 | 17.580 | 62.63 | 1.174 | 0.288 | 1.82 |
| 16 | 80 | 1:2 | 10 | 1.689 | 0.690 | 19.641 | 61.93 | 2.170 | 0.165 | 1.73 |
According to the variance analysis in Table 4, the maximum contribution rate of quartz sand is 77.44%, followed by organosilicon concentration of 15.23%, and finally cement:gypsum 7.33%. Thus, quartz sand has the most significant effect on compressive strength.
| Factor | Deviation sum of squares | Degree of freedom | F ratio | F critical value | Contribution rate (%) |
|---|---|---|---|---|---|
| Quartz sand content | 56.776 | 3 | 2.323 | 3.860 | 77.44 |
| Cement:gypsum | 5.372 | 3 | 0.22 | 3.860 | 7.33 |
| Concentration of silicone | 11.168 | 3 | 0.457 | 3.860 | 15.23 |
| Error | 73.316 | 9 | — | — | — |
The analysis of other parameters is similar to the analysis of compressive strength (specific data graphs of other parameters will be included in the online supplemental materials ), and the results are as follows.
For the elastic modulus, the influence factor range of quartz sand is a maximum of 0.939, while the influence factor range of organosilicon is a minimum of 0.264. ANOVA shows that quartz sand has a significant influence on this factor.
For water absorption, the influence of cement is as follows: the influence range of gypsum is 2.216, and the influence range of silicone is 0.947. ANOVA shows that quartz sand and cement gypsum have a significant influence on this factor. For the softening coefficient, the influence factor of cement gypsum ratio has the largest range of 19.367, the influence factor of organosilicon concentration range of 16.163 is in the middle, and the influence factor of quartz sand has the smallest range of 11.923. According to the ANOVA, the concentration of quartz sand, cement, gypsum and organosilicon has a relatively significant effect on the factor.
Quartz sand has the greatest influence on the permeability coefficient, with a range of 1.64, and cement gypsum ratio has the least influence, with a range of 0.695. The comparison yields that quartz sand has a relatively large effect on various factors.
The maximum effect of tensile strength on quartz sand was 0.527, while the minimum effect of silicone concentration was 0.204. Finally, it was concluded that the effect of quartz sand on each factor was relatively significant.
In terms of density, the maximum range for quartz sand is 0.105 and the minimum range for organosilicon concentration is 0.04. It can be concluded that quartz sand has a relatively large influence on the factors.
It can be obtained that the content of quartz sand has the greatest effect on compressive strength, modulus of elasticity, coefficient of permeability, tensile strength, and density, and the content of cement and gypsum has a significant effect on water absorption and softening coefficient.
According to the parameter range of similar materials in Table 1 and the preceding analysis, the optimal ratio is determined as follows: quartz sand is 80%–85%; cement gypsum is between 1.5 and 1; due to the high content of quartz sand, the cement gypsum ratio is in the middle, resulting in a lower softening coefficient being achieved because the concentration of silicone has a more obvious effect on the softening coefficient, so the ratio should be 25%–35%.
Multiple Linear Regression Equation
If we let quartz sand be x1, the ratio of cement to gypsum be x2, and silicone concentration be x3, then the compressive strength index is Y1, elastic modulus index is Y2, water absorption index is Y3, softening coefficient index is Y4, permeability coefficient index is Y5, tensile strength index is Y6, and density index is Y7. This can be presented as
(4)
MATLAB software was used to solve the preceding equation. The compiler used the least square method to solve the solution of Y1, Y2, Y3, Y4, Y5, Y6, and Y7 through the optimal matching range of the three independent variables: x1, x2, and x3. Therefore, the ratio of fluid–solid coupling similar material used in the model test is as follows: quartz sand = 81.32%; cement:gypsum = 1.38:1; and silicone concentration = 31.6%. Its corresponding parameters are presented in the Table 5.
| Material | Model |
|---|---|
| Quartz sand content (%) | 81.32% |
| Cement:gypsum | 1.38:1 |
| Silicone concentration (%) | 31.6% |
| Compressive strength (MPa) | 1.9 |
| Modulus of elasticity (GPa) | 1.1 |
| Water absorption (%) | 15 |
| Softening coefficient | 80 |
| Coefficient of permeability (10−4cm/s) | 1.5 |
| Tensile strength (MPa) | 0.2 |
| Density (g/cm−3) | 1.8 |
Creep Experiment of Water-Inrush Roadway Model
Model Test System
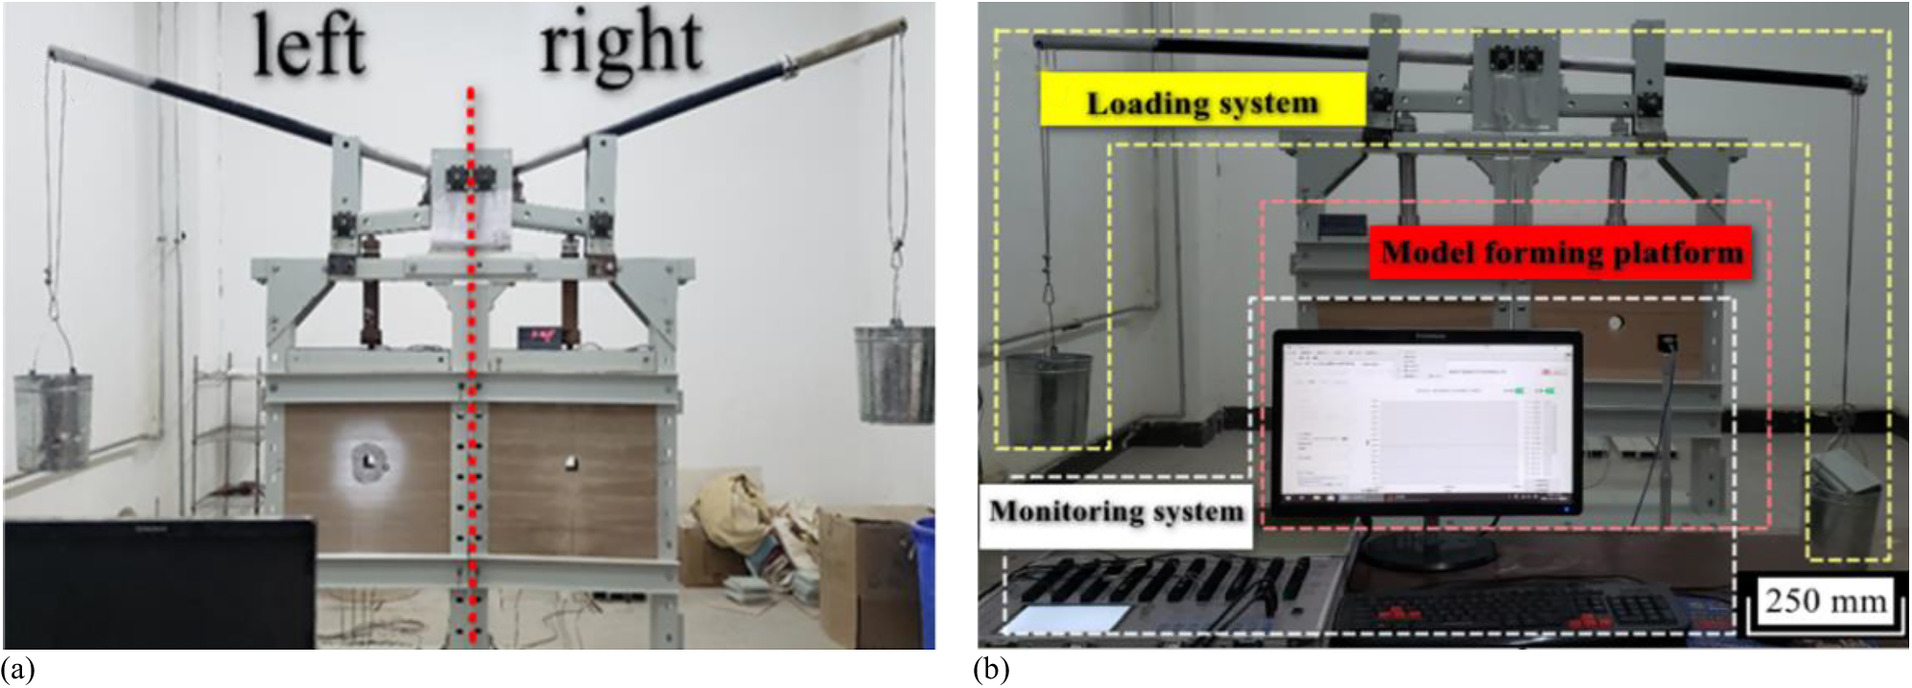
The main structure of the model test system is illustrated in Fig. 4(a), which is divided into two separate test areas on the left and right, each of which can be used for creep test independently. The model test system is divided into three parts, including loading system, model-forming platform, and monitoring system [Fig. 4(b)].
Loading System
The loading system is an important part of the applied stress boundary conditions in the model test system. The loading method used in this test system is heavy load, which has the advantage of constant loading force and thus is no need to compensate the loading force (Fig. 5).
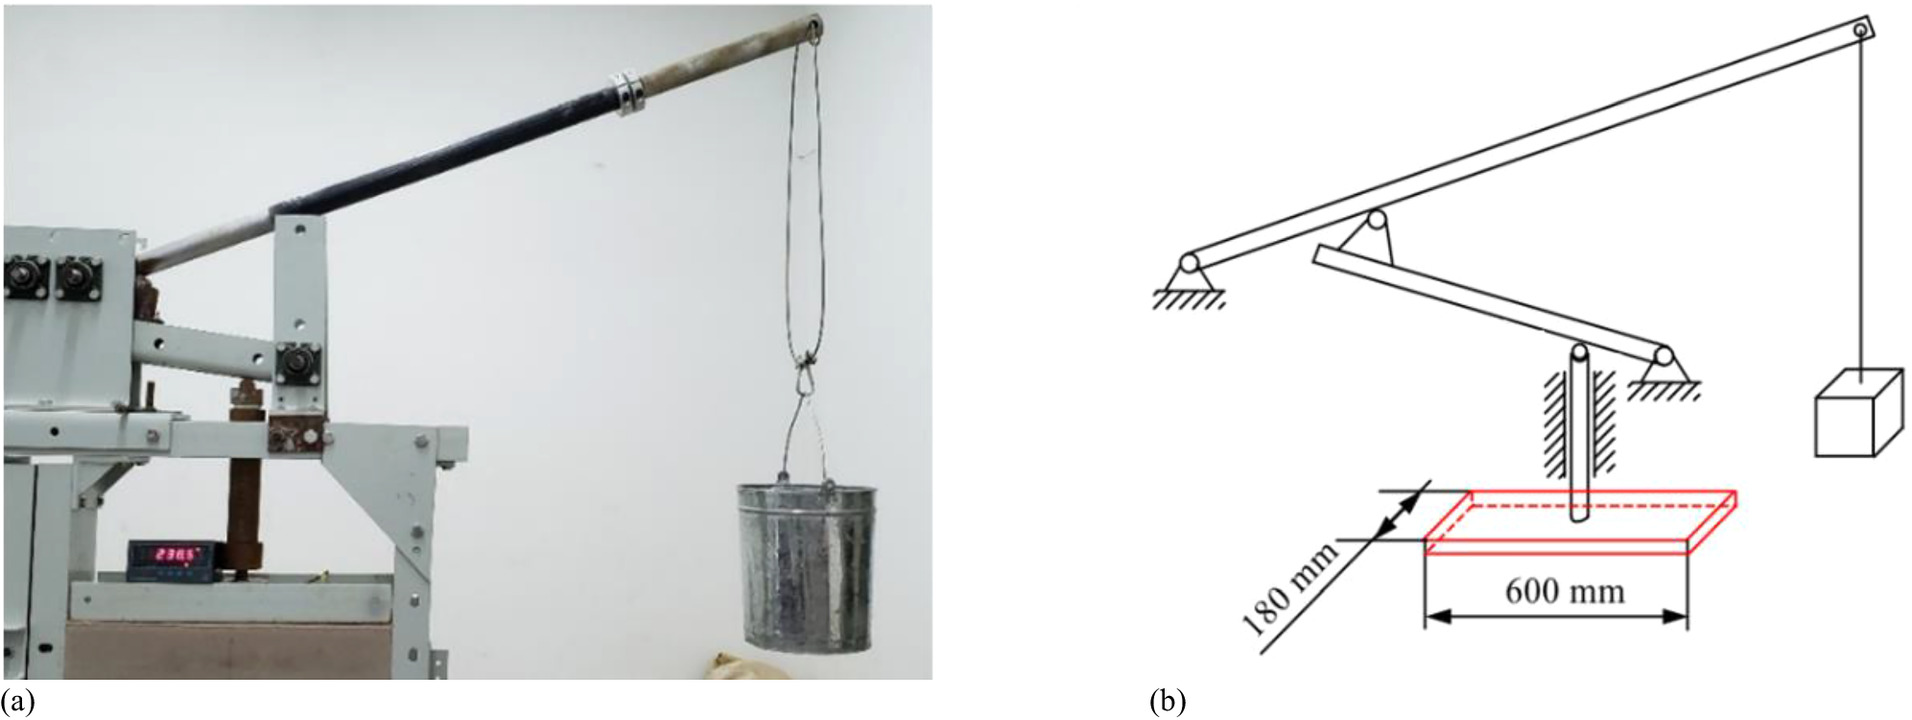
Fig. 5. Loading system: (a) two-level lever physical picture; and (b) two-stage lever schematic diagram.
(Images by Ziyi Zhou.)
Monitoring System
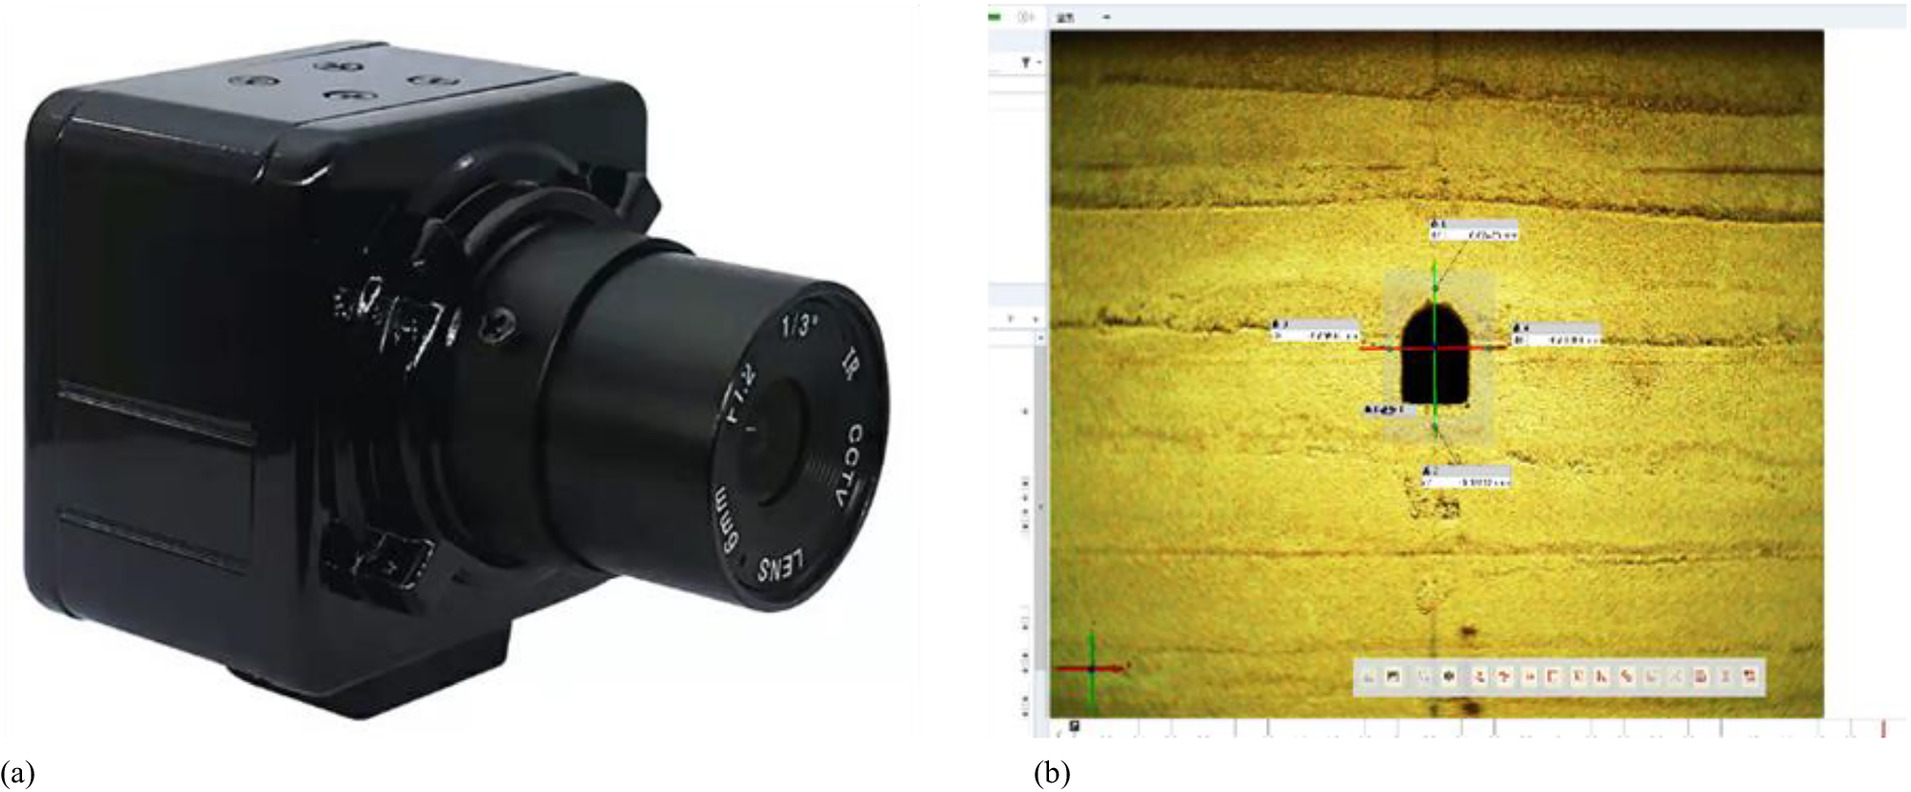
The experimental monitoring system is divided into two parts. The first is the pressure monitoring system. In the process of model forming, the pressure sensor is embedded in the designed position so as to obtain the pressure change data in the creep process. The second is the displacement monitoring system, which uses S-Eye software to control the CCD camera SHL-500W to take photos. Every 10 min, the system will take photos of the roadway. During the creep test, deformation will occur in the roadway, and the deformation will be photographed and recorded. All the images are then imported into GOM software, and the deformation of the roadway is obtained by comparing the changes of the roadway in the photos. The displacement monitoring system is illustrated in the Fig. 6.
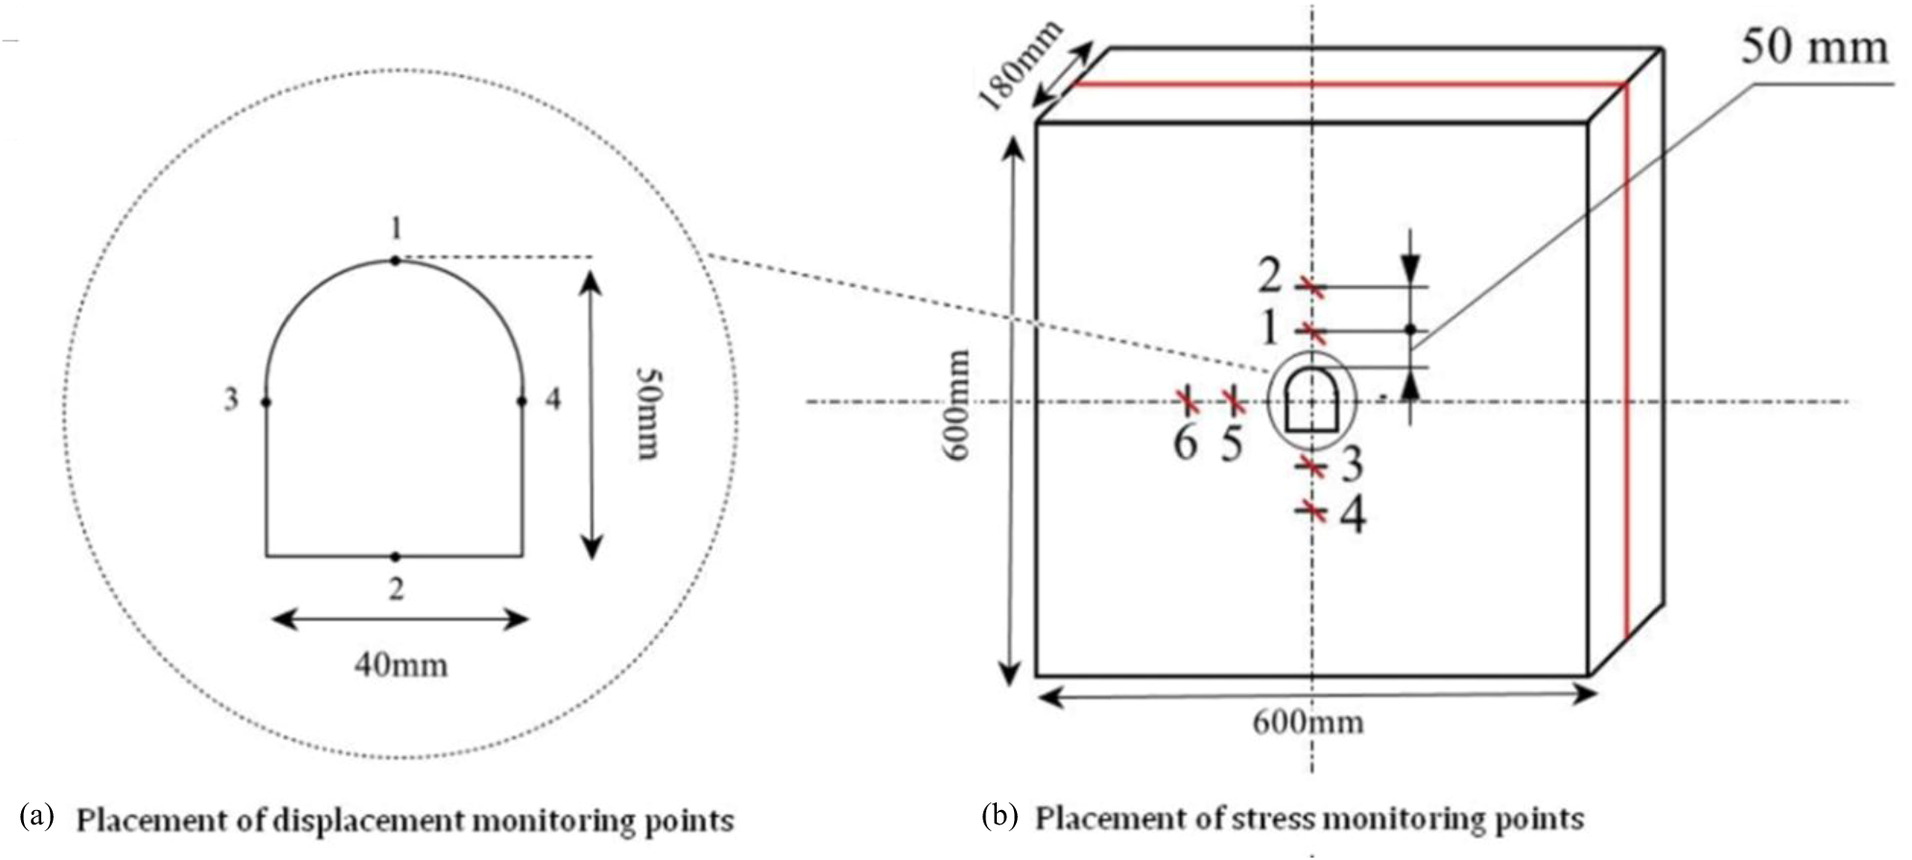
Model-Forming Platform
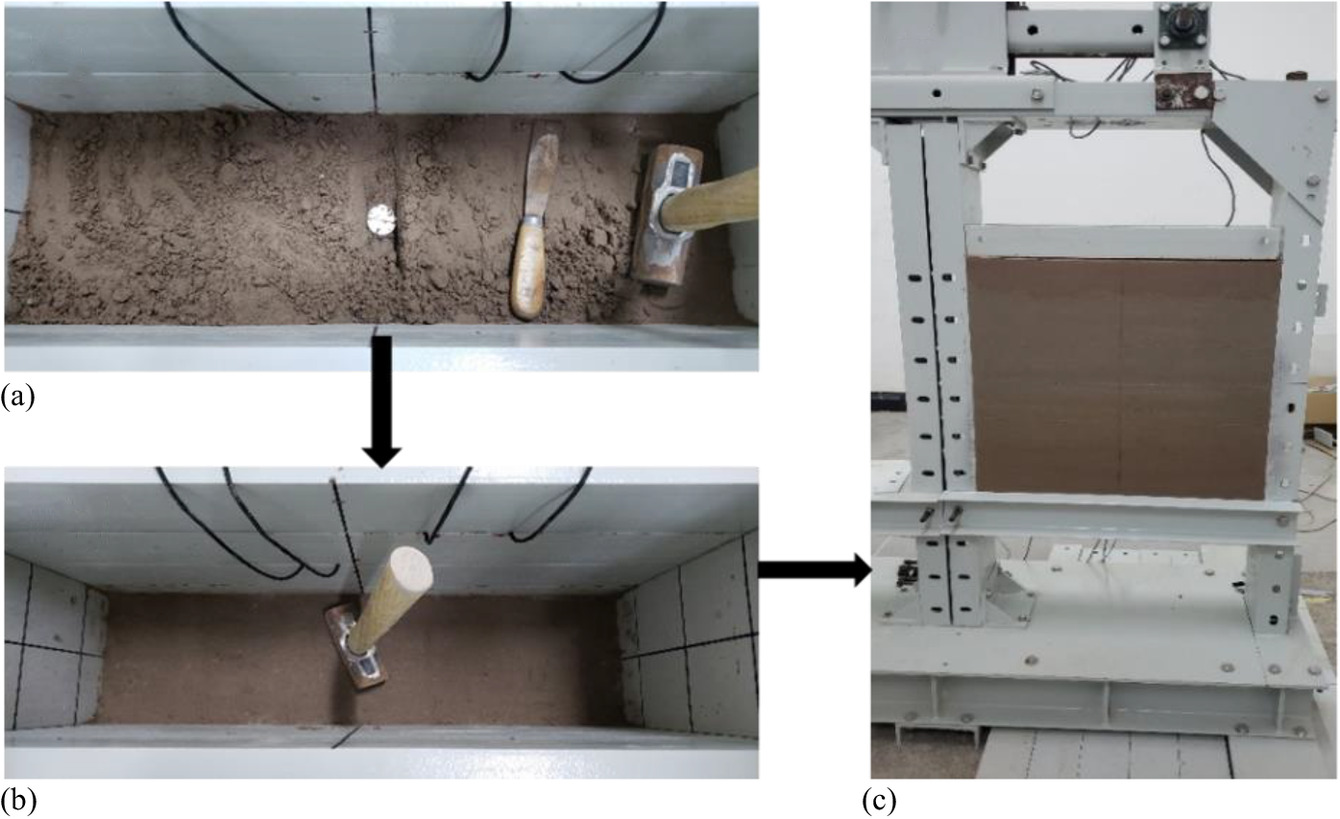
The model-forming platform includes the model frame and the water-retaining device. The similar materials are poured into the model frame for layering and compacting, during which time the pressure sensor is embedded in the designed location as shown in the Fig. 7(b). The final molding size is 600 × 600 × 180 mm and after seven days of drying, the similar model was excavated according to the established shape of the chamber with an excavation tool as presented in the Fig. 4(a). The position of the displacement monitoring point is illustrated in the Fig. 7(a).
Water-Retaining Device
In order to simulate the water inrush of the roadway, this paper designs and produces a device for roadway water flushing. The device consists of front and rear baffles, bolts, measuring cylinders, and water inlet pipes. The front and rear baffles of the device are fixed on the front and rear ends of the roadway by fixing bolts, and a small amount of glue is applied between the baffles and the roadway to achieve a degree of sealing. At this time, the constant water device forms a communication device with the roadway and its surrounding rock, and uses this principle to adjust the water level of the measuring cylinder and to control the water level in the roadway, as shown in Fig. 8.
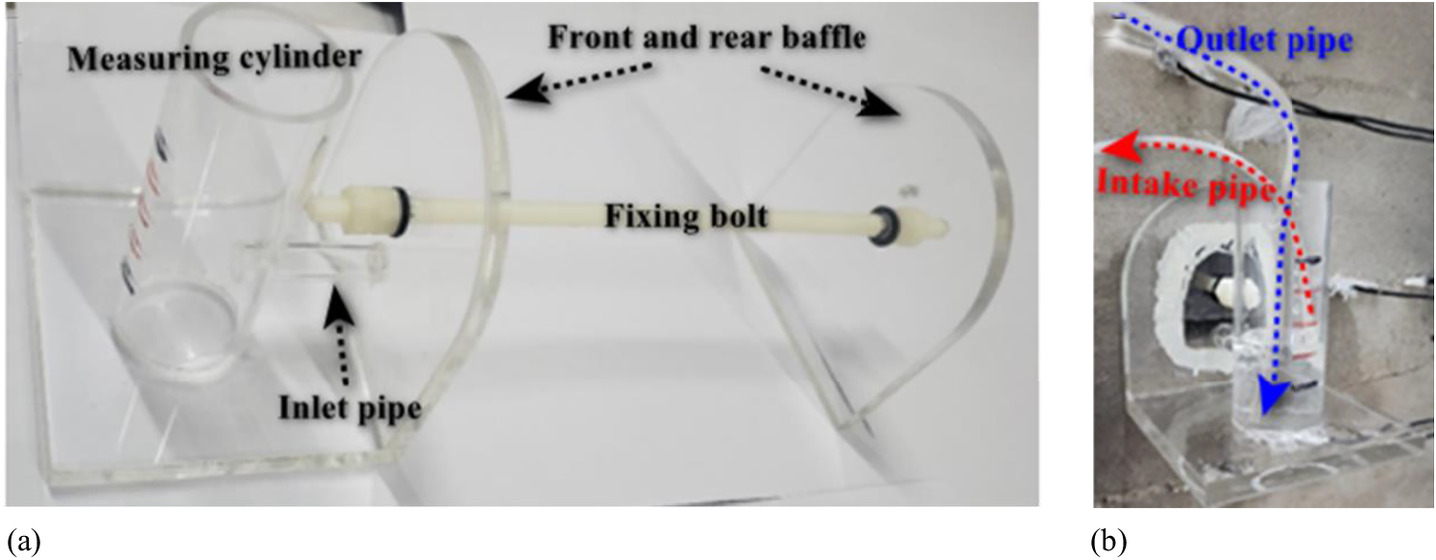
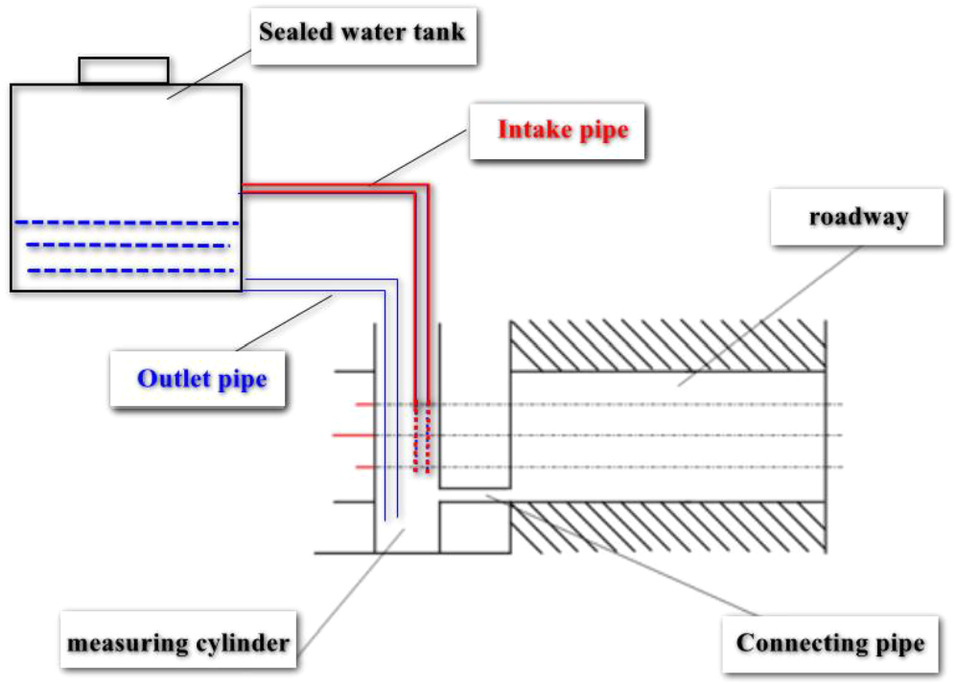
However, as the creep test is carried out, the water in the roadway will gradually penetrate into the surrounding rock of the roadway, thereby reducing the water level. In order to ensure the constant factors affecting water level, this paper designed the automatic water-refill device as illustrated in Fig. 9. The working principle is as follows: the sealed water tank is connected with the outside world only through the outlet pipe and the intake pipe. Owing to the existence of the water level difference, the water will flow from the sealed water tank to the measuring cylinder through the outlet pipe. At this time, the internal pressure of the water tank decreases, so the air enters the box from the intake pipe to balance the internal and external pressure. The air intake pipe will be flooded by the rising water level in the measuring cylinder, and as a result, air is unable to entered the tank, thus preventing the discharge of water through the water outlet pipe. As the creep test was carried out, the water level in the roadway gradually dropped, and the water level in the measuring cylinder also dropped and the water pressure decreased, so the outlet pipe continued to discharge water until the pressure inside and outside the tank was balanced. Through automatic water replenishment in this way, a constant water level could be achieved. The constant water level at different heights could then be achieved by adjusting the position of the intake pipe in the measuring cylinder.
Creep Test Design and Process
For the influencing factors of water-surge roadways on the stability of surrounding rock, orthogonal test L9 (33) was designed, as presented in Table 6. The three influencing factors are the depth of the roadway, the height of the water surge, and the time of the water surge. Three representative levels are selected for each factor, and the stresses at six measurement points and the displacement changes at four measurement points are monitored in the model test.
| No. | Factors | |||
|---|---|---|---|---|
| Depth of roadway (m) | Height of water inrush (mm) | Time of water inrush (min) | Orthogonal test | |
| 1 | 200 | 1/4 H | 40 | Orthogonal test factor level |
| 2 | 400 | 1/2 H | 60 | |
| 3 | 600 | 3/4 H | 80 | |
| 1 | 200 | 1/4 H | 40 | Orthogonal test ratio scheme |
| 2 | 200 | 1/2 H | 60 | |
| 3 | 200 | 3/4 H | 80 | |
| 4 | 400 | 1/4 H | 60 | |
| 5 | 400 | 1/2 H | 80 | |
| 6 | 400 | 3/4 H | 40 | |
| 7 | 600 | 1/4 H | 80 | |
| 8 | 600 | 1/2 H | 40 | |
| 9 | 600 | 3/4 H | 60 | |
Note: H is the roadway height of 50 mm.
According to the optimal ratio of similar materials in Table 5, similar materials were stirred, which were filled in the model using layered compaction and embedded pressure sensors, and maintained for seven days, as shown in Fig. 10. After seven days, the model was excavated and the water-constant device was placed after the roadway was formed. The test during water inrush was carried out by loading the ground stress with the two-stage lever, and the data were recorded. The test after the water inrush was continued, and the subsequent stress and displacement changes of the model were monitored within 24 h. (Note: According to the similarity ratio theory, , therefore, the time corresponding to the actual project is about seven times that of the model test; that is, 24 h in model test is equivalent to about 7 days in practical engineering).
Creep Test Results and Analysis
Taking Test 9 as an example, its depth of roadway is 600 m, water-inrush height is 3/4 H, and the water-inrush time is 60 min. The experimental results and analysis are discussed in the following subsections.
Variation of Perimeter Rock Pressure with Time during and after Water Inrush
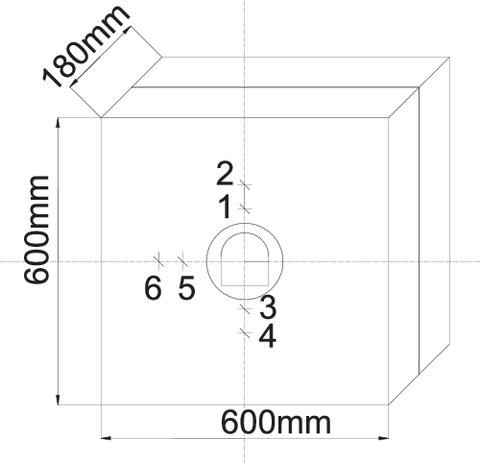
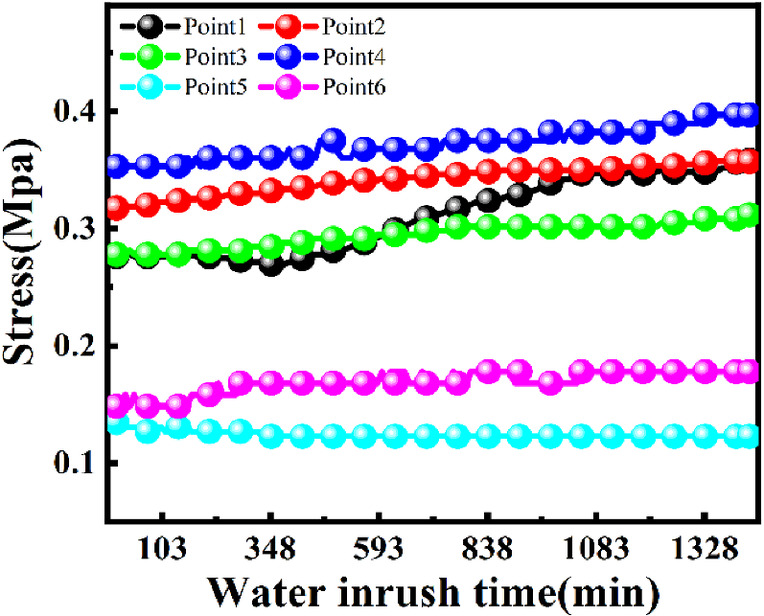
The locations of the six measurement points around the tunnel peripheral rock are shown in Figs. 11 and 12 shows the curves of the stresses of the six measurement points during the water-influx process over time. The vertical stress at measurement point 1 shows a decreasing trend in general, from 0.286 MPa at 0 min to 0.276 MPa at 82 min, with a decreasing rate of 3.50%. The main reason for this is that the tunnel was flooded for a long time, the water level was deeper, and Measuring Point 1 was near the top of the tunnel, so the similar materials around Measuring Point 1 softened, resulting in an overall decrease in stress. The overall vertical stress at Measuring Point 2 increased from 0.308 MPa at 0 min to 0.317 MPa at 82 min, with a growth rate of 2.92%. There are two main reasons for this. First, Measuring Point 2 is 100 mm away from the top surface of the roadbed, which is less affected by the water influx than Measuring Point 1, which ensures that the softening degree of similar materials around measuring point 2 is weaker. Second, the softening of similar materials around Measuring Point 1 will lead to the redistribution of stresses around Measuring Point 1. At this point, Measuring Point 2 replaces Measuring Point 1 as the main load-bearing component, so its stresses will increase.
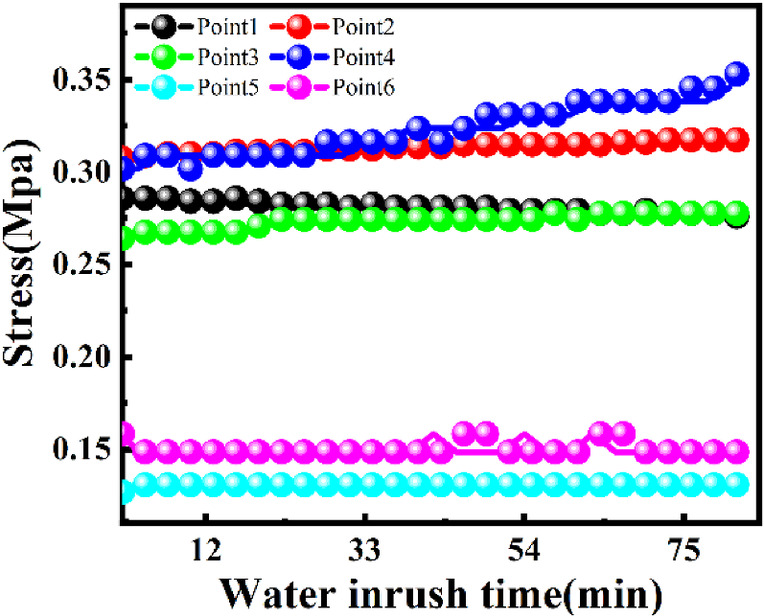
The trend of Measuring Points 3 and 4 should be the same as the trend of Measuring Points 1 and 2. However, the stress change at Measuring Point 3 increased from 0.264 MPa at 0 min to 0.278 MPa at 82 min by 5.30%. The stress change at Measuring Point 4 increased from 0.302 MPa at 0 min to 0.353 MPa at 82 min with an increase of 16.89%, which was contrary to the situation at Measuring Points 1 and 2. The reason for this is that similar materials in the model have higher water absorption and larger softening coefficient, so they are relatively difficult to soften. In other words, the pressure increase caused by water absorption and weight gain of similar materials is greater than the pressure loss caused by water absorption and softening. This “one plus one minus” effect eventually shows an overall trend of a slow rise, as shown Fig. 12. In the same way, on the one hand, because Measuring Point 4 is far from the arch bottom, the softening effect of similar materials around it is relatively weak. On the other hand, the permeability coefficient, water absorption, and other mechanical properties of similar materials are larger, and the weight increases more. Therefore, under the joint action of the two main factors, the stress value at Measuring Point 4 has a fast rising trend.
During the period 0–3 min, the horizontal stress at Measuring Point 5 showed a slight upward trend, increasing from 0.123 to 0.131 MPa with an increase rate of 6.50%, and then remained at 0.131 MPa. The variation range of Measuring Point 6 is small and the overall stability is 0.149 MPa. It can be seen that during the roadway water inrush, the impact on both sides of the roadway is small. To sum up, during the water inrush, the stress of arch roof and arch bottom is greatly affected, so the deformation is concentrated in the vertical direction, and the horizontal direction is small.
Stress monitoring after water inrush is shown in Fig. 13, which is similar to the analysis during water inrush. It can be summarized as follows: the pressure change at Measuring Points 1–4 gradually rises, because similar materials have creep; as time goes by, the creep of roadway surrounding rock increases, so does its pressure; the change of Measuring Points 5–6 is small, indicating that the change in the vertical direction is more obvious than that in the horizontal direction.
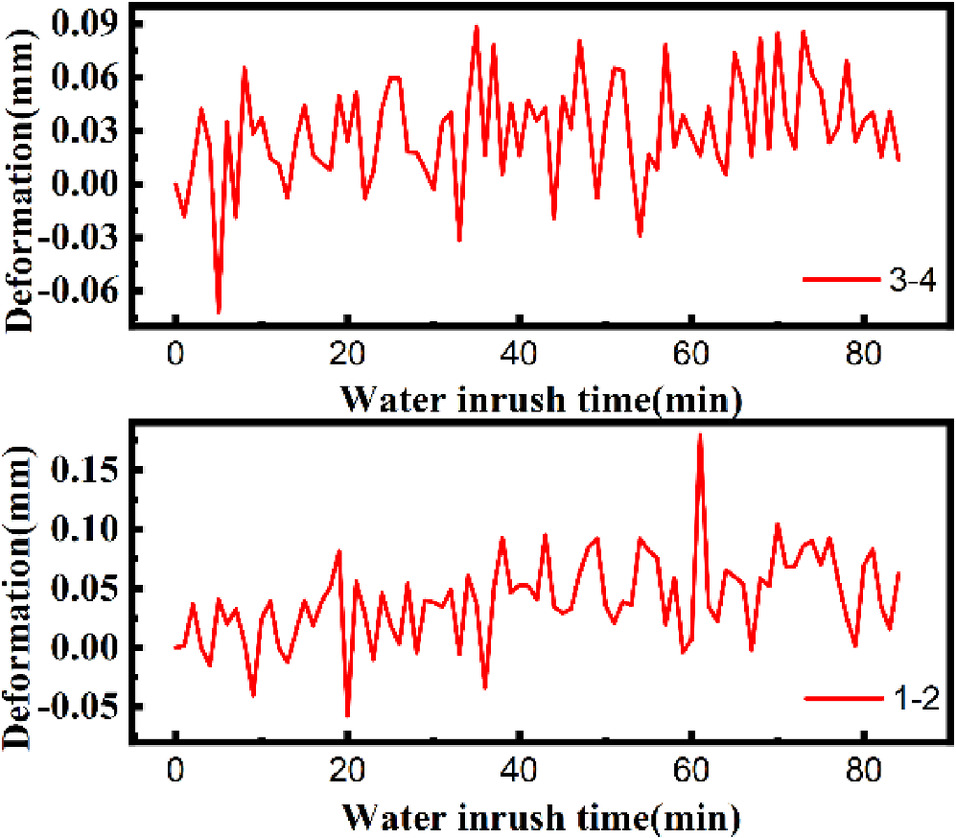
Variation of Perimeter Rock Displacement with Time during and after Water Inrush
The results of the displacement detection at the four Measuring Points of Test 9 during the water inrush are illustrated in Fig. 14. If the convergence value of shrinkage deformation is positive, this means that the measuring point moves into the roadway; otherwise, it is negative. Measuring Points 1–2 are vertical convergent deformations, mainly in the forward direction, with a maximum value of 0.180 mm. Measuring Points 3–4 are horizontal convergent deformations, mainly positive deformations, with a maximum value of 0.089 mm. It can be seen that the vertical deformation is much larger than the horizontal deformation, so during the roadway water inrush, the main convergence deformation is in the vertical direction. The results are consistent with the aforementioned stress detection results.
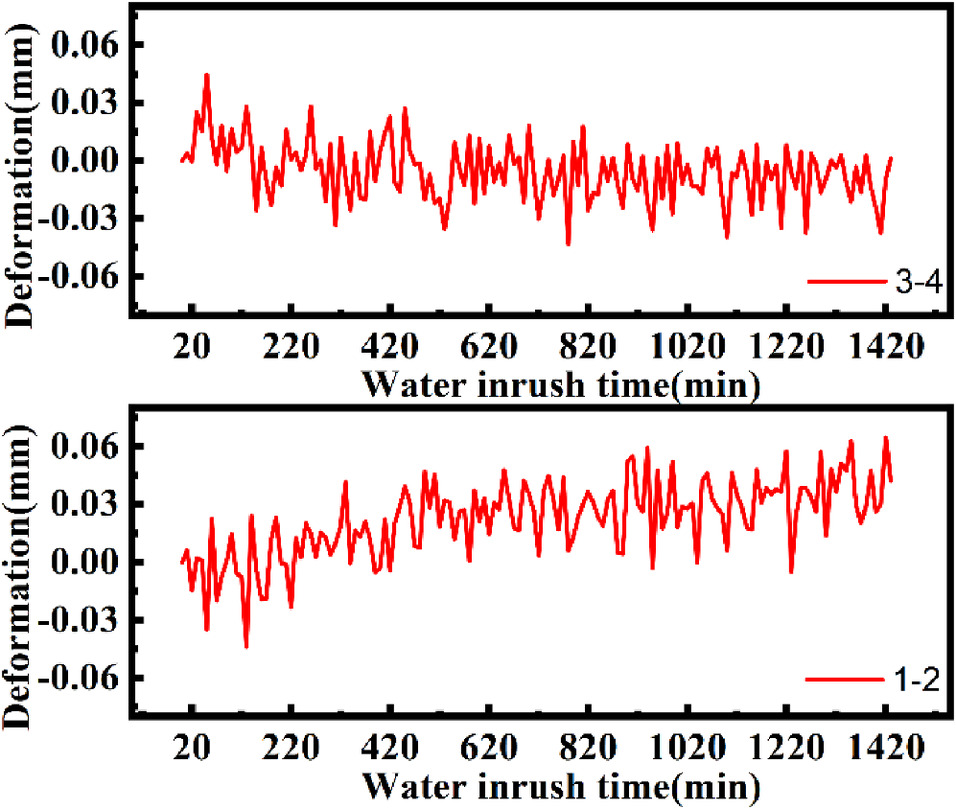
Displacement monitoring after water inrush is shown in Fig. 15. The convergent deformation in the vertical direction is mainly positive, and the convergent deformation in the vault direction is mainly inside the roadway, and the maximum convergent deformation value is 0.065 mm. In the horizontal direction, the change is mainly negative. The arch waist deforms outside the roadway, and the maximum convergence deformation value is −0.043 mm. According to the test results, it can be obtained that the deformation of the roadway after water ingress is mainly concentrated in the vertical direction. It can be seen from the stress monitoring and displacement monitoring that the deformation of the roadway after water ingress is mainly concentrated in the vertical direction.
Orthogonal Analysis of Creep Test
The other eight experimental analysis procedures are similar to the preceding Test 9 analysis and will not be described here (the detailed data graphs will be placed in the online supplemental materials ). The main deformation, that is, the vertical deformation, is taken as the reference result, as presented in Table 7.
| Test group Convergence deformation value/(mm) | Test 1 | Test 2 | Test 3 | Test 4 | Test 5 | Test 6 | Test 7 | Test 8 | Test 9 |
|---|---|---|---|---|---|---|---|---|---|
| Convergence deformation value during water inrush (mm) | 0.069 | 0.049 | 0.126 | 0.057 | 0.056 | 0.068 | 0.074 | 0.041 | 0.065 |
| Convergence deformation value after water inrush (mm) | 0.069 | 0.049 | 0.126 | 0.057 | 0.056 | 0.068 | 0.074 | 0.041 | 0.065 |
As shown in Fig. 16, it can be obtained that the sensitivity analysis of the stability of the roadway perimeter rock during water influx is water-influx height > water-influx time > roadway depth. Among the three factors, the water-inrush height range of 0.124 is much larger than the other two factors, that is, the change of the water-inrush height has an obvious influence on the roadway deformation. When the water-inrush height exceeds half of the roadway height, the roadway surrounding rock deformation rapidly deforms from 0.08 mm to about 0.21 mm, this is because the high pressure of water will quickly penetrate into the surrounding rock of the roadway and make it soften. The second factor is the water-inrush time. After the water-inrush time is 80 min, the deformation of roadway surrounding rock increases rapidly from 0.11 to 0.16 mm, this is because with the increase of immersion time, the seepage range and softening degree of roadway surrounding rock will increase rapidly. However, the variation of depth of roadway has little influence on the deformation of the surrounding rock.
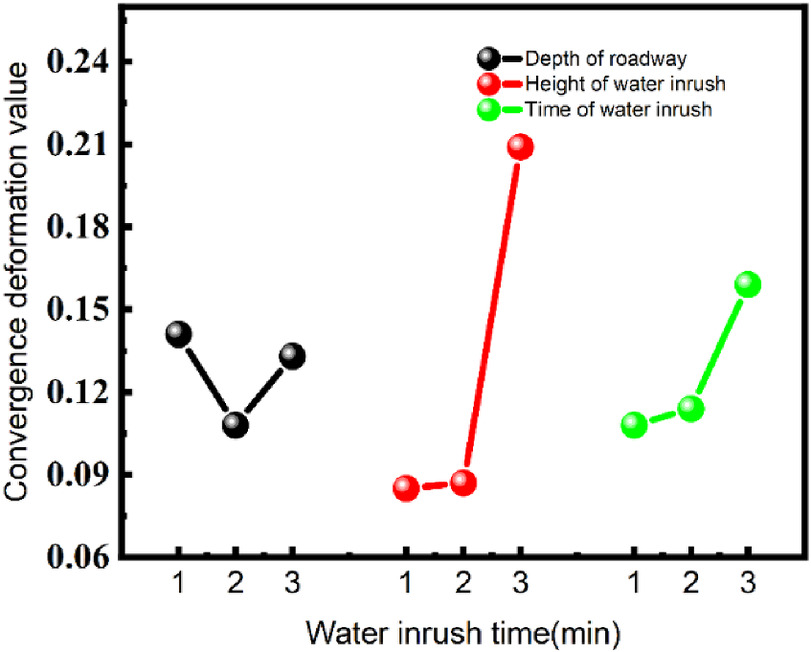
From the ANOVA in Table 8, it can be concluded that among the influencing factors the contribution rate of the water passage height is the largest at 81.09%, followed by the contribution rate of water passage time at 13.51%, and the contribution rate of burial depth at 5.40%. In other words, the height of water passage has the greatest influence on the stability of the roadbed.
| Factor | Deviation sum of squares | Degree of freedom | F ratio | F critical value | Contribution rate (%) |
|---|---|---|---|---|---|
| Depth of roadway (m) | 0.002 | 2 | 0.162 | 5.140 | 5.40 |
| Height of water inrush (mm) | 0.03 | 2 | 2.432 | 5.140 | 81.09 |
| Time of water inrush (min) | 0.005 | 2 | 0.405 | 5.140 | 13.51 |
| Error | 0.04 | 6 | — | — | — |
After water inrush, that is, the water in the roadway is drained, the sensitivity analysis of the roadway deformation is as follows: water-inrush height > water-inrush time > depth of roadway, as shown in Fig. 17. The subsequent deformation of the roadway surrounding rock within 24 h after water inrush is much smaller than during the water inrush, basically keeping within 0.09 mm.
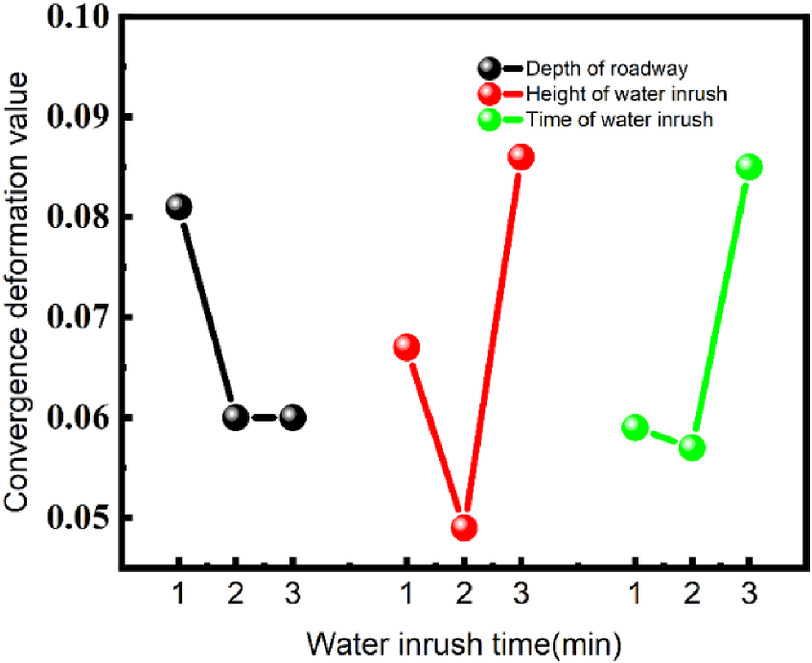
As for the influence factors of the tunnel depth, it can be obtained that when the depth is increased from 200 to 400 m, the deformation of the tunnel perimeter rock decreases from 0.08 to 0.06 mm. This is because with the increase of the depth of burial, the ground stress also increases, and the tunnel perimeter rock becomes closer under the action of the huge ground stress, which reduces the effect of the water influx on the softening of the tunnel perimeter rock. Similarly, the softening degree of the roadway surrounding rock increases with the increase of the gushing water height and time: the higher the height of water influx, the greater the effect on the softening of the top of the roadway surrounding rock, and the greater the deformation.
From the ANOVA in Table 9, it can be obtained that the contribution of water permeability height is the largest at 50%, followed by the contribution of water permeability time and burial depth, both at 25%. In other words, the height of water flow has the greatest influence on the stability of the roadway.
| Factor | Deviation sum of squares | Degree of freedom | F ratio | F critical value | Contribution rate (%) |
|---|---|---|---|---|---|
| Depth of roadway (m) | 0.001 | 2 | 0.750 | 5.140 | 25 |
| Height of water inrush (mm) | 0.002 | 2 | 1.500 | 5.140 | 50 |
| Height of water inrush (mm) | 0.001 | 2 | 0.750 | 5.140 | 25 |
| Error | 0 | 6 | — | — | — |
In summary, from the results of the model test, it can be obtained that the main deformation direction of the tunnel’s surrounding rock is vertical, and the deformation is larger in the period of water gushing. The height of water influx has the greatest influence on the deformation during and after water influx. Therefore, in the actual project, the water should be drained in time during and after the water influx to reduce the water level. According to different tunnel depths and surge times, there should be reasonable arrangements for rescue work. The deformation at the top of the tunnel should be reinforced in time to reduce casualties and property losses.
Numerical Simulation Analysis
Model Parameters
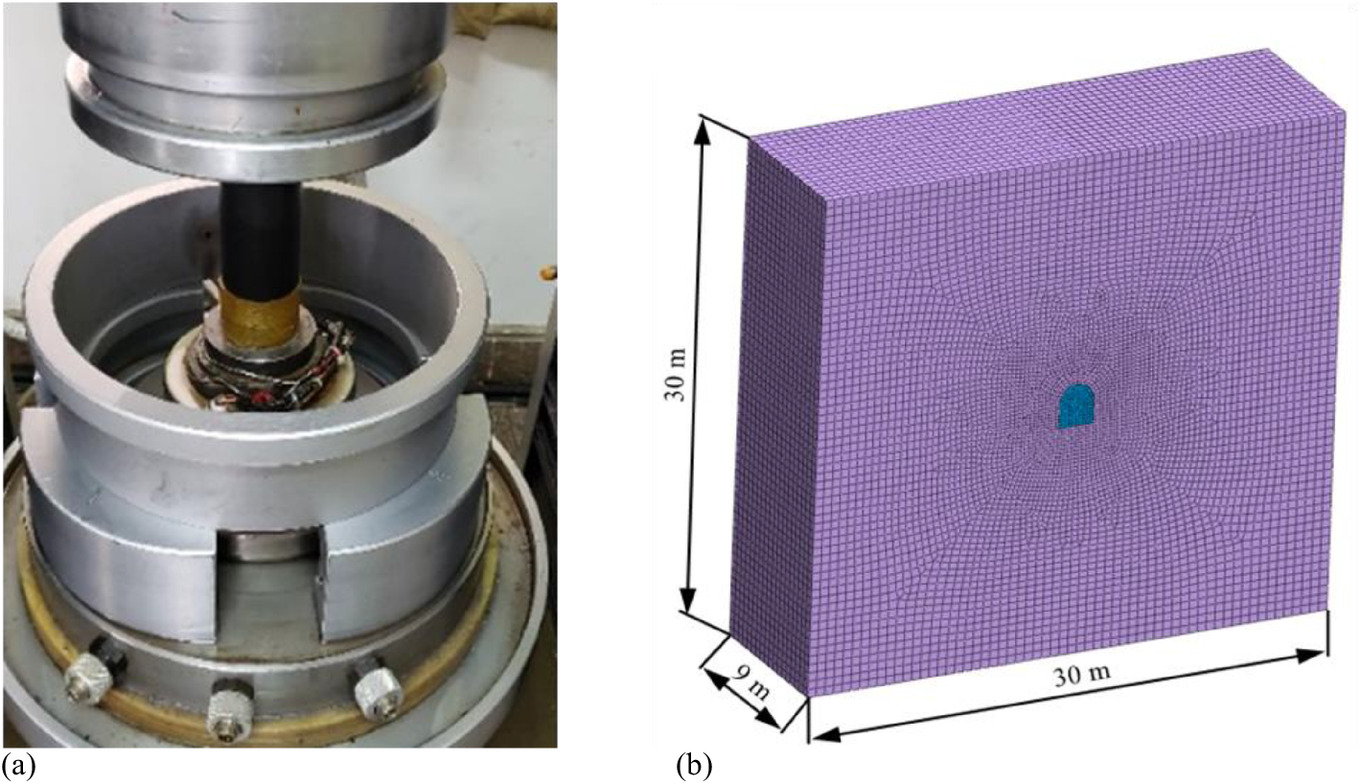
In this paper, Midas GTS NX is used as the numerical analysis software and the constitutive model is the Mohr-Coulomb model. The input Mohr-Coulomb constitutive model required five parameters to simulate the change rule of the actual situation: through the simulation of the actual engineering to verify and extend the relevant conclusions drawn from the test; and through the three-axis compression experiments, as shown in Fig. 18(a). The cohesion C of the model pavement and the angle of internal friction φ are presented in Table 10. In the numerical simulation software, the size of the model is L × W × H = 30 × 30 × 9 m, and the shape of the roadway section is 2 × 2.5 m straight-walled semicircular arch (this size is the actual rock size), as shown in Fig. 18(b). Boundary constraints are automatically constrained: X-direction displacements are limited to the two sides of the model, Y-direction displacements are limited to the front and back sides of the model, and Z-direction displacements are limited to the bottom of the model. The road surface water is realized by nodal flow. Loads are realized by applying pressure to the top of the model and selecting the appropriate ground stress for different tunnel depths.
| Material | Unit type | Constitutive model | Modulus of elasticity (GPa) | Poisson’s ratio | Bulk density (kN/m3) | Cohesion (MPa) | Angle of internal friction (°) | Permeability parameter (m/s) |
|---|---|---|---|---|---|---|---|---|
| Rock mass | 3D/2D entity | Mohr-Coulomb | 59.8 | 0.3 | 18 | 3 | 59.11 | — |
| Underground water | — | Mohr-Coulomb | — | 0.5 | 21 | — | — | kx = ky = kz = 1 × 10⁻⁵ |
The design the same orthogonal table is presented in the Table 11. In the numerical analysis, during water inrush, the software can display the seepage velocity and range of water in the surrounding rock of the roadway. Since the buried depth of the roadway, the height of the water level and the time of water inrush will change the corresponding boundary conditions and thus affect the seepage velocity and range, and the influence of various factors on the stability of the surrounding rock of the roadway is indirectly reflected by the change of seepage velocity and range. In order to facilitate the expression that the seepage range gradually expanded with time, the records were recorded from 0, and each recording interval was 1/6 of the water-inrush time, and each labeled line was called the seepage line, which was recorded for a total of six times.
| No. | Factors | ||
|---|---|---|---|
| Depth of roadway (m) | Height of water inrush (mm) | Time of water inrush (day) | |
| 1 | 200 | 1/4 H | 0.2 |
| 2 | 400 | 1/2 H | 0.4 |
| 3 | 600 | 3/4 H | 0.6 |
Note: H = roadway height of 2.5 m.
Analysis of Numerical Simulation Results
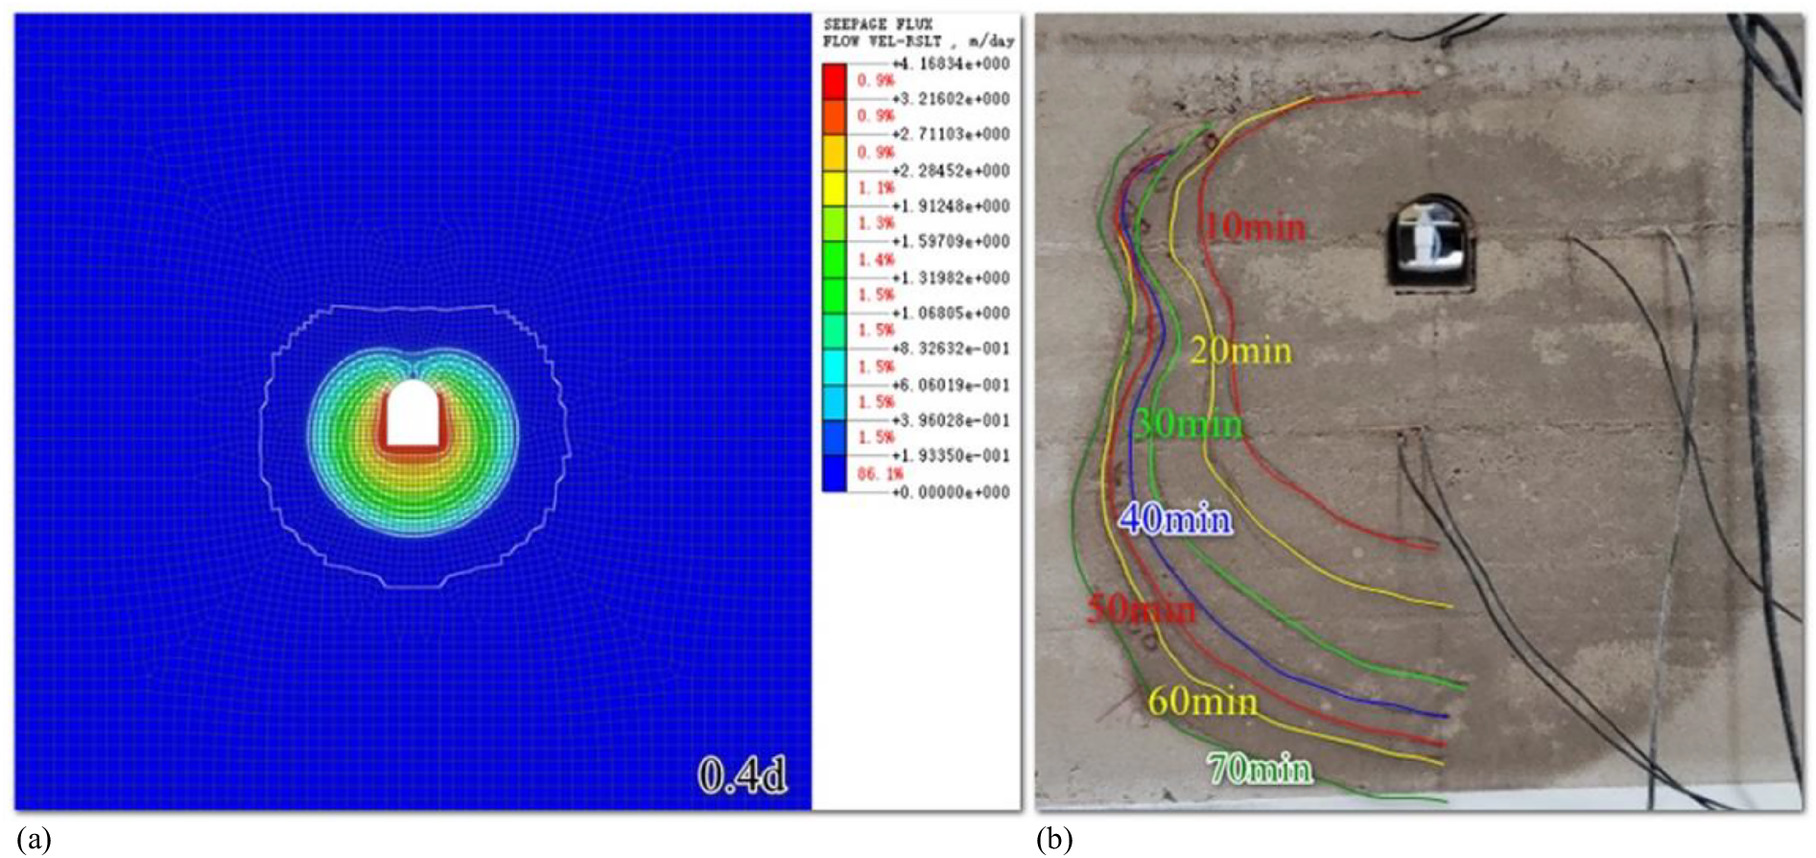
Test 9 demonstrates that the seepage range results of the numerical simulation are consistent with the model during the water inrush, as shown in Fig. 19. With the increase of time, the percolation range increases gradually and the percolation line expands continuously. In terms of seepage expansion velocity, arch bottom > arch waist > vault. At 0.4 days of numerical simulation of actual working conditions, that is, 70 min in the model test, the seepage area involves a large range, and the arch bottom reaches 6–7 times the size of the hole. The infiltration area on both sides of the arch waist is basically symmetrical, about 4–5 times the hole. The seepage area of the vault is about 1–2 times the hole. In the process of seepage, it can be seen that the seepage range of the two is consistent.
Other numerical simulation test results are similar to those of Test 9 and are not described in detail (test data are placed in the online supplemental materials ). Range analysis was carried out on the results of numerical simulation of seepage range. The range analysis of the convergence deformation results of the numerical simulation is shown in the Figs. 20(a and b).
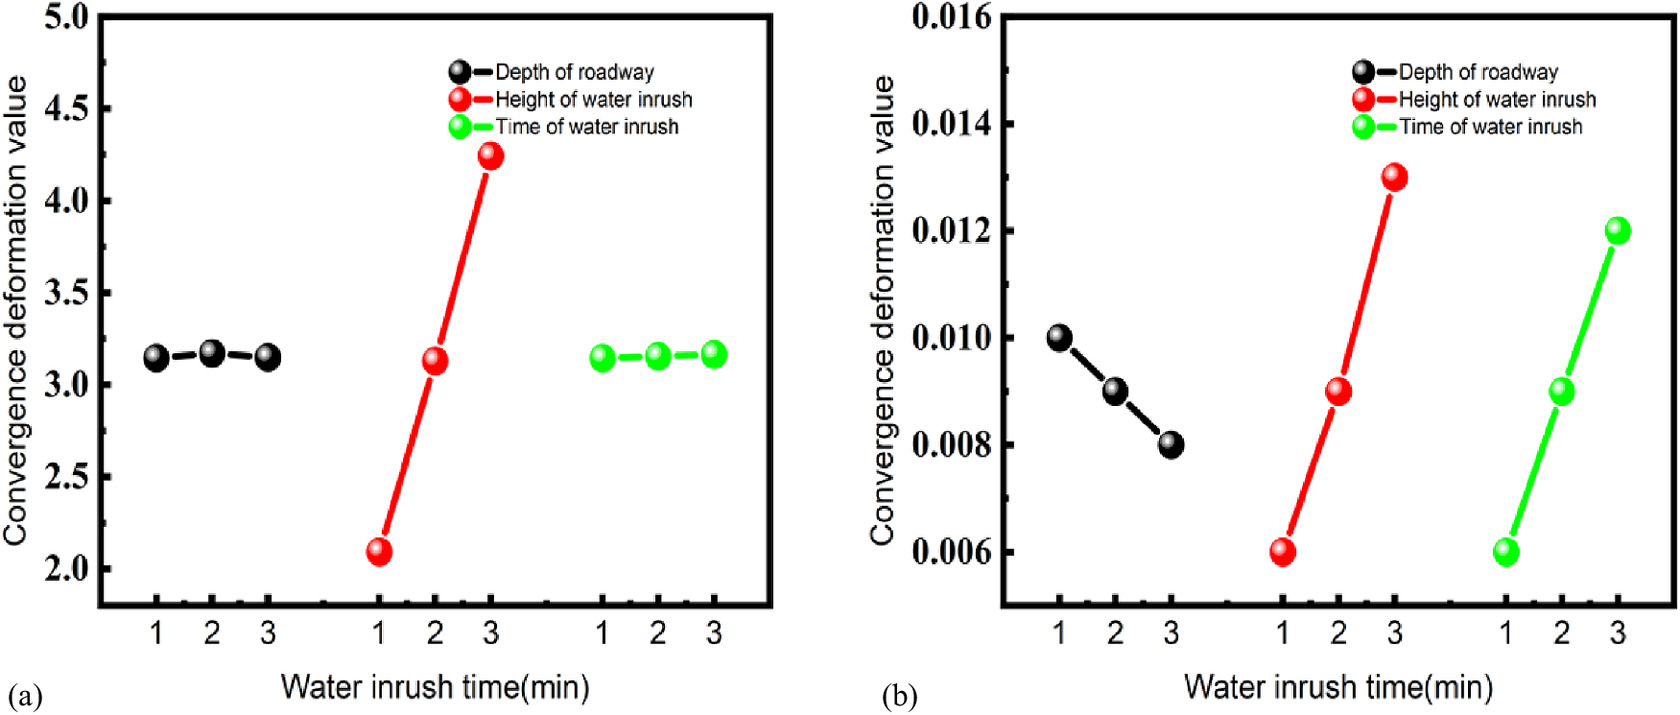
From the analysis of the numerical simulation results, it can be seen that the sensitivity of each factor to the combined seepage velocity during the water inrush is: water-inrush height > burial depth > water-inrush time. The sensitivity of all factors to the combined seepage velocity after water inrush is as follows: water-inrush height > water-inrush time > buried depth. On the whole, the numerical simulation results are similar to the model test results. Specifically, during and after water inrush, the seepage lines of the numerical simulation are similar to those of the model test, indicating that the influence law of the model test is similar to that of the numerical simulation when the roadway is affected by water inrush, and the two verify each other. Both numerical simulation and model tests show that the height of water inrush is the main influencing factor of surrounding rock deformation, while the depth and time of water inrush are the secondary influencing factors, which have similar effects. In the stage after the water inrush, the three influencing factors have a similar range, and all have a weak effect on the deformation of the roadway surrounding rock. Therefore, the conclusion of the preceding numerical simulation of the actual working condition is similar to the conclusion of the model test, which not only verifies the rationality of the model test but also indicates the reliability of the results.
Conclusions
First, the optimal ratio range of the model test was determined through the orthogonal experiment, and the multiple linear regression equations between the ratio of similar materials and various physical parameters were fitted. The physical parameters can be solved according to the ratio of similar materials, and the ratio of similar materials can be solved according to the physical parameters. Second, according to the optimal ratio of similar materials, the model of water-inrush roadway was made, and the water-constant device of roadway was created and the creep test was carried out. The influence of three factors on roadway deformation during and after water inrush is analyzed. The deformation of roadway surrounding rock is the most obvious during the water inrush, and gradually becomes stable after the water inrush. The height of the water inrush is the main influencing factor, and a reasonable rescue arrangement is made based on tunnel depth and water-inrush time. Finally, the same creep test is carried out on real rock mass through a numerical simulation, and the conclusion is similar to the model test, which verifies the rationality and reliability of the model test results and extends the conclusion.
These results prove the validity of the model test, increase the research of laboratory model test, improve the understanding of the stability of surrounding rock of water-inrush roadway, and provide guidance for the actual engineering water-inrush roadway.
Supplemental Materials
File (supplemental_materials_ijgnai.gmeng-9539_yang.pdf)
- Download
- 7.35 MB
Data Availability Statement
All data, models, and code generated or used during the study appear in the published article.
Acknowledgments
Thanks for the financial support from the Natural Science Foundation of Shandong (ZR2019MEE082).
Notation
The following symbols are used in this paper:
- CE
- elastic modulus constant;
- Ck
- permeability coefficient similarity constant;
- Cl
- geometric similarity ratio;
- Ct
- time similarity constant;
- Cγ
- bulk density similarity ratio;
- Cσ
- stress similarity constant;
- Cμ
- Poisson's ratio similarity constant;
- Cε
- strain similarity constant;
- X1
- quartz sand;
- X2
- ratio of cement to gypsum;
- X3
- silicone concentration;
- Y1
- compressive strength index;
- Y2
- elastic modulus index;
- Y3
- water absorption index;
- Y4
- softening coefficient index;
- Y5
- permeability coefficient index;
- Y6
- tensile strength index; and
- Y7
- density index.
References
Chen, L., S. Zhang, and H. Gui. 2014. “Prevention of water and quicksand inrush during extracting contiguous coal seams under the lowermost aquifer in the unconsolidated Cenozoic alluvium-a case study.” Arabian J. Geosci. 7: 2139–2149. https://doi.org/10.1007/s12517-013-1029-8.
Cui, J., W. Wang, and C. Yuan. 2022. “Application of stability analysis in surrounding rock control and support model of deep roadway.” Int. J. Oil Gas Coal Technol. 29: 180–192. https://doi.org/10.1504/IJOGCT.2022.120313.
Gao, W., M. Ge, D. Chen, and X. Wang. 2016. “Back analysis for rock model surrounding underground roadways in coal mine based on black hole algorithm.” Eng. Comput. 32: 675–689. https://doi.org/10.1007/s00366-016-0445-2.
Guo, Q., H. Su, H. Jing, and W. Zhu. 2020. “Effect of wetting-drying cycle on the deformation and seepage behaviors of rock masses around a tunnel.” Geofluids 2020: 4237163. https://doi.org/10.1155/2020/4237163.
Guo, X., Y. Li, J. Li, H. Liu, X. Ma, J. Li, G. Li, and J. Tan. 2021. “Surrounding rock failure characteristics and water inrush mechanism of roadway above the aquifer in nonuniform stress field.” Geofluids 2021: 6674616. https://doi.org/10.1155/2021/6674616.
Guo, Y., Y. Yang, Z. Kong, and J. He. 2022. “Development of similar materials for liquid-solid coupling and its application in water outburst and mud outburst model test of deep tunnel.” Geofluids 2022: 8784398. https://doi.org/10.1155/2022/8784398.
Ji, H., L. Sun, C. Song, Y. Zhang, J. Wang, and K. Meng. 2023. “Progress of research on stability control of engineering surrounding rock in weakly cemented strata in western mining area.” Coal Sci. Technol. 51 (01): 117–127. https://doi.org/10.13199/j.cnki.cst.2022-1784.
Ji, M., and H. Guo. 2020. “Influence of in-situ rock stress on the stability of roadway surrounding rock: A case study.” J. Geophys. Eng. 17: 138–147. https://doi.org/10.1093/jge/gxz097.
Kim, E., and H. Changani. 2016. “Effect of water saturation and loading rate on the mechanical properties of red and buff sandstones.” Int. J. Rock Mech. Min. Sci. 88: 23–28. https://doi.org/10.1016/j.ijrmms.2016.07.005.
Li, B., and Q. Wu. 2019. “Catastrophic evolution of water inrush from a water-rich fault in front of roadway development: A case study of the Hongcai coal mine.” Mine Water Environ. 38: 421–430. https://doi.org/10.1007/s10230-018-00584-z.
Li, H., G. Guo, and J. Zh. 2017. “Study on time-varying characteristics of similar material model strength and the regulation measures.” Environ. Earth Sci. 76: 518. https://doi.org/10.1007/s12665-017-6857-5.
Li, S., J. Wu, Z. Xu, L. Li, X. Huang, G. Xue, and Z. Wang. 2016. “Numerical analysis of water flow characteristics after inrushing from the tunnel floor in process of karst tunnel excavation.” Geomech. Eng. 10: 471–526. https://doi.org/10.12989/gae.2016.10.4.471.
Li, S., Y. Zhou, L. Li, Q. Zhang, S. Song, J. Li, K. Wang, and Q. Wang. 2012. “Development and application of new similar materials for coupled flow-solid model tests in underground engineering.” J. Rock Mech. Eng. 31 (06): 1128–1137.
Li, T., H. Gong, and G. L. Xu. 2021. “Study on the influence of in situ stress distribution on the stability of roadway surrounding rock.” Adv. Civ. Eng. 2021: 3570523. https://doi.org/10.1155/2021/3570523.
Liu, Z., H. Ye, L. Yang, S. Wang, J. Zhang, B. Zhang, and Z. Li. 2020. “Study on control technology for working faces passing through long-span abandoned roadways.” Geofluids 2020: 8822595. https://doi.org/10.1155/2020/8822595.
Luo, Y., F. Gong, and C. Q. Zhu. 2022. “Experimental investigation on stress-induced failure in D-shaped hard rock tunnel under water-bearing and true triaxial compression conditions.” Bull. Eng. Geol. Environ. 81: 76. https://doi.org/10.1007/s10064-021-02564-0.
Ma, C., H. Li, and Y. Niu. 2018a. “Experimental study on damage failure mechanical characteristics and crack evolution of water-bearing surrounding rock.” Environ. Earth Sci. 77: 1–11. https://doi.org/10.1007/s12665-017-7209-1.
Ma, D., X. Cai, Q. Li, and H. Duan. 2018b. “In-Situ and numerical investigation of groundwater inrush hazard from grouted karst collapse pillar in longwall, mining.” Water 10, 1187. https://doi.org/10.3390/w10091187.
Ma, D., X. Miao, Z. Chen, and X. B. Mao. 2013. “Experimental investigation of seepage properties of fractured rocks under different confining pressures.” Rock Mech. Rock Eng. 46: 1135–1144. https://doi.org/10.1007/s00603-012-0329-8.
Meng, B., H. Jing, W. Zhu, and H. Su. 2019. “Influences of saturation and wetting-drying cycle on mechanical performances of argillaceous limestones from Liupanshan tunnel, China.” Adv. Mater. Sci. Eng. 2019: 9236172. https://doi.org/10.1155/2019/9236172.
Noorian Bidgoli, M., and L. Jing. 2015. “Water pressure effects on strength and deformability of fractured rocks under low confining pressures.” Rock Mech. Rock Eng. 48: 971–985. https://doi.org/10.1007/s00603-014-0628-3.
Shi, Y., Y. Ye, N. Hu, X. Huang, and X. Wang. 2021. “Experiments on material proportions for similar materials with high similarity ratio and low strength in multilayer shale deposits.” Appl. Sci. 11: 9620, https://doi.org/10.3390/app11209620.
Song, Z.-p, T.-t. Yang, and A.-n. Jiang. 2016. “Elastic-plastic numerical analysis of tunnel stability based on the closest point projection method considering the effect of water pressure.” Math. Probl. Eng. 2016: 2569345. https://doi.org/10.1155/2016/2569345.
Wu, X.-y, L.-s. Jiang, X.-g. Xu, T. Guo, P.-p. Zhang, and W. Huang. 2021. “Numerical analysis of deformation and failure characteristics of deep roadway surrounding rock under static-dynamic coupling stress.” J. Cent. South Univ. 28: 543–555. https://doi.org/10.1007/s11771-021-4620-2.
Xiong, Y., D. Kong, Z. Cheng, Z. Ma, G. Wu, and Y. Liu. 2021. “Instability control of roadway surrounding rock in close-distance coal seam groups under repeated mining.” Energies 14: 519. https://doi.org/10.3390/en14165193.
Xu, Y., E. Zhang, Y. Luo, L. Zhao, and K. Yi. 2020. “Mechanism of water inrush and controlling techniques for fault-traversing roadways with floor heave above highly confined aquifers.” Mine Water Environ. 39: 320–330. https://doi.org/10.1007/s10230-020-00670-1.
Yang, X., G. Yang, R. Huang, Y. Wang, J. Liu, J. Zhang, and S. Hou. 2021. “Comprehensive study on surrounding rock failure characteristics of longwall roadway and control techniques.” Appl. Sci. 11: 9795, https://doi.org/10.3390/app11219795.
Zhang, S., G. Fan, D. Zhang, M. Chen, and C. Zhang. 2019a. “Study on material properties and similar material proportion of weakly cemented water-resisting strata.” Arabian J. Geosci. 12: 1–13. https://doi.org/10.1007/s12517-019-4521-y.
Zhang, S., B. Shen, Y. Li, and S. Zhou. 2019b. “Modeling rock fracture propagation and water inrush mechanisms in underground coal mine.” Geofluids 2019: 1796965. https://doi.org/10.1155/2019/1796965.
Zhang, W., Z. M. He, D. Zhang, D. Qi, and W. S. Zhang. 2018. “Surrounding rock deformation control of asymmetrical roadway in deep three-soft coal seam: A case study.” J. Geophys. Eng. 15: 1917–1928. https://doi.org/10.1088/1742-2140/aabb2a.
Zhang, Y., X. Ding, S. Huang, Y. Wu, and J. He. 2020. “Strength degradation of a natural thin-bedded rock mass subjected to water immersion and its impact on tunnel stability.” Geomech. Eng. 21: 63–71. https://doi.org/10.12989/gae.2020.21.1.063.
Zhao, J.-S., Q. Jiang, J.-F. Lu, B.-R. Chen, S.-F. Pei, and Z.-L. Wang. 2022. “Rock fracturing observation based on microseismic monitoring and borehole imaging: In situ investigation in a large underground cavern under high geostress.” Tunnelling Underground Space Technol. 126: 104549. https://doi.org/10.1016/j.tust.2022.104549.
Zhao, J.-s., Q. Jiang, S.-f. Pei, B.-r. Chen, D.-p. Xu, and L.-b. Song. 2023. “Microseismicity and focal mechanism of blasting-induced block falling of intersecting chamber of large underground cavern under high geostress.” J. Cent. South Univ. 30: 542–554. https://doi.org/10.1007/s11771-023-5259-y.
Zhao, Y., Z. Cheng, Y. Gao, S. Wu, and C. Chen. 2020. “Review of geomechanical similar-material test systems.” Arabian J. Geosci. 13: 906. https://doi.org/10.1007/s12517-020-05870-1.
Zhao, Y., A. Luo, Y. Wang, W. Wang, L. Zhang, and W. Wan. 2017. “Numerical analysis of Karst water inrush and a criterion for establishing the width of water-resistant rock pillars.” Mine Water Environ. 36: 508–519. https://doi.org/10.1007/s10230-017-0438-4.
Zheng, J., W. Ju, X. Sun, Z. Li, S. Wang, and B. Liu. 2020. “Large deformation mechanics of Gob-side roadway and its controlling methods in deep coal mining: A case study.” Adv. Civ. Eng. 2020: 8887088. https://doi.org/10.1155/2020/8887088.
Zhou, K., F. Yu, Y. Tan, T. Zhao, and W. Guo. 2021. “In-situ investigation on fractured evolution law of surrounding rock in weakly cemented soft rock roadway.” Energy Sources Part A: Recovery Util. Environ. Eff. 1–13. https://doi.org/10.1080/15567036.2021.1903120.
Information & Authors
Information
Published In

International Journal of Geomechanics
Volume 24 • Issue 12 • December 2024
Copyright
This work is made available under the terms of the Creative Commons Attribution 4.0 International license, https://creativecommons.org/licenses/by/4.0/.
History
Received: Aug 14, 2023
Accepted: Jun 12, 2024
Published online: Oct 3, 2024
Published in print: Dec 1, 2024
Discussion open until: Mar 3, 2025
Authors
Metrics & Citations
Metrics
Citations
Download citation
If you have the appropriate software installed, you can download article citation data to the citation manager of your choice. Simply select your manager software from the list below and click Download.