Measurement Approach to Develop Flood-Based Damage Fragilities for Residential Buildings Following Repeat Inundation Events
Publication: ASCE-ASME Journal of Risk and Uncertainty in Engineering Systems, Part A: Civil Engineering
Volume 8, Issue 2
Abstract
Floods account for the highest annual average losses from natural hazards across the United States, and the occurrence of repeat flood inundation events in United States communities is increasing. Distinguishing damages caused by distinct flood events in a community that has experienced repeated flooding is difficult, and best practices for repeat flood metrology are needed to better inform and validate flood damage models. This paper presents a longitudinal methodology for measuring impacts from repeated flood inundation through a case study of buildings in Lumberton, North Carolina, where major flood events occurred in 2016 and 2018. Sources of uncertainty encountered in flood damage assessments are presented to inform best practices for future investigations of repeat flood events. A novel initial state parameter is introduced for accurate damage characterization for a repeat flood event. This paper presents the first analysis of statistical distributions of damage conditioned on flood depth for a set of buildings that have been flooded in two consecutive events, and the results show how floods with similar intensities occurring in the same area at two different times can exhibit differing distributions. Flood damage data sets for the two floods are combined to derive flood damage fragilities, and we propose the creation of a flood damage database by aggregating data from various flood events across the United States to enable more robust fragility functions that can be applied across geographies and flood events.
Introduction
Floods account for the highest annual average losses from natural hazards across the United States. Between 2004 and 2014, major flood events caused average annual losses of $9 billion and 71 lives, according to the National Academies of Sciences, Engineering, and Medicine (NASEM 2019). NASEM data, in combination with a large body of social science literature, show that short- and long-term impacts from flooding extend beyond immediately quantified losses. For example, flood losses are acutely felt by communities with higher concentrations of poverty and populations of racial and ethnic minorities, elderly, renters, nonnative English speakers, and mobility-challenged residents (Van Zandt et al. 2012; Masterson et al. 2014; Highfield et al. 2014). Flood frequency is increasing across the US (Brody et al. 2011; Macionis and Parrillo 2013), especially in areas near coasts and within river basins. Increases in flood frequency and severity are due in part to increased urban densification and development impacts on floodplains (Gori et al. 2019), as well as climate change, which has contributed to sea-level rise and increased the likelihood of heavy precipitation events (NASEM 2019). As the occurrence of intense flood events increases, so does the occurrence of repeat flood events in communities. The Government Accountability Office (2020) reports that the number of repetitive loss properties insured by the National Flood Insurance Program, which are properties that have flooded twice in 10 years, increased by 43% from 2009 to 2018. Based on this information, the need for better decision tools for mitigating flood risk to increase community resilience to flood hazard is apparent and is the impetus for the present work.
Flood risk is a combination of three main components: hazard, exposure, and vulnerability. Methods used to quantify these components have been reviewed in articles covering concepts and challenges (Thieken et al. 2006), economic flood damage assessment to buildings and infrastructure (Merz et al. 2010), and risk assessment and communication (Salman and Li 2018). These reviews showed that flood damage modeling approaches have typically relied on stage-damage functions at the individual building scale using empirical data from single historical flood events (Merz et al. 2004; Nascimento et al. 2006). Stage-damage functions are commonly used in the insurance industry (Messner 2007) and have been incorporated into the FEMA Hazus-MH tool for modeling physical and economic losses due to natural hazard scenarios (HAZUS-MH 2008). Stage-damage functions deterministically relate flood intensity to loss, but lack uncertainty propagation in the flood damage assessment process. Recent advances in flood damage quantification approaches were reviewed by Nofal and van de Lindt (2020c) and Marvi (2020). These reviews listed flood-related data scarcity and an inability to propagate uncertainties in flood damage assessments as the main challenges to development and validation of robust flood damage models. Probabilistic flood stage-damage functions were proposed to address this research gap (McGrath et al. 2019), although the functions were not fully probabilistic. Thus, recent research efforts have employed approaches using fragility functions to quantify the flood damage for given flood intensity values in a probabilistic fashion (van de Lindt et al. 2018; Tomiczek et al. 2014; Nofal et al. 2020) and have been compared with corresponding stage-damage functions by Nofal and van de Lindt (2020b).
Fragility functions are considered a reliable probabilistic tool to inform safety margins for buildings and systems, because they naturally account for, and allow propagation of, uncertainty. Therefore, fragility-based flood damage functions have been developed using numerical models (Nadal et al. 2009; De Risi et al. 2013; Nofal and van de Lindt 2020a) and empirical data collected from field damage assessments (Amadio et al. 2019; van de Lindt et al. 2020). Fragility functions are often derived from a small set of data collected from a single event or community; therefore, applying these functions to other events or communities assumes that the depth-damage relationship is general enough to be applicable across events and geographies. Previous research has shown that the quality and geographical applicability of existing flood damage assessment approaches vary based on empirical data collected from damage assessments (Galasso et al. 2021).
As fragility-based approaches to flood damage modeling are developed and refined, approaches taken in modeling other hazards can help guide the development of the practice. The earthquake engineering community has identified sources of uncertainty and developed model parameters to account for those uncertainties in their fragility-based assessment frameworks (FEMA 2009). Galasso et al. (2021) state the need to identify the uncertainties inherent to probabilistic flood damage models, which is a necessary starting point for the development of flood damage model parameters that can account for uncertainty, similar to the existing approaches for earthquake modeling.
This paper is focused on the measurement science necessary to develop robust probabilistic flood damage models to enhance resilience modeling frameworks. The paper is structured around two research questions: (1) what are the uncertainties of assessing damage to buildings from a repeat flood event, and (2) is the distribution of flood damage to buildings, considering flood depth as the intensity measure, similar for a repeat flood event as for the first flood event, given a similar flood intensity? To answer these questions, flood damage data collection and modeling considerations of a longitudinal field study of Lumberton, North Carolina, are presented. The City of Lumberton experienced riverine flooding caused by rainfall from Hurricane Matthew in 2016, and again from rainfall caused by Hurricane Florence in 2018. The two events presented similar stage heights, based on nearby stream gauge data. Uncertainties encountered in the field damage assessment of the second flood event are presented. A novel approach to create an initial state parameter to distinguish unique damage in each flood event based on longitudinal data is presented, along with best practices for future field damage assessments of repeat flood events. The statistical distributions of flood depth versus observed damage for each flood event in Lumberton are compared to understand whether the underlying depth-damage relationship is consistent for two flood events with similar intensities. Fragility functions created through aggregation of data from the first and second flood events are compared to functions previously created using only data collected in Lumberton following the first flood event (van de Lindt et al. 2018). Results of the comparison confirm that observed damage distributions are different for the two flood events despite the similar flood stage elevations, signaling that fragility curves lack not only geographical but also temporal applicability. Data gathered from two flood events in one community is not fully sufficient to derive broadly applicable damage equations; therefore, we make the case for a national database of flood damage data that relies on standardized damage states (DSs), building typologies, and measurement datums and provide initial direction for the creation of such a database.
Methodology
The damage fragility methodology is presented herein by first introducing the data collection methodology that followed two extreme floods that occurred in Lumberton, North Carolina, in 2016 and 2018. The collected data are used to develop a set of fragility functions for a suite of buildings, characterized by foundation type, building type, and measurement datum. This section describes the novel measurement science used to distinguish damage from the two events as well as the sources of uncertainty encountered in damage assessments; this research provides a case for development of best practices for future studies of repeat flood events. The results of the study are presented along with a discussion and conclusions.
Lumberton Field Study Overview
The NIST and its Center of Excellence (CoE) for Risk-Based Community Resilience Planning have been studying the impacts to and recovery of Lumberton, North Carolina, since it was flooded during Hurricane Matthew in October 2016 (van de Lindt et al. 2018, 2020). This longitudinal field study has collected three systematic waves of field data at the time of this writing and is ongoing; the same sample of residential buildings have been investigated throughout the study.
Longitudinal Data Collection Approach
Data collection efforts have focused on key social, economic, environmental, and built infrastructure characteristics required to model long-term housing and household, business, school, and community recovery. This paper is focused on the damage assessment considerations for residential structures. The timeline of deployments for the Lumberton field study is provided in Fig. 1. The first field study, denoted as Wave 1 and performed in November 2016, included: (1) measurements of high-water marks (HWMs) on residential structures, (2) observations of damage to the structures and their contents, and (3) systematic household surveys including questions to residential homeowners and renters about the damage that their housing unit sustained from the flood. The second field study, denoted as Wave 2 and performed in January 2018, included systematic household surveys of the same housing units surveyed in Wave 1. These surveys included questions about the level of repair of their housing unit. Details on the history of Lumberton, flooding events, sampling, team coordination, and data collection logistics are provided in the respective Wave reports (van de Lindt et al. 2018; Sutley et al. 2021b; Helgeson et al. 2021).
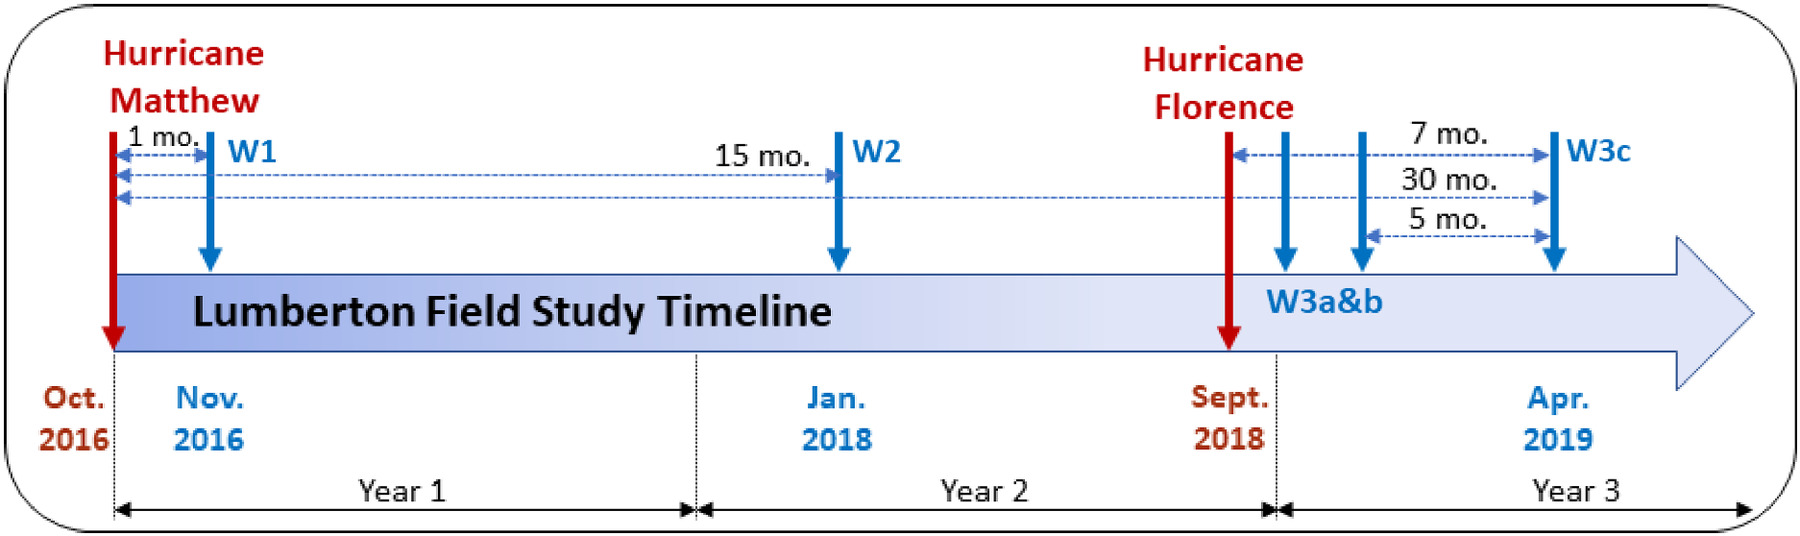
Rainfall from Hurricane Florence caused a second extreme flooding event in Lumberton in September 2018. Both flood events in Lumberton were low velocity and therefore the primary flood hazard observed was inundation depth. Other flood hazards exist and should be accounted for in future work [see Kreibich et al. (2009), Merz et al. (2010), Dang et al. (2011), and Qi and Altinakar (2011, 2012) for relevant discussions of velocity and duration flood hazards]. NIST and the CoE deployed to North Carolina three times following the flooding from Hurricane Florence, and these deployments, designated as Waves 3a, 3b, and 3c, are collectively denoted as Wave 3. In Wave 3a, conducted in October 2018, researchers collected physical measurements of HWMs and assessments of damage to residential buildings that were sampled in Waves 1 and 2. These both augmented the damage analyses completed after Wave 1 and provided scoping guidance to teams arriving in later Wave 3 deployments. The Wave 3a damage assessment was conducted very quickly after the flood event, which prevented human subjects research from being performed due to the extended time required for survey instrument approval. During Wave 3b, performed in December 2018, researchers interviewed public housing residents and administrators to understand the unique impacts and recovery for the population of residents living in public housing and the city’s plan to repair public housing units. Researchers in Wave 3c, conducted in April 2019, surveyed households to further understand recovery from the 2016 flood at the time when the 2018 flood occurred, as well as understand the damage to housing units caused by the 2018 flood and the recovery of the housing unit from any remaining damage caused by either flood event.
Assessing the Hurricane Matthew (2016) and Hurricane Florence (2018) Flood Events
Predeployment web-based virtual reconnaissance was conducted in Waves 1 and 3a to determine the nature and intensity of the flood hazard, and the severity of damage to buildings. Virtual reconnaissance was implemented in accordance with guidelines established by FEMA (FEMA 2018a) and included monitoring of stream gauges, inspection of peri- and postevent aerial imagery, and monitoring of media networks for firsthand accounts and imagery of the flood events. These data were analyzed in a geographic information system to direct planning for field damage assessments of the flood events.
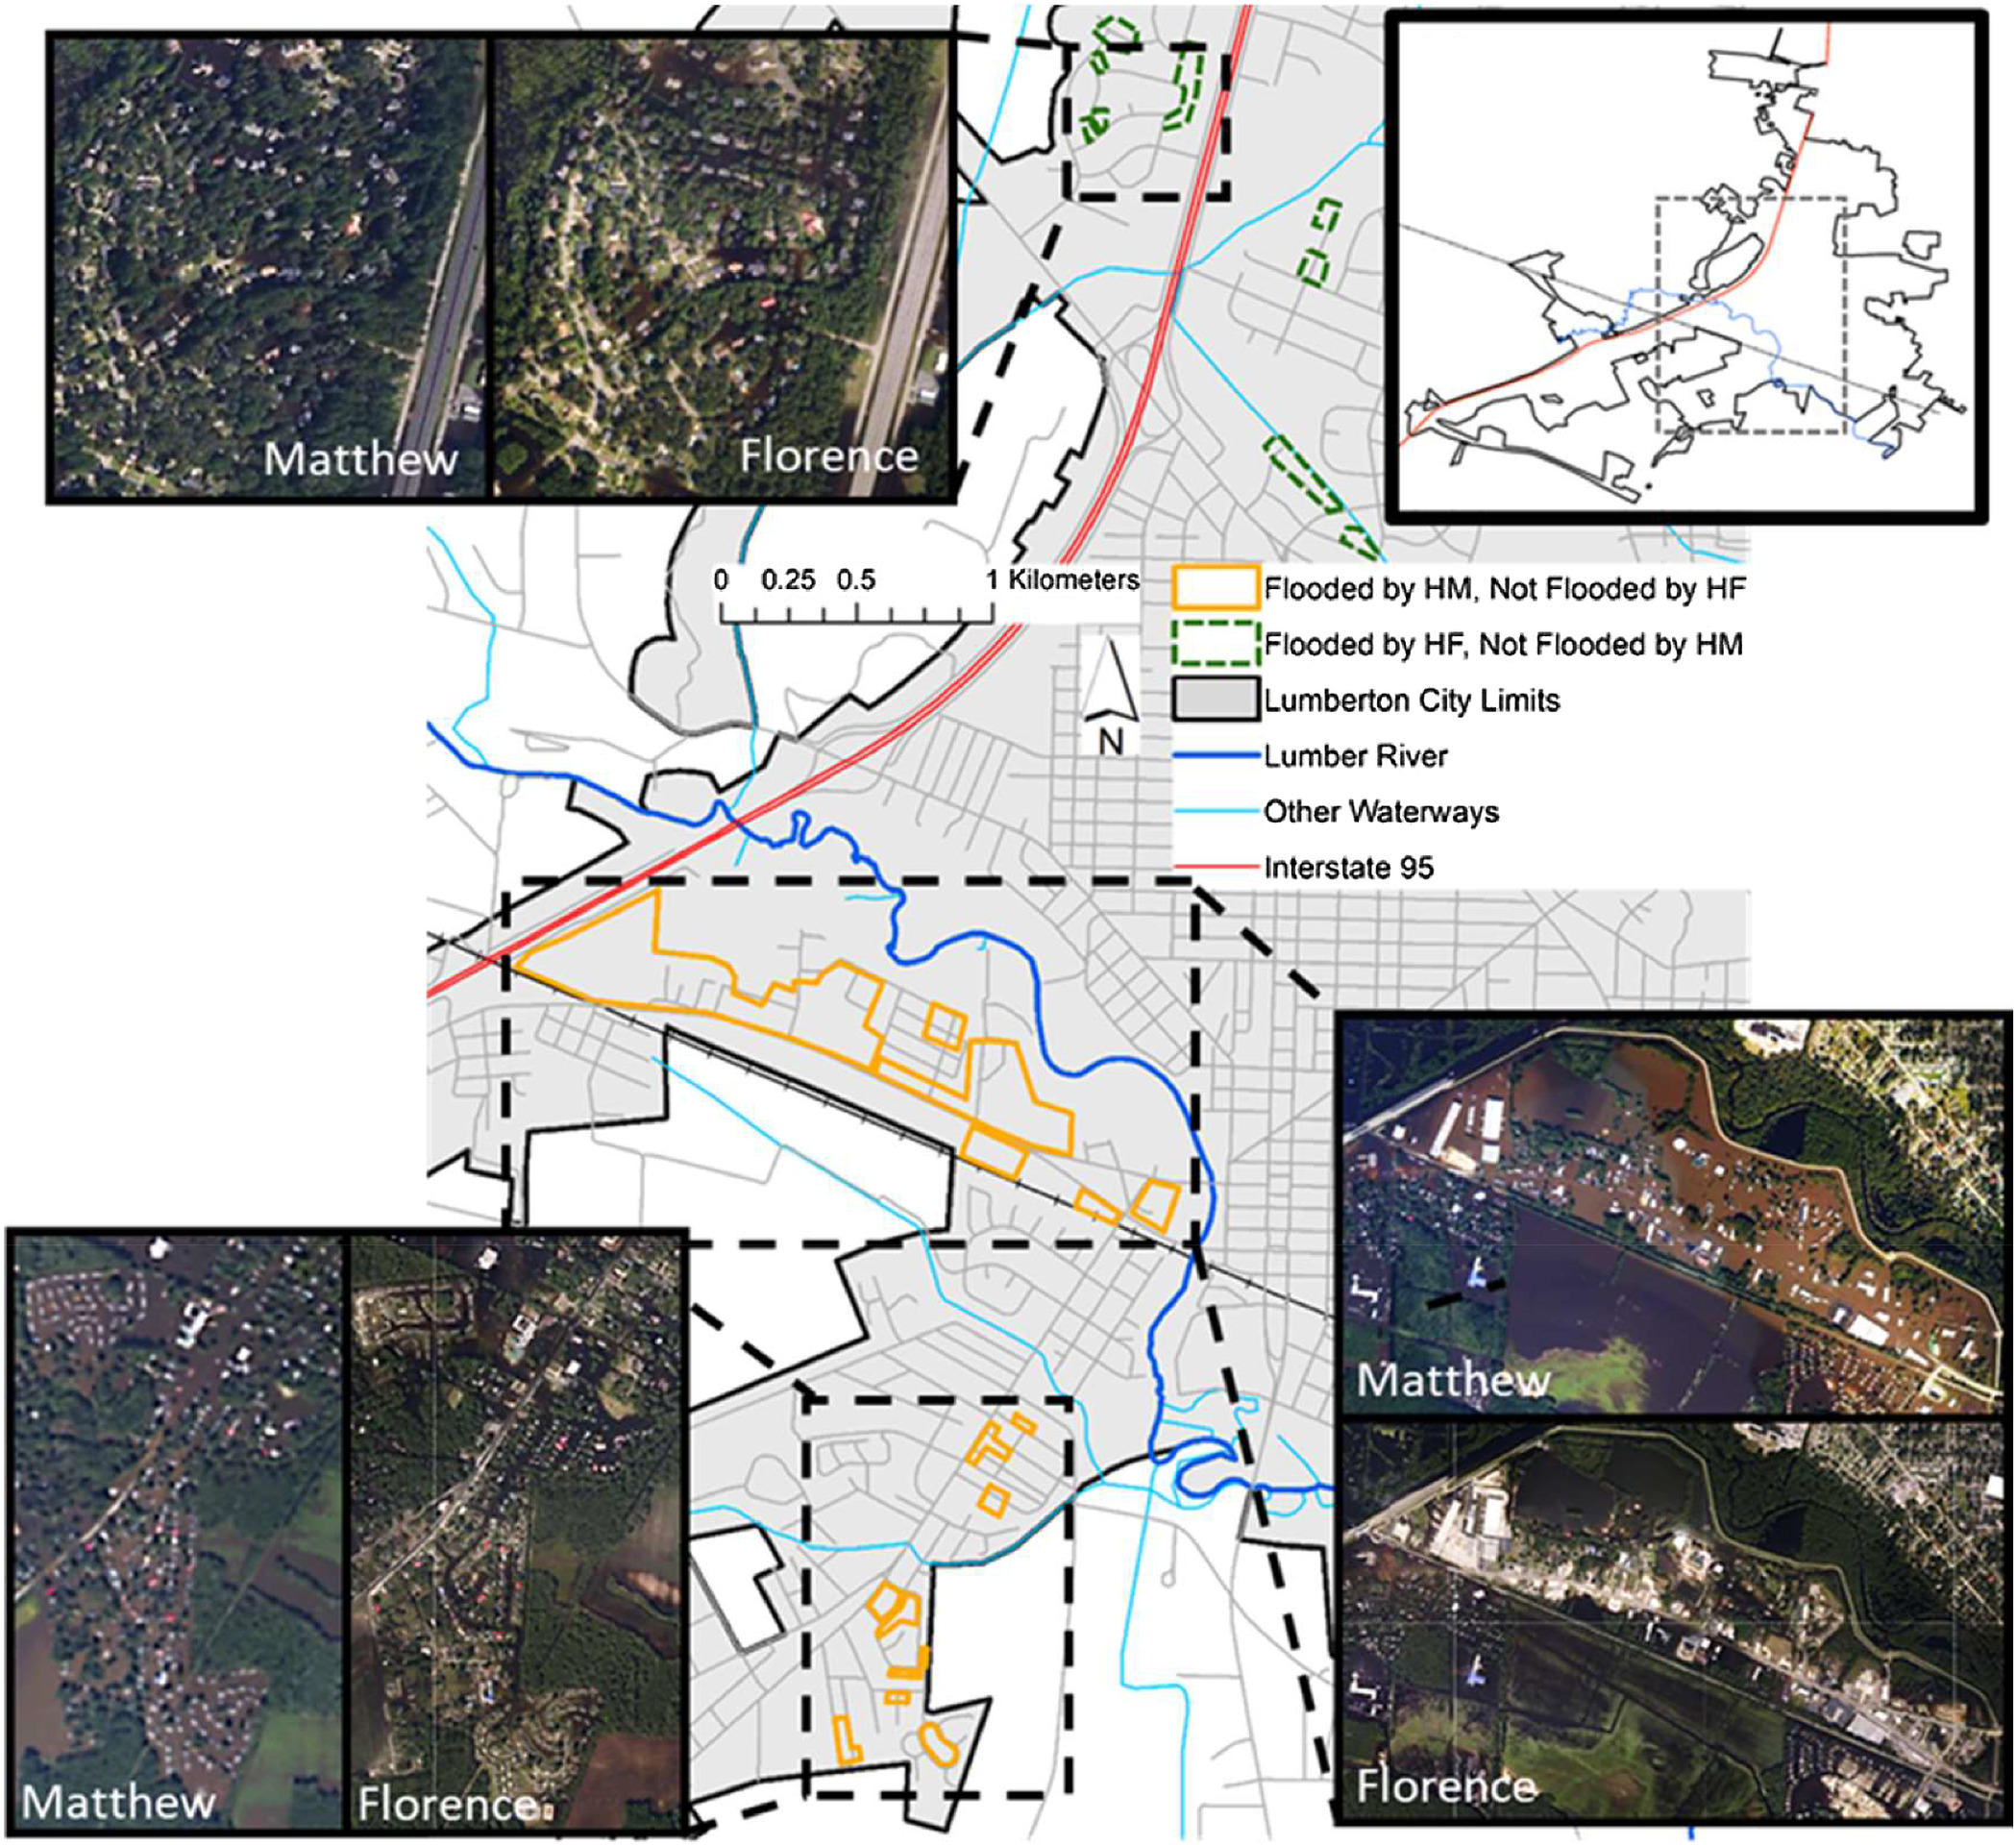
Streamflow data from the USGS National Water Information System stream gauge 02134170 located on the Lumber River and within the city limits of Lumberton (USGS 2016) show peak flood stage elevations of 6.67 m (21.87 ft) above the gauge datum in Hurricane Matthew and 6.77 m (22.21 ft) above the gauge datum in Hurricane Florence. Based on media reports, the two flood events were low velocity and therefore presented hazards of flood depth and duration but not hydrodynamic loads. Aerial imagery captured during the events was used to estimate and compare the extents of flooding for the two events. Fig. 2 highlights regions of flood difference between the two events that were digitized based on a comparison of aerial imagery captured by the National Oceanographic and Atmospheric Administration (NOAA 2016, 2018). Solid orange polygons in Fig. 2 designate regions that were flooded after Hurricane Matthew but not flooded after Hurricane Florence, and dashed green polygons designate regions that were not flooded after Hurricane Matthew but were flooded after Hurricane Florence. The aerial imagery analysis shows that the area south of the Lumber River was more severely flooded by Hurricane Matthew than Hurricane Florence, while areas north of the river, particularly a neighborhood west of I-95 (highlighted in the northernmost image inset), were more severely flooded by Hurricane Florence than Hurricane Matthew.
Mitigation actions taken by the City of Lumberton before flooding from Hurricane Florence likely contributed to the changes in the flood extents. Community-level actions included building a berm at a gap in Lumberton’s levee system where floodwater entered the region south of the river during Hurricane Matthew and deploying hydraulic pumps to quickly move water from the leveed area into the downstream river channel. Individual actions taken by community members in 2018 in anticipation of Hurricane Florence, such as elevating interior contents of homes and businesses and evacuating before flooding occurred, likely led to fewer local morbidities, mortalities, and economic losses from this event compared to the 2016 event, as has been discussed in previous studies (Siegrist and Gutscher 2008; Osberghaus 2017). As uncovered in the longitudinal study, more mitigation actions were taken in 2018 than 2016 given that the city had not experienced significant flooding in over a decade leading into 2016 but had very recent experience leading into 2018. This is in line with existing literature that has shown that previous disaster experience can influence how an individual or household perceives an environmental threat and, therefore, whether they take protective action against a future event (Lindell and Perry 2012). While individual- and community-level mitigation efforts likely improved outcomes in the flooding experienced in Hurricane Florence, they also influenced the flood damage assessment approaches, discussed in the next section, taken by the Lumberton field study team for the second extreme flood event.
Measurement Science of a Repeat Flood Event
The occurrence of a second major flooding event in a community within a short time span poses various challenges to damage assessment. To understand isolated impacts from the 2018 flood event, it was critical to determine whether observed damages and HWMs were caused by the 2018 flood event or were an artifact of the 2016 flood event. The Lumberton field study is uniquely positioned to distinguish damage between events due to the prior knowledge of the area, damages incurred following Hurricane Matthew, and resulting recovery patterns gained through the longitudinal data collection describing each sampled building through time with a combination of physical measurements, imagery, and survey responses. The present study is focused on assessing and modeling isolated damages from the 2016 and 2018 flood events, as opposed to compound damages from the two events.
Flood Damage Measurement for the Hurricane Matthew (2016) Flood Event
Wave 1 of the Lumberton field study followed measurement guidance provided by the USGS for determining and measuring tranquil-water HWMs (Koenig et al. 2016). HWMs created by riverine floods denote the maximum elevation of floodwaters at the location of the mark. They are created by film, sediment, or debris on the surface profile of turbid water adhering to or staining flooded natural or manmade objects such as trees or buildings. Importantly, an object can contain multiple water lines, but only the highest line is considered and measured. When assessing the highest elevation of flooding for an object during a secondary flood event, HWMs remaining from the first flood event can make determination of maximum flood elevation difficult to distinguish.
To assess the maximum flood elevation for each housing unit sampled in Lumberton, the height of the HWM with respect to the first-floor elevation (FFE) of each building and the ground elevation with respect to the FFE of each building were measured for each structure. The Wave 1 deployment paired these measurements with household surveys, which allowed the team to verify with residents or neighbors that HWMs represented the maximum flood elevation following Hurricane Matthew. In many cases, residents allowed field team members to view interior damages while surveys were being conducted. The damage assessment instrument used to collect data in Wave 1 is available in Deniz et al. (2021).
Damage observed in Wave 1 was classified into five discrete, sequential DSs for residential buildings, as given in Table 1 (Deniz et al. 2020). The damage assessment scheme adapted component-based methodologies for determining damage due to hurricane waves and storm surge (Tomiczek et al. 2017) and combined wind/flood events (Friedland 2009) to assess flood damage to exterior walls, foundation, and interior.
| Damage state | Description |
|---|---|
| DS 0 | No damage; water may enter crawlspace or touch foundation (crawlspace or slab on grade) but has no contact with electrical or plumbing, etc., in crawlspace, and no or limited contact with floor joists. No sewer backup into living area. |
| DS 1 | Minor water enters house; damage to carpets, pads, baseboards, flooring. Approximately 25.4 mm (1 in.), but no drywall damage. Water touches joists. Could have some mold on subfloor above crawlspace. Could have minor sewer backup and/or minor mold issues. |
| DS 2 | Drywall damage up to approximately 0.61 m (2 ft) and electrical damage, heater and furnace and other major equipment on floor damaged. Lower bathroom and kitchen cabinets damaged. Doors or windows need replacement. Could have major sewer backup and/or major mold issues. |
| DS 3 | Substantial drywall damage, electrical panel destroyed, bathroom/kitchen cabinets and appliances damaged; lighting fixtures on walls destroyed; ceiling lighting may be okay. Studs reusable; some may be damaged. Could have major sewer backup and/or major mold issues. |
| DS 4 | Significant structural damage present; all drywall, appliances, cabinets, etc., destroyed. Could be floated off foundation. Building must be demolished or potentially replaced. |
Source: Data from Deniz et al. (2020).
The DSs were developed based on existing methodologies where loss is driven by damages to the interior of buildings, such as Hazus-MH (Hazus-MH 2008). These methods determine the percentage of damage to structural components and contents, and assess losses using an industry standard for replacement costs (RSMeans 2006). Buildings sustaining greater than 50% damage are assumed to be complete losses (Scawthorn et al. 2006). In Wave 1, damage was observed in many buildings with crawlspace foundations where the observed HWM was below the FFE. While the observed damages in these buildings, which typically included HVAC damage and led to mold issues in some cases, were minor compared with cases where the HWM exceeded the FFE, they are critical for accurate modeling of social and economic impact. To properly account for these damages in fragility models, DS 1 is split into two categories. DS 1 is only split for buildings with crawlspace foundations where inundation is measured with respect to the ground, because fragility functions developed in this study are created using lognormal distributions, which limit the probability space to nonnegative values. For this analysis, DS 1 is broken into DS 1a, indicating DS 1 observations with inundation measured below FFE, and DS 1b, representing DS 1 observations with inundation measured above FFE.
The number of residential building observations for each DS in Wave 1 is provided in Table 2 and the raw data are available in van de Lindt et al. (2021). These observations are categorized by foundation type, building type, and measurement datum. The building types used in the analysis include an aggregate of all building types, which is further categorized into single-family and multifamily building types. Three observations with slab-on-grade foundations and four observations with crawlspace foundations either did not receive a building type assessment or were categorized as “other” and were included in the aggregate data set but not in single-family or multifamily data sets. Indicative of the residential construction patterns for the city, 32% of sample observations had slab-on-grade foundations and 68% had crawlspace foundations.
| Number of observations | ||||||
|---|---|---|---|---|---|---|
| Aggregate building type | Single-family building type | Multifamily building type | ||||
| Damage state | HWM measured with respect to ground | HWM measured with respect to FFE | HWM measured with respect to ground | HWM measured with respect to FFE | HWM measured with respect to ground | HWM measured with respect to FFE |
| Slab-on-grade foundation | ||||||
| DS 1 | 39 | 40 | 12 | 12 | 27 | 28 |
| DS 2 | 52 | 51 | 17 | 17 | 32 | 31 |
| DS 3 | 5 | 6 | 5 | 6 | 0 | 0 |
| DS 4 | 0 | 0 | 0 | 0 | 0 | 0 |
| Total | 96 | 97 | 34 | 35 | 59 | 59 |
| Crawlspace foundation | ||||||
| DS 1 | 80 | 41 | 79 | 40 | 0 | 0 |
| DS 1a | 32 | 0 | 32 | 0 | 0 | 0 |
| DS 1b | 48 | 41 | 47 | 40 | 0 | 0 |
| DS 2 | 104 | 105 | 96 | 99 | 4 | 4 |
| DS 3 | 15 | 17 | 15 | 16 | 0 | 1 |
| DS 4 | 4 | 5 | 4 | 5 | 0 | 0 |
| Total | 201 | 168 | 194 | 160 | 5 | 5 |
Flood Damage Measurement for the Hurricane Florence (2018) Flood Event
Wave 3a of the Lumberton field study included damage assessment of residential buildings sampled in Waves 1 and 2. The HWM measurement approach used in Wave 3a was consistent with Wave 1. In Wave 3a, measurements of HWMs with respect to ground elevation and FFE with respect to ground elevation were collected for each sampled structure. Unique measurement challenges were encountered due to the potential of repeated inundation of buildings, which led to uncertainty in assessing the depth-damage relationship. The damage assessment instrument used to collect data in Wave 3a is available in Crawford et al. (2021).
Sources of Uncertainty Encountered in Repeat Flood Event Damage Assessment
Multiple sources of uncertainty were evident in the flood depth and damage measurements collected in Wave 3a that became critical to account for in the fragility analysis. Five specific sources of uncertainty were identified and are presented in Table 3. HWMs were fainter in Wave 3a compared to Wave 1, likely due to hydraulic pumps shortening the duration of inundation by moving floodwaters from the developed areas back to the river channel and disallowing turbid water to fully develop marks on structures, leading to the first source of uncertainty listed in Table 3. The second source of uncertainty, attribution of HWMs to specific flood events, became a prominent focus of Wave 3. Sampled buildings that were gutted and abandoned after Hurricane Matthew were excluded from the analysis; buildings with damage that were located in areas where no inundation was observed in aerial imagery documenting the 2018 flood event were attributed to the 2016 flood event. For all other buildings, a method to estimate the initial state of buildings at the time of the repeat flood event was created to reduce uncertainty in data used for fragility analysis. That initial state assessment is described in the next section. The third source of uncertainty is the relation of flood depth for each building to the damage observed in the building. It was noted in Wave 1 (van de Lindt et al. 2018, 2020) that in some cases buildings were gutted even though the elevation of HWM for the building was not indicative of complete loss. In many cases, this was due to the long duration of inundation causing extreme mold growth, which required the building to be gutted, but it was also noted that perception of the building owner played a role in the relationship, as some owners may have removed interior components unnecessarily because nearby buildings were completely gutted. These situations were observed again in some buildings during Wave 3a and highlight the need for probabilistic modeling of flood damage. The fourth source of uncertainty comes from the measurement of HWMs. Measurements in Waves 1 and 3a were typically conducted near the front door of the building, if possible. For buildings where observed HWMs were not present in the vicinity of the front door, the measurement was taken at the location of the observed HWM, which may have been different in Wave 3a than Wave 1. Due to the variation in ground elevation around a structure, measurements taken at different locations could lead to variable inundation measurements when measuring with respect to ground elevation. The fifth source of uncertainty is the assessment of damage to building interiors. Wave 3a did not include resident surveys, and field team members rarely entered residences, which made verifying HWMs with residents impossible in most cases. Additionally, and as learned in Wave 3c when household surveys were conducted, many residents who were in their homes during the 2016 flood chose to evacuate in anticipation of Hurricane Florence in 2018, and therefore could not verify the height of maximum inundation. The sources of uncertainty are documented here to answer the first research question of this study, but should not be considered an exhaustive list for all flood hazard types, building types, and geographies.
| Number of uncertainty sources | Explanation of uncertainty sources |
|---|---|
| 1 | Location of HWMs due to shorter duration of inundation compared to Wave 1 |
| 2 | Attribution of HWMs to specific flood events |
| 3 | Relation of flood depth to observed damage |
| 4 | Differing measurement datums for flood events based on the location of visible HWMs in each event |
| 5 | Assessment of damage to building interiors |
Development of an Initial State Parameter
Understanding the differential impact to individual buildings caused by the two flood events required determination of the flood event that caused the damages and HWMs observed in Wave 3a. A longitudinal analysis of the data obtained in Waves 1, 2, 3a, and 3c produced an initial state for each building observation that noted, with varying levels of confidence, the state of the building at the time that Hurricane Florence impacted the City of Lumberton. The data and decision criteria used to assign this initial state are shown in the flowchart in Fig. 3.
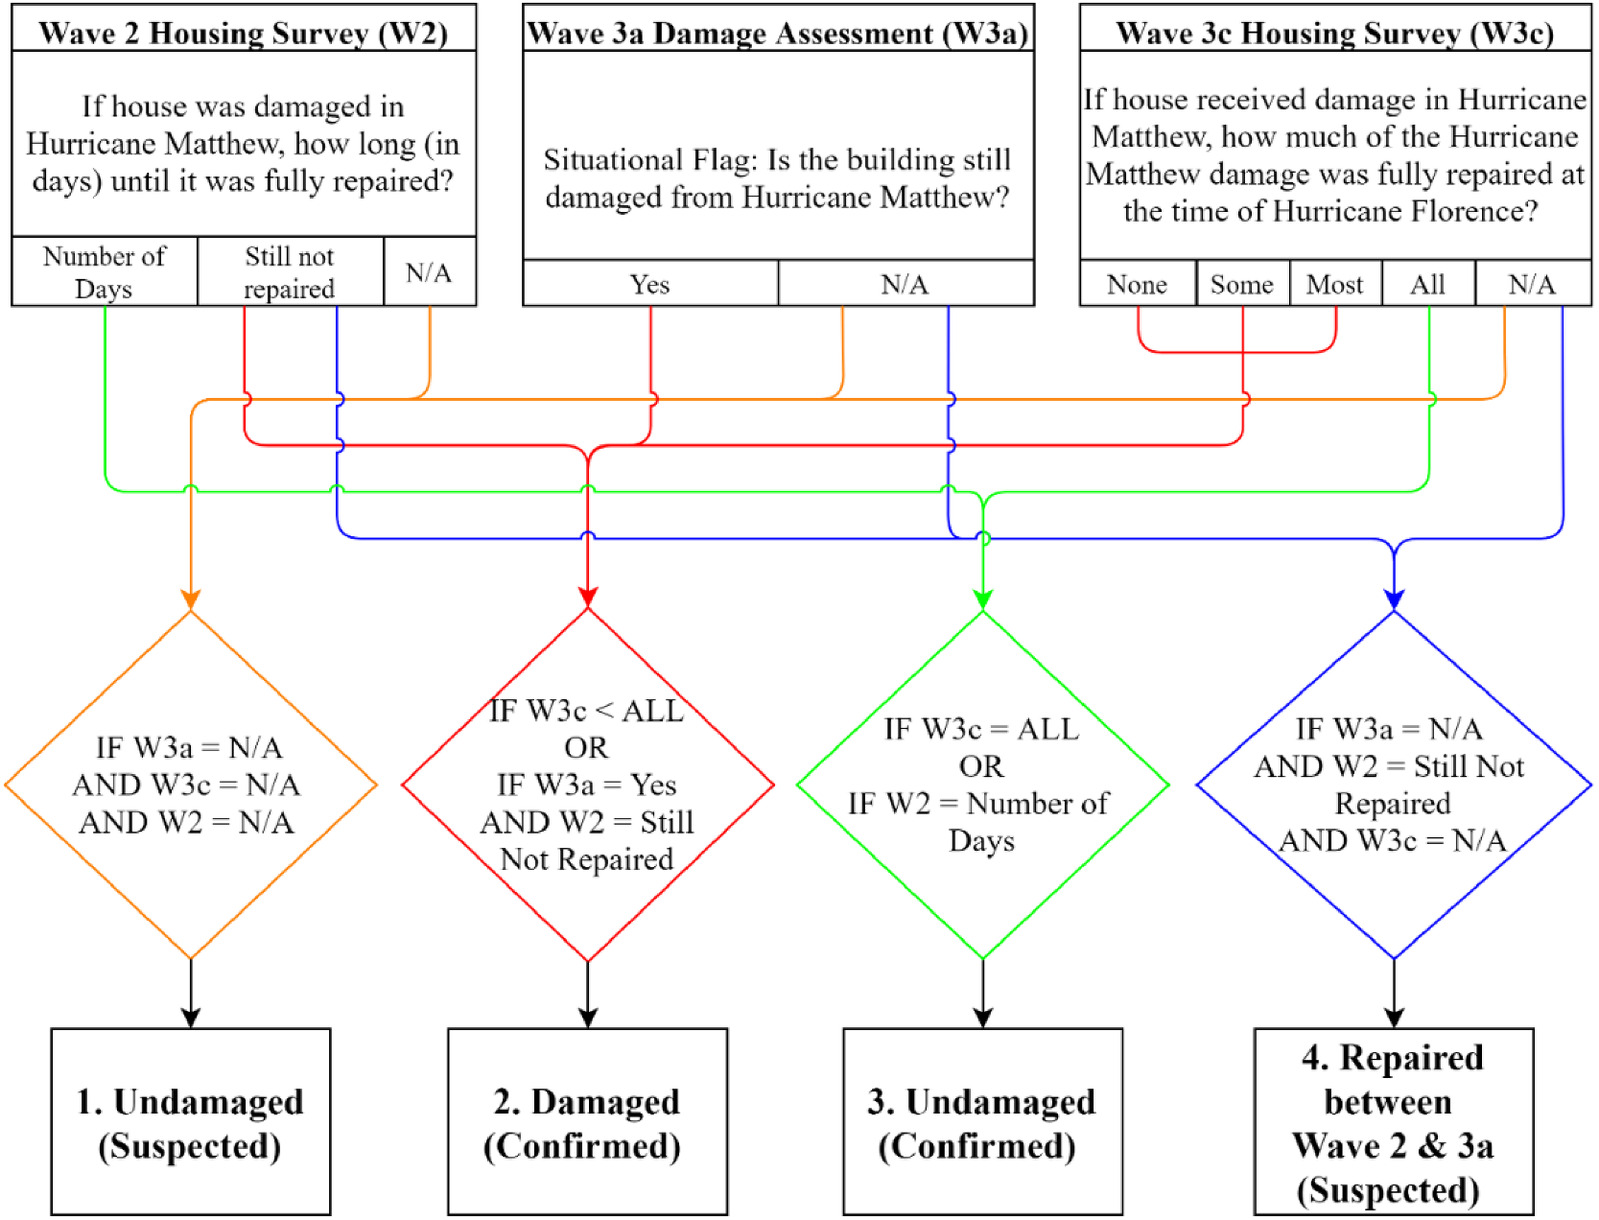
The Wave 3c household survey included a question assessing whether the respondent’s home was still damaged from the 2016 flood event when Hurricane Florence hit. Answer choices to the question were none, some, most, or all, as shown in Fig. 3, and N/A represents buildings where this question was not answered by residents. Reasons for the question not being answered include no survey being conducted because residents were not available during data collection or declined the survey, or because the residents being surveyed were not living in the building at the time of Hurricane Florence and therefore did not know the answer. Answers to this question were the most beneficial in the determination of initial condition, as buildings with residents that answered all were categorized as undamaged at the time of Hurricane Florence. The Wave 2 household survey included a question assessing how long it took to fully repair damages caused by Hurricane Matthew. Answer choices to this question were the number of days after the storm before the building was fully repaired or still not repaired, as shown in Fig. 3, and N/A represents buildings where this question was not answered by residents. Buildings with survey responses indicating that damages had been fully repaired were categorized as undamaged at the time of Hurricane Florence. A situational flag was employed in the Wave 3a damage assessment by leaving a comment for each building where field team members believed that observed HWMs and damages were remaining from Hurricane Matthew. Fig. 3 represents this as any building with a situational flag comment answering yes to an implied question of building damage remaining from Hurricane Matthew, and N/A represents buildings that did not contain a situational flag in the comments. Buildings that did not contain answers to the two household survey questions identifying their initial condition were analyzed on a case-by-case basis using photography collected in Waves 1 and 3a and notes taken during the Wave 3a assessment. In certain cases, this additional information provided confidence in assigning an initial state, such as a HWM or damage observed for a building in Wave 1 photography appearing again in Wave 3a photography. An initial state parameter was created to describe the condition of each building at the time of Hurricane Florence by aggregating all relevant information, and a level of confidence in the assessment was assigned based on the presence and quality of the evidence for each building.
The initial state parameter was sorted into one of four categories: (1) Undamaged (suspected)–there was no evidence in Wave 3a of damage remaining from the 2016 flood event and no survey information from Waves 2 or 3c available for the structure; (2) Damaged (confirmed)—damage from the 2016 flood event remained unrepaired when Hurricane Florence occurred, based on Wave 3c survey response that Hurricane Matthew damage remained when Hurricane Florence impacted the city, or if no Wave 3c survey response was available for a structure, then (a) the building was flagged during Wave 3a, indicating damage was likely an artifact from the 2016 flood event, and (b) Wave 2 survey information confirmed that damage from Hurricane Matthew had not been repaired at the time of the Wave 2 survey; (3) Undamaged (confirmed)—based on Wave 3c survey response indicating that damage from the 2016 flood event was fully repaired at the time of Hurricane Florence or Wave 2 survey response indicating that damage had been fully repaired at the time of the Wave 2 survey; and (4) Repaired between Wave 2 and Wave 3 (suspected)—based on Wave 2 survey data indicating that Hurricane Matthew damage had not been fully repaired in the structure, but no flag in the Wave 3a deployment that observed damage was likely caused by Hurricane Matthew and no response to the Wave 3c survey question about damage remaining at the time of Hurricane Florence. Wave 3a was conducted eight months after Wave 2, providing sufficient time for some homes to be repaired between data collection trips. In cases where survey responses between waves contradicted, photographs from Waves 1 and 3a and comments recorded in Wave 3a were analyzed and initial state parameters were assigned on a case-by-case basis, considering all evidence available for each building. All observations assigned Initial state categories (1), (3), and (4) were used in the fragility analysis, and the observations assigned Initial state category (2) were discarded, as the observed damages were not sustained solely from the repeat flood event. Table 4 displays the number of observations for residential structures in the Wave 3a data after determining the initial state, and is categorized by foundation type, measurement datum, and building typology. The raw data displayed in Table 4 are available at Sutley et al. (2021a).
| Number of observations | ||||||
|---|---|---|---|---|---|---|
| Aggregate building type | Single-family building type | Multifamily building type | ||||
| Damage state | HWM measured with respect to ground | HWM measured with respect to FFE | HWM measured with respect to ground | HWM measured with respect to FFE | HWM measured with respect to ground | HWM measured with respect to FFE |
| Slab-on-grade foundation | ||||||
| DS 1 | 5 | 4 | 5 | 4 | 0 | 0 |
| DS 2 | 4 | 4 | 2 | 2 | 2 | 2 |
| DS 3 | 0 | 0 | 0 | 0 | 0 | 0 |
| DS 4 | 0 | 0 | 0 | 0 | 0 | 0 |
| Total | 9 | 8 | 7 | 6 | 2 | 2 |
| Crawlspace foundation | ||||||
| DS 1 | 21 | 13 | 20 | 12 | 1 | 1 |
| DS 1a | 8 | 0 | 8 | 0 | 1 | 0 |
| DS 1b | 13 | 13 | 12 | 12 | 0 | 1 |
| DS 2 | 21 | 18 | 21 | 18 | 0 | 0 |
| DS 3 | 1 | 1 | 1 | 1 | 0 | 0 |
| DS 4 | 0 | 0 | 0 | 0 | 0 | 0 |
| Total | 43 | 32 | 42 | 31 | 1 | 1 |
Approximately 80% fewer sampled residential structures were newly damaged by Hurricane Florence than Hurricane Matthew. Similar to Table 2, most of the sampled buildings were single-family residences with crawlspaces. However, it is important to point out that the 97% fewer multifamily slab-on-grade buildings in Table 4 compared to Table 2 were primarily due to repairs not being completed after Hurricane Matthew. This finding matches slower housing recovery patterns for multifamily housing observed after other disasters (Wu and Lindell 2004; Hamideh et al. 2018; Sutley and Hamideh 2020).
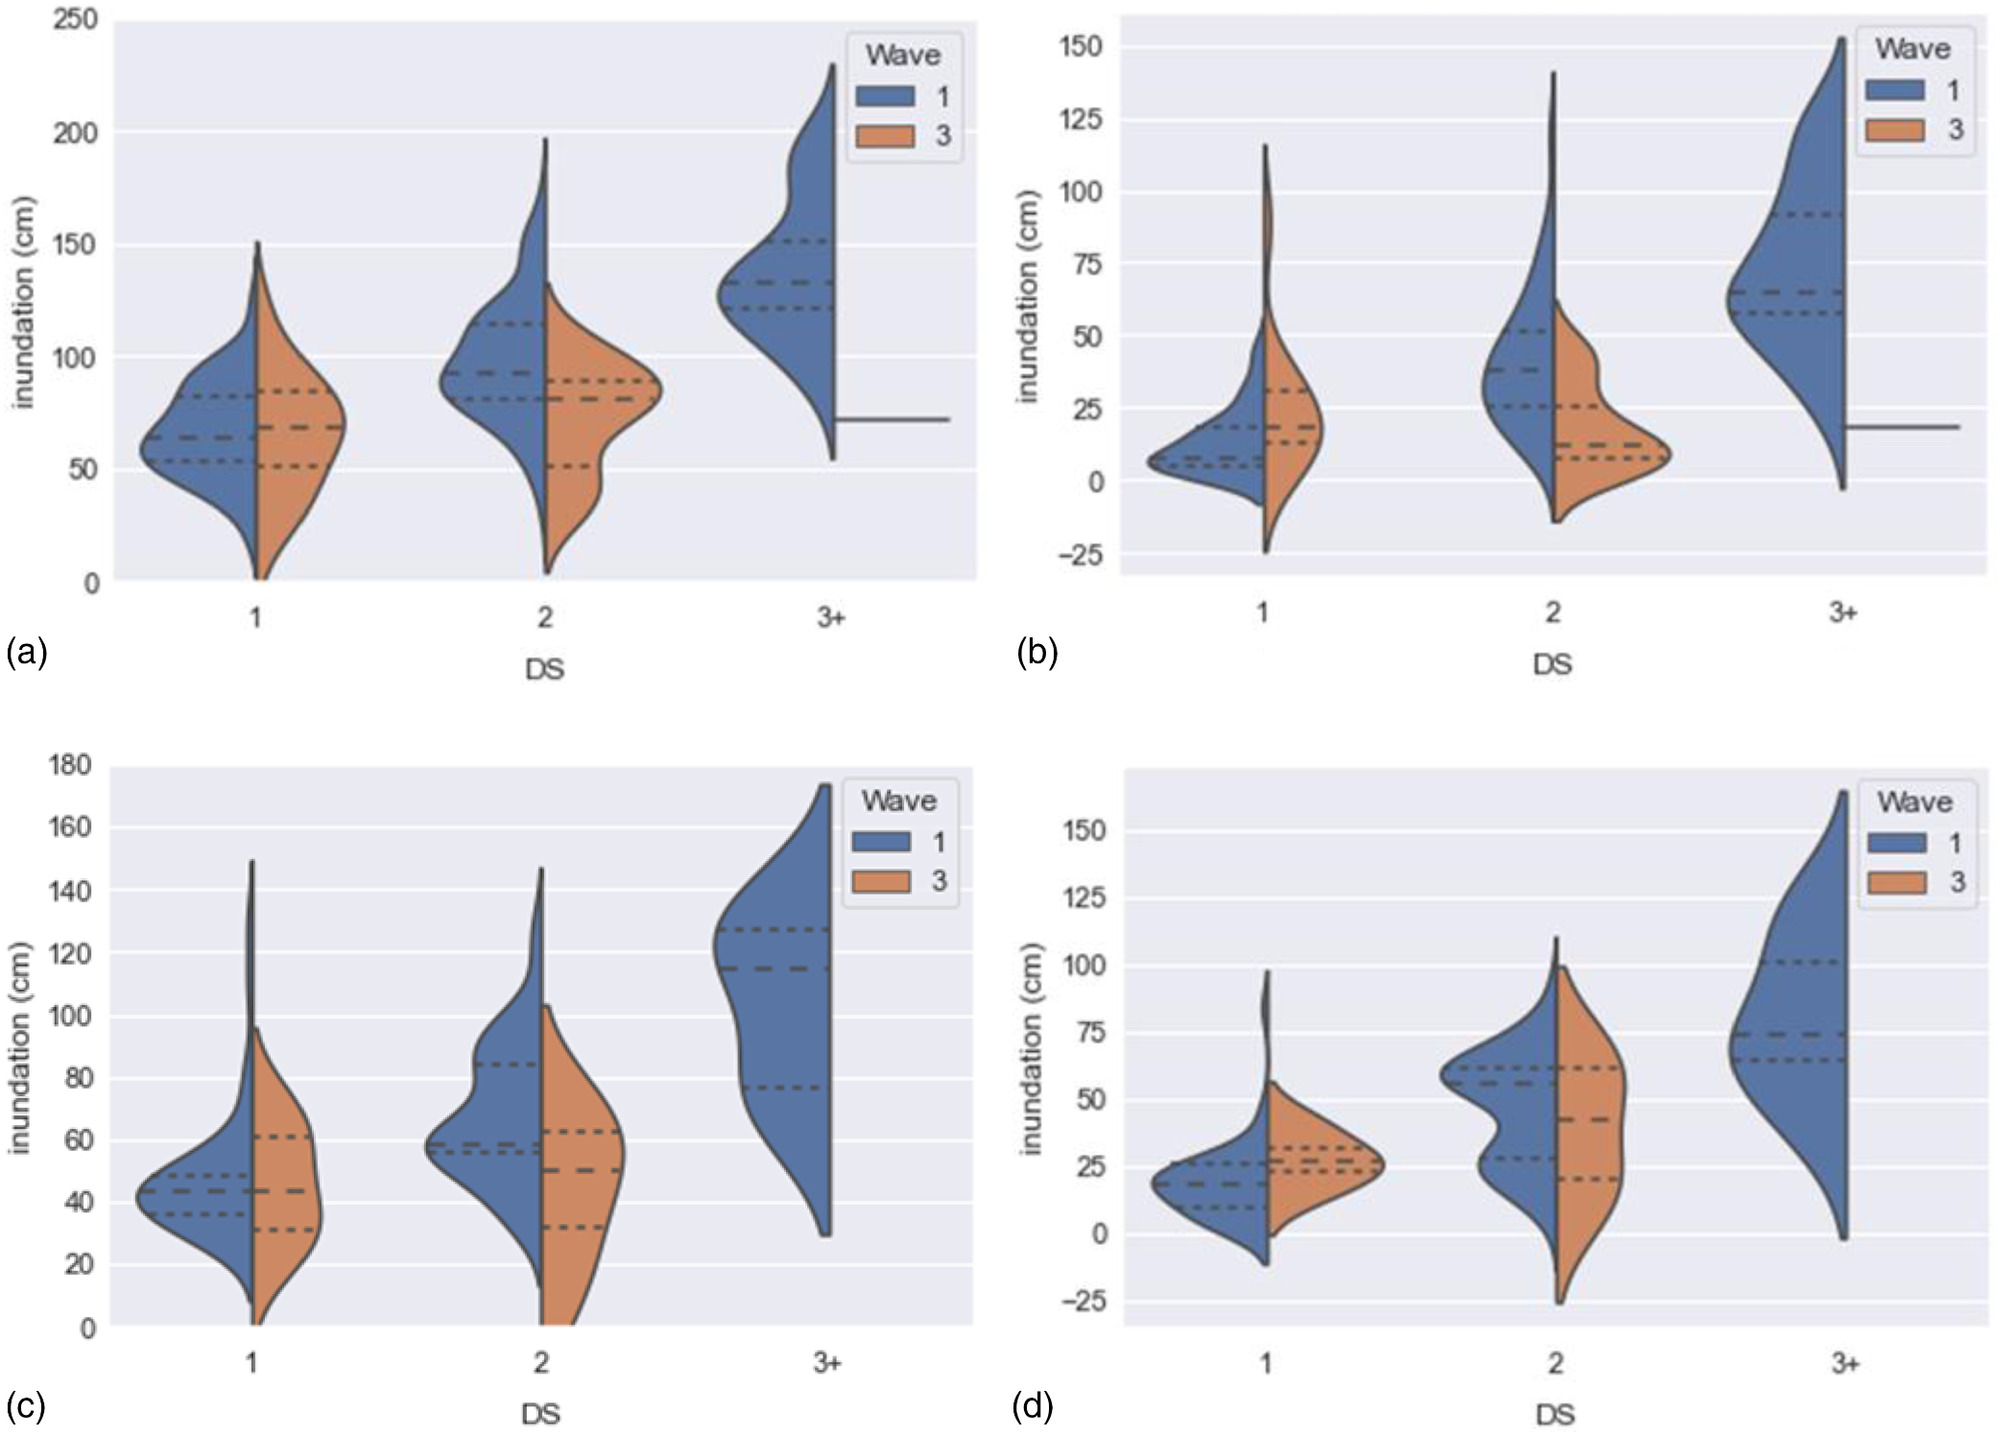
A comparison of flood height measurement distributions collected in Waves 1 and 3a is displayed in Fig. 4. The collected data are represented as violin plots, where kernel density estimations of the data are used to represent the underlying distributions. The plots are categorized by observations of buildings with crawlspace foundations and measurements taken with respect to the ground in Fig. 4(a), observations of buildings with crawlspace foundations and measurements taken with respect to FFE in Fig. 4(b), observations of buildings with slab-on-grade foundation and measurements taken with respect to the ground in Fig. 4(c), and observations of buildings with slab-on-grade foundation and measurements taken with respect to FFE in Fig. 4(d). For each set of observations, measurements are further categorized by DS, with Wave 1 measurements shown in blue on the left side of each plot and Wave 3a measurements shown in orange on the right side of each plot. DS 3 and higher are combined due to the low number of observations in those categories. The first, second, and third quartile of each distribution are shown as dashed lines. It is apparent from these data that the statistics of the DS 1 distributions are similar between waves, while the distribution of DS 2 measurements are significantly lower for Wave 3a, and no comparison can be made for DS 3 due to the lack of that DS in Wave 3a data. This indicates that measurement distributions are affected by the flood hazard intensity and mitigation actions taken in preparation for flood events. While it is likely that the entire range of depths that result in DS 1 observations was observed, only the lower portion of that range for DS 2 was observed and caused the distribution to be skewed toward lower measurements. This is important, because probabilistic models built from these data may also be skewed and therefore not representative of the true depth-damage relationship.
Method to Develop Empirical Flood Fragilities
The understanding produced from the measurement of the second extreme event—that flood damages are dependent on the nature of the event as well as the community preparation and response to the event—further highlights the need for probabilistic methods of capturing flood damage and provides insight into the needs of these probabilistic methods when using empirical data. The original intent of the study was to develop an independent set of fragility functions derived from newly damaged buildings observed in the 2018 flood event to compare to a set of fragility functions developed using observations of damage from the 2016 flood event (van de Lindt et al. 2018, 2020). Due to the limited number of newly damaged buildings observed following the 2018 flood event, statistically significant fragility functions could not be derived from this data set. The earthquake engineering literature has established methods for reducing uncertainty in empirical fragility functions by aggregating data from multiple events (FEMA 2018b). Following the FEMA (2018b) approach, the newly damaged building observations in the 2018 flood event are combined with the damage observations in the 2016 flood event, and the event-combined data are used to derive fragility functions.
Fragility functions are developed using DSs conditioned on flood depth above a specified datum. Additionally, separate functions were created for buildings with slab-on-grade and crawlspace foundations as well as aggregate building types, which are further disaggregated into single-family and multifamily building types. Cumulative distribution functions (CDFs) of lognormal distributions are used to capture the uncertainty in the damage data, following the approach used in Wave 1 for deriving fragility functions from the set of observations collected during that wave (van de Lindt et al. 2018, 2020). In this approach, the natural logarithms of the mean and standard deviation are calculated using the measured data in each DS for each combination of foundation type, building type, and measurement datum. These parameters are used to calculate the lognormal distribution of each DS. Lognormal distributions are commonly used in the derivation of engineering fragility functions and are appropriate for flood modeling because observations are limited to nonnegative values and provide simple parametric forms that can be applied in community-level risk analysis frameworks. Additionally, a suite of distributions was tested, and the lognormal distribution was chosen because it provided the best fit to the data based on the Akaike information criterion. Lognormal CDFs were used following Eq. (1)where represents the conditional probability that , the random variable representing the DS for a structure, is greater than or equal to a specific DS equal to (e.g., 0, 1, 2,…), conditioned on , the random variable representing flood depth with respect to a specified datum, equal to the observed flood depth above the same datum, . Eq. (1) defines the fragility function of damage state , evaluated at . The flood depths were measured in units of inches above the specified datum. The parameters of the cumulative lognormal distribution are denoted as and . represents the mean value of the natural logarithm of the observations of flood elevation above a specified datum that were assigned DS , and represents the normal CDF. represents the standard deviation of the natural logarithm of the observations of flood elevations above a specified datum that were assigned DS . The lognormal standard deviation, , of each fragility function represents the uncertainty in the height of inundation above a specified datum at which a DS is likely to be reached.
(1)
The DSs listed in Table 1 are sequential, therefore the conditional probability that a structure will sustain damage defined by a given DS given a demand parameter is found using Eq. (2)where the demand parameter = inundation above the specified datum; and = number of the highest DS considered.
(2)
To validate the use of the lognormal distribution considered in the analysis, the Kolmogorov-Smirnov (K-S) and Lilliefors goodness-of-fit tests are performed for each set of fragility functions. The K-S test (Massey 1951) has been widely used in engineering analyses and is conducted by comparing the cumulative frequency of the observed data with the CDF of the assumed theoretical distribution. The model fit is rejected when the maximum difference between measured and modeled distributions exceeds a critical value for a given sample size. The critical value is determined given a prescribed significance level . A significance level of 5% () is chosen for the flood fragility functions described here, given the sample size of the data set. The K-S test has been shown to have high sensitivity at the extreme values of the distribution (Ghasemi and Zahediasl 2012). The Lilliefors test (Lilliefors 1967) is a correction of the K-S test that results in higher explanatory power compared to the K-S test (Ghasemi and Zahediasl 2012). FEMA (2018b) recommends applying the Lilliefors test when assessing goodness-of-fit for fragility analyses.
Results
Table 5 presents and for structures, categorized by foundation type, building type, and measurement datum for the set of event-combined observations. Multifamily residential structures built with slab-on-grade foundations contain fragility parameters for DS 1 and DS 2, but lognormal functions could not be created for DS 3 due to a statistically insignificant sample size of observations in that DS. The observed sample size of multifamily residential structures built on crawlspace foundations is also insufficient to derive statistically significant fragility functions. Consistent with the Wave 1 fragility analysis, the event-combined data did not allow for the derivations of DS 3 for multifamily homes with slab-on-grade foundations and all damages states for multifamily homes with crawlspace foundations. To provide an example for physical context of the lognormal CDF parameters, the mean values of the measurements for the combined data set corresponding to slab foundation, aggregate building type, and ground measurement datum for DS 1, DS 2, and DS 3 are 47.6 cm (), 66.2 cm (), and 104.1 cm (), respectively, whereas the parameter values for these observations are 2.87, 3.20, and 3.68, respectively, as given in Table 5. The standard deviations of the same observations are 7.9 cm (), 8.9 cm (), and 11.3 cm () for DS 1, DS 2, and DS 3, respectively, while the parameter values are 0.34, 0.39, and 0.29, respectively, as given in Table 5.
| HWM measurement datum | Damage state | Crawlspace foundation | Slab-on-grade foundation | ||||||||
|---|---|---|---|---|---|---|---|---|---|---|---|
| Aggregate building type | Single-family building type | Aggregate building type | Single-family building type | Multifamily building type | |||||||
| Ground | DS 1 | 3.20a | 0.38 | 3.20a | 0.38 | 2.87a | 0.34 | 3.04a,b | 0.44 | 2.76a,b | 0.19 |
| DS 1a | 2.96a | 0.38 | 2.96a | 0.38 | N/A | N/A | N/A | N/A | N/A | N/A | |
| DS 1b | 3.36a,b | 0.30 | 3.36a,b | 0.30 | N/A | N/A | N/A | N/A | N/A | N/A | |
| DS 2 | 3.56 | 0.34 | 3.57a | 0.32 | 3.20a | 0.39 | 3.26a,b | 0.31 | 3.16a | 0.44 | |
| DS 3 | 3.94a,b | 0.26 | 3.94a,b | 0.26 | 3.68a,b | 0.29 | 3.68a,b | 0.29 | N/A | N/A | |
| FFE | DS 1 | 1.46a,b | 0.92 | 1.47a,b | 0.90 | 1.78 | 0.82 | 2.28a,b | 0.52 | 1.50a | 0.83 |
| DS 2 | 2.47 | 0.78 | 2.46 | 0.79 | 2.76 | 0.59 | 2.68a,b | 0.69 | 2.84 | 0.53 | |
| DS 3 | 3.23a,b | 0.49 | 3.24a,b | 0.51 | 3.39a,b | 0.40 | 3.39a,b | 0.40 | N/A | N/A | |
Note: Summary of fragility function parameters, where represents the mean value of the natural logarithm of each observation within the set of observations of flood elevation that correspond to the foundation type, building type, measurement datum, and DS specified, and represents the standard deviation of the natural logarithm of each observation within the set of observations of flood elevation that correspond to the foundation type, building occupancy type, measurement datum, and DS specified.
a
Parameter fit passes the K-S test.
b
Parameter fit passes the Lilliefors tests.
To indicate statistical significance in Table 5, functions that pass K-S testing are indicated with a superscript to the right of the value of the function. Functions that pass Lilliefors testing are indicated with a superscript . Ultimately, 86% passed the K-S test, 54% passed both tests, and 14% passed neither test. The results of the goodness-of-fit tests should be considered in scenarios where the fragilities are applied to model flood damages, especially for those functions that failed both tests. In general, the event-combined set of observations performed better in goodness-of-fit tests compared to the fragility functions derived from Wave 1 data alone (van de Lindt et al. 2018, 2020), which supports aggregating observations across multiple hazard events. To better understand the inundation-damage relationship, more observations are needed.
A graphical illustration of a set of fragility functions is displayed in Fig. 5. Fig. 5(a) shows the lognormal CDF for each DS created using the event-combined data set describing observations belonging to the aggregate building type with crawlspace foundations and inundation measured with respect to the ground. Fig. 5(b) shows the fragility functions using the same data, but with DS 1 split to account for observations where inundation was observed below the building FFE.
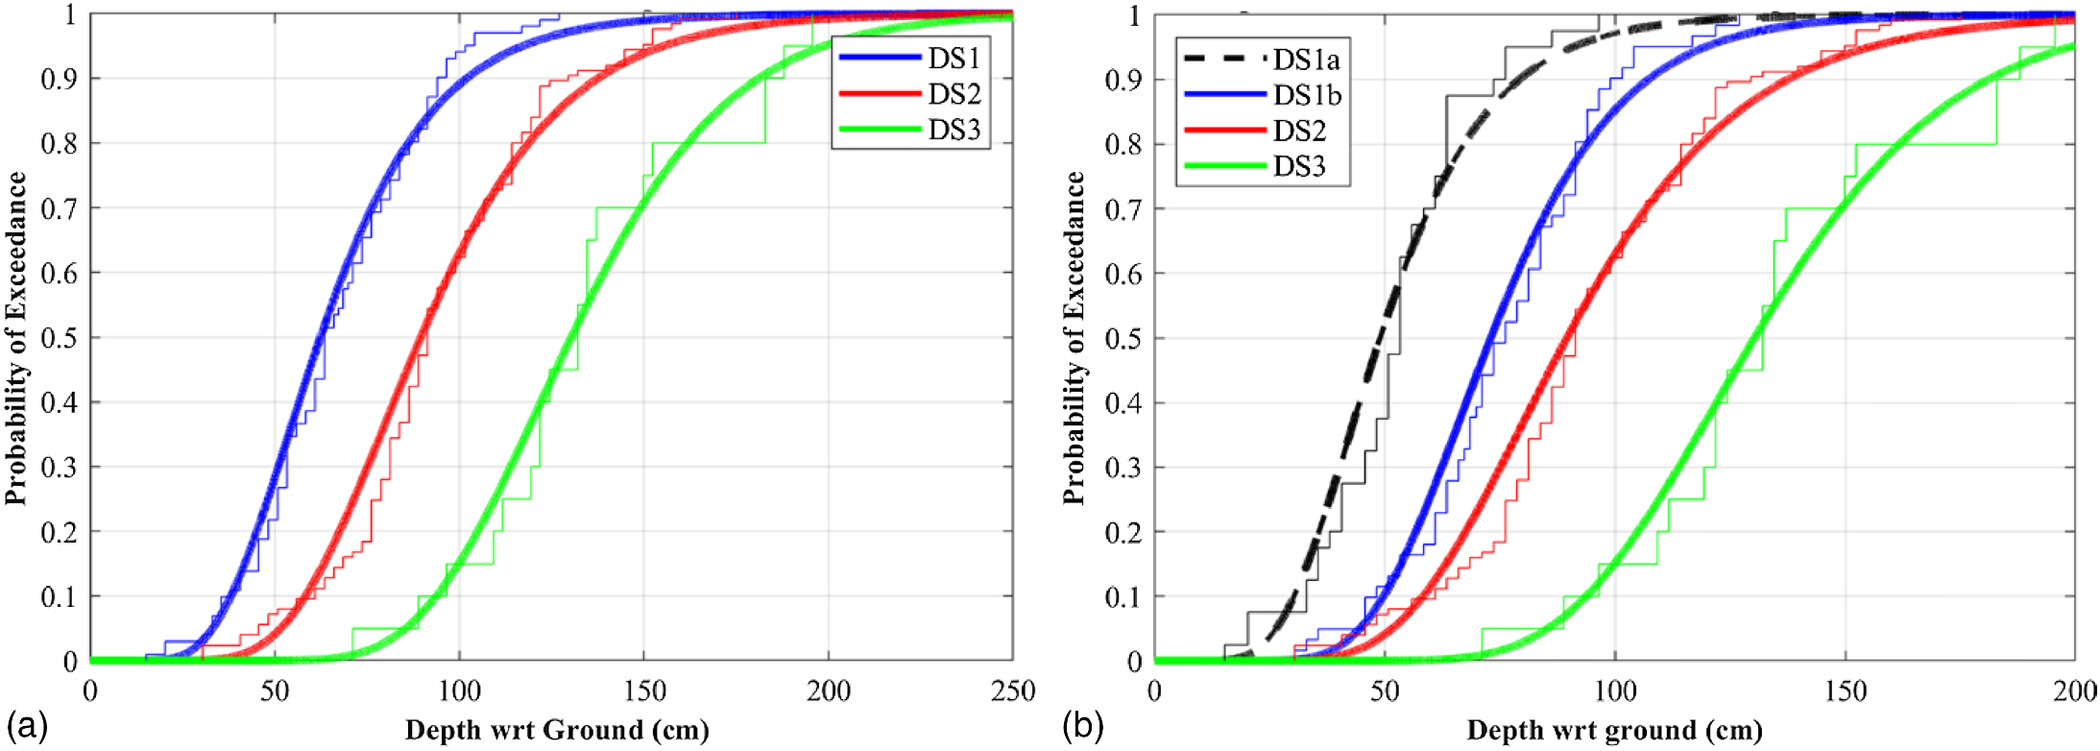
In comparing the fragility function parameters and goodness-of-fit test results presented in Table 5 and the functions shown in Fig. 5 when DS 1 is split into DS 1a and DS 1b, there is a significant difference in the split DS functions. The model fit for DS 1a is comparable to the unsplit DS 1, while the model fit for DS 1b is improved. These results show the effectiveness of breaking DS 1 into DS 1a and DS 1b, yielding results that will improve loss analyses that previously would not have considered damage occurring below the FFE.
Discussion
Initial states of the buildings surveyed in Lumberton, North Carolina, were difficult to ascertain while the field damage assessment was conducted. To better understand the initial states, longitudinal data comprised of physical measurements and surveys were used to create an initial state parameter. The large proportion of buildings with damage incurred from Hurricane Matthew at the time of Hurricane Florence points to challenges faced by residents along recovery trajectories. While the longitudinal nature of this study allowed the initial state of structures to be assigned with a high degree of confidence, future studies should allow for uncertainty if a structure’s pre-event condition is not known. Additionally, future studies of communities affected by repeat inundation events should consider including surveys of building residents and owners to better understand the recovery trajectories of individual buildings from the first flood event and the pre-event condition of the buildings at the time of the second event.
A comparison of the results of the damage observations measured following Waves 1 and 3a showed that the statistical distribution of measurements for DS 1 remained fairly consistent while observations for DS 2 were much lower in Wave 3a, and no comparison could be made for DS 3 because there were too few observations in that DS in Wave 3a. The changes in flood measurement distributions are likely due to improved flood mitigation actions taken in the second event. The results agree with previous findings in the flood modeling literature that fragility functions derived from a single event are not fully sufficient to model the inundation-damage relationship across events, even those occurring in the same location and with a similar intensity. Aggregating data from a large number of flood events would allow for the entire range of inundation values for each DS to be observed, although the data could be biased if, for example, a large number of the flood events were less severe and did not cover the range of inundation values for each DS.
Conclusions and Recommendations
As floods are the costliest natural hazard in the US, communities require methods to adequately quantify their risk in order to effectively plan for increased community resilience. Repeated flood hazards are becoming more common in the US, and flood risk modeling methods are needed to more accurately assess the initial state of community infrastructure in order to assess the effects of repeated inundation. This study presented a novel flood assessment approach for repeated inundation and a set of fragility functions produced from damage observations representing repeat inundation events, using the 2016 and 2018 floods of the city of Lumberton, North Carolina, as a case study. The flood assessment approach included documentation of sources of uncertainty in measuring damages for a repeat inundation event, and development of a methodology to consider the initial state of buildings using a longitudinal data set consisting of physical inundation and damage measurements as well as surveys of residents. A comparison of the fragility function analyses provided insight into the nature of building damage and the effect on flood damage modeling approaches. Best practices for flood metrology for repeated inundation and flood damage modeling, and a summary of future work needed for further improving flood damage models, are provided next.
In future repeat flood events for a community, a metrology approach including measurement and initial state uncertainty will be needed to distinguish the effects of each distinct flood event. These studies should consider incorporating surveys of building occupants into their methodology to create an initial state parameter to distinguish which flood event caused the observed HWMs and damages. Additionally, FEMA documentation has parameterized uncertainties in seismic engineering (FEMA 2009) to account for measurement variability; future work should explore methods to incorporate the effects of the five sources of measurement uncertainty identified here in flood damage models. Those sources of uncertainty include (1) location of HWMs due to shorter duration of inundation compared to Wave 1, (2) attribution of HWMs to specific flood events, (3) relation of flood depth to observed damage, (4) differing measurement datums for flood events based on the location of visible HWMs in each event, and (5) assessment of damage to building interiors.
A comparison of flood depth measurements taken in Waves 1 and 3a of the Lumberton field study was described. The comparison showed that the DS 1 measurement distribution was consistent between waves while DS 2 inundation measurements were much lower in Wave 3a than in Wave 1, likely attributable to mitigation actions reducing the maximum flood heights across many of the buildings in the measurement sample. Because two flood events in a single community are not fully sufficient to develop damage equations that are applicable across geographies, a case is made for aggregating flood damage measurements for multiple events to more broadly account for the uncertainty in the flood inundation-damage relationship. To adequately account for probabilistic correlation of flood depths to damage levels for community risk modeling, a database of flood inundation levels measured in multiple events and categorized by consistent DS definitions, measurement datums, and building typologies is necessary. Recent innovations in the natural hazards community, such as the NSF-funded Natural Hazards Engineering Research Infrastructure (NHERI) Designsafe Cyberinfrastructure (Designsafe-CI) (Rathje 2017), facilitate nationwide research collaboration and data storage. Designsafe-CI and other cyberinfrastructure platforms on which a flood depth and damage database could be indefinitely stored and maintained further enable broad and specific risk-based damage modeling efforts. To support the creation of such a database, deidentified data collected in the Lumberton field study (van de Lindt et al. 2021; Sutley et al. 2021b) are available in the NHERI DesignSafe-CI platform as a starting point for discussion among the research community, and to further enable the determination of adequate DSs to account for regional variation in building typology, DS descriptions, and acceptable measurement datums. Future work will include additional model inputs, including additional building and hazard types, and will require consensus among the research field to determine the standard model inputs and formats to build more robust models from the aggregated data.
Data Availability Statement
All data, models, or code that support the findings of this study are available from the corresponding author upon reasonable request, but all personally identifiable information will be deidentified before transferal.
Acknowledgments
The authors would like to acknowledge the Center for Risk-Based Community Resilience Planning, and specifically the many researchers across multiple disciplines and institutions who contributed to the longitudinal study of Lumberton, North Carolina. The Center for Risk-Based Community Resilience Planning is a NIST-funded CoE; the Center is funded through a cooperative agreement between NIST and Colorado State University (Grant No. 70NANB15H044).
References
Amadio, M., A. R. Scorzini, F. Carisi, A. H. Essenfelder, A. Domeneghetti, J. Mysiak, and A. Castellarin. 2019. “Testing empirical and synthetic flood damage models: The case of Italy.” Nat. Hazards Earth Syst. Sci. 19 (3): 661–678. https://doi.org/10.5194/nhess-19-661-2019.
Brody, S. D., W. E. Highfield, and J. E. Kang. 2011. Rising waters: The causes and consequences of flooding in the United States. Cambridge, UK: Cambridge University Press.
Crawford, S., E. Sutley, T. Tomiczek, K. Farokhnia, D. Deniz, J. Mitrani-Reiser, and J. van de Lindt. 2021. “Building damage survey instrument, October 16, 2018: Wave 3a.” In A longitudinal community resilience focused technical investigation of the Lumberton, North Carolina Flood of 2016. Austin, TX: DesignSafe-CI. https://doi.org/10.17603/ds2-6xjf-4d59.
Dang, N. M., M. S. Babel, and H. T. Luong. 2011. “Evaluation of food risk parameters in the day river flood diversion area, Red River delta, Vietnam.” Nat. Hazard. 56 (1): 169–194. https://doi.org/10.1007/s11069-010-9558-x.
Deniz, D., J. van de Lindt, T. Tomiczek, M. Koliou, A. Barbosa, E. Sutley, W. Peacock, J. Mitrani-Reiser, C. Jones, and W. Coulbourne. 2020. “Building damage survey instrument, November 26, 2016: Wave 1.” In A longitudinal community resilience focused technical investigation of the Lumberton, North Carolina Flood of 2016. DesignSafe-CI: Survey Instruments. Austin, TX: DesignSafe-CI. https://doi.org/10.80023/ds2-5eet-7016.
Deniz, D., J. van de Lindt, T. Tomiczek, M. Koliou, A. Barbosa, E. Sutley, W. Peacock, J. Mitrani-Reiser, C. Jones, and W. Coulbourne. 2021. “Building damage survey instrument, November 26, 2016: Wave 1.” In A longitudinal community resilience focused technical investigation of the Lumberton, North Carolina Flood of 2016. DesignSafe-CI. https://doi.org/10.17603/ds2-b1yd-pq98.
De Risi, R., F. Jalayer, F. De Paola, I. Iervolino, M. Giugni, M. E. Topa, E. Mbuya, A. Kyessi, G. Manfredi, and P. Gasparini. 2013. “Flood risk assessment for informal settlements.” Nat. Hazard. 69 (1): 1003–1032. https://doi.org/10.1007/s11069-013-0749-0.
FEMA. 2009. Quantification of building seismic performance factors. Washington, DC: Applied Technology Council for the Federal Emergency Management Agency.
FEMA. 2018a. Guidance for flood risk analysis & mapping. Washington, DC: Dept. of Homeland Security Federal Emergency Management Agency.
FEMA. 2018b. Seismic performance assessment of buildings volume 1—Methodology. Washington, DC: Dept. of Homeland Security Federal Emergency Management Agency.
Friedland, C. J. 2009. Residential building damage from hurricane storm surge: Proposed methodologies to describe, assess and model building damage. Baton Rouge, LA: Louisiana State Univ.
Galasso, C., M. Pregnolato, and F. Parisi. 2021. “A model taxonomy for flood fragility and vulnerability assessment of buildings.” Int. J. Disaster Risk Reduct. 53 (Feb): 101985. https://doi.org/10.1016/j.ijdrr.2020.101985.
Ghasemi, A., and S. Zahediasl. 2012. “Normality tests for statistical analysis: A guide for non-statisticians.” Int. J. Endocrinol. Metab. 10 (2): 486. https://doi.org/10.5812/ijem.3505.
Gori, A., R. Blessing, A. Juan, S. Brody, and P. Bedient. 2019. “Characterizing urbanization impacts on floodplain through integrated land use, hydrologic, and hydraulic modeling.” J. Hytrol. 568 (Jan): 82–95. https://doi.org/10.1016/j.jhydrol.2018.10.053.
Hamideh, S., W. Peacock, and S. Van Zandt. 2018. “Housing recovery after disasters: Primary versus seasonal/vacation housing markets in coastal communities.” Nat. Hazard. Rev. 19 (2): 04018003. https://doi.org/10.1061/(ASCE)NH.1527-6996.0000287.
HAZUS-MH. 2008. Multi-hazard loss estimation methodology. Washington, DC: Dept. of Homeland Security Federal Emergency Management Agency, Mitigation Division.
Helgeson, J., S. Hamideh, and E. J. Sutley, eds. 2021. Community resilience-focused technical investigation of the 2016 Lumberton, NC Flood: Community impact and recovery following successive flood events. Gaithersburg, MD: NIST.
Highfield, W. E., W. G. Peacock, and S. Van Zandt. 2014. “Mitigation planning why hazard exposure, structural vulnerability, and social vulnerability matter.” J. Plans. Educ. Res. 34 (3): 287–300. https://doi.org/10.1177/0739456X14531828.
Koenig, T. A., et al. 2016. Identifying and preserving high-water mark data.” Chap. A24 in USGS techniques and methods, Book 3, 47. Reston, VA: USGS. https://doi.org/10.3133/tm3A24.
Kreibich, H., K. Perot, I. Seifert, H. Maiwald, U. Kunert, J. Schwarz, and A. H. Thieken. 2009. “Is flow velocity a significant parameter in flood damage modelling?” Nat. Hazards Earth Syst. Sci. 9 (5): 1679–1692. https://doi.org/10.5194/nhess-9-1679-2009.
Lilliefors, H. W. 1967. “On the Kolmogorov-Smirnov test for normality with mean and variance unknown.” J. Am. Stat. Assoc. 62 (318): 399–402. https://doi.org/10.1080/01621459.1967.10482916.
Lindell, M. K., and R. W. Perry. 2012. “The protective action decision model: Theoretical modifications and additional evidence.” Risk Anal. Int. J. 32 (4): 616–632. https://doi.org/10.1111/j.1539-6924.2011.01647.x.
Macionis, J. J., and V. N. Parrillo. 2013. “The development of North American cities.” Accessed April 18, 2020. https://eportfolios.macaulay.cuny.edu/rodberg15/files/2015/01/Development-of-American-Cities-Cities-and-Urban-Life-Macionis-and-Parillo-.pdf.
Marvi, M. T. 2020. “A review of flood damage analysis for a building structure and contents.” Nat. Hazard. 102 (3): 967–995. https://doi.org/10.1007/s11069-020-03941-w.
Massey, F. J. Jr. 1951. “The Kolmogorov-Smirnov test for goodness of fit.” J. Am. Stat. Assoc. 46 (253): 68–78. https://doi.org/10.1080/01621459.1951.10500769.
Masterson, J. H., W. G. Peacock, S. S. Van Zandt, H. Grover, L. F. Schwarz, and J. C. Cooper. 2014. Planning for community resilience: Reducing vulnerability to disasters. New York: Island Press.
McGrath, H., A. A. El Ezz, and M. Nested. 2019. “Probabilistic depth–damage curves for assessment of flood-induced building losses.” Nat. Hazard. 97 (1): 1–14. https://doi.org/10.1007/s11069-019-03622-3.
Merz, B., H. Kreibich, R. Schwarze, and A. Thieken. 2010. “Review article ‘Assessment of economic flood damage.’” Nat. Hazards Earth Syst. Sci. 10 (8): 1697–1724. https://doi.org/10.5194/nhess-10-1697-2010.
Merz, B., H. Kreibich, A. Thieken, and R. Schmidtke. 2004. “Estimation uncertainty of direct monetary flood damage to buildings.” Nat. Hazards Earth Syst. Sci. 4 (1): 153–163. https://doi.org/10.5194/nhess-4-153-2004.
Messner, F. 2007. Evaluating flood damages: Guidance and recommendations on principles and methods. HR Wallingford, UK: Delft Univ. of Technology.
Nadal, N. C., R. E. Zapata, I. Pagán, R. López, and J. Agudelo. 2009. “Building damage due to riverine and coastal floods.” J. Water Resour. Plann. Manage. 136 (3): 327–336. https://doi.org/10.1061/(ASCE)WR.1943-5452.0000036.
Nascimento, N., M. Baptista, A. Silva, M. Léa Machado, J. C. de Lima, M. Gonçalves, R. Dias, and É. Machado. 2006. “Flood-damage curves: Methodological development for the Brazilian context.” Water Pract. Technol. 1 (1): 1–503. https://doi.org/10.2166/wpt.2006022.
NASEM (National Academies of Sciences, Engineering, and Medicine). 2019. Framing the challenge of urban flooding in the United States. Washington, DC: The National Academies Press.
NOAA (National Oceanic and Atmospheric Administration). 2016. “Hurricane Matthew: Rapid response imagery of the surrounding regions.” Accessed May 5, 2019. http://geodesy.noaa.gov/storm_archive/storms/matthew/index.html.
NOAA (National Oceanic and Atmospheric Administration). 2018. “Hurricane Florence: Emergency response imagery of the surrounding regions.” Accessed May 5, 2019. https://storms.ngs.noaa.gov/storms/florence/index.html.
Nofal, O., J. W. van de Lindt, and T. Q. Do. 2020. “Multi-variate and single-variable flood fragility and loss approaches for buildings.” Reliab. Eng. Syst. Saf. 202: 106971. https://doi.org/10.1016/j.ress.2020.106971.
Nofal, O. M., and J. W. van de Lindt. 2020a. “Minimal building flood fragility and loss function portfolio for resilience analysis at the community-level.” Water 12 (8): 2277. https://doi.org/10.3390/w12082277.
Nofal, O. M., and J. W. van de Lindt. 2020b. “Probabilistic flood loss assessment at the community scale: Case study of 2016 flooding in Lumberton, North Carolina.” ASCE-ASME J. Risk Uncertainty Eng. Syst. Part A: Civ. Eng. 6 (2): 5020001. https://doi.org/10.1061/AJRUA6.0001060.
Nofal, O. M., and J. W. van de Lindt. 2020c. “Understanding flood risk in the context of community resilience modeling for the built environment: Research needs and trends.” Sustainable Resilient Infrastruct. 5 (1): 1–17. https://doi.org/10.1080/23789689.2020.1722546.
Osberghaus, D. 2017. “The effect of flood experience on household mitigation—Evidence from longitudinal and insurance data.” Global Environ. Change 43 (Mar): 126–136. https://doi.org/10.1016/j.gloenvcha.2017.02.003.
Qi, H., and M. S. Altinakar. 2011. “Simulation-based decision support system for flood damage assessment under uncertainty using remote sensing and census block information.” Nat. Hazard. 59 (2): 1125–1143. https://doi.org/10.1007/s11069-011-9822-8.
Qi, H., and M. S. Altinakar. 2012. “GIS-based decision support system for dam break flood management under uncertainty with two-dimensional numerical simulations.” J. Water Resour. Plann. Manage. 138 (4): 334–341. https://doi.org/10.1061/(ASCE)WR.1943-5452.0000192.
Rathje, E. M., et al. 2017. “DesignSafe: New cyberinfrastructure for natural hazards engineering.” Nat. Hazard. Rev. 18 (3): 06017001. https://doi.org/10.1061/(ASCE)NH.1527-6996.0000246.
RSMeans. 2006. Means Square Foot Costs. Kingston, MA: RSMeans.
Salman, A. M., and Y. Li. 2018. “Flood risk assessment, future trend modeling, and risk communication: A review of ongoing research.” Nat. Hazard. Rev. 19 (3): 04018011. https://doi.org/10.1061/(ASCE)NH.1527-6996.0000294.
Scawthorn, C., et al. 2006. “HAZUS-MH flood loss estimation methodology. II. Damage and loss assessment.” Nat. Hazard. Rev. 7 (2): 72–81. https://doi.org/10.1061/(ASCE)1527-6988(2006)7:2(72).
Siegrist, M., and H. Gutscher. 2008. “Natural hazards and motivation for mitigation behavior: People cannot predict the affect evoked by a severe flood.” Risk Anal. Int. J. 28 (3): 771–778. https://doi.org/10.1111/j.1539-6924.2008.01049.x.
Sutley, E., S. Crawford, A. Graettinger, T. Do, J. Mitrani-Reiser, O. Nofal, T. Tomiczek, J. van de Lindt, M. Watson, and J. Weigand. 2021a. “Wave 3a select building characteristics for fragility analysis.” In A Longitudinal Community Resilience Focused Technical Investigation of the Lumberton, North Carolina Flood of 2016. Austin, TX: DesignSafe-CI. https://doi.org/10.17603/ds2-b3r1-t106.
Sutley, E. J., M. K. Dillard, and J. W. van de Lindt. 2021b. Community resilience-focused technical investigation of the 2016 Lumberton, NC Flood: Community Recovery One Year Later. Gaithersburg, MD: NIST.
Sutley, E. J., and S. Hamideh. 2020. “Post-disaster housing stages: A Markov chain approach to model sequences and duration based on social vulnerability.” Risk Anal. 40 (12): 2675–2695. https://doi.org/10.1111/risa.13576.
Thieken, A., B. Merz, H. Kreibich, and H. Apel. 2006. “Methods for flood risk assessment: Concepts and challenges.” In International workshop on flash floods in urban areas, 1–12. Muscat, Oman: GeoForschungsZentrum Potsdam, Section Engineering Hydrology.
Tomiczek, T., A. Kennedy, and S. Rogers. 2014. “Collapse limit state fragilities of wood-framed residences from storm surge and waves during Hurricane Ike.” J. Waterw. Port Coastal Ocean Eng. 140 (1): 43–55. https://doi.org/10.1061/(ASCE)WW.1943-5460.0000212.
Tomiczek, T., A. Kennedy, Y. Zhang, M. Owensby, M. E. Hope, N. Lin, and A. Flory. 2017. “Hurricane damage classification methodology and fragility functions derived from Hurricane Sandy’s effects in coastal New Jersey.” J. Waterw. Port Coastal Ocean Eng. 143 (5): 04017027. https://doi.org/10.1061/(ASCE)WW.1943-5460.0000409.
US Government Accountability Office. 2020. “National flood insurance program: Fiscal exposure persists despite property acquisitions.” Accessed August 12, 2021. https://www.gao.gov/assets/gao-20-508.pdf.
USGS. 2016. “National water information system data available on the world wide web (USGS Water Data for the Nation).” Accessed November 23, 2016 and December 10, 2018. http://waterdata.usgs.gov/nwis/.
van de Lindt, J., et al. 2021. “Wave 1 select building characteristics for fragility analysis.” In A Longitudinal Community Resilience Focused Technical Investigation of the Lumberton, North Carolina Flood of 2016. Austin, TX: DesignSafe-CI. https://doi.org/10.17603/ds2-sxz7-2q05.
van de Lindt, J. W., et al. 2020. “Community resilience-focused technical investigation of the 2016 Lumberton, North Carolina Flood: An interdisciplinary approach.” Nat. Hazard. Rev. 21 (3): 04020029. https://doi.org/10.1061/(ASCE)NH.1527-6996.0000387.
van de Lindt, J. W., W. G. Peacock, and J. Mitrani-Reiser. 2018. Community resilience-focused technical investigation of the 2016 Lumberton, North Carolina flood multi-disciplinary approach. Gaithersburg, MD: NIST.
Van Zandt, S., W. G. Peacock, D. W. Henry, H. Grover, W. E. Highfield, and S. D. Brody. 2012. “Mapping social vulnerability to enhance housing and neighborhood resilience.” Housing Policy Debate 22 (1): 29–55. https://doi.org/10.1080/10511482.2011.624528.
Wu, J. Y., and M. Lindell. 2004. “Housing reconstruction after two major earthquakes: The 1994 Northridge Earthquake in the United States and the 1999 Chi-Chi Earthquake in Taiwan.” Disasters 28 (1): 63–81. https://doi.org/10.1111/j.0361-3666.2004.00243.x.
Information & Authors
Information
Published In

ASCE-ASME Journal of Risk and Uncertainty in Engineering Systems, Part A: Civil Engineering
Volume 8 • Issue 2 • June 2022
Copyright
This work is made available under the terms of the Creative Commons Attribution 4.0 International license, https://creativecommons.org/licenses/by/4.0/.
History
Received: Mar 15, 2021
Accepted: Nov 5, 2021
Published online: Apr 5, 2022
Published in print: Jun 1, 2022
Discussion open until: Sep 5, 2022
Authors
Metrics & Citations
Metrics
Citations
Download citation
If you have the appropriate software installed, you can download article citation data to the citation manager of your choice. Simply select your manager software from the list below and click Download.
Cited by
- Omar Nofal, Nathanael Rosenheim, Sabarethinam Kameshwar, Jayant Patil, Xiangnan Zhou, John W. van de Lindt, Leonardo Duenas‐Osorio, Eun Jeong Cha, Amin Endrami, Elaina Sutley, Harvey Cutler, Tao Lu, Chen Wang, Hwayoung Jeon, Community‐level post‐hazard functionality methodology for buildings exposed to floods, Computer-Aided Civil and Infrastructure Engineering, 10.1111/mice.13135, (2024).
- Tori Tomiczek, Jennifer Helgeson, Elaina Sutley, Donghwan Gu, Sara Hamideh, P. Shane Crawford, A Framework for Characterizing Uncertainty Factors in Postdisaster Structural Performance Assessment Data, Natural Hazards Review, 10.1061/(ASCE)NH.1527-6996.0000604, 24, 1, (2023).
- Himadri Sen Gupta, Omar M. Nofal, Andrés D. González, Charles D. Nicholson, John W. van de Lindt, Optimal Selection of Short- and Long-Term Mitigation Strategies for Buildings within Communities under Flooding Hazard, Sustainability, 10.3390/su14169812, 14, 16, (9812), (2022).