Reliability Assessment of Road Network to Precipitation Based on Historical Recorded Disruptions
Abstract
Road networks play an essential role in economic activities and are required to have high level of reliability. Heavy precipitation could lead to disruptions to road networks, causing service failure and associated economic and social impacts. In this study, we proposed a framework for assessing the reliability of road networks to precipitation based on historical recorded disruption data. We first developed a vulnerability disruption model, which describes the relationship between precipitation intensity and the probability of road disruption, as well as the amount of disruptions, based on recorded data. The vulnerability of roads shows a nonlinear increasing trend with increasing precipitation. Based on the vulnerability model and Monte Carlo approach, the travel time reliability of road network of Fujian province, China was assessed. Two precipitation events in Fujian road network were selected to validate the proposed framework. The travel time reliability of 11.12% city pairs in Fujian Province decreased to below 0.85 with an average precipitation of 73.32 mm. The proposed vulnerability model and the framework for assessing reliability can provide guidance to highway departments so that they can prepare for possible adverse impacts caused by precipitation on roads and plan for road network service.
Introduction
Roads play a critical role in the development of the economy and society by enabling the mobility of goods and people. Extreme weather, especially heavy precipitation, or natural hazards such as floods, landslides, and earthquakes can cause disruptions to roads and affect normal traffic operations (Pregnolato et al. 2017; Hassan et al. 2022). Precipitation could cause adverse effects by influencing road conditions, vehicle performance, and the behavior of drivers (Donnell and Mason 2004; Ahmed et al. 2012; Peterson et al. 2008; Ahmed et al. 2015). Besides these adverse effects, heavy precipitation could disrupt roads and affect the connectivity and serviceability of the entire road network (Nowell et al. 2014; Gori et al. 2020). For instance, the extraordinary heavy precipitation event of Zhengzhou on July 20, 2021, of which the daily precipitation exceeded 600 mm, paralyzed the whole city and traffic. In addition, climate change is expected to increase the frequency and intensity of rainfall worldwide (Kendon et al. 2012). Climate projections for the rest of the century show continued intensification of daily precipitation extremes (Donat et al. 2017), and there are expected to be more road disruptions and increased risks in the coming decades (Pregnolato et al. 2017; Koetse and Rietveld 2009).
Road network disruption has been a focus of many studies for the past years. Some studies investigate the impact analysis on the road network after disruptions such as travel time and travel cost (Rosyida et al. 2019), network connectivity and network efficiency (Zhou et al. 2021), etc. Resilience assessment of road networks when disruption occurs has been widely studied. This research mainly focuses on three aspects. One is the road network vulnerability analysis under disruption conditions (Jenelius and Mattsson 2012; Dehghani et al. 2014; Abdulla and Birgisson 2020; Starita and Scaparra 2020; Redzuan et al. 2022). Vulnerability is the system’s susceptibility to disruption (Jenelius et al. 2006). Dehghani et al. (2014) assumed particular road status that disruption probabilities of roads were randomly generated from a uniform distribution. The vulnerability of the network was then assessed by computing the change in performance measures: network efficiency and vehicle miles traveled, before and after the disruption. The system’s vulnerability shows a nonlinear increasing trend with the disruption probability. Papilloud and Keiler (2021) evaluated the vulnerability patterns of road network and identified the most vulnerable traffic zones to 150 flood scenarios based on accessibility measures which include flood-affected populations, opportunities, and average shortest travel time. The second is to assess the robustness of road network (Sohouenou et al. 2021; Jin et al. 2022; Casali and Heinimann 2020; Gauthier et al. 2018). Robustness indicates the system’s ability to absorb disturbance and remain functional (Bruneau et al. 2003). Sohouenou et al. (2021) simulated the localized, targeted, random disruptive events and then evaluated the robustness of road network using robustness indicators: travel time relative change index and unsatisfied demand indicator. The critical index which combines the robustness indicators was also employed to identify the most critical links whose disruptions would cause the most severe disturbance. Jin et al. (2022) developed a bilevel mixed-integer nonlinear problem (MINLP) model for multiple disruption scenarios to identify the critical combination of roads which play a vital role in ensuring the robustness and function of road network. The last is devoted to the evaluation of road network reliability when disruption occurs (Duan et al. 2023; Dong et al. 2023; Jiang and Huang 2022). Reliability of the traffic system is interpreted as the ability to serve a specific number of travelers in a given time interval or under other certain conditions (Iida 1999). Connectivity reliability and travel time reliability are two common measures of road network reliability (Bell and Lida 1997). The former describes the probability of at least one path remaining connected when disruptions occur, and the latter refers to probability that a trip can be completed within an acceptable travel time tolerance (Iida 1999). For example, Jiang and Huang (2022) used a Bayesian network (BN) model to evaluate the connectivity reliability and identify critical units for the highway network of G213 and S9 in the Wenchuan Earthquake. The connectivity probability was calculated using empirical prediction method. Fujita and Wakabayashi (2021) calculated the link reliability of road network in urban areas under the condition of heavy rainfall using a probability density function of depth in flood hazard map, and the probability of exceeding a reference value of depth can be considered as link unreliability.
Most of the preceding research concentrates on road network disruptions caused by floods, earthquakes, landslides or accidents. While road network disruption caused by precipitation has been less investigated. Existing studies related to the influence of precipitation on road focus on the reduction of traffic speed (Chung 2012; Lam et al. 2013; Hooper et al. 2014; Ahmed and Ghasemzadeh 2018), or damage loss to precipitation (Espinet et al. 2018; Zhu et al. 2022). Due to insufficient recorded data, relatively few studies have been performed to construct disruption probability model of road to precipitation, which is a prerequisite for road network reliability analysis. Considering the previous challenges, this study focuses on the empirical evaluation of road network vulnerability and reliability due to disruptions caused by precipitation using the historical recorded data.
In this study, we propose an approach for assessing the reliability of road network to precipitation based on the disruption vulnerability model constructed using the historical recorded data. The road network in Fujian Province, China was selected as a case to validate the proposed framework. The vulnerability model and the framework of reliability assessment would contribute new knowledge to the literature and could be used for reliable performance assessment of road networks in response to precipitation events. The rest of this paper is organized as follows. The Data and Methods section describes the recorded road disruption data, precipitation data, and overall framework of this study, as well as the methods used for developing road disruption vulnerability model and performing road reliability assessment. In the Results section, the developed disruption vulnerability model is presented, and the reliability assessment of road network for two precipitation events is elaborated. The contributions and limitations of this study are illustrated in the Discussion section. Finally, a summary of this study is included in the Conclusion section.
Data and Methods: Data
Road Disruption Data
The recorded road disruption data caused by precipitation from 2016 to 2020 in Fujian Province were used in this study. There are a total of 536 disruptions during the investigated periods. Each record includes the road type, date of disruption occurrence, stake mark, cause of disruption, and resources and time needed for recovery. Table 1 gives illustrative examples of typical road disruption data.
| City | Road type | Date of occurrence | Road line | Stake mark | Cause of disruption |
|---|---|---|---|---|---|
| Sanming | Provincial road | June 19, 2017 | S208 | K3+420-460 | Slope collapse |
| Sanming | National road | June 19, 2017 | G205 | K2305+020-050 | Slope collapse |
| Quanzhou | Provincial road | August 29, 2018 | S312 | K0+400-K0+700 | Pounding water |
| Longyan | National road | June 1, 2019 | G205 | K2352+699-K2353+900 | Subgrade subsidence |
| Zhangzhou | National road | November 12, 2019 | G357 | K130+720-K130+800 | Landslide |
| Quanzhou | National road | May 18, 2019 | G355 | K193+250 | Fallen trees |
Note: Stake mark K* + *** represents the distance from the starting point along the road. The number before + is in the unit of km, and the number after + is in the unit of m. For example, K3+400 represents the disruption point is 3,400 m from the starting point.
Fujian Province is located in southeastern China, with mountains and hills accounting for approximately 90% of the total area. The terrain of Fujian is high in the west and north and low in the south and east, and the mean elevation of Fujian is 475 m (Qiu et al. 2013). Fig. 1(a) shows the distribution of the roads and the disruption points in Fujian. The road data were obtained from OpenStreetMap including national roads and provincial roads with a total length of 10,268 km. Fig. 1(a) shows that the disruption points are widely distributed and mainly located in the middle and northern parts of Fujian, where the altitude is relatively high.

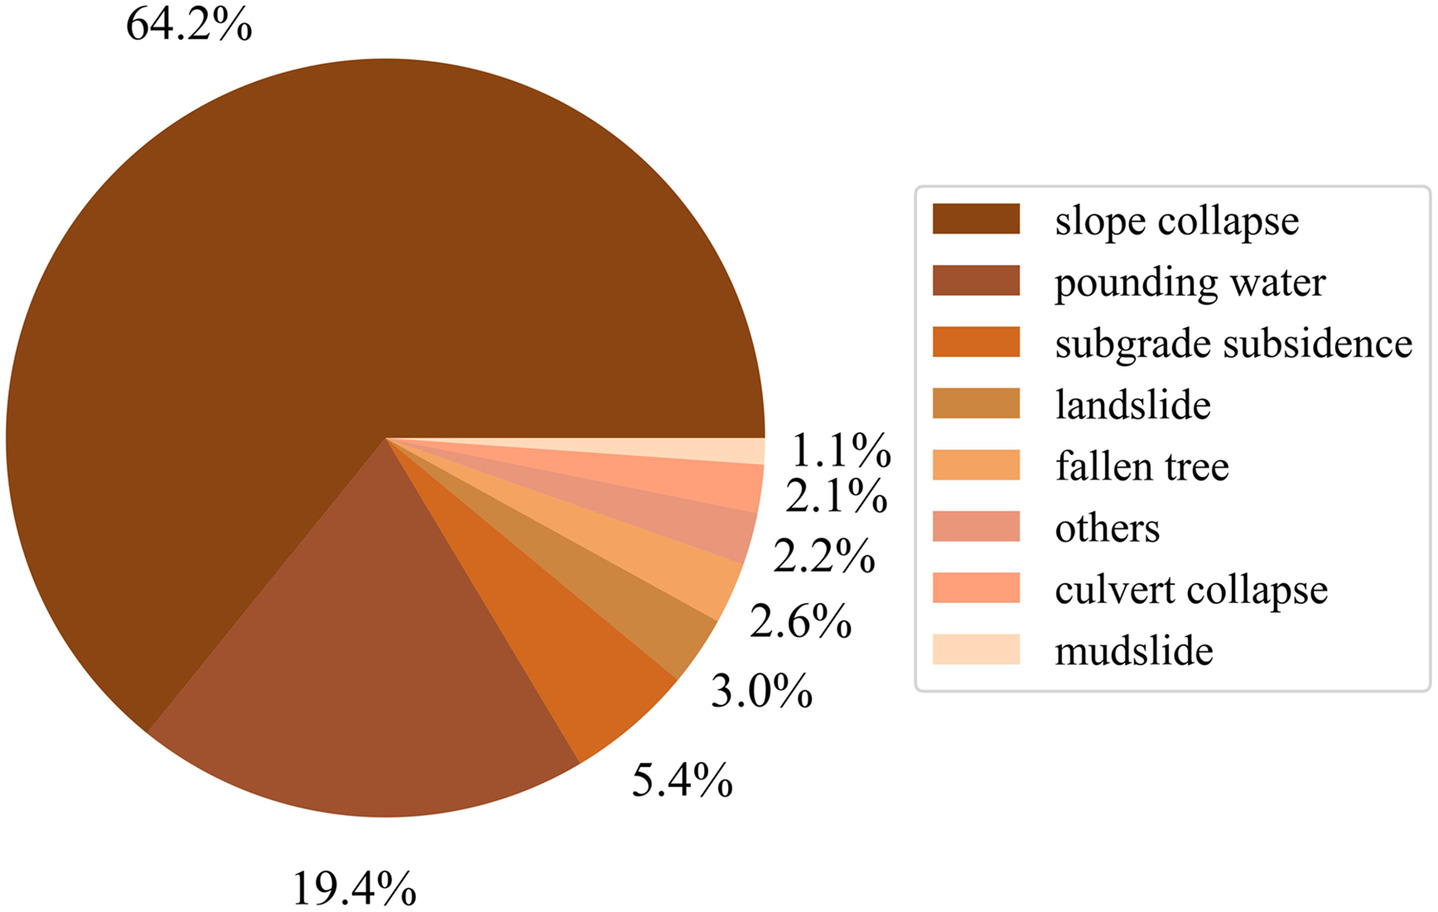
Fig. 2 shows the causes of the disruptions. Slope collapse, pounding water, mudslides, landslides and subgrade subsidence are the main causes of the disruptions. Moreover, culvert damage, mountain cracks, fallen telegraph poles, and fallen rock could also cause road disruptions and affect traffic. Among all the disruptions, slope collapse caused by precipitation accounted for the largest proportion (64.18%), followed by pounding water (19.40%) (Fig. 2).
Precipitation
The daily precipitation data from 2016 to 2020 were obtained from the GPM_3IMERGDL data set with a resolution of (). The GPM mission is an international network of satellites that provides observations of rain and snow initiated by NASA and the Japan Aerospace Exploration Agency (JAXA). Fig. 1(b) shows the annual average cumulative precipitation in May, June, and July during 2016–2020 in Fujian Province. The cumulative precipitation is mainly distributed in the northern region, with an annual average precipitation reaching 750.33 mm.
Methods
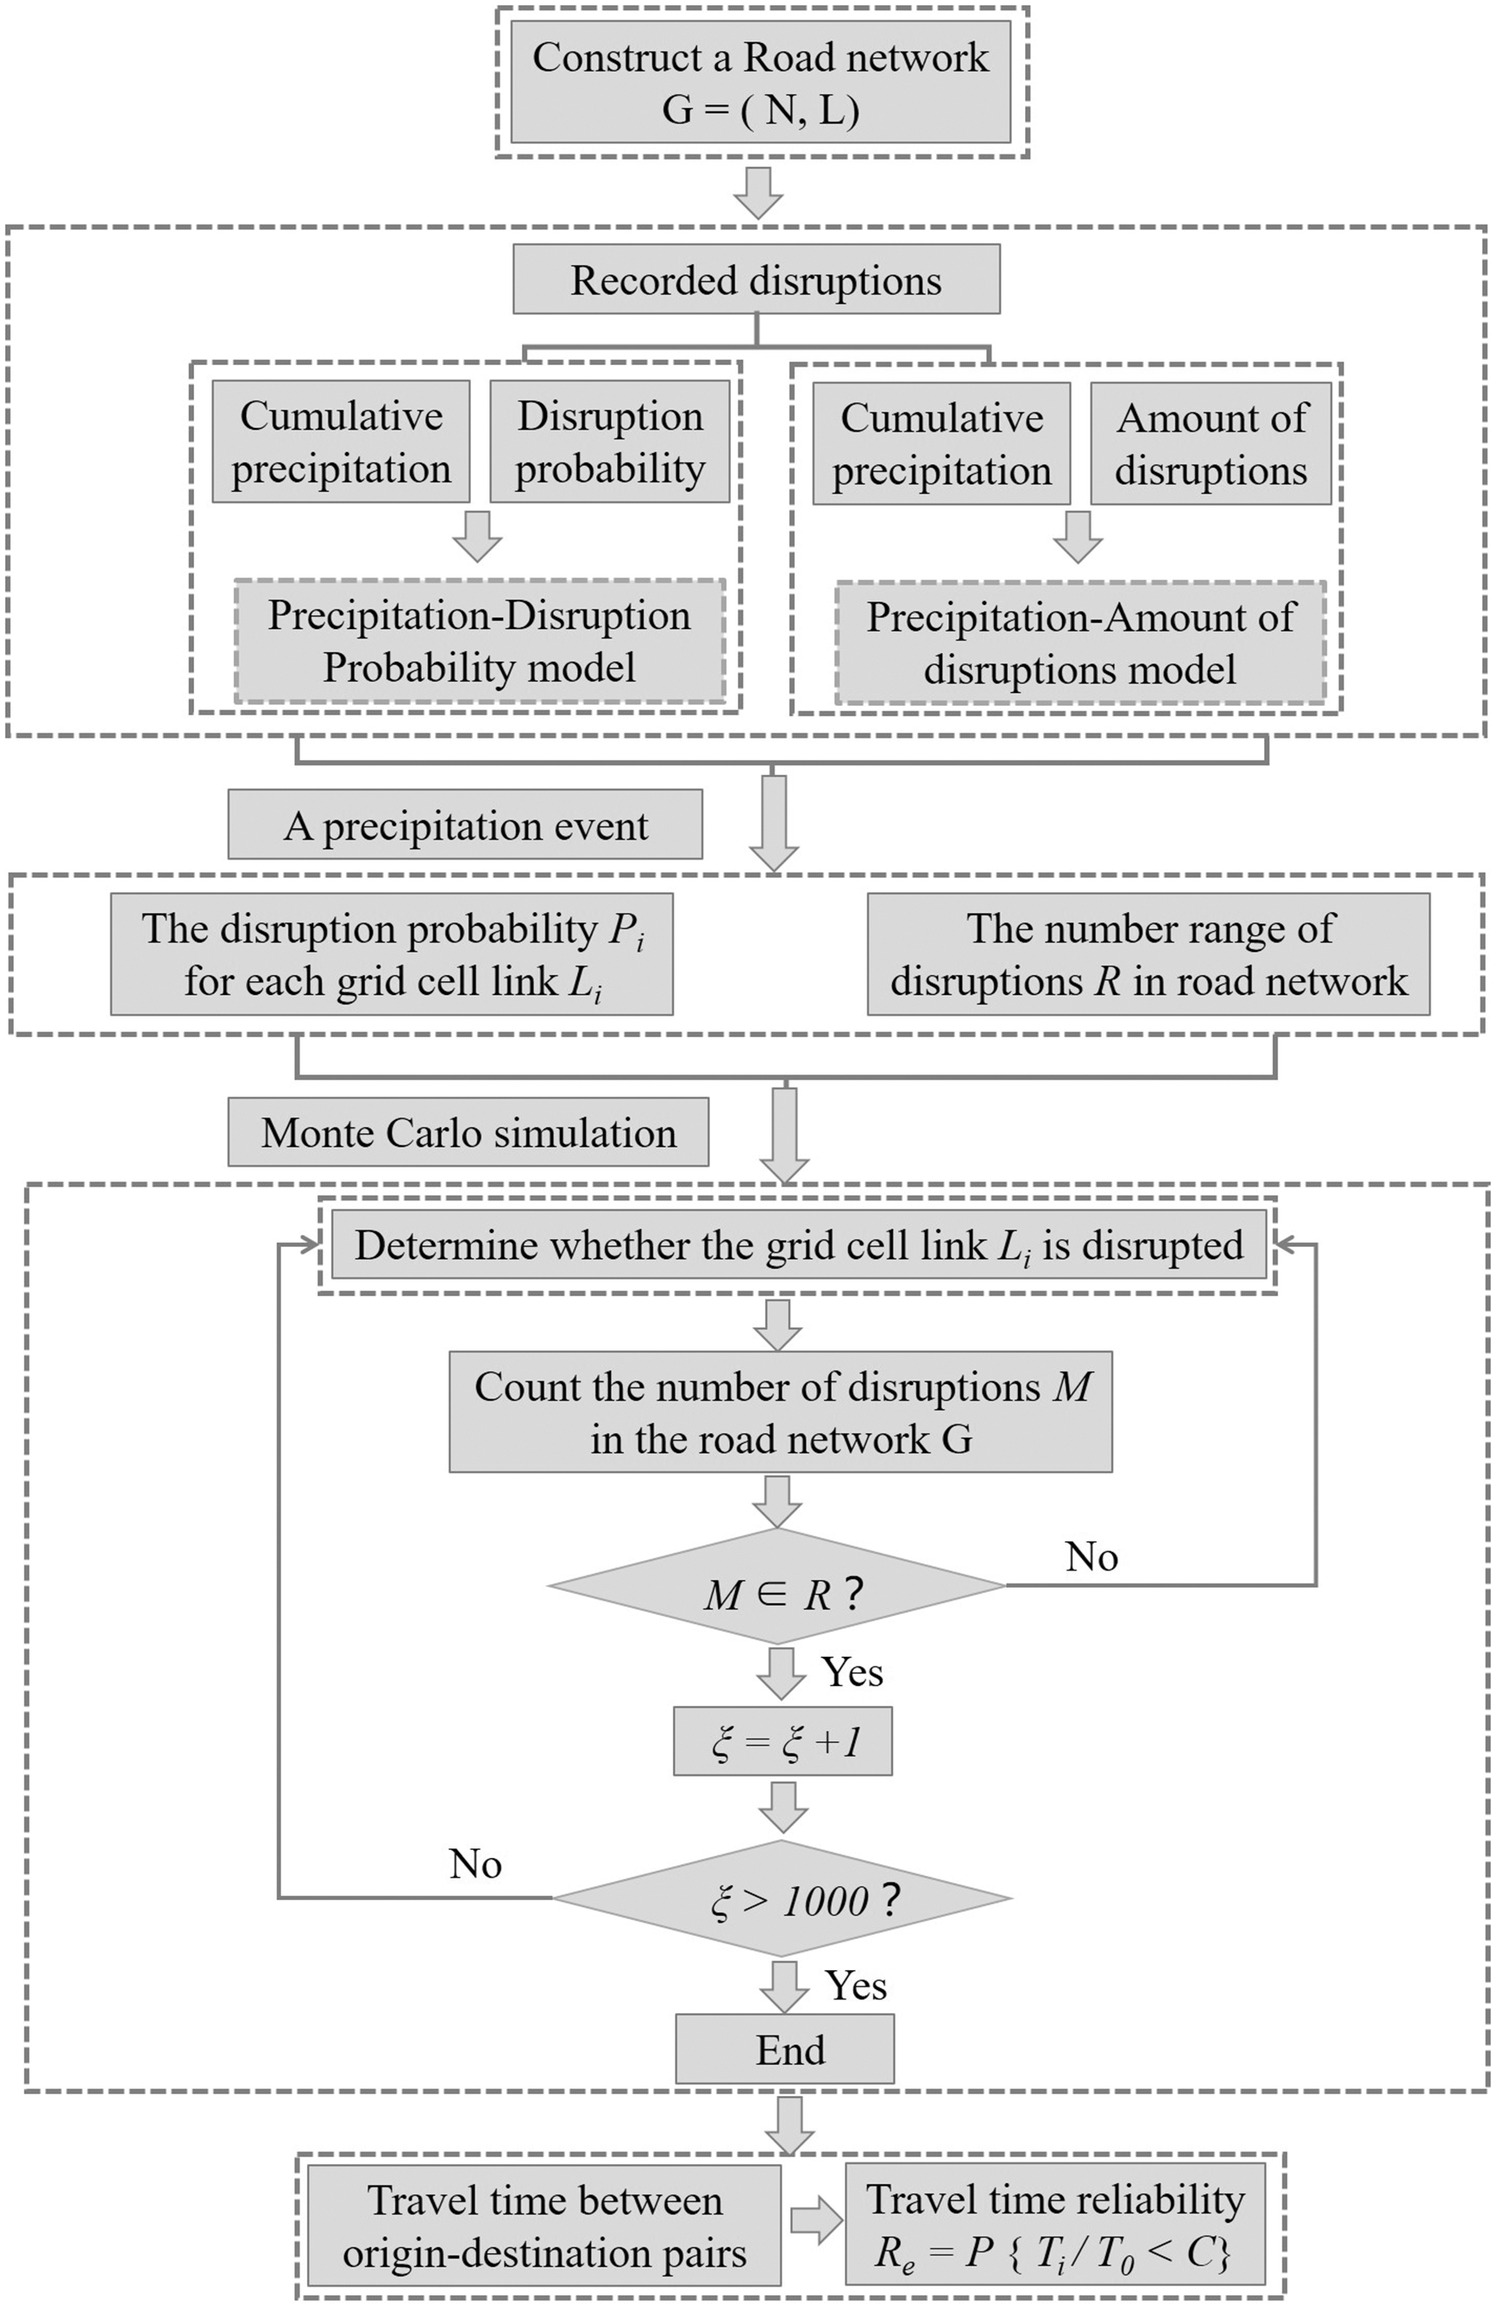
We propose a framework for assessing the reliability of road network to precipitation based on recorded disruptions. The overall framework is shown in Fig. 3. The framework consists of three main components. First, based on recorded disruptions, the vulnerability model of precipitation-disruption probability and precipitation-amount of disruptions were constructed. Then, a Monte Carlo approach was applied to simulate the disruption scenarios of the whole road network for one precipitation event based on the disruption vulnerability model. At last, the travel time reliability was assessed based on the simulated status of road network.
Disruption Vulnerability Model
In this study, the models linking precipitation and the disruption vulnerability of roads were developed to evaluate the impact of precipitation on road disruptions. Based on the 536 recorded disruptions, the vulnerability models of precipitation-disruption probability and precipitation-amount of disruptions were constructed.
Disruption Probability
We first divided the road segments into grid cells. We assigned a value of 1 to grid cells if there is at least one disruption point; otherwise, a value of 0 was assigned. For each disruption event, the cumulative precipitation of three days before disruption for all grid cells was further collected, as roads are often damaged by cumulative precipitation. In this way, the data set of cumulative precipitation of three days and corresponding disruption state of all grid cells was got.
The disruption probability is calculated based on Eq. (1)where = road disruption probability at the given cumulative precipitation interval (CPI). For a given cumulative precipitation interval, and = number of disrupted grid cells and total number of grid cells, respectively.
(1)
Model Fitting and Uncertainty
The disruption vulnerability model was developed using a data set of precipitation and disruption information. The least squares (LS) method, a mathematical method often used to numerically estimate a relationship between variables using sample data, was utilized for model fitting (Ezell and Land 2005; Griva et al. 2009).
To evaluate the uncertainty of the fitted model, the 99% confidence interval was selected to express the uncertainty. For the fitted model, the 99% confidence interval was calculated based on Eqs. (2)–(4)where = confidence interval limit, = lower limit of the 99% confidence interval, and = upper limit of the 99% confidence interval. for the 99% confidence interval, = standard deviation, = average value of the sample, and = amount of the sample.
(2)
(3)
(4)
Monte Carlo Simulation
Monte Carlo simulation is commonly used for disaster simulation and analysis (Buslenko et al. 1966; Crowley and Bommer 2006). To evaluate the performance of road network under the condition of precipitation, Monte Carlo simulation is employed here to simulate the probable disruption scenarios. The procedure to implement the disruption is shown in Fig. 3.
The detailed algorithm of Monte Carlo simulation is as follows:
Step 1: The road network is represented by G = (N, L), where N (N = 1, 2,…,n) is the set of nodes, L (L = 1, 2,…,l) is the set of links, and then the links are divided into 0.1 degree × 0.1 degree grid cell links .
Step 2: For a precipitation event, the cumulative three-day precipitation of each grid cell are obtained. The vulnerability models of precipitation-disruption probability and precipitation-amount of disruptions are used to calculate the probability of disruption for each grid cell link in the network and the number range of disruptions that may occur in the whole network due to precipitation.
Step 3: For each grid cell link in the network, a Monte Carlo approach is used. The random number is compared with the disruption probability to determine whether the grid cell link is disrupted, with disruptions being recorded as 1 and nondisruptions being recorded as 0.
Step 4: Count the number of disruptions in the road network . If the number of disruptions falls within the range evaluated by Step 2, then the network status is recorded, otherwise, go to Step 3.
Step 5: Step 3 and Step 4 are repeated until 1,000 network status have been recorded and the results of the 1,000 simulations are taken as the possible status of the road network under the precipitation event.
Step 6: End.
Travel Time Reliability
Road disruptions always lead to a significant increase in travel time and reduce the probability of arriving at destination on schedule. Travel time reliability is measured as the probability that the origin-destination connection can be completed in a time less than threshold value (Bell et al. 1999; Jamous and Balijepalli 2018). In this study, we assessed the travel time reliability between cities in Fujian Province which were considered as the origin-destination (O-D) pairs in road network. The travel time reliability is calculated according to Eq. (5)where is the travel time reliability, is the travel time on abnormal network under precipitation, is the travel time on normal network, is the acceptable upper limit. and are calculated by Eq. (6). Under abnormal conditions, the shortest path between origin () and destination () will change.
(5)
The travel time from an origin point to a destination point is expressed as:where is the length of the shortest path from origin () to destination () and is the travel speed. Moreover, the shortest path length is calculated using the Dijkstra algorithm. The Dijkstra algorithm is a typical method to solve the shortest path from one point to other points in a network, and it was proposed by Dijkstra, a computer scientist from Holland, in 1959 (Dijkstra 1959).
(6)
Results
Disruption Vulnerability Models of Fujian Province
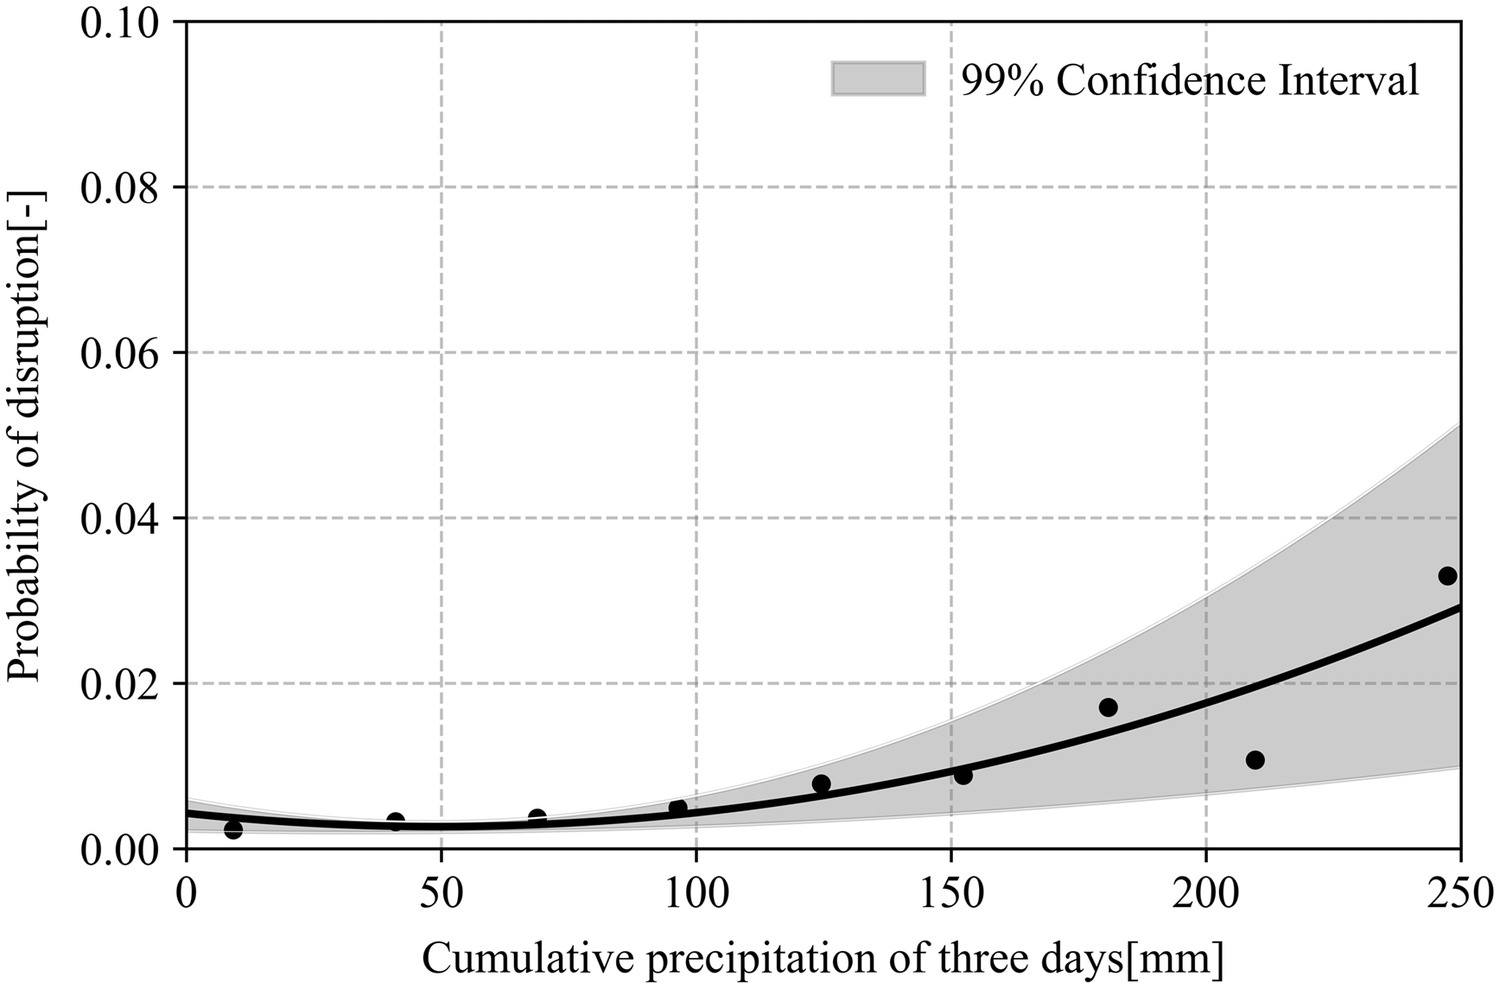
The functions of road disruption vulnerability for different precipitation intensities were established using the least squares (LS) method. Fig. 4 shows the relationship between the cumulative precipitation of three days and the probability of road disruption, as well as the 99% confidence interval of the fitted model. A quadratic function was fitted to describe the probability of road disruption as a function of the cumulative precipitation of three days, which has an value of 0.85. It is evident that with an increase in the cumulative precipitation of three days, the probability of road disruption increases nonlinearly. For example, when the cumulative precipitation of three days of a grid cell increases from 50 mm to 100 mm and then to 200 mm, the probability of disruption increases from 0.0028 to 0.0044 and then to 0.01757, respectively. The function could help evaluate the impact of precipitation on road disruptions and could be used to simulate the status of road network and further facilitate risk assessment.
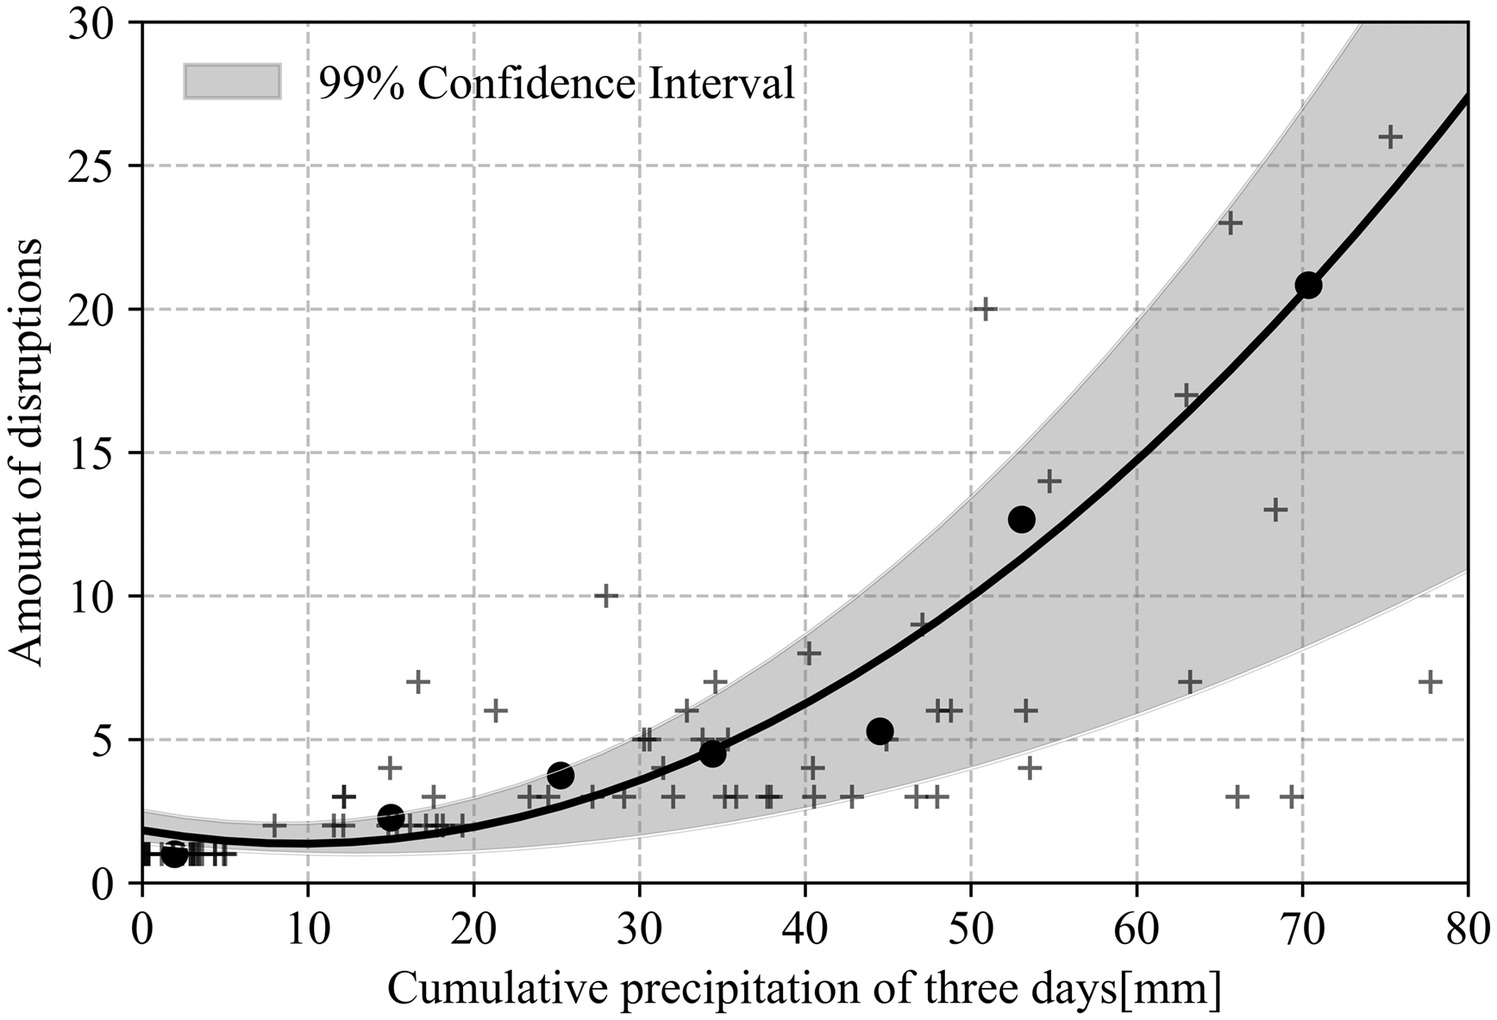
The relationship between the amount of disruptions and the cumulative precipitation of three days was also constructed. We used the segmenting method, which divides the raw data into segments and calculates an average for each segment as a representative value (Tsubaki et al. 2016), to construct the vulnerability model. By using the segmenting method, the cumulative precipitation and the amount of disruptions were averaged according to a certain precipitation interval of 10 mm. The fitted function is shown in Fig. 5. The black dots are the representative value calculated using segmenting method, the ‘+’ symbols are the observed data, the black curve is the function fitted to the black dots, and the gray shaded area is the 99% confidence interval, which demonstrates the uncertainty of the fitted model. As is shown in Fig. 5, with the precipitation increasing, the amount of the disruptions increases nonlinearly. For example, when the cumulative precipitation of three days on road grid cells increases from 15 mm to 30 mm and then to 60 mm, the amount of the disruptions increases from 1–3 to 2–5 and then to 6–20, respectively. The developed model could help quantitatively assess the number of disruptions there will be and thus, preventive and emergency preparedness measures can be taken.
Reliability of Fujian Road Network to Precipitation
Based on the framework we proposed, the reliability of Fujian road network can be assessed for any given precipitation scenario. We selected two precipitation events for illustration. One on May 21, 2021, with the cumulative precipitation of three days reaching 73.32 mm, and the other on May 30, 2021 with the cumulative precipitation of three days reaching 43.82 mm. Fig. 6 shows the spatial distribution of cumulative three-day precipitation of the two events.

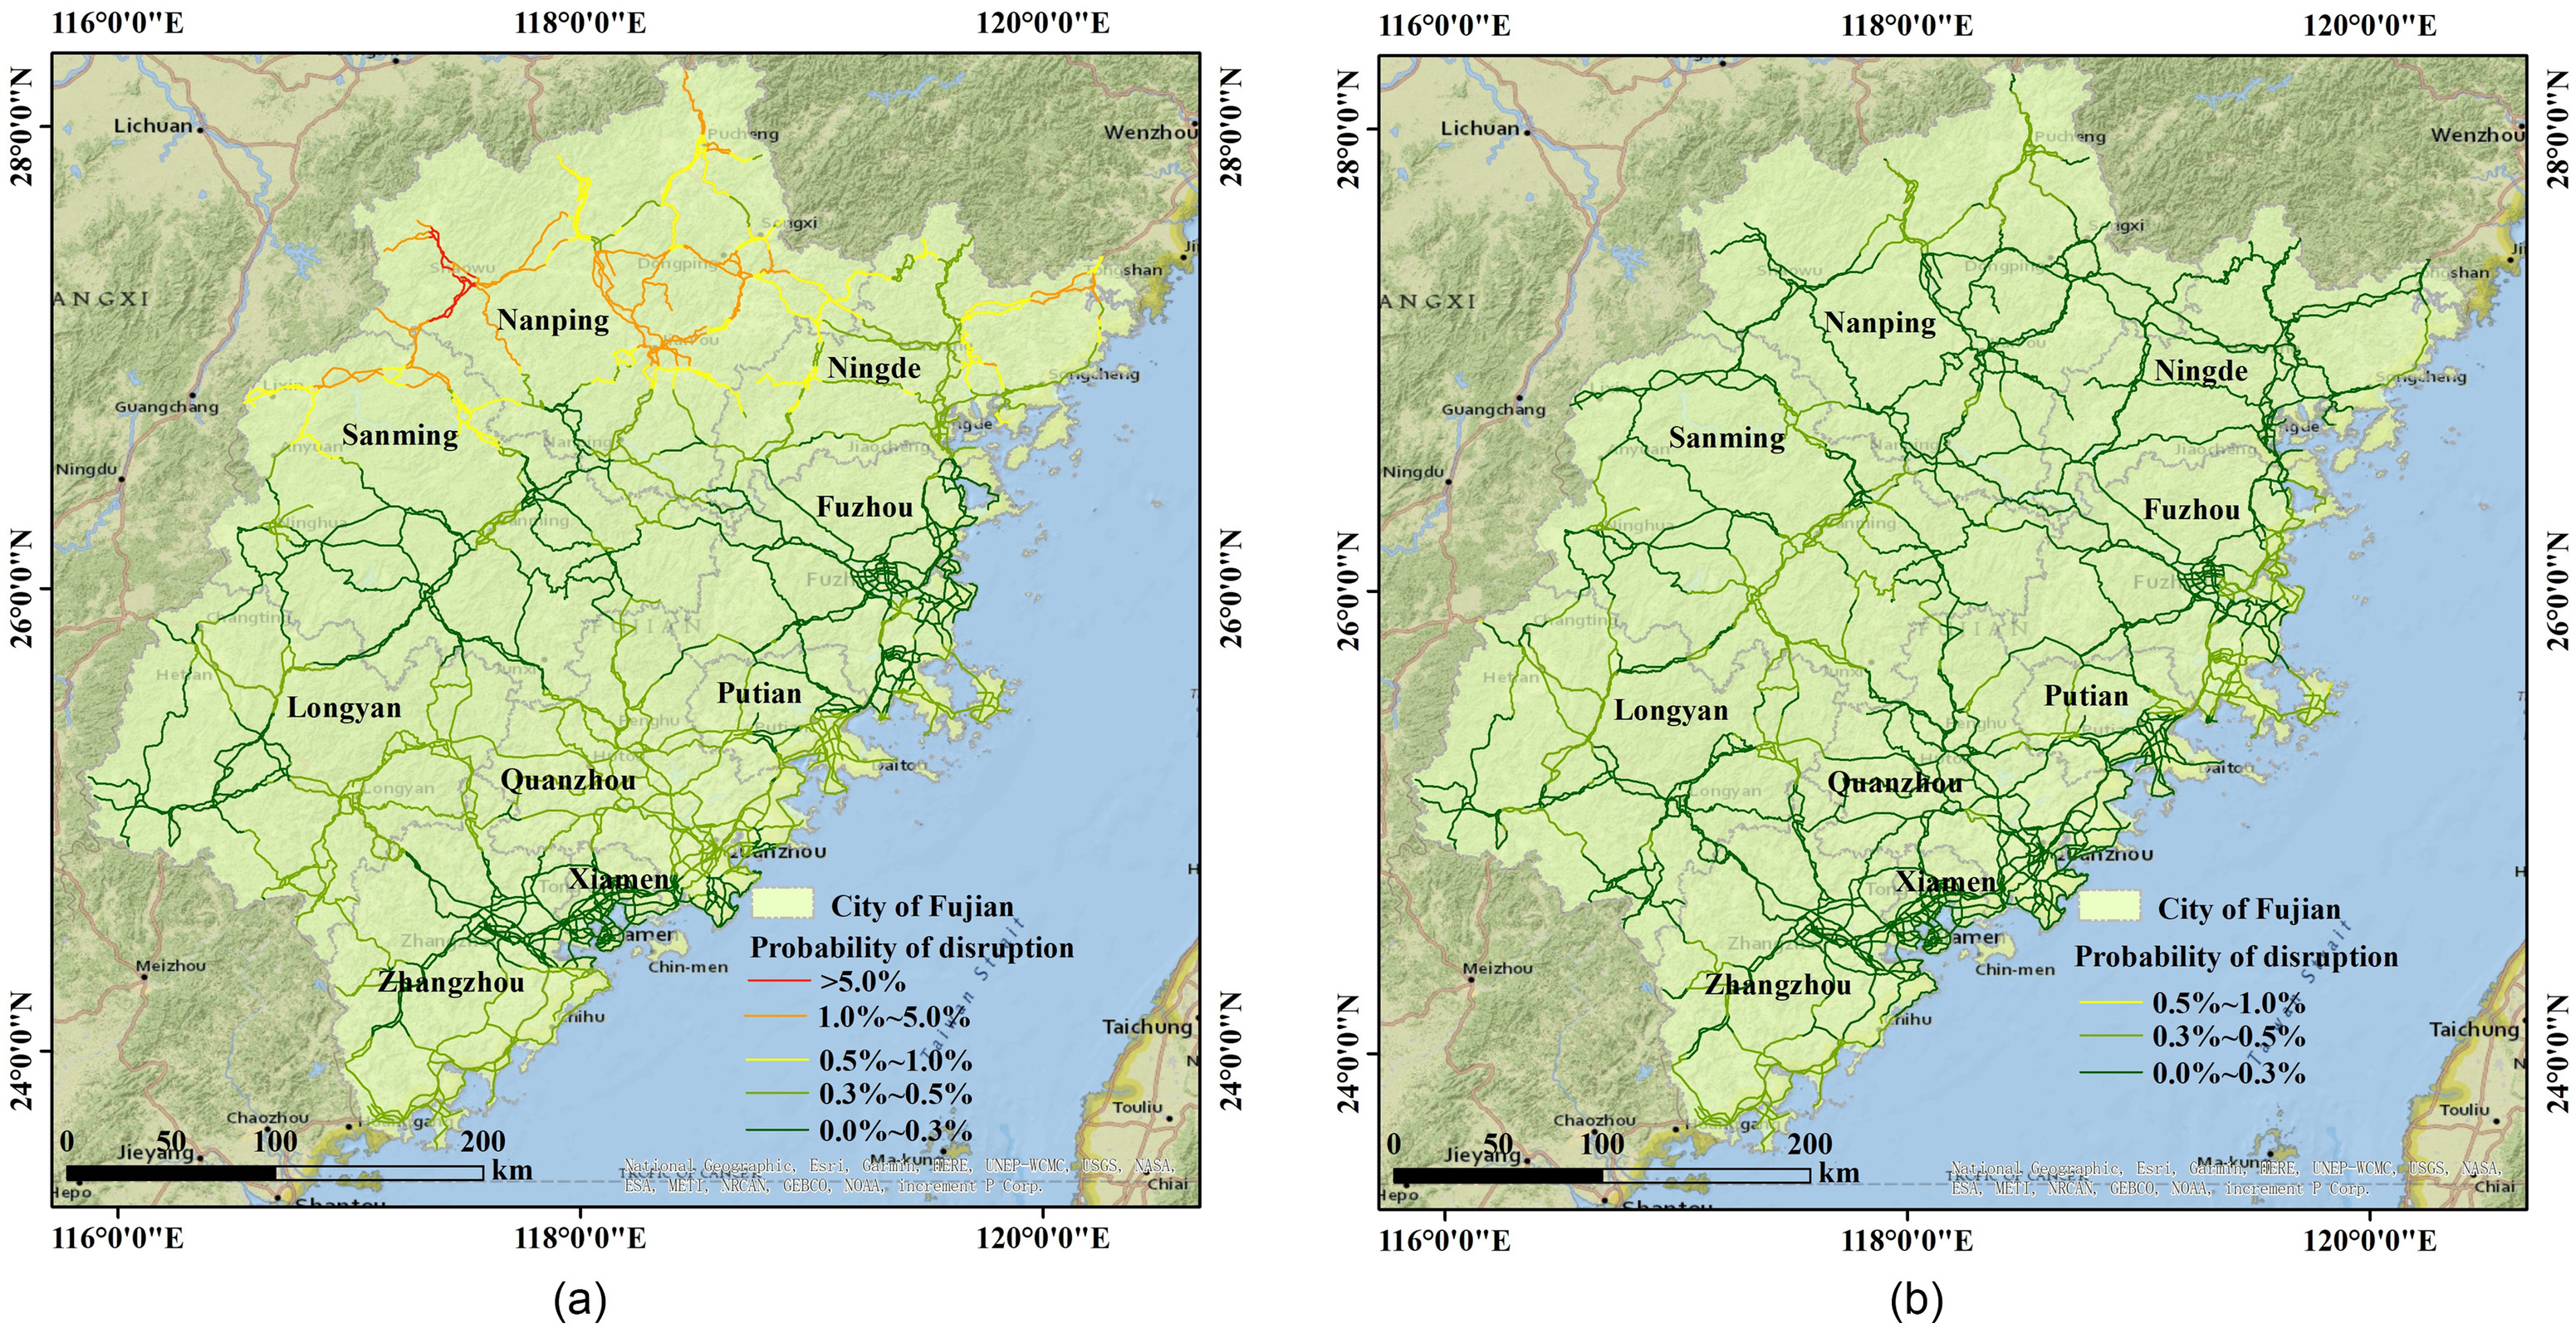
The probabilities of road disruption in Fujian Province under these two precipitation events were assessed based on the developed vulnerability model of precipitation-probability of disruption. Fig. 7 shows the spatial distribution of road disruption probability in Fujian Province on May 21, 2021 and May 30, 2021. The spatial distribution shows a higher disruption probability of road sections on May 21, 2021. On May 21, 2021, road sections with a high probability of disruption are mainly located in the northern part of Fujian Province due to the highest precipitation, where the cumulative three-day precipitation had reached 400 mm and the disruption probability was over 5%. On May 30, 2021, the probability of road disruption in Fujian Province is relatively low. Most of the road sections have a disruption probability in the range of 0.5%–1.0%.
The total amount of disruptions in the whole network were calculated based on the vulnerability model of precipitation-amount of disruptions. Based on the recorded data, the two precipitation events caused nine disruptions on May 21, 2021 and three disruptions on May 30, 2021. By using the developed model, we estimated that approximately 9–29 disruptions and 3–10 disruptions would be caused by the precipitation on May 21, 2021 and May 30, 2021, respectively, indicating a good estimation.
Based on the 1,000 simulations of the road network disruption scenarios under these two precipitation events, the travel time reliability between city O-D pairs was calculated. For each event, the centre of nine cities in Fujian Province was considered as the origin point and destination point. We assumed that the travel speed is in the road network. The acceptable upper limit was set as 1.2 (Jamous and Balijepalli 2018). It means the travel time under the disruption scenario does not exceed over 20% above the normal scenario.
Fig. 8 shows the travel time reliability on May 21, 2021 and May 30, 2021, respectively, with the centre of the nine cities as the origin-destination pairs. As expected, the road network shows a lower reliability in O-D pairs under the precipitation event on May 21, 2021. On May 21, 2021, the travel time reliability between Nanping and Putian was 0.61, which means that there are 390 out of 1,000 simulations leading to an increase in the travel time over 20%, resulting in serious delays in link of Nanping-Putian. Similarly, for Longyan-Zhangzhou and Longyan-Xiamen, where the travel time reliability decreased to 0.73. Other city pairs show less adverse impact to precipitation. On May 30, 2021, the largest decreases occurred in city pair between Longyan-Sanming, which is 0.81, followed by Longyan-Zhangzhou and Longyan-Xiamen with a reliability of 0.83. The travel time reliability between other O-D pairs was larger than 0.9.

Based on the reliability of the two precipitation events, we found that the percentage of city pairs whose travel time reliability decreased to below 0.85 was 11.12% and 8.33% on May 21, 2021 and May 30, 2021, respectively. Moreover, for the city pair of Nanping-Putian, the reliability decreased to 0.61 with the precipitation of 73.32 mm, compared to 0.89 with the precipitation of 43.82 mm. When the road network is disrupted by precipitation, it should be repaired in a timely manner to prevent further deterioration of the road network performance.
Discussion
Heavy precipitation can seriously affect roads, resulting in negative consequences for road services. Under the context of climate change, the road disruption risk is expected to increase due to the continued intensification of precipitation extremes. As an important part of risk and resilience, reliability assessment of the road network to precipitation is indispensable for road authorities to prepare for possible adverse impacts. A framework for assessing the reliability of the road network to precipitation based on historical recorded disruption data was therefore proposed. The framework consists of three main components, the vulnerability model, a Monte Carlo approach, and travel time reliability. The disruption vulnerability model describing the relationship between precipitation intensity and the disruption vulnerability of roads, was first constructed using the recorded data. The validity of the vulnerability model was verified using R squares, 99% confidence interval, and two precipitation events, which showed a good estimation. Based on the disruption vulnerability models, a Monte Carlo approach was used to simulate the probable disruption scenarios of road network for precipitation events. At last, the travel time reliability was assessed based on the simulated status of road network.
There are still some limitations as follows. First, the data set of road disruptions was collected from 2016 to 2020. The function built based on the data set would be robust if more disruption data were included. Moreover, it should be updated when more data sets of recent years are collected. Second, the impact of precipitation on speed reduction of vehicles was not considered in this study since we focus on the disruption of the road network, the dual effect of these two factors should be considered in further studies. Third, the basic data set in this study was collected for Fujian, China. Therefore, the applicability of the estimated model may be limited by the region. More studies can be performed for different regions to develop locally specific functions.
Conclusion
Road network reliability assessment is essential for the management of road networks when considering service failure in network. Our study proposes a framework for assessing the reliability of road network to precipitation based on the disruption records. The vulnerability models of precipitation-disruption probability and precipitation-amount of disruptions show a nonlinear increasing trend with precipitation. Based on the disruption vulnerability models, the reliability of road network of Fujian is assessed by using the Monte Carlo approach. For an event with an average precipitation of 73.32 mm on May 21, 2021, the travel time reliability of 11.12% city O-D pairs in Fujian Province decreased to below 0.85.
To the best of our knowledge, the developed disruption vulnerability models in this study are one of the first findings on road disruption vulnerability to precipitation and thus contribute new knowledge to the literature. More importantly, the proposed framework for assessing the reliability of road network to precipitation based on historical recorded disruptions in this study can serve as a basis for reliable performance and risk assessment of road networks in response to precipitation events.
Data Availability Statement
Some or all data, models, or codes generated or used of this study are available from the corresponding author by request (including the road disruption data, precipitation data, disruption vulnerability model and the Python codes for data processing, model fitting).
Acknowledgments
The research for this article was supported by the Major Program of National Natural Science Foundation of China (No. 72091512). The financial support is highly appreciated.
Author contributions: Kai Liu proposed the original idea and designed the analyses. Kai Liu, Ningning Qiao, Ming Wang, Xiaoyong Ni, and Yongsheng Yang contributed to the study design, data collection and methodology. Kai Liu, and Ningning Qiao conducted the analysis. Ningning Qiao, and Kai Liu wrote the original manuscript. All the coauthors contributed to scientific interpretations of the results.
References
Abdulla, B., and B. Birgisson. 2020. “Characterization of vulnerability of road networks to random and nonrandom disruptions using network percolation approach.” J. Comput. Civ. Eng. 35 (1): 04020054. https://doi.org/10.1061/(ASCE)CP.1943-5487.0000938.
Ahmed, M. M., M. Abdel-Aty, and R. Yu. 2012. “Assessment of interaction of crash occurrence, mountainous freeway geometry, real-time weather, and traffic data.” Transp. Res. Rec. 2280 (1): 51–59. https://doi.org/10.3141/2280-06.
Ahmed, M. M., and A. Ghasemzadeh. 2018. “The impacts of heavy rain on speed and headway behaviors: An investigation using the SHRP2 naturalistic driving study data.” Transp. Res. Part C: Emerging Technol. 91 (Jun): 371–384. https://doi.org/10.1016/j.trc.2018.04.012.
Ahmed, M. M., A. Ghasemzadeh, H. Eldeeb, S. Gaweesh, J. Clapp, K. Ksaibati, and R. Young. 2015. Driver performance and behavior in adverse weather conditions: An investigation using the SHRP2 naturalistic driving study data—Phase 1. Laramie, WY: Univ. of Wyoming.
Bell, M. G. H., C. Cassir, Y. Iida, and W. H. K. Lam. 1999. “A sensitivity based approach to network reliability assessment.” In Proc., 14th Int. Symp. on Transportation and Traffic Theory. Tucson, AZ: Univ. of Arizona.
Bell, M. G. H., and Y. Lida. 1997. Transportation network analysis. New York: Wiley.
Bruneau, M., S. E. Chang, R. T. Eguchi, G. C. Lee, T. D. O’Rourke, A. M. Reinhorn, M. Shinozuka, K. Tierney, W. A. Wallace, and D. Von Winterfeldt. 2003. “A framework to quantitatively assess and enhance the seismic resilience of communities.” Earthquake Spectra 19 (4): 733–752. https://doi.org/10.1193/1.1623497.
Buslenko, N. P., D. I. Golenko, I. M. Sobol, and V. G. Sragovich. 1966. “Chapter VII—Transformation of random numbers.” In The Monte Carlo method, edited by Y. A. Shreider, N. P. Buslenko, D. I. Golenko, and I. M. Sobol. Bergama, Turkey: Pergamon.
Casali, Y., and H. R. Heinimann. 2020. “Robustness response of the Zurich road network under different disruption processes.” Comput. Environ. Urban Syst. 81 (May): 101460. https://doi.org/10.1016/j.compenvurbsys.2020.101460.
Chung, Y. 2012. “Assessment of non-recurrent congestion caused by precipitation using archived weather and traffic flow data.” Transp. Policy 19 (1): 167–173. https://doi.org/10.1016/j.tranpol.2011.10.001.
Crowley, H., and J. J. Bommer. 2006. “Modelling seismic hazard in earthquake loss models with spatially distributed exposure.” Bull. Earthquake Eng. 4 (3): 249–273. https://doi.org/10.1007/s10518-006-9009-y.
Dehghani, M. S., G. Flintsch, and S. McNeil. 2014. “Impact of road conditions and disruption uncertainties on network vulnerability.” J. Infrastruct. Syst. 20 (3): 04014015. https://doi.org/10.1061/(ASCE)IS.1943-555X.0000205.
Dijkstra, E. W. 1959. “A note on two problems in connexion with graphs.” Numer. Math. 1 (1): 269–271. https://doi.org/10.1007/BF01386390.
Donat, M. G., A. L. Lowry, L. V. Alexander, P. A. O’Gorman, and N. Maher. 2017. “More extreme precipitation in the world’s dry and wet regions.” Nat. Clim. Change 6 (5): 508–513. https://doi.org/10.1038/nclimate2941.
Dong, S., X. Gao, A. Mostafavi, J. Gao, and U. Gangwal. 2023. “Characterizing resilience of flood-disrupted dynamic transportation network through the lens of link reliability and stability.” Reliab. Eng. Syst. Saf. 232 (Apr): 109071. https://doi.org/10.1016/j.ress.2022.109071.
Donnell, E. T., and J. M. Mason Jr. 2004. “Predicting the severity of median-related crashes in Pennsylvania by using logistic regression.” In Statistical methods and safety data analysis and evaluation, 55–63. Washington, DC: Transportation Research Record. https://doi.org/10.3141/1897-08.
Duan, J., D. Li, and H.-J. Huang. 2023. “Reliability of the traffic network against cascading failures with individuals acting independently or collectively.” Transp. Res. Part C: Emerging Technol. 147 (Feb): 104017. https://doi.org/10.1016/j.trc.2023.104017.
Espinet, X., J. Rozenberg, K. Rao, and S. Ogita. 2018. Piloting the use of network analysis and decision-making under uncertainty in transport operations: Preparation and appraisal of a rural roads project in Mozambique under changing flood risk and other deep uncertainties. Washington, DC: World Bank Group.
Ezell, M. E., and K. C. Land. 2005. “Ordinary least squares (OLS).” In Encyclopedia of social measurement, edited by K. Kempf-Leonard. New York: Elsevier.
Fujita, M., and H. Wakabayashi. 2021. “Estimation of link reliability under natural disaster environment.” Transp. Res. Procedia 52 (Jan): 597–604. https://doi.org/10.1016/j.trpro.2021.01.071.
Gauthier, P., A. Furno, and N. E. El Faouzi. 2018. “Road network resilience: How to identify critical links subject to day-to-day disruptions.” Transp. Res. Rec. 2672 (1): 54–65. https://doi.org/10.1177/0361198118792115.
Gori, A., I. Gidaris, J. R. Elliott, J. Padgett, K. Loughran, P. Bedient, P. Panakkal, and A. Juan. 2020. “Accessibility and recovery assessment of Houston’s roadway network due to fluvial flooding during Hurricane Harvey.” Nat. Hazard. Rev. 21 (2): 04020005. https://doi.org/10.1061/(ASCE)NH.1527-6996.0000355.
Griva, I., S. G. Nash, and A. Sofer. 2009. Linear and nonlinear optimization. 2nd ed. Philadelphia: Society for Industrial and Applied Mathematics.
Hassan, S. A., H. A. Amlan, N. E. Alias, M. A. Abd Kadir, and N. S. A. Sukor. 2022. “Vulnerability of road transportation networks under natural hazards: A bibliometric analysis and review.” Int. J. Disaster Risk Reduct. 83 (Nov): 103393. https://doi.org/10.1016/j.ijdrr.2022.103393.
Hooper, E., L. Chapman, and A. Quinn. 2014. “Investigating the impact of precipitation on vehicle speeds on UK motorways.” Meteorol. Appl. 21 (2): 194–201. https://doi.org/10.1002/met.1348.
Iida, Y. 1999. “Basic concepts and future directions of road network reliability analysis.” J. Adv. Transp. 33 (2): 125–134. https://doi.org/10.1002/atr.5670330203.
Jamous, W., and C. Balijepalli. 2018. “Assessing travel time reliability implications due to roadworks on private vehicles and public transport services in urban road networks.” J. Traffic Transp. Eng. 5 (4): 296–308. https://doi.org/10.1016/j.jtte.2017.09.003.
Jenelius, E., and L. G. Mattsson. 2012. “Road network vulnerability analysis of area-covering disruptions: A grid-based approach with case study.” Transp. Res. Part A: Policy Pract. 46 (5): 746–760. https://doi.org/10.1016/j.tra.2012.02.003.
Jenelius, E., T. Petersen, and L.-G. Mattsson. 2006. “Importance and exposure in road network vulnerability analysis.” Transp. Res. Part A: Policy Pract. 40 (7): 537–560. https://doi.org/10.1016/j.tra.2005.11.003.
Jiang, L., and S. Huang. 2022. “Analyzing connectivity reliability and critical units for highway networks in high-intensity seismic region using Bayesian network.” J. Infrastruct. Intell. Resilience 1 (2): 100006. https://doi.org/10.1016/j.iintel.2022.100006.
Jin, K., W. Wang, X. Li, X. Hua, S. Chen, and S. Qin. 2022. “Identifying the critical road combination in urban roads network under multiple disruption scenarios.” Physica A 607 (Dec): 128192. https://doi.org/10.1016/j.physa.2022.128192.
Kendon, E. J., N. M. Roberts, C. A. Senior, and M. J. Roberts. 2012. “Realism of rainfall in a very high-resolution regional climate model.” J. Clim. 25 (17): 5791–5806. https://doi.org/10.1175/JCLI-D-11-00562.1.
Koetse, M. J., and P. Rietveld. 2009. “The impact of climate change and weather on transport: An overview of empirical findings.” Transp. Res. Part D: Transp. Environ. 14 (3): 205–221. https://doi.org/10.1016/j.trd.2008.12.004.
Lam, W. H. K., M. L. Tam, X. Cao, and X. Li. 2013. “Modeling the effects of rainfall intensity on traffic speed, flow, and density relationships for urban roads.” J. Transp. Eng. 139 (7): 758–770. https://doi.org/10.1061/(ASCE)TE.1943-5436.0000544.
Nowell, H. K., M. W. Horner, and M. J. Widener. 2014. “Impacts of disrupted road networks in siting relief facility locations: Case study for Leon County, Florida.” Nat. Hazard. Rev. 16 (3): 04014032. https://doi.org/10.1061/(ASCE)NH.1527-6996.0000168.
Papilloud, T., and M. Keiler. 2021. “Vulnerability patterns of road network to extreme floods based on accessibility measures.” Transp. Res. Part D: Transp. Environ. 100 (Nov): 103045. https://doi.org/10.1016/j.trd.2021.103045.
Peterson, T., M. McGuirk, T. Houston, A. Horvitz, and M. Wehner. 2008. Climate variability and change with implications for transportation. New York: American Institute of Chemical Engineers.
Pregnolato, M., A. Ford, V. Glenis, S. Wilkinson, and R. Dawson. 2017. “Impact of climate change on disruption to urban transport networks from pluvial flooding.” J. Infrastruct. Syst. 23 (4): 04017015. https://doi.org/10.1061/(ASCE)IS.1943-555X.0000372.
Qiu, B., M. Zhong, Z. Tang, and C. Chen. 2013. “Spatiotemporal variability of vegetation phenology with reference to altitude and climate in the subtropical mountain and hill region, China.” Chin. Sci. Bull. 58 (23): 2883–2892. https://doi.org/10.1007/s11434-013-5847-6.
Redzuan, A. A. H., R. Zakaria, E. Aminudin, and N. Yusof. 2022. “Road network vulnerability based on diversion routes to reconnect disrupted road segments.” Sustainability 14 (4): 2244. https://doi.org/10.3390/su14042244.
Rosyida, E., B. Santosa, and N. Pujawan. 2019. “Combinational disruptions impact analysis in road freight transportation network.” AIP Conf. Proc. 2097 (1): 030103. https://doi.org/10.1063/1.5098278.
Sohouenou, P. Y., L. A. Neves, P. Christidis, and D. L. Presti. 2021. “Using a hazard-independent approach to understand road-network robustness to multiple disruption scenarios.” Transp. Res. Part D: Transp. Environ. 93 (Apr): 102672. https://doi.org/10.1016/j.trd.2020.102672.
Starita, S., and M. Scaparra. 2020. “Assessing road network vulnerability: A user equilibrium interdiction model.” J. Oper. Res. Soc. 72 (7): 1–16. https://doi.org/10.1080/01605682.2020.1740621.
Tsubaki, R., J. Bricker, K. Ichii, and Y. Kawahara. 2016. “Development of fragility curves for railway embankment and ballast scour due to overtopping flood flow.” Nat. Hazards Earth Syst. Sci. 16 (12): 2455–2472. https://doi.org/10.5194/nhess-16-2455-2016.
Zhou, Y., S. Li, and J. Wang. 2021. “Modeling stochastic behavior of road networks with disruptions using percolation theory.” IEEE Trans. Intell. Transp. Syst. 23 (8): 13230–13241. https://doi.org/10.1109/TITS.2021.3122459.
Zhu, J., K. Liu, M. Wang, W. Xu, M. Liu, and J. Zheng. 2022. “An empirical approach for developing functions for the vulnerability of roads to tropical cyclones.” Transp. Res. Part D: Transp. Environ. 102 (Jan): 103136. https://doi.org/10.1016/j.trd.2021.103136.
Information & Authors
Information
Published In

Natural Hazards Review
Volume 24 • Issue 4 • November 2023
Copyright
This work is made available under the terms of the Creative Commons Attribution 4.0 International license, https://creativecommons.org/licenses/by/4.0/.
History
Received: Aug 7, 2022
Accepted: May 15, 2023
Published online: Aug 10, 2023
Published in print: Nov 1, 2023
Discussion open until: Jan 10, 2024
ASCE Technical Topics:
- Analysis (by type)
- Business management
- Climates
- Economic factors
- Engineering fundamentals
- Environmental engineering
- Failure analysis
- Highway and road management
- Highway transportation
- Highways and roads
- Infrastructure
- Infrastructure vulnerability
- Mathematics
- Meteorology
- Practice and Profession
- Precipitation
- Probability
- Social factors
- Traffic engineering
- Transportation engineering
- Travel time
Authors
Metrics & Citations
Metrics
Citations
Download citation
If you have the appropriate software installed, you can download article citation data to the citation manager of your choice. Simply select your manager software from the list below and click Download.