Evaluating Statewide Wastewater Affordability for Users of Sewer Systems and Onsite Wastewater Treatment Systems Based on Household Incomes at the Census Tract Level
Publication: Journal of Water Resources Planning and Management
Volume 150, Issue 10
Abstract
Wastewater affordability is a pressing concern in the US as the cost of collecting and treating wastewater continues to rise rapidly, and reports have revealed that millions of residents are experiencing a lack of equitable access to affordable wastewater management. The USEPA has established an affordability metric based on 2.5% of median household income (MHI) and affordability is typically interpreted as the monthly utility bill. However, this approach is not applicable to the 25% of US households that are not connected to networked sewer. This study developed the first statewide methodology for mapping wastewater affordability for users of both networked and onsite wastewater treatment systems (OWTS) based on USEPA guidelines. The methodology used local data from the Alabama Department of Environmental Management (ADEM), utilities, and the US Census Bureau. This article presents a novel methodology for quantifying water and wastewater affordability challenges for large geographical areas while maintaining the accuracy of small-spatial scale analysis. This study also incorporated income inequalities by using census tract-level household income data to estimate the number of households in Alabama with unaffordable wastewater access. This study revealed that wastewater access affordability challenges are more widespread than indicated by traditional MHI-based analysis and are likely affecting approximately 445,000 households in Alabama (23.7%). This study also showed that expansions in the available funding and types of eligible applicants for grant programs that subsidize OWTS capital costs could reduce OWTS affordability challenges eightfold. We propose using this methodology to quantify affordability challenges alongside a suite of approaches to address wastewater affordability in the US at the utility and household levels to preserve the human right to affordable sanitation.
Practical Applications
Wastewater affordability is a key aspect of providing sustainable wastewater collection and treatment for US residents. The ongoing discussions about wastewater access affordability are often centered around customers of sewer utilities and neglect to consider the affordability challenges of residents with OWTS (commonly known as septic tank systems). This study develops a methodology for analyzing statewide wastewater access affordability for both residents with sewer bills and users of OWTS based on annual household incomes at the census tract level. This study reveals that wastewater affordability challenges affect both users of centralized sewer networks and OWTS including approximately 445,000 households in Alabama (23.7%).
Introduction
The United Nations has declared it a human right to affordable water (Martins et al. 2016; UN Committee on Economic Social and Cultural Rights 2003; United Nations Press 2010). The term affordability broadly refers to customers’ ability to pay their water bill without “undue hardship” (WEF 2022). Affordability allows all consumers, but especially low-income consumers, to continue to meet basic health needs, like healthcare or food, while paying for essential services like water and wastewater (Rothstein et al. 2021; WEF 2022). Globally, water and wastewater affordability have been at the forefront of research and policy discussions, but the focus of most water affordability research has been on the poorest regions of the world (Wescoat et al. 2007). Although some studies analyzing water and wastewater affordability in the US and other high-income countries have been published (Van Abs et al. 2022; AWWA 2019; Belzer 2020; Cardoso and Wichman 2022; Mack and Wrase 2017; Martins et al. 2016; Patterson and Doyle 2021; Raucher et al. 2019; Teodoro 2018; Teodoro and Saywitz 2020; Wescoat et al. 2007), most of the focus has been on drinking water, with lesser focus on wastewater.
In high-income countries, wastewater affordability discussions have typically focused on the monthly sewer bill as a percentage of household income, neglecting the up-front costs of connection fees. Additionally, to the best of our knowledge, no published studies of wastewater affordability in the US included the approximately 25% of households that rely on onsite wastewater treatment systems (OWTS) (e.g., a septic system) (Maxcy-Brown et al. 2023b; USEPA 2005). Households that are not connected to networked sewer systems are responsible for managing their wastewater with OWTS, which includes the responsibility for associated capital costs and maintenance costs for these systems (Maxcy-Brown et al. 2023a); these households do not receive a monthly bill. Residents without sewer typically live in rural areas, and poverty is more common in rural counties (Maxcy-Brown et al. 2023a; US Census Bureau 2018). In 2021, the USEPA found that 52% of households using OWTS had annual incomes less than or equal to the national median household income (MHI) (USEPA 2021). Another study found that over 30% of new homes built between 2015 and 2018 in the US had OWTS (National Environmental Services Center 2021), indicating an increase in the usage of OWTS.
Previous affordability studies have focused on capturing water and wastewater affordability based on a variety of metrics including MHI, utility rates, access to complete plumbing, poverty rates, and minimum wage (Table S1 ) (Mack and Wrase 2017; Teodoro 2018; Teodoro and Saywitz 2020; Wescoat et al. 2007). These studies have focused on affordability at the national scale, which introduces a few key limitations: (1) difficulties fully capturing the variability of utility rates (within and across utilities) and financial situations (e.g., cost of living and MHI), (2) sampling errors in the few nationwide data sets, and (3) the exclusion of residents who do not have utility bills (e.g., users of private drinking water wells or OWTS) (Mack and Wrase 2017; Patterson and Doyle 2021; Teodoro 2018; Teodoro and Saywitz 2020; Wescoat et al. 2007).
The objectives of this study were to (1) develop a novel methodology for analyzing household-level wastewater affordability that includes both sewered homes and those on OWTS and (2) apply that methodology in Alabama by leveraging USEPA affordability criteria and publicly available data sets to establish the first statewide estimate of wastewater affordability that includes both centralized and decentralized wastewater access. This novel methodology arguably provides a more comprehensive evaluation of wastewater affordability than others in the published literature. It can be applied to wastewater and drinking water affordability throughout the US, supporting efforts to establish equitable access to drinking water and wastewater for every resident, and can also be directly applied to proposed federal or state legislation to evaluate the potential impact on affordability.
Background
Average annual increases in the cost of water supply and sewer services from 1996 to 2018 were roughly 5% per year, which is more than the average 2.1% inflation over the same period (AWWA 2019; Bunch et al. 2017; Patterson and Doyle 2021). This rapid increase is projected to continue because large investments are needed to repair and replace the aging distribution and collection infrastructure that was originally built in the early twentieth century, post-World War II era, or the Clean Water Act construction boom during 1970s (Montag 2019). The USEPA estimates that at least $35 billion must be invested annually for 20 years to bring the current water, wastewater, and stormwater infrastructure into compliance with applicable regulations (Lakhani 2020). In the 2019 American Water Works Association (AWWA) Water and Wastewater Rate Survey, wastewater bills were found to have increased from 0.64% to 0.99% of a household’s income between 2006 and 2018 (AWWA 2019).
In the 1996 Safe Drinking Water Act (SDWA) amendment, the US Congress mandated affordability as a policy goal, urging the USEPA to work with states to establish affordability criteria, but without specifically defining affordability (Belzer 2020; USEPA Science Advisory Board 1998). The USEPA’s post-SDWA 1996 affordability metric is incorporated into the utility’s financial capability assessment by established a simple approach that relies on MHI with 2.5% as the upper bound of drinking water affordability for the national MHI (Belzer 2020; Stratus Consulting 2013; USEPA 1998, 2022d). In developing this affordability metric, the key considerations were the cost burden on households, potential financial effects of implementing new technology, and impacts of different utility characteristics (more specifics are given in the Supplemental Materials) (USEPA Science Advisory Board 1998).
In 2023, the USEPA released new Clean Water Act (CWA) Financial Capability Assessment (FCA) Guidance (USEPA 2023a), which builds upon its 1997 Combined Sewer Overflows FCA Guidance (USEPA 1997) and 2014 FCA Framework for Municipal CWA Requirements (USEPA 2014) to standardize the methodology for determining financial capabilities for implementing control mechanisms (USEPA 2022a, c). The USEPA has not specifically defined a wastewater affordability threshold, but many studies use these USEPA reports on guidance for financial capability assessment related to the control of combined sewer overflows (Stratus Consulting 2013; USEPA 1997) to state that 2.0% of the MHI is considered affordable for wastewater and some combine that with the 2.5% of MHI for drinking water for an overall threshold of 4.5% for water and wastewater affordability (AWWA 2019; Stratus Consulting 2013; Teodoro 2018; Teodoro and Saywitz 2020; USEPA 1997).
One key challenge for uniform national affordability thresholds is the inability to provide distinctions for system variability based on utility size or geographical region (Belzer 2020). The current affordability metric tends to favor large utilities because of the strong economies of scale for water systems, which make the recurring costs higher for households served by smaller utilities (Belzer 2020). Low-income households have disproportionately higher water and sewer bills relative to their income, which is often not reflected in the current approach that uses MHI, especially in service areas with high income inequality (Mack and Wrase 2017; Teodoro 2018).
Methodology
Our methodology for determining household-level wastewater affordability is based on utility rates, OWTS costs, household incomes, and the USEPA benchmarks of community financial capacity that are used for regulatory compliance. The USEPA drinking water affordability threshold (2.5% of MHI) was used to assess wastewater affordability because many sewer utilities base wastewater bills on water consumption, and there are few combined sewers in Alabama, making the 2.0% threshold not directly relevant. To prevent populations affected by equity challenges from becoming neglected in the analysis (Mack and Wrase 2017; Roller et al. 2019), this study used census tracts and boundaries for incorporated areas (municipalities), census-designated places (CDPs), and a federally recognized reservation. The 2019 Census Tracts Shapefile for Alabama (US Census Bureau 2021b) was used to build the GIS map because 2019 data were not affected by data collection challenges that have resulted from the COVID-19 pandemic. Shapefiles were obtained from the Alabama Geographic Information Office database to help define utility service areas (Alabama Geographic Information Office 2019, 2022).
Wastewater rates data for this study were primarily gathered from the Environmental Finance Center at the University of North Carolina’s Utility Financial Sustainability and Rates Dashboard (referred to in this study as the UNC Dashboard) (UNC Environmental Finance Center 2019). The sewer rates for Alabama were provided by the Alabama Department of Environmental Management (ADEM) and based on January 2019 data from 222 sewer utilities. Of these, 18 utilities provide only sewer services and 204 utilities provide both water supply and sewer services (UNC Environmental Finance Center 2019). Gap-filling methods were used to obtain a comprehensive data set for utility providers and bill rates across the state covering 262 utilities (with service populations ranging from 90 to 650,700 people) and 471 municipalities, census-designed places, and a federally recognized reservation.
Estimating Water Use
The USGS Water Use Survey for Alabama estimated that an average of 280.1 L (74 gal.) of water per day is used per capita from public supply for domestic purposes “such as drinking, food preparation, bathing, washing clothes, dishes, and dogs, flushing toilets, and watering lawns and gardens” (USGS 2015, 2018). This estimate includes both indoor and outdoor water use. The USEPA has estimated that outdoor water usage accounts for 30% of the nation’s daily household water usage (USEPA 2023c). Other studies have found that higher outdoor water usage is often associated with higher household incomes, larger lot sizes, greater property values, the presence of swimming pools, and landscaped yards (Balling et al. 2008; Barnett et al. 2020; Mini et al. 2014; Potter et al. 2022). Estimated water usage based on public supply for domestic purposes was chosen to reflect the current state of customers’ water usage used for billing rates. Based on the average household size in Alabama (2.6 persons) and UNC Dashboard rate estimates listed in 1,892.7-L (500-gal.) increments (US Census Bureau 2023; UNC Environmental Finance Center 2019), the estimated water use per household is 22,712.5 L (6,000 gal.) per month.
Wastewater Rate Data Collection
The process for collecting the wastewater rate data involved matching utility sewer rate data from the UNC Dashboard with municipalities (incorporated areas) and other data sources to fill in data for unmatched municipalities (Fig. 1). There were five CDPs and one federally recognized reservation added to the analysis when identified within the service area of a sewer utility.
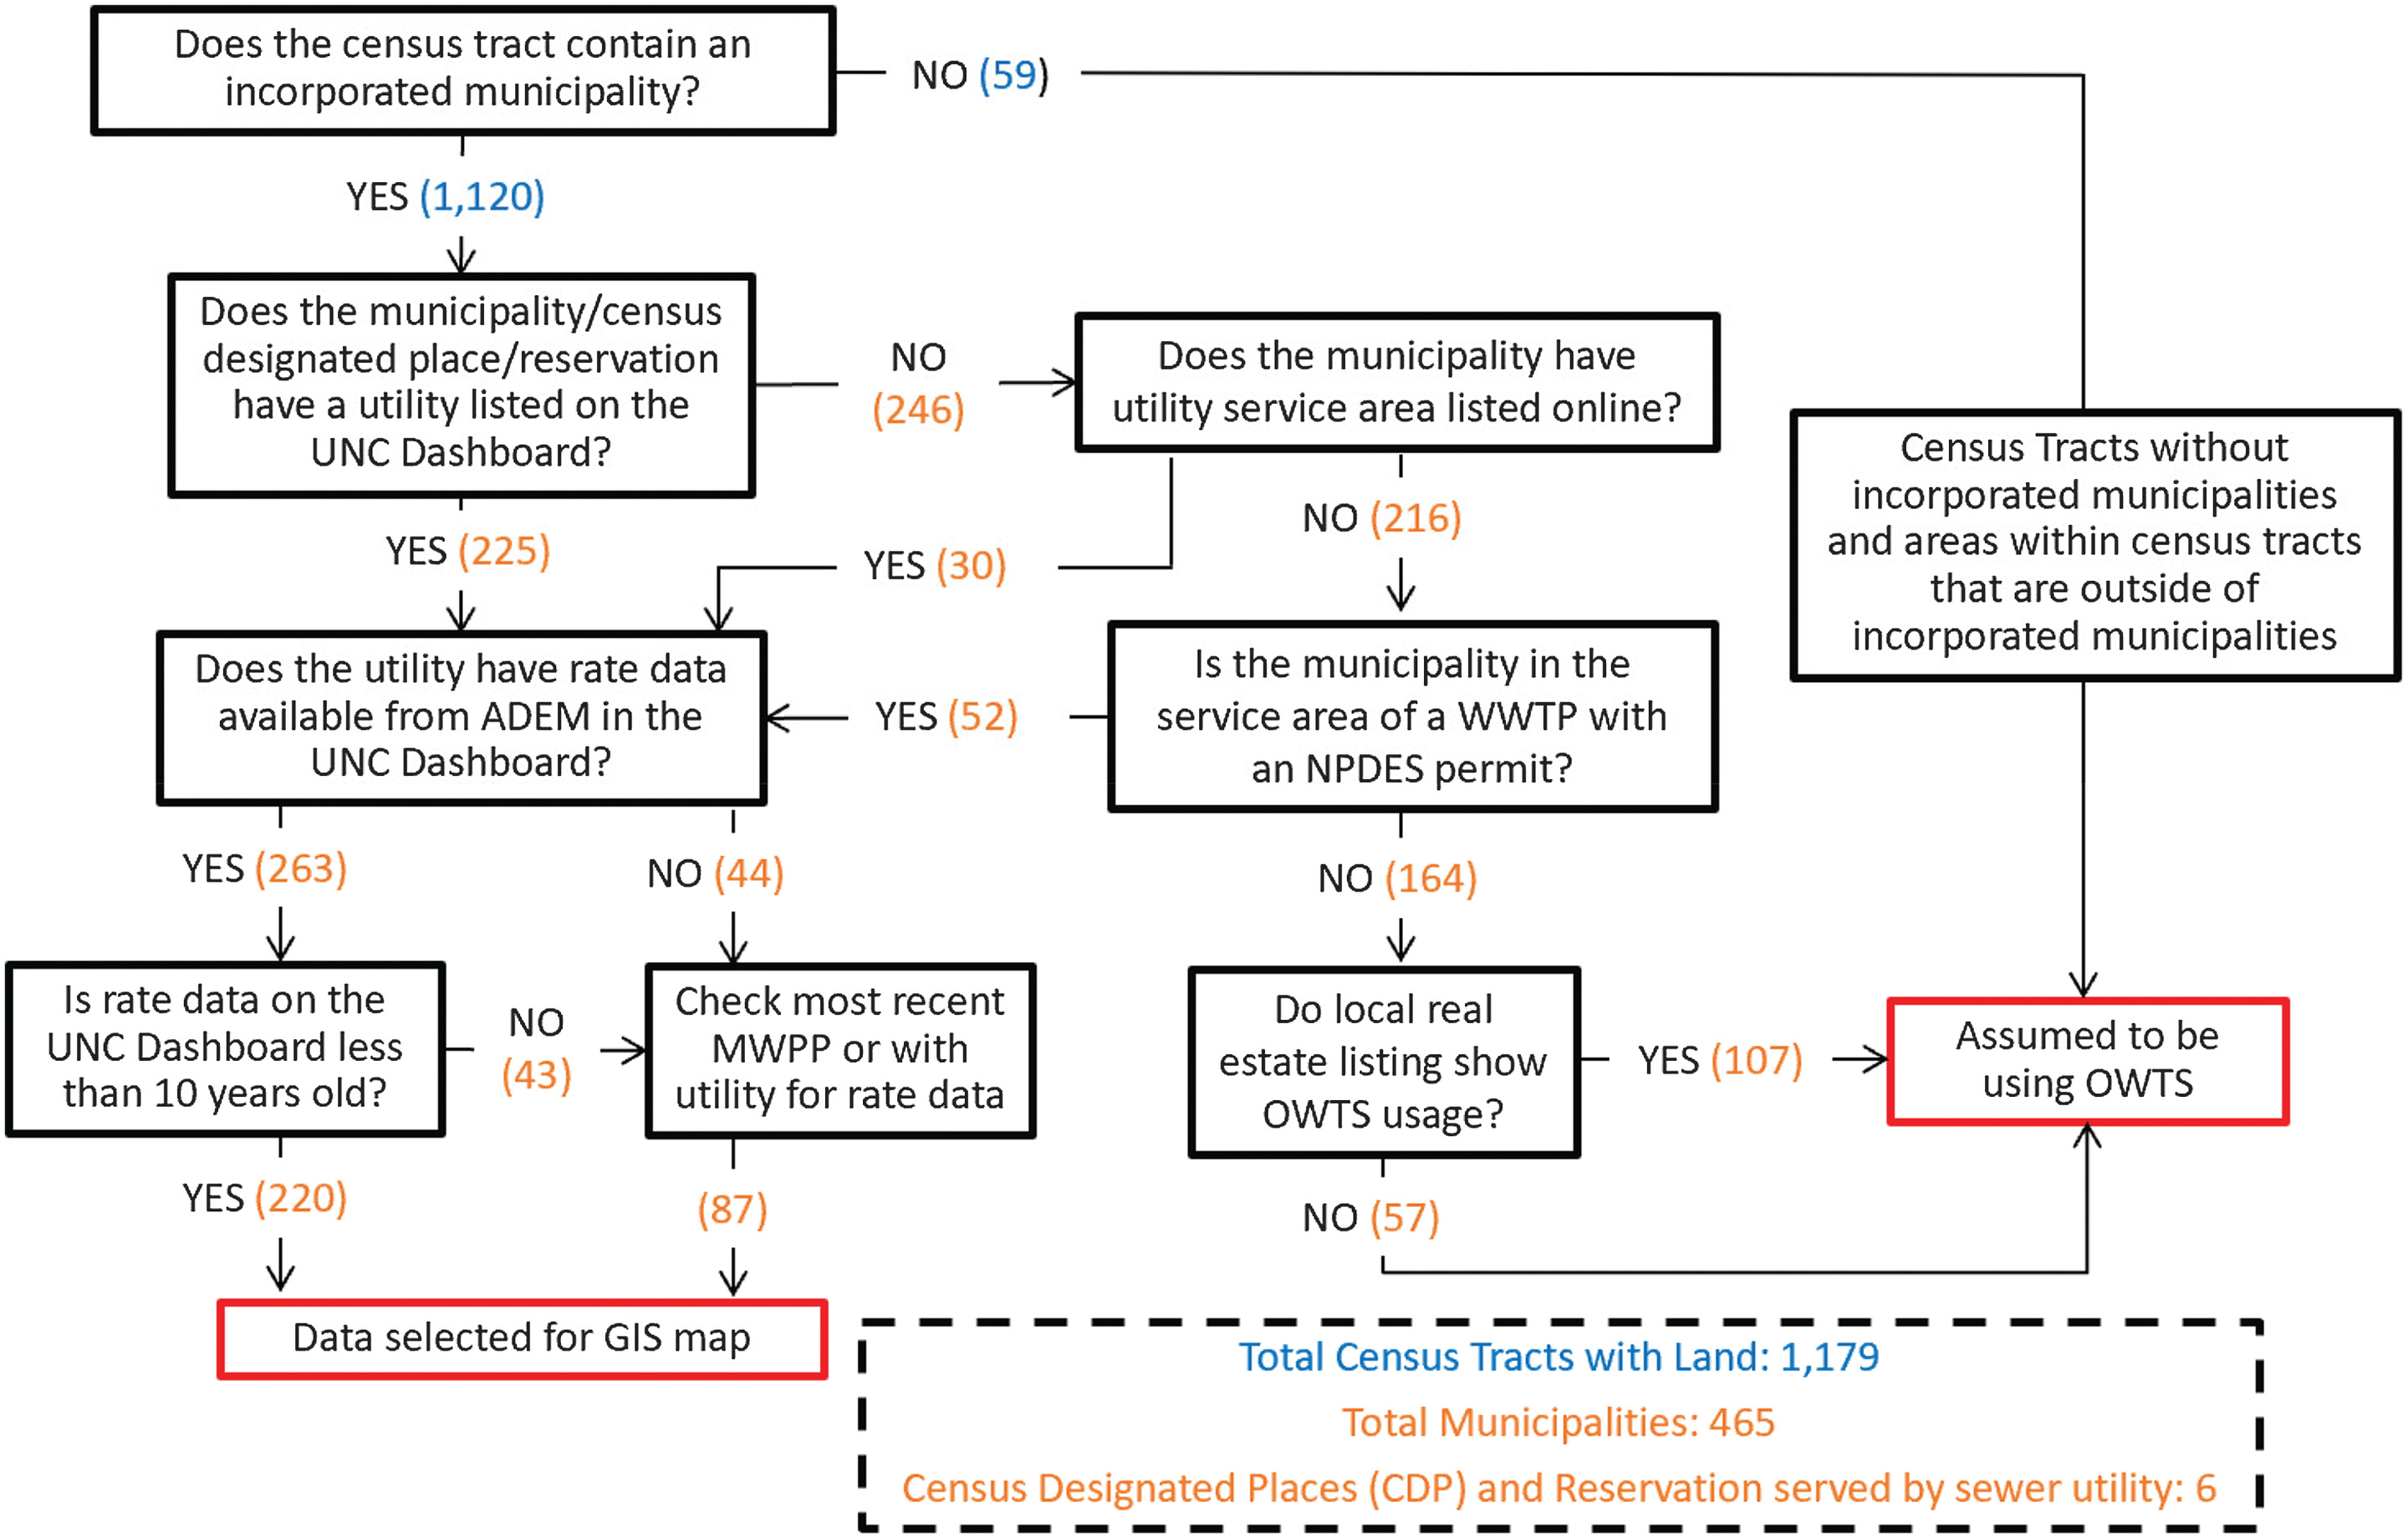
The other data sources used to fill in data were online utility data, the list of national pollutant discharge elimination system (NPDES) permits administered through ADEM, and online real estate listings. The list of NPDES permits was used to determine the inclusion of all utilities that serve large groupings of permanent residences where households are responsible for paying a monthly sewer bill (and not including utilities serving only correction facilities, military bases, hotels, retreat centers, and so on, or only a single neighborhood or subdivision).
OWTS were assigned for municipalities with municipal systems that have treatment plants with low actual daily flow rates, limited-service populations, and real estate listings showing OWTS. If the rate reported on the UNC Dashboard was from 2013 or earlier, the most recent Municipal Wastewater Planning Program (MWPP) was used to confirm or change the assigned rate. Monthly sewer rates in Alabama ranged from $2.00 to $87.27 for 22,712.5 L (6,000 gal.) with an average of $34.06.
In Alabama, most municipal sewer utilities only provide service within municipal boundaries, so for this study, it was assumed that every household in the municipality is serviced by the municipal utility and pays the corresponding rates. Utilities that use pressurized sewer systems, including some private utilities that use septic tank effluent pump or grinder systems, may be more flexible in service areas than conventional gravity systems, so the utility’s rate was assigned to the area it primarily serves.
The residents outside of areas served by sewer utilities were assumed to not be connected to sewer networks and are responsible for managing their own wastewater using OWTS. It was assumed that all residents in Alabama are able to install conventional OWTS [estimated to cost $5,000 (Cellucci 2022; HomeAdvisor and Botelho 2022)] except the residents living in the 17 Black Belt counties: Barbour, Bullock, Butler, Choctaw, Crenshaw, Dallas, Greene, Hale, Lowndes, Macon, Marengo, Montgomery, Perry, Pike, Russell, Sumter, and Wilcox (Fig. S1 ). In the Black Belt counties, the native soils typically require advanced engineered OWTS; for this analysis we used the most common engineered system, a mound septic system [estimated to cost $20,000 (Cellucci 2022; HomeAdvisor and Botelho 2022)].
All OWTS are typically either installed and paid for by the homeowner as a lump sum or, more likely, incorporated into a mortgage loan (at the time of home purchase or mortgage refinance). OWTS are typically designed to operate for 30 years, but may have a longer useful life. The time frame before the system needs repairs or rehabilitation will vary based on a number of factors such as system care and drainfield soil type. This is the first study to analyze the affordability of OWTS, so we focused on the capital cost and the main ongoing cost to pump the system; replacement and rehabilitation costs are not included (except to the extent they are implicitly included in mortgage and rental payments).
To be consistent with typical mortgage and system design life spans, the loan was estimated for a 30-year repayment. The monthly loan payment is dependent upon the loan’s interest rate (Table 1). For this study, the average mortgage interest rate in the US since 1971 (7.75%) was used to estimate the monthly loan payment needed for a financed system (Freddy Mac 2023). Both conventional and mound septic systems have a tank that must be pumped every 5 years and which is estimated to cost $500 each pumping or $8.33 per month (USEPA 2022e). The OWTS expenses are represented in the maps as annual loan payment and annual pumping cost (conventional: $44.15 per month; mound: $151.62 per month). The Supplemental Materials offer an analysis using capital cost paid as a lump sum and households only paying pumping cost.
| Estimated costs for onsite wastewater treatment systems | Conventional septic system | Mound septic system |
|---|---|---|
| Cost of system | $5,000 | $20,000 |
| Loan term (years) | 30 | 30 |
| Monthly loan payment (based on different interest rates) | ||
| 2.5% | $19.76 | $79.02 |
| 5.0% | $26.84 | $107.36 |
| 7.5% | $34.96 | $139.84 |
| 7.75% | $35.82 | $143.28 |
| 10.0% | $43.88 | $175.51 |
| Total monthly expenses (loan payment + pumping costs) | $44.15 | $151.62 |
Note: Total monthly expenses (loan payment + pumping costs) include the average interest rate (7.75%) on a 30-year mortgage in the US since 1971 and the estimated costs of having the septic tank pumped every 5 years.
Income Data Collection
Household income data for Alabama census tracts were obtained from the US Census Bureau website (US Census Bureau 2020) using the 2019 American Community Survey (ACS) 1-year estimates from US Census Bureau (U2020). The ACS data for Alabama were collected for 1,181 census tracts including the MHI for each tract, total number of estimated households per tract, and percentage of households within 10 annual household income intervals. Of the 1,181 census tracts, nine did not have complete data, including seven that were removed for having zero estimated total households and two that did not have a reported median income so the mean income was substituted for the value. The MHI for Alabama census tracts ranges from $9,202 to $184,000, a 20-fold difference.
GIS Mapping Methodology
After gathering the data sets and formatting the household income and utility information, ArcMap version 10.7.1 was used to develop visual representations of wastewater affordability in Alabama. The utility rate data was joined to the corresponding sewered polygons (set of polygons that represent the service areas for sewer utilities in Alabama), and the household income data was joined to the corresponding census tracts. In order to associate the income data with the sewered polygons to analyze the cost of wastewater services based on local household incomes, sewered polygons were divided along the boundaries of the census tracts, and the income data from the census tracts were joined based on spatial location. The census tract areas outside the sewered shapefile boundaries were assumed to rely on OWTS and associated with the data for OWTS expenses (Figs. 2, S2 , and S3 ).
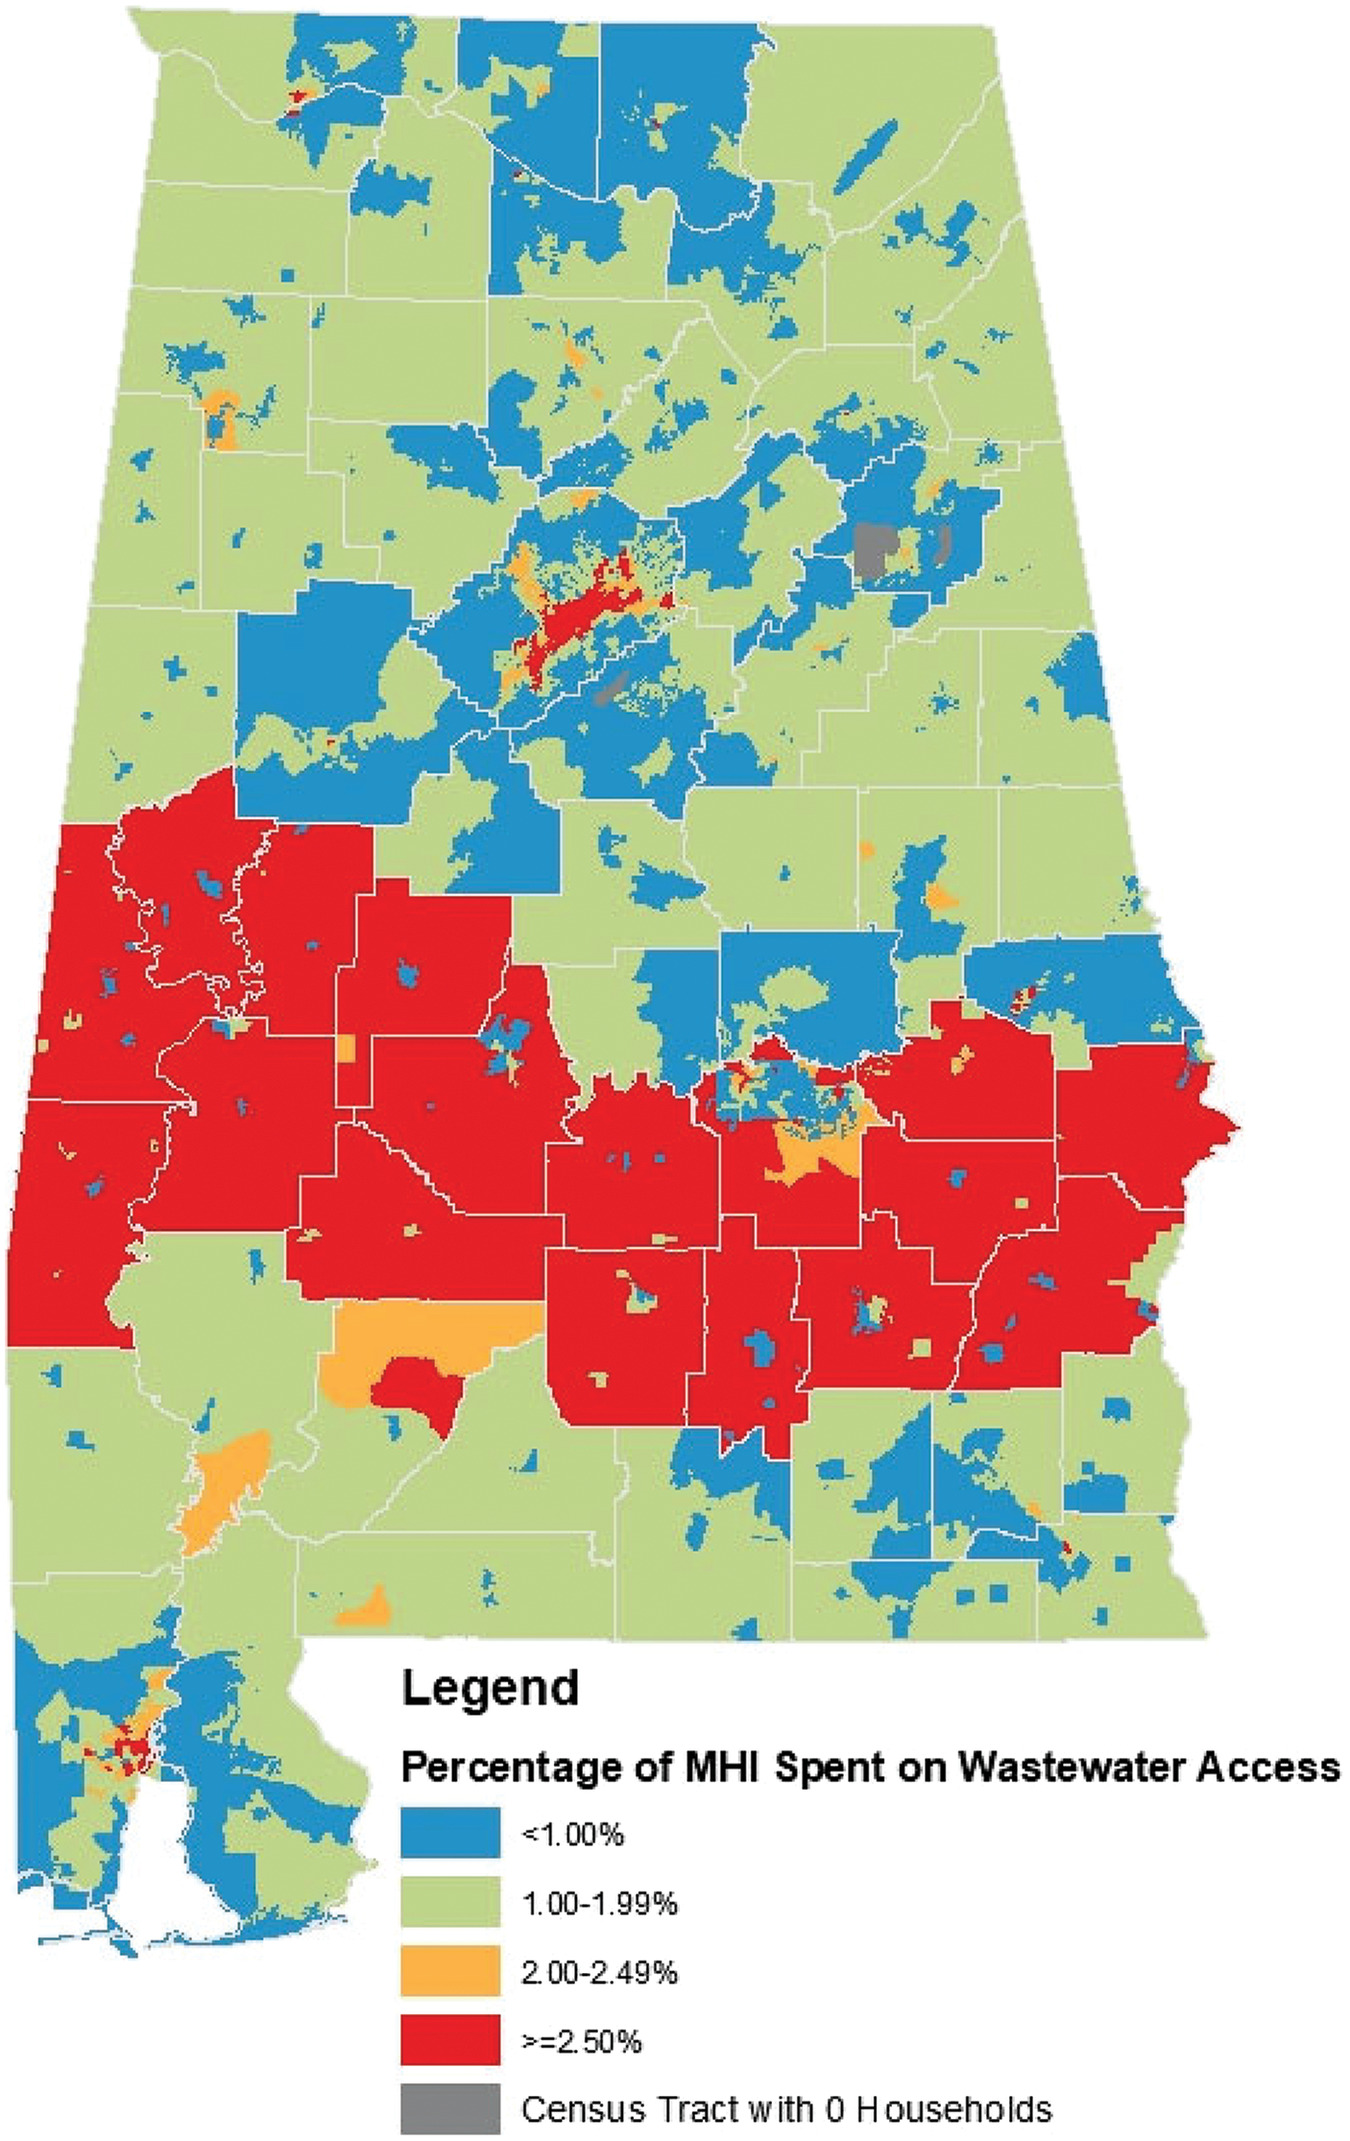
Wastewater Affordability Based on Median Household Income
The first set of maps (Figs. 2, S2 , and S3 ) utilized the USEPA methodology to determine affordability based on MHI. These maps show the percentage of the census tract’s MHI that is spent on annual wastewater access expenses (the Supplemental Materials detail the specific steps). The areas are grouped into four categories to showcase the areas with unaffordable wastewater expenses (in red) and areas at risk for affordability challenges (in orange). All the figures have the same annual sewer rate for each utility, but different representations for OWTS expenses.
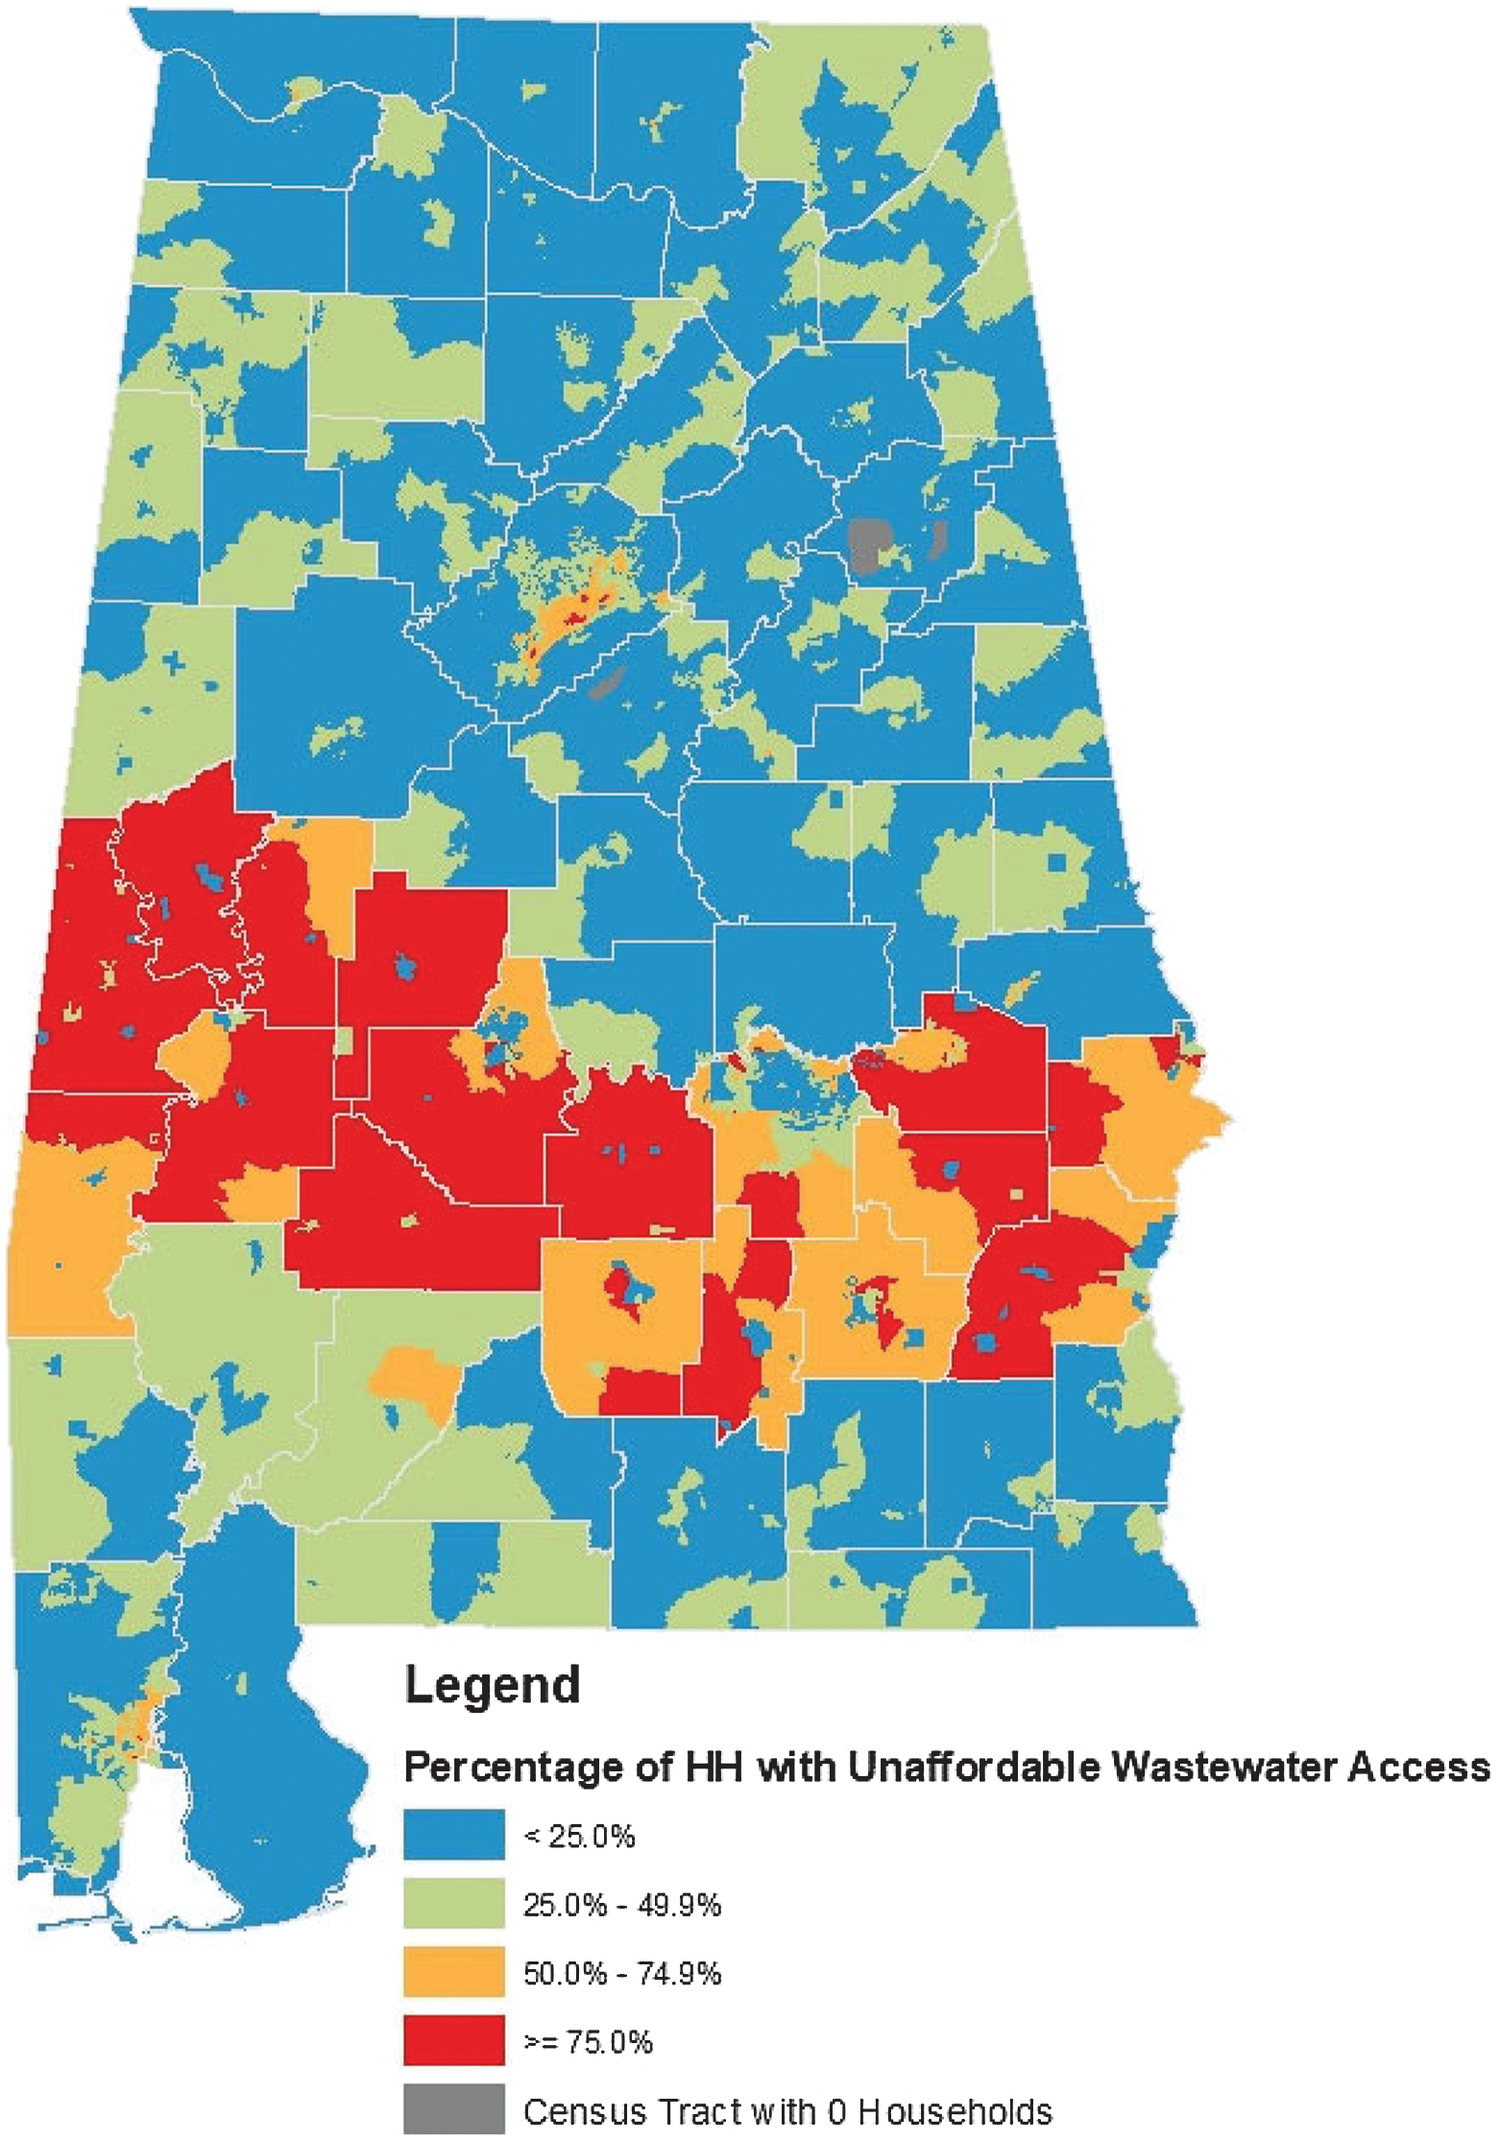
Wastewater Affordability Based on Income Brackets
The second set of maps (Figs. 3, S4 , and S5 ) shows the estimated quantity of households that have unaffordable sewer bills. When the census tract MHI is used to determine sewer affordability, roughly half of the households have incomes below the assessed value, so we used the percentage of households within each household income bracket and the area’s annual cost of wastewater access to quantify the number of households with unaffordable wastewater access. To do this, we began by estimating the number of households (HH) within each sewered polygon, then calculated the MHI at which unaffordable wastewater access would occur based on the annual wastewater access expenses, and finally used a linear interpolation of the income intervals to determine the quantity of households (Table S6 ).
Estimating Number of Households in Each Sewered Polygon
The quantity of households in each polygon was estimated by distributing the estimated quantity of households served based on the utility’s service population (as reported on the utility’s NPDES permit, obtained from the utility, or from the UNC dashboard) divided by the average Alabama household size of 2.6 (US Census Bureau 2023). Similar to the weighting methodology used in other studies (Patterson and Doyle 2021; Raucher et al. 2019), the number of households in each polygon was primarily assigned using an average of the estimated households based on the polygon’s area compared with the entire municipality’s area and the entire census tract’s area (Supplemental Materials). The households not served by a sewer utility (living outside of the sewered polygons) were assumed to be using OWTS and estimated by subtracting the number of households served by a utility from the total number of households.
Estimating Number of Households with Unaffordable Wastewater Access
The MHI threshold for affordable wastewater access was calculated based on the annual sewer bill, annual OWTS loan payment and annualized pumping costs for Fig. 3, OWTS capital costs for Fig. S4 , and annualized pumping costs for Fig. S5 . For each polygon, the number of households that have unaffordable wastewater access was determined by summing the number of households in the income brackets below the threshold and a linear interpolation of the number of households below the threshold within the threshold’s income interval.
Results
Wastewater Affordability Based on Median Household Income
Wastewater affordability based on MHI is shown in Figs. 2, S2 , and S3 with sewer access expenses shown the same in each figure. Meanwhile, OWTS expense are represented in three ways: (1) OWTS expenses as both annual loan payment and pumping cost (Fig. 2), (2) OWTS expenses as a lump sum for system’s capital cost (Fig. S2 ), and (3) OWTS expenses as the annual savings needed to pay for pumping the system every 5 years (Fig. S3 ).
When analyzing wastewater affordability as annual sewer bill and OWTS represented as annual loan payment and pumping cost (Fig. 2), there are 236 census tracts with approximately 247,000 households (13.2%) that have unaffordable wastewater expenses based on the MHI (Table S3 ). Of these census tracts, 102 census tracts (with approximately 100,300 households) have unaffordable access to sewer, 127 census tracts (with approximately 141,000 households) have unaffordable OWTS expenses, and seven census tracts (with approximately 5,700 households) have unaffordable access to both sewer and OWTS. There are 72 census tracts with over 5.0% of MHI spent on wastewater access, with one census tract at 12.0% of MHI. There are 13 utilities serving areas where the MHI and current sewer rates result in unaffordable sewer bills. There are also 87 census tracts that are at risk of unaffordable wastewater access because the current wastewater costs are between 2.00% and 2.50% of the MHI; 60 census tracts are at risk due to sewer rates, 23 census tracts at risk due to OWTS expenses, and four census tracts at risk due to both sewer rates and OWTS expenses.
Wastewater Affordability Based on Income Brackets
Wastewater affordability based on income brackets is shown in Figs. 3, S4 , and S5 with sewer access expenses the same in each figure. OWTS expense are represented as (1) OWTS expenses as both annual loan payment and pumping cost (Fig. 3), (2) OWTS expenses as a lump sum for system’s capital cost (Fig. S4 ), and (3) OWTS expenses as the annual savings needed to pay for pumping the system every 5 years (Fig. S5 ). In Alabama, there are 1,867,893 households with 1,223,659 households (65.5%) estimated to be served by sewer utilities and 644,234 (34.5%) households estimated to use OWTS (Table 2), considerably higher than the estimated to be using OWTS nationally.
| Summary of results | Number of households | Percentage of households |
|---|---|---|
| Total households in Alabama | 1,867,893 | — |
| Estimated number of households on sewer | 1,223,659 | 65.5 |
| Estimated number of households on OWTS | 644,234 | 34.5 |
| Total households with unaffordable wastewater access | 443,237 | 23.7 |
| Households with unaffordable sewer access | 278,086 | 14.9 |
| OWTS represented as annual loan payment and annualized pumping cost (Fig. 3) | ||
| Household with unaffordable OWTS access | 165,151 | 8.8 |
| Households with conventional systems | 116,168 | 6.2 |
| Households with mound systems | 48,983 | 2.6 |
| OWTS represented as annualized pumping costs (Fig. | ||
| Household with unaffordable OWTS access | 20,109 | 1.1 |
| Households with conventional systems | 16,767 | 0.9 |
| Households with mound systems | 3,342 | 0.2 |
When analyzing wastewater affordability as annual sewer bill and OWTS represented as annual loan payment and pumping cost (Fig. 3), there are estimated to be 443,237 households (23.7% of households in Alabama) with unaffordable wastewater access because their annual wastewater expenses are greater than 2.5% of their household income (Table S6 ). Of these households, 62.7% (278,086 households) have unaffordable access to sewers and 37.3% (165,151 households) have unaffordable OWTS expenses (Table 2). There are 97 sewered polygons where more than 75.0% of the households have unaffordable wastewater access (Table S5 ). In addition, there are 182 sewered polygons where 50.0% to 74.9% of the households have unaffordable wastewater access (Table S6 ). There are 13 utilities serving areas where over 50% of the households have annual incomes where the current rates result in unaffordable sewer bills.
When analyzing wastewater affordability for households that only need to pay pumping costs to maintain their system (Fig. S5 and Table 2), there are 20,109 households for whom the average annual expenditure to afford pumping costs for their system would exceed 2.5% or more of their annual incomes (Table 2). Even if the capital costs of OWTS for these households were fully subsidized, these households would still have affordability challenges to maintain their systems.
Cost of Living in Alabama
Wastewater affordability should be analyzed in context with other required expenses (Table 3). Annually, the cost of living in Alabama for a family of three (state average household size is 2.6 persons) is roughly $66,000 ($5,500 per month as per Table 3), and the Federal Poverty Level for a family of three is $24,860 (HealthCare.gov 2023). Table 3 excludes wastewater expenses and assumes a connection to a water utility (not a drinking water well). This study found that in Alabama, the average monthly sewer bill is $34.06, and the average monthly cost for a conventional OWTS incorporated into a 30-year mortgage is $35.82, and $143.28 for advanced OWTS. If summed with the other categories in Table 3 to create a comprehensive cost, these would constitute 0.6%, 0.6%, and 2.5% of total monthly expenses, respectively. Although wastewater expenses are not the largest expected monthly cost, they do have a substantial contribution to overall monthly expenses. However, an approach focused solely on household income will not reflect the household’s experience with significant financial trade-offs for water and wastewater access during typical months and extenuating circumstances that result in large monthly expenses (e.g., medical bills or auto repair) (Patterson and Doyle 2021).
| Expense | Average monthly cost | Percentage of total monthly expenses | References |
|---|---|---|---|
| Rent (two-bedroom apartment) | $852 | 15.5 | US Census Bureau (2021a) |
| Electricity | $161 | 2.9 | Find Energy (2021) |
| Internet | $65 | 1.2 | AT&T (2022) |
| Car insurance | $108 | 2.0 | Shinn et al. (2022) |
| Groceries | $610 | 11.1 | Comen and Stebbins (2021) and Economic Policy Institute (2020) |
| Health care | $997 | 18.1 | Comen and Stebbins (2021) |
| Transportation | $1,138 | 20.6 | Comen and Stebbins (2021) and Economic Policy Institute (2020) |
| Childcare (for one child) | $417 | 7.6 | Comen and Stebbins (2021) and Economic Policy Institute (2020) |
| Taxes | $507 | 9.2 | Comen and Stebbins (2021) and Economic Policy Institute (2020) |
| Miscellaneous | $500 | 9.1 | Comen and Stebbins (2021) and Economic Policy Institute (2020) |
| Cell phone | $120 | 2.2 | AT&T (2023) |
| Water (from a utility) | $36 | 0.7 | UNC Environmental Finance Center (2019) |
| Total | $5,511 | — | — |
Note: Monthly wastewater expenses are excluded because the cost depends on the type of wastewater access. The average sewer bill in Alabama is $34.06, and the average cost for a conventional OWTS incorporated into a 30-year mortgage is $35.82 or $143.28 for advanced OWTS. If summed with the other categories in Table 3 to create a comprehensive cost, these would constitute 0.6%, 0.6%, and 2.5% of total monthly expenses, respectively.
Discussion and Recommendations
Affordability is a complex issue to address because the root of the problem may not necessarily be the sewer rates or costs of OWTS because these reflect the cost of properly treating wastewater to protect environmental and public health. The focus should be on improving overall economic access to wastewater management, which will not only protect low-income households’ right to safely managed sanitation but also the utility’s ability to be financially sustainable as they provide safely managed sanitation for their customers (Center for Water Security and Cooperation 2021).
Evaluating wastewater affordability based on MHI results in census tracts with unaffordable wastewater access for connections to both sewer and OWTS indicated that neither type of system is more likely than the other to cause affordability challenges. A more comprehensive understanding of wastewater access affordability can be obtained by using the estimated percentage of households within each income bracket for each census tract to determine the households with unaffordable wastewater access. Census tract income bracket data also showed that affordability challenges occur for households served by sewer utilities and those who use OWTS. The results emphasize there is not only a need for sewer utilities to invest in customer assistance programs to ensure their services are affordable for all households but also programs for assisting users of OWTS with their affordability challenges.
Although this study focused on wastewater access affordability in Alabama, the methodology can be applied to other states or countries with available sewer rates and OWTS cost estimates. These expenses vary geographically, so it is essential that local estimates are used to accurately understand affordability in other geographical areas. With larger data sets for estimating wastewater expenses and service areas, larger scale studies could be conducted for the US or even specific regions of the US. In this study, we used guidelines from the USEPA, but similar studies could be conducted in other countries using local guidelines for affordability thresholds.
Affordability for Onsite Wastewater Treatment Systems
In Alabama, conventional OWTS is affordable for the majority of households, but the need for implementing more expensive advanced mound systems coincides with areas of lower income, which exacerbates affordability challenges (Figs. 2 and 3) (Maxcy-Brown et al. 2021, 2023a). For this study, we used an estimate for the cost of a conventional septic system in Alabama, but national estimates range from $3,500 to $11,200 with an average of $7,150, which would lead to greater monthly loan payments (Cellucci 2022; HomeAdvisor and Botelho 2022). To include all aspects of OWTS expenses, it is most representative to analyze with both loan payments and pumping costs (Figs. 2 and 3), but after the system is paid off, it is more realistic to evaluate only pumping costs (Figs. S2 and S5 ).
There are many residents who do not have new mortgages that incorporate OWTS capital costs and must rely on limited loan opportunities to pay for OWTS such as applying for a Home Equity Line of Credit (HELOC) or go without having a proper wastewater treatment system. The capital costs of conventional OWTS without financial assistance will cause a financial burden for most households (Figs. S2 and S4 ). The affordability of OWTS is dependent upon the type of system that must be installed (and the highly variable costs that depend on the soil and geological conditions), location, household income, current interest rates, and access to financing. This study shows the impacts of subsidizing capital costs of OWTS with grants instead of loans; if grants were used to subsidize the full capital costs of OWTS, the number of households in Alabama with unaffordable OWTS expenses would decrease from 165,000 households (8.8% of households in Alabama) to 20,109 households (1.1% of households in Alabama).
Affordability for Sewer Utilities
This study found that approximately 278,000 households (14.9%) in Alabama have affordability challenges related to sewer bills. Small utilities, especially those serving predominantly low-income residents, will be at greater risk of financial impacts from customer affordability challenges and may need to consider consolidation or regionalization (Patterson and Doyle 2021). The Water Environment Federation (WEF) has a resource guide outlining wastewater affordability considerations and suggestions for utilities including bill discounts, water-use reduction programs (such as education, conservation, and plumbing repairs), varying rate structures, obtaining external funding, and working with local stakeholders (WEF 2022).
WEF stated that having affordability assistance programs will improve the utility’s alignment with environmental justice and social values, reduce delinquencies and write-offs, improve customers’ quality of life, and improve the utility’s relations with customers (WEF 2022). The report explained that these programs will not necessarily cause financial strains on the utility because uncollectible accounts, on average, only reflect about 2% of a utility’s projected annual revenue, participation has historically been low in affordability programs, programs typically only affect 1.0% to 1.5% of total gross revenue, and program expenses can be offset by a reduction in the administrative costs for dealing with delinquencies accounts (WEF 2022). Research has also shown that there is a need for a transfer in the responsibility for bill-assistance programs from utilities to state-level governance and consideration of different types of affordability interventions (Pierce et al. 2020, 2021).
Using More Inclusive Affordability Indicators
We recommend that the USEPA revisit methodologies for evaluating affordability to reflect not only affordability for utility regulatory compliance based on MHI but also affordability directly at the household level, with consideration for both sewer rate payers and those responsible for the entire cost of an OWTS. These thresholds should reflect the diversity in incomes throughout the country by accounting for the variability of household income and cost of living and addressing the needs of populations living below the MHI. This study demonstrates that metrics based on MHI are unable to quantify the affordability challenges and may not correctly identify areas with affordability challenges. In Fig. 2, the affordability challenges based on MHI are primarily concentrated in metropolitan areas and the Black Belt region, but when using household incomes, Fig. 3 shows that affordability challenges are widespread across the state. This current metric also neglects to capture the affordability challenges of residents not on sewer, which is estimated to affect approximately 8.8% of households in Alabama.
In addition to the methodology in this study, the AWWA, National Association of Clean Water Agencies, and WEF have proposed that the USEPA could consider the Household Burden Indicator (HBI) and the Poverty Prevalence Indicator (PPI), two approaches that assess affordability using a lower-income subset of households (Raucher et al. 2019). HBI focuses on the lowest quintile of income for a service area, whereas PPI focuses on households at or below 200% of the Federal Poverty Level (Raucher et al. 2019). HBI considers the total cost of water services (drinking water, wastewater, and stormwater) to measure the overall economic burden for low-income households (Raucher et al. 2019).
Existing affordability studies and recommendations are focused on residents who have utility bills, but new guidelines should also consider the 25% of US residents who are not connected to utility systems and those who are connected for water, but not sewer or vice versa. Not only do the guidelines for water and sewer affordability need to be updated, but there also needs to be increased support at the national, state, and local levels for addressing water and sewer affordability issues. Regardless of the guidance and thresholds, greater clarity is needed on how to determine affordability for utility bills that include water supply only, sewer only, and those bills that include both water and sewer service.
Government-Assisted Affordability Programs
Water has historically not been included in antipoverty programs in the US (Wescoat et al. 2007). Although the recently established Low Income Household Water Assistance Program (LIHWAP) has extended financial assistance to utilities, it excludes those who are financially responsible for their own drinking water wells and OWTS (US Department of Health and Human Services 2021). Most of the water-related funds available from the federal government are directed toward larger, wealthier water systems and are inaccessible by those who need grants, loans, and technical assistance for smaller community systems or at the household level (Wescoat et al. 2007), including the recently established federal infrastructure funding (Elliott et al. 2023).
The USDA has grant and loan programs to assist in funding rural water and wastewater systems for communities, including the Rural Decentralized Water Systems Grant Program, which was originally for funding drinking water wells and has expanded to include septic systems (USDA 2023). Unfortunately, this funding mechanism, like many others, is only open to applications from public entities or nonprofits, which makes it less accessible to individual homeowners unless they have access to a local nonprofit with funding.
The recently passed Bipartisan infrastructure law (BIL) authorized funding to increase access to the technical assistance that many small communities and nonprofits need to apply for funding and also authorized funds for onsite and decentralized systems (US Congress 2021). These funds will support existing state Clean Water State Revolving Loan Fund (CWSRF) programs, which can be used to finance both centralized sewers and OWTS, but there are only 11 states that have financing programs to regularly use CWSRF funds for OWTS, with Delaware being the only state to provides direct to household loans (USEPA 2022b, 2023b). Historically, there are 26 states that have used CWSRF for financing decentralized wastewater treatment projects, but the majority of this funding (75%) was from only five states (USEPA 2021). Alabama has not previously used CWSRF for financing decentralized systems, but there is a push to adopt similar lending structures to include financing OWTS through the CWSRF (Center for Rural Enterprise and Environmental Justice and Natural Resources Defense Council 2023).
When allocating financial assistance, state agencies should pay special attention to supporting utilities that serve low-income residents (Pierce et al. 2020), and identifying funding that could benefit individual households who are experiencing financial barriers to accessing safely managed wastewater through either a local sewer utility or with an OWTS. According to the 2022 US State Policy Scorecards for Water Efficiency and Sustainability, Alabama currently ranks 35th overall, including the minimum score for state funding for customer assistance programs (Alliance for Water Efficiency 2023). This state-level analysis of wastewater affordability and the outlined recommendations provide examples of how Alabama or any other state can improve its policies and emerge as a national leader in proactively addressing wastewater affordability challenges for the thousands of affected households.
Conclusion
Wastewater affordability is a topic that is in growing need of addressing as affordability challenges continue to increase throughout the country as treatment prices continue to rise. There needs to be a shift away from affordability analysis being only focused on drinking water access and the financial ability of the utility to comply with the national standards to a focus that also considers sustainable access to safely managed wastewater at the household level. More creative research and discussion is recommended on finding alternative ways, especially during financial crises, to prevent service shut offs without severely financially impacting utilities while also ensuring all residents can afford adequate wastewater treatment.
This study developed a methodology that can be used to analyze affordability for a large geographical area by overlaying wastewater access expenses with annual household incomes at the census tract level. The wastewater access expenses are based on the local sewer utility’s rates and service area or the estimated OWTS loan payments for households outside of a sewer utility service area. This methodology enables affordability discussions to account for income inequalities and varying wastewater expenses to provide understanding of local affordability situations. Decision makers at national, state, and local levels can use this methodology to begin addressing affordability challenges before this crisis becomes acute.
Supplemental Materials
File (supplemental materials_jwrmd5.wreng-6308_maxcy-brown.pdf)
- Download
- 2.00 MB
Data Availability Statement
Some or all data, models, or code that support the findings of this study are available from the corresponding author upon reasonable request. The data used in this study is primarily available in the Supplemental Materials, but the data spreadsheets and GIS .shp files are available upon request to the corresponding author.
Acknowledgments
We would like to acknowledge Dr. Joe Weber (University of Alabama), Aaron Blackwell (University of Alabama), Jim Grassiano (Alabama Department of Environmental Management), and Keith Watson (Bryant Bank) who contributed technical guidance and feedback. We would also like to acknowledge the utilities who provided rate data. We would like to thank the following for funding that made this research possible: USEPA Gulf of Mexico Program (MX-00D87019), US Department of Agriculture (TAT-RWTS 00-69526), Richard Lounsbery Foundation, and Columbia World Projects “Transforming Wastewater Infrastructure in the United States.”
References
Alabama Geographic Information Office. 2019. “2016 city limits and places (Census Data) | Alabama open data portal.” Accessed March 20, 2023. https://data-algeohub.opendata.arcgis.com/datasets/ALDOT::2016-city-limits-and-places-census-data/explore?location=32.540423%2C-86.703618%2C7.00.
Alabama Geographic Information Office. 2022. “Alabama incorporated cities boundaries | Alabama open data portal.” Accessed November 30, 2021. https://data-algeohub.opendata.arcgis.com/datasets/alabama-incorporated-cities-boundaries/explore?location=32.575842%2C-86.676559%2C7.00.
Alliance for Water Efficiency. 2023. “2022 U.S. state policy scorecard for water efficiency and sustainability: Alabama.” Accessed June 4, 2023. https://www.allianceforwaterefficiency.org/2022Scorecard.
AT&T. 2022. “AT&T Internet.” Accessed April 3, 2022. https://www.att.com/internet/.
AT&T. 2023. “Wireless plans.” Accessed June 4, 2023. https://www.att.com/plans/wireless/.
AWWA (American Water Works Association and Raftelis Financial Consultants). 2019. Water and wastewater rate survey. Singapore: AWWA.
Balling, R. C., P. Gober, and N. Jones. 2008. “Sensitivity of residential water consumption to variations in climate: An intraurban analysis of Phoenix, Arizona.” Water Resour. Res. 44 (10): 10401. https://doi.org/10.1029/2007WR006722.
Barnett, M. J., D. Jackson-Smith, J. Endter-Wada, and M. Haeffner. 2020. “A multilevel analysis of the drivers of household water consumption in a semi-arid region.” Sci. Total Environ. 712 (Jun): 136489. https://doi.org/10.1016/J.SCITOTENV.2019.136489.
Belzer, R. B. 2020. “Achieving economically feasible drinking water regulation.” J. Benefit-Cost Anal. 11 (2): 294–318. https://doi.org/10.1017/BCA.2019.21.
Bunch, S., J. Peterson, E. Poehlman, S. Loper, and M. Wilburn. 2017. “Water and wastewater annual price escalation rates for selected cities across the United States.” Accessed May 24, 2023. https://www.energy.gov/sites/prod/files/2017/10/f38/water_wastewater_escalation_rate_study.pdf.
Cardoso, D. S., and C. J. Wichman. 2022. “Water affordability in the United States.” Water Resour. Res. 58 (12): e2022WR032206. https://doi.org/10.1029/2022WR032206.
Cellucci, N. P. 2022. “How much does a septic system cost?” Accessed May 24, 2023. https://www.angi.com/articles/what-does-it-cost-install-septic-system.htm.
Center for Rural Enterprise and Environmental Justice, and Natural Resources Defense Council. 2023. Complaint under Title VI of the Civil Rights Act of 1964 and the EPA’s implementing regulations regarding discrimination by the State of Alabama and the Alabama Department of Environmental Management in their administration of CWSRF. New York: Center for Rural Enterprise and Environmental Justice, and Natural Resources Defense Council.
Center for Water Security and Cooperation. 2021. “Ending water shutoffs: Deconstructing the law’s punishment of poverty.” Accessed May 5, 2021. https://washagendaforchange.org/resource/ending-water-shutoffs-deconstructing-the-laws-punishment-of-poverty/.
Comen, E., and S. Stebbins. 2021. “Cost of living in Alabama.” Accessed April 5, 2022. https://247wallst.com/state/cost-of-living-in-alabama/.
Economic Policy Institute. 2020. “Family budget calculator.” Accessed April 1, 2022. https://www.epi.org/resources/budget/.
Elliott, M. A., A. Bakchan, J. Maxcy-Brown, V. A. D’Amato, D. Hallahan, K. D. White, C. Stallman, and S. Bradley. 2023. “Sustainable wastewater management for underserved communities using federal infrastructure funds: Barriers, bottlenecks, and tradeoffs.” Water Secur. 20 (Jun): 100152. https://doi.org/10.1016/j.wasec.2023.100152.
Find Energy. 2021. “Alabama electricity rates & average electricity bills.” Accessed April 4, 2022. https://findenergy.com/al/.
Freddy Mac. 2023. “Mortgage rates.” Accessed March 15, 2023. https://www.freddiemac.com/pmms.
HealthCare.gov. 2023. “Federal poverty level (FPL).” Accessed May 9, 2023. https://www.healthcare.gov/glossary/federal-poverty-level-fpl/.
HomeAdvisor, and J. Botelho. 2022. “Install a septic tank.” Accessed April 12, 2021. https://www.homeadvisor.com/cost/plumbing/install-a-septic-tank/.
Lakhani, N. 2020. “Revealed: Millions of Americans can’t afford water as bills rise 80% in a decade | Water | The Guardian.” Accessed March 17, 2021. https://www.theguardian.com/us-news/2020/jun/23/millions-of-americans-cant-afford-water-bills-rise.
Mack, E. A., and S. Wrase. 2017. “A burgeoning crisis? A nationwide assessment of the geography of water affordability in the United States.” PLoS One 12 (1): e0169488. https://doi.org/10.1371/journal.pone.0169488.
Martins, R., C. Quintal, L. Cruz, and E. Barata. 2016. “Water affordability issues in developed countries—The relevance of micro approaches.” Util. Policy 43 (Apr): 117–123. https://doi.org/10.1016/j.jup.2016.04.012.
Maxcy-Brown, J., D. Capone, and M. A. Elliott. 2023a. “Characterizing the nature and extent of access to unsafely managed sanitation in the United States.” Nat. Water 1 (11): 915–928. https://doi.org/10.1038/s44221-023-00157-7.
Maxcy-Brown, J., M. A. Elliott, and B. Bearden. 2023b. “Household level wastewater management and disposal data collection in the U.S.: The history, shortcomings, and future policy implications.” Water Policy 25 (9): 927–947. https://doi.org/10.2166/wp.2023.147.
Maxcy-Brown, J., M. A. Elliott, L. A. Krometis, K. D. White, J. Brown, and U. Lall. 2021. “Making waves: Right in our backyard-surface discharge of untreated wastewater from homes in the United States.” Water Res. 190 (Feb): 116647. https://doi.org/10.1016/j.watres.2020.116647.
Mini, C., T. S. Hogue, and S. Pincetl. 2014. “Estimation of residential outdoor water use in Los Angeles, California.” Landscape Urban Plann. 127 (Jul): 124–135. https://doi.org/10.1016/j.landurbplan.2014.04.007.
Montag, C. 2019. “Water/color: A study of race & the water affordability crisis in America’s Cities.” Accessed March 29, 2021. https://www.naacpldf.org/wp-content/uploads/Water_Report_FULL_5_31_19_FINAL_OPT.pdf.
National Environmental Services Center. 2021. “Assessment of U.S. onsite system installations, 2015 through 2018.” Accessed February 9, 2022. https://www.nesc.wvu.edu/topics-of-interest/assessment-of-u-s-onsite-system-installations-2015-through-2018.
Patterson, L. A., and M. W. Doyle. 2021. “Measuring water affordability and the financial capability of utilities.” AWWA Water Sci. 3 (6): e1260. https://doi.org/10.1002/aws2.1260.
Pierce, G., N. Chow, and J. R. DeShazo. 2020. “The case for state-level drinking water affordability programs: Conceptual and empirical evidence from California.” Util. Policy 63 (Jun): 101006. https://doi.org/10.1016/j.jup.2020.101006.
Pierce, G., A. R. El-Khattabi, K. Gmoser-Daskalakis, and N. Chow. 2021. “Solutions to the problem of drinking water service affordability: A review of the evidence.” Wiley Interdiscip. Rev.: Water 8 (4): e1522. https://doi.org/10.1002/WAT2.1522.
Potter, L. B., D. M. Tremaine, and J. L. Banner. 2022. “Predictors of variations in residential water consumption in central Texas.” Water 14 (11): 1804. https://doi.org/10.3390/W14111804.
Raucher, R., J. Clements, E. Rothstein, J. Mastracchio, and Z. Green. 2019. “Developing a new framework for household affordability and financial capability assessment in the water sector.” Accessed March 26, 2023. https://www.accesswater.org/publications/-10080037/developing-a-new-framework-for-household-affordability-and-financial-capability-assessment-in-the-water-sector.
Roller, Z., S. Gasteyer, N. Nelson, W. Lai, and M. Shingne. 2019. “Closing the water access gap in the United States: A national action plan.” Accessed August 4, 2020. https://uswateralliance.org/wp-content/uploads/2023/09/Closing-the-Water-Access-Gap-in-the-United-States_DIGITAL.pdf.
Rothstein, E., S. I. Berahzer, J. Crea, and M. Matichich. 2021. “Affordability and equity considerations for rate-setting.” J. AWWA 113 (7): 36–47. https://doi.org/10.1002/awwa.1766.
Shinn, L., N. Parsons, and L. Madrid. 2022. Best cheap car insurance in Alabama for 2022. Washington, DC: US News & World Report.
Stratus Consulting. 2013. “AWWA affordability assessment tool for federal water mandates.” Accessed January 23, 2023. https://www.awwa.org/Portals/0/AWWA/ETS/Resources/AffordabilityAssessmentTool.pdf.
Teodoro, M. P. 2018. “Measuring household affordability for water and sewer utilities.” J. Am. Water Works Assoc. 110 (1): 13–24. https://doi.org/10.5942/JAWWA.2018.110.0002.
Teodoro, M. P., and R. R. Saywitz. 2020. “Water and sewer affordability in the United States: A 2019 update.” AWWA Water Sci. 2 (2): e1176. https://doi.org/10.1002/AWS2.1176.
UNC (University of North Carolina) Environmental Finance Center. 2019. “AL water and wastewater rates dashboard.” Accessed November 29, 2021. https://dashboards.efc.sog.unc.edu/al.
United Nations Committee on Economic Social and Cultural Rights. 2003. “General comment No. 15: The right to water (Arts. 11 and 12 of the covenant).” Accessed May 23, 2023. https://www.refworld.org/pdfid/4538838d11.pdf.
United Nations Press. 2010. “General assembly adopts resolution recognizing access to clean water, sanitation as human right, by recorded vote of 122 in Favour, None against, 41 abstentions.” Accessed May 23, 2023. https://press.un.org/en/2010/ga10967.doc.htm.
US Census Bureau. 2018. “Poverty rates higher, median household income lower in rural counties than in urban areas.” Accessed January 23, 2023. https://www.census.gov/library/stories/2018/12/differences-in-income-growth-across-united-states-counties.html.
US Census Bureau. 2020. “Geography profile for Alabama.” Accessed November 30, 2021. https://data.census.gov/profile?g=040XX00US01.
US Census Bureau. 2021a. “QuickFacts: Alabama.” Accessed July 15, 2021. https://www.census.gov/quickfacts/fact/table/AL/PST045219.
US Census Bureau. 2021b. “TIGER/Line shapefiles.” Accessed November 30, 2021. https://www.census.gov/cgi-bin/geo/shapefiles/index.php.
US Census Bureau. 2023. “QuickFacts: Alabama.” Accessed March 26, 2024. https://www.census.gov/quickfacts/AL.
US Congress. 2021. H.R.3684—117th Congress (2021–2022): Infrastructure investment and jobs act. Washington, DC: US Congress.
USDA. 2023. “Rural decentralized water systems (DWS) grant program.” Accessed March 3, 2023. https://www.rd.usda.gov/programs-services/water-environmental-programs/rural-decentralized-water-systems-grant-program.
US Department of Health and Human Services. 2021. “Low income household water assistance program (LIHWAP).” Accessed November 26, 2021. https://www.acf.hhs.gov/ocs/programs/lihwap.
USEPA. 1997. “Combined sewer overflows-guidance for financial capability assessment and schedule development.” Accessed June 4, 2023. https://www.epa.gov/sites/default/files/2015-10/documents/csofc.pdf.
USEPA. 1998. Federation registion. Washington, DC: USEPA.
USEPA. 2005. “Handbook for managing onsite and clustered (decentralized) wastewater treatment systems: An introduction to management tools and information for implementing EPA’s management guidelines.” Accessed July 15, 2024. https://www.epa.gov/sites/default/files/2015-06/documents/2005_12_20_septics_onsite_handbook_fs.pdf.
USEPA. 2014. “Financial capability assessment framework for municipal clean water act requirements.” Accessed June 4, 2023. https://www.epa.gov/sites/default/files/2015-10/documents/municipal_fca_framework.pdf.
USEPA. 2021. “Report to congress on the prevalence throughout the U.S. of low- and moderate-income households without access to a treatment works and the use by states of assistance under section 603(c)(12) of the federal water pollution control act.” Accessed June 6, 2023. https://www.epa.gov/system/files/documents/2022-01/low-mod-income-without-treatment_report-to-congress.pdf.
USEPA. 2022a. “Financial technical assistance and tools for water infrastructure.” Accessed January 23, 2023. https://www.epa.gov/waterfinancecenter/financial-technical-assistance-and-tools-water-infrastructure#affordability.
USEPA. 2022b. “Financing decentralized wastewater treatment systems (EPA-832-F-22-013).” Accessed June 4, 2023. https://www.epa.gov/system/files/documents/2022-09/Financing Decentralized Treatment Fact Sheet.pdf.
USEPA. 2022c. “Proposed 2022 Clean Water Act financial capability assessment guidance.” Accessed January 23, 2023. https://www.epa.gov/system/files/documents/2022-02/2022-proposed-fca_feb-2022.pdf.
USEPA. 2022d. “Small drinking water system variances.” Accessed January 23, 2023. https://www.epa.gov/sdwa/small-drinking-water-system-variances.
USEPA. 2022e. “Why maintain your septic system.” Accessed January 22, 2023. https://www.epa.gov/septic/why-maintain-your-septic-system.
USEPA. 2023a. “EPA announces financial capability guidance to support communities and ensure clean, affordable water.” Accessed March 16, 2023. https://www.epa.gov/newsreleases/epa-announces-financial-capability-guidance-support-communities-and-ensure-clean.
USEPA. 2023b. “Clean water state revolving fund (CWSRF): Decentralized wastewater treatment.” Accessed May 26, 2023. https://www.epa.gov/cwsrf/clean-water-state-revolving-fund-cwsrf-decentralized-wastewater-treatment.
USEPA. 2023c. “Start saving.” Accessed April 10, 2024. https://www.epa.gov/watersense/start-saving.
USEPA Science Advisory Board. 1998. SAB advisory on the national-level affordability criteria and technologies for small systems under the 1996 amendments to the Safe Drinking Water Act. Washington, DC: USEPA.
USGS. 2015. “Water use data for Alabama.” Accessed July 15, 2021. https://waterdata.usgs.gov/al/nwis/water_use/.
USGS. 2018. “Dictionary of water terms.” Accessed July 15, 2021. https://www.usgs.gov/special-topic/water-science-school/science/dictionary-water-terms?qt-science_center_objects=0#S.
Van Abs, D. J., T. Evans, and K. Irby. 2022. “Assessing statewide water utility affordability at the census tract scale.” AWWA Water Sci. 4 (3): e1287. https://doi.org/10.1002/AWS2.1287.
WEF (Water Environment Federation). 2022. Affordability of wastewater service. Alexandria, VA: WEF.
Wescoat, J. L., L. Headington, and R. Theobald. 2007. “Water and poverty in the United States.” Geoforum 38 (5): 801–814. https://doi.org/10.1016/J.GEOFORUM.2006.08.007.
Information & Authors
Information
Published In

Journal of Water Resources Planning and Management
Volume 150 • Issue 10 • October 2024
Copyright
This work is made available under the terms of the Creative Commons Attribution 4.0 International license, https://creativecommons.org/licenses/by/4.0/.
History
Received: Jun 26, 2023
Accepted: May 3, 2024
Published online: Jul 29, 2024
Published in print: Oct 1, 2024
Discussion open until: Dec 29, 2024
ASCE Technical Topics:
- Benefit cost ratios
- Business management
- Ecosystems
- Environmental engineering
- Financial management
- Infrastructure
- Lifeline systems
- Municipal wastewater
- Practice and Profession
- Sewers
- Utilities
- Wastewater management
- Wastewater treatment
- Water and water resources
- Water management
- Water reclamation
- Water supply
- Water treatment
- Water use
Authors
Metrics & Citations
Metrics
Citations
Download citation
If you have the appropriate software installed, you can download article citation data to the citation manager of your choice. Simply select your manager software from the list below and click Download.